The Construction of a Mock-Up Test Building and a Statistical Analysis of the Data Acquired to Evaluate the Power Generation Performance of Photovoltaic Modules †

Abstract
:
1. Introduction
2. Related Work
2.1. Characterization of the Design Elements Used in BIPV Design and Power Generation Performance Analysis
2.2. Reliability Validation of the Data Used for the Power Generation Performance Analysis
2.3. Problem Definition
- (1)
- Problems exist such as the inaccuracy of power generation performance analysis and insufficient analysis of the interaction between different design elements. Moreover, the simulation and experimental demonstration adopted for the analysis are performed in a limited range of the design element values. As such, they do not provide an accurate basis for decision-making about the applicability and associated design of BIPV systems at the decision-making stage.
- (2)
- The validity of the data acquired from experiments and used for the analysis of power generation performance has not been examined.
- (3)
- An impact analysis of the design elements (module type, installation direction, and installation angle) that affect the power generation performance of the BIPV system has not been performed quantitatively; consequently, BIPV systems are not designed to maximize solar power performance.
3. The Design and Construction of a Mock-Up Test Building for BIPV Systems
3.1. The Preliminary Performance Test of PV Modules in the Laboratory
3.2. Design and Construction of a Mock-Up Test Building
3.3. Measurement System Setup for Power Generation Data and Environmental Conditions Acquisition
4. Statistical Analysis of the Operational Data Acquired from the BIPV Mock-Up
4.1. Validation of Acquired Data Via Statistical Methods
4.2. Comparison of Two Models for Solar Insolation Effect on PV Power Generation Performance
4.3. Analysis of the Correlation between the Solar Insolation and Electric Power Generation for Different Design Elements
4.4. Analysis of the Effect of Design Elements on Power Generation Performance
5. Conclusions
- (1)
- The constructed BIPV mock-up test building can cover a set of design element values, including from different module types (c-Si and a-Si), installation angles (90°, 75°, 30°, 15°, and 3°), and installation directions (west, southwest, south, southeast, and east). The architecture can accommodate future advanced designs for PV modules.
- (2)
- A large DB was generated by collecting the power generation and solar insolation data together with the associated environmental data for one year through the monitoring system built in the mock-up. The reliability of the acquired data was found to have normality, independence, and even distribution, with a significant p-value higher than 0.05 within a confidence interval of 95% from the analysis using Minitab.
- (3)
- The influence coefficient that linearly relates the solar insolation to power generation performance was estimated from the data measured by the correlation analysis. The influence coefficient values of the c-Si modules were 2.5 times larger than those of the thin-film a-Si modules.
- (4)
- The effects of the design elements on the annual cumulative power generation were analyzed. The two-dimensional (2D) contour plots with depths expressing the generated power and the axes defined by the pair of installation directions and angles were obtained. The plots for the cases of the c-Si and a-Si modules have similar patterns and show that the highest performance is concentrated around south, 30° in both cases. However, these plots have a few distinctions: (1) The performance of the c-Si case is almost twice that of the a-Si case; (2) the region of the highest power generation performance for the a-Si case is narrower than that of the c-Si case; and (3) the power generation performance decreases rapidly as the direction and angle approach west, 90° and east, 90° for the c-Si and a-Si cases, respectively.
- (5)
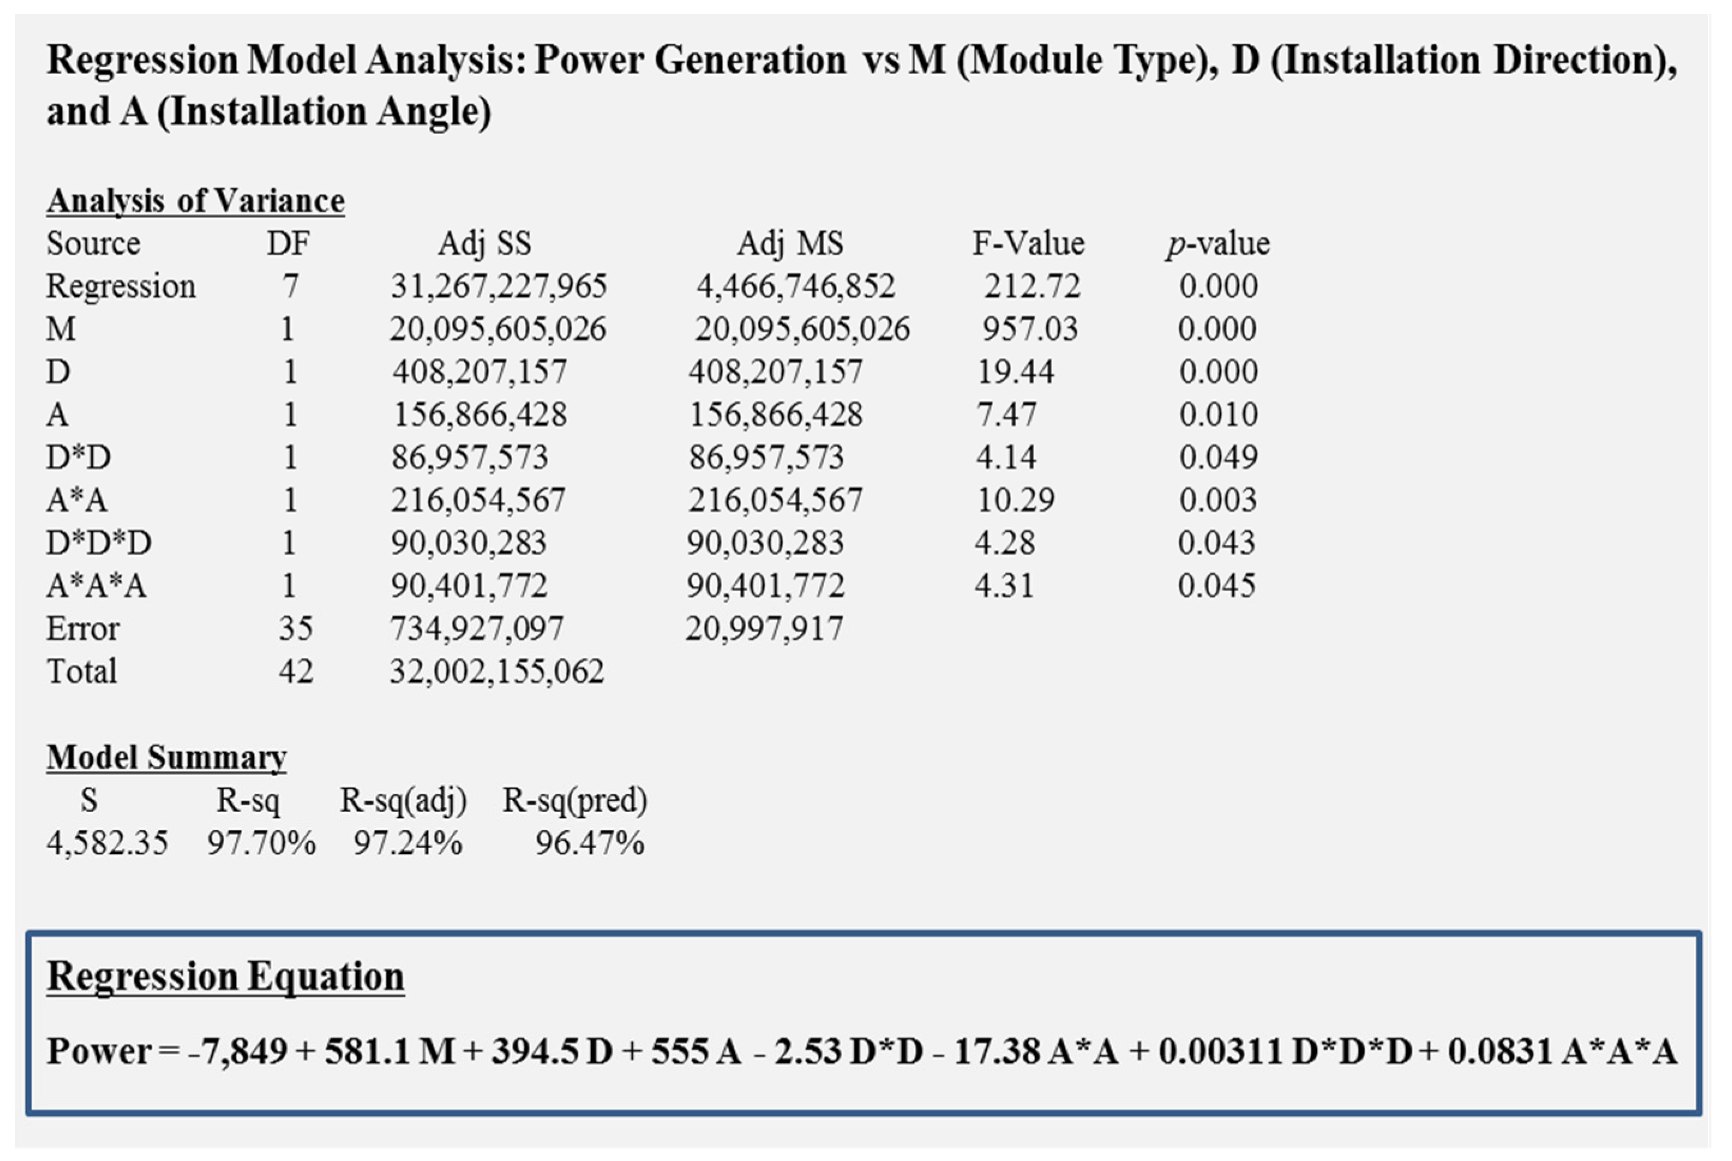
- After the design elements were found to independently affect the performance using the interaction plot analysis of Minitab, a regression model equation for the performance was derived. The modeling error (normalized sum of squared errors) was less than 1% and thus appeared to be acceptable.
Author Contributions
Funding
Conflicts of Interest
References
- International Energy Outlook; U.S. Energy Information Administration: Washington, DC, USA, 2016; pp. 7–10.
- Raugei, M.; Frankl, P. Life cycle impacts and costs of photovoltaic systems: Current state of the art and future outlooks. Energy 2009, 34, 392–399. [Google Scholar] [CrossRef]
- Biyik, E.; Araz, M.; Hepbasli, A.; Shahrestani, M.; Yao, R.; Shao, L.; Essah, E.; Oliveira, A.C.; Cano, T.; Rico, E. A Key review of building integrated photovoltaic (BIPV) systems. Eng. Sci. Technol. Int. J. 2017, 20, 833–858. [Google Scholar] [CrossRef]
- International Energy Agency. PVPS, Snapshot of Global Photovoltaic Markets; International Energy Agency: Paris, France, 2019. [Google Scholar]
- International Energy Agency. PVPS, Tracking Clean Energy; International Energy Agency: Paris, France, 2017. [Google Scholar]
- Banemann, J.; Chehab, O.; Schaar-Gabriel, E. Building-integrated PV modules. Sol. Energy Mater. Sol. Cells 2001, 67, 345–354. [Google Scholar] [CrossRef]
- Serra, R.; Leal, R. Architectural integration of solar cells. In Practical Handbook of Photovoltaics: Fundamentals and Applications; Markvart, T., Castaner, L., Eds.; Elsevier Science Ltd.: Oxford, UK, 2003; pp. 725–748. [Google Scholar]
- Hatice, S.; Mahjoub, E. Critical factor in reducing the cost of building integrated photovoltaic (BIPV) systems. Archit. Sci. Rev. 2011, 50, 115–121. [Google Scholar]
- Kratochvil, J.A.; Boyson, W.E.; King, D.L. Photovoltaic Array Performance Model; Sandia National Laboratories: Albuquerque, NM, USA, 2004. [Google Scholar]
- Ibrahim, H.; Anani, N. Variations of PV module parameters with irradiance and temperature. Energy Procedia 2017, 134, 276–285. [Google Scholar] [CrossRef]
- Lee, S.-Y.; Lee, A.-Y. A study on BIPV design process based on the BIM for architects. J. Archit. Inst. Korea Plan. Des. 2017, 33, 49–57. [Google Scholar] [CrossRef]
- Zhaoyu, W.; Qian, A.; Da, X.; Chuanwen, J. A research on shading and LCOE of building integrated photovoltaic. In Proceedings of the 2011 APPEEC, Wuhan, China, 25–28 March 2011; pp. 1–4. [Google Scholar] [CrossRef]
- Golestaneh, F.; Pinson, P.; Gooi, H. Very short-term nonparametric probabilistic forecasting of renewable energy generation with application to solar energy. IEEE Trans. Power Syst. 2016, 31, 3850–3863. [Google Scholar] [CrossRef] [Green Version]
- Inman, R.H.; Pedro, H.T.; Coimbra, C.F. Solar forecasting methods for renewable energy integration. Prog. Energy Combust. Sci. 2013, 39, 535–576. [Google Scholar] [CrossRef]
- Antonanzas, J.; Osorio, N.; Escobar, R.; Urraca, R.; de Pison, F.M.; Antonanzas-Torres, F. Review of photovoltaic power forecasting. Sol. Energy 2016, 136, 78–111. [Google Scholar] [CrossRef]
- Chaieb, H.; Sakly, A. A navel MPPT method for photovoltaic application under partial shaded conditions. Sol. Energy 2018, 159, 291–299. [Google Scholar] [CrossRef]
- Liangliang, S.; Lin, L.; Hongxing, Y. Optimum design of shading-type building-integrated photovoltaic claddings with different surface azimuth angles. Appl. Energy 2012, 90, 233–240. [Google Scholar]
- Eiffert, P. Guidelines for the Economic Evaluation of Building Integrated Photovoltaic Power Systems; NREL, TP-550-31977; National Renewable Energy Lab.: Golden, CO, USA, 2003. [Google Scholar]
- Montgomery, D.C. Introduction to Statistical Quality Control, 4th ed.; John Wiley and Sons: Hoboken, NJ, USA, 2004. [Google Scholar]
- Lee, S.-J.; Kim, K.-J.; Kim, D.-S.; Ryu, E.-H.; Choi, J.-J. Analysis of relation between power generation performance for design elements of BIPV system through mock-up demonstration. In Proceedings of the 2018 IEEE 7th World Conference on Photovoltaic Energy Conversion (WCPEC) (A Joint Conference of 45th IEEE PVSC, 28th PVSEC & 34th EU PVSEC), Waikoloa Village, HI, USA, 10–15 June 2018; pp. 590–595. [Google Scholar]
- Rezk, H.; Tyukhov, I.; Al-Dhaifallah, M.; Tikhonov, A. Performance of data acquisition system for monitoring PV system parameters. Measurement 2017, 104, 204–211. [Google Scholar] [CrossRef]
- Kim, D.-S.; Shin, U.-C.; Yoon, J.-H. Annual energy yield prediction of building added PV system depending on the installation angle and the location in Korea. KIEAE J. 2014, 14, 67–74. [Google Scholar] [CrossRef]
- Paul, D.; Mandal, S.N.; Mukherjee, D.; Chaudhuri, S.B. Optimization of significant insolation distribution parameters–A new approach towards BIPV system design. Renew. Energy 2010, 35, 2182–2191. [Google Scholar] [CrossRef]
- Minitab. Minitab User’s Guide-2: Data Analysis and Quality Tools; Minitab: Redmond, WA, USA, 2000. [Google Scholar]
- Salem, T.; Kinab, E. Analysis of building-integrated photovoltaic systems: A case study of commercial buildings under mediterranean climate. Procedia Eng. 2015, 118, 538–545. [Google Scholar] [CrossRef] [Green Version]
- Bloem, J.J.; Lodi, C.; Cipriano, J.; Chemisana, D. An outdoor test reference environment for double skin applications of building integrated photovoltaic systems. Energy Build. 2012, 50, 63–73. [Google Scholar] [CrossRef]
- Rebecca, J.Y.; Patrick, W.Z. Building integrated photovoltaics (BIPV): Costs, benefits, risks, barriers, and improvement strategy. Int. J. Constr. Manag. 2015, 16, 39–53. [Google Scholar]
- Bonomo, P.; Frontini, F.; Berardinis, P.D.; Donsante, I. BIPV: Building envelop solutions in a multi-criteria approach. A method for assessing life-cycle cost in the early design phase. Adv. Build. Energy Res. 2017, 11, 104–129. [Google Scholar] [CrossRef]
- International Electro-Technical Commission. IEC 61215, Crystalline Silicon Terrestrial Photovoltaic (PV) Module-Design Qualification and Type Approval; International Electro-Technical Commission: Geneva, Switzerland, 2005. [Google Scholar]
- International Electro-Technical Commission. IEC 61646, Thin-Film Terrestrial Photovoltaic (PV) Module-Design Qualification and Type Approval; International Electro-Technical Commission: Geneva, Switzerland, 2008. [Google Scholar]
- Hosmer, D.W.; Lemeshow, S. Applied Logistic Regression, 2nd ed.; John Wiley and Sons: Hoboken, NJ, USA, 2000. [Google Scholar]
- Hall, M.A. Correlation-based feature selection for discrete and numeric class machine learning. In Proceedings of the 7th International Conference on Machine Learning, San Francisco, CA, USA, 5 June 2000. [Google Scholar]
- Krzywinski, M.; Altman, N. Significance, P values and t-tests. Nat. Methods 2013, 10, 1041–1042. [Google Scholar] [CrossRef] [PubMed] [Green Version]
- Fredrik, A.L.; Jerry, G.F.; Edward, L.B. Application of the superposition principle to solar-cell analysis. IEEE Trans. Electron Devices 1979, 26, 165–171. [Google Scholar]


| Classification | c-Si Module | a-Si Module |
|---|---|---|
| Type | Glass to Glass | Glass to Glass |
| Size | 1100 × 1300 mm | 1100 × 1300 mm |
| Transmittance | 10% | 10% |
| Power | 161 W | 82 W |
| Cell Block Diagram | 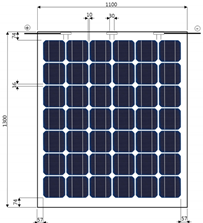 | 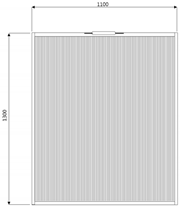 |
| (a) c-Si. | ||||||
|---|---|---|---|---|---|---|
| Insolation [W/m2] | Pm [W] | Isc [A] | Voc [V] | Vpm [V] | Imp [A] | FF |
| 200 | 30.95 | 1.62 | 24.02 | 20.37 | 1.52 | 0.80 |
| 400 | 64.11 | 3.23 | 25.07 | 20.89 | 3.07 | 0.79 |
| 600 | 96.89 | 4.84 | 25.59 | 20.97 | 4.62 | 0.78 |
| 800 | 128.97 | 6.45 | 25.95 | 20.94 | 6.16 | 0.77 |
| 1000 | 160.21 | 8.05 | 26.21 | 20.83 | 7.69 | 0.76 |
| (b) a-Si. | ||||||
| Insolation [W/m2] | Pm [W] | Isc [A] | Voc [V] | Vpm [V] | Imp [A] | FF |
| 200 | 10.71 | 0.28 | 94.36 | 58.02 | 0.18 | 0.41 |
| 400 | 28.13 | 0.55 | 112.43 | 74.96 | 0.38 | 0.46 |
| 600 | 45.87 | 0.80 | 119.02 | 80.30 | 0.57 | 0.48 |
| 800 | 63.84 | 1.06 | 123.40 | 83.10 | 0.77 | 0.49 |
| 1000 | 81.61 | 1.31 | 126.48 | 84.32 | 0.97 | 0.49 |
| Design Factors | Values | |
|---|---|---|
| Construction Size | Floor area 238 m2 | |
| Architectural | Integration | Curtain wall type |
| Directions | West, southwest, south, southeast, east | |
| Angles | 90°, 75°, 30°, 15°, 3° | |
| Electrical | Power generation, power consumption, etc. | |
| Environmental | Solar radiation, temperature, etc. | |
| Monitoring Method | Maximum power point tracking (MPPT) method using an electronic load | |
| Measurement Item | Equipment (Manufacturer) | Specifications |
|---|---|---|
| Irradiance | SMP11 (Kipp and Zonen) | Classification to ISO 9060: Secondary standard Spectral range: from 285 nm to 3000 nm Output range: from −200 to 2000 W/m2 Temperature dependence of sensitivity: <1% |
| Temperature | T-type thermocouple | Temperature range: from −270 °C to 370 °C Accuracy: ±1.0 °C |
| Data logger | GL840 (Graphtec) | Input voltage range: from 20 mV to 100 V Accuracy: ±1.0% voltage, ±1.55 °C temperature |
| c-Si/a-Si Predicted/Measured | c-Si | a-Si | |||
|---|---|---|---|---|---|
| Insolation [W/m2] | Pred. | Meas. | Pred. | Meas. | |
| 200 | 32.65 | 30.95 | 15.20 | 10.71 | |
| 400 | 65.14 | 64.11 | 30.76 | 28.13 | |
| 600 | 97.26 | 96.89 | 47.00 | 45.87 | |
| 800 | 128.95 | 128.97 | 63.99 | 63.84 | |
| 1000 | 160.18 | 160.21 | 81.79 | 81.61 | |
| Module Type | Angle | 3° | 15° | 30° | 75° | 90° |
|---|---|---|---|---|---|---|
| Direction | ||||||
| c-Si | West | 0.132 | 0.139 | 0.134 | 0.123 | 0.129 |
| a-Si | 0.070 | 0.081 | 0.080 | 0.051 | 0.050 | |
| c-Si | Southwest | 0.142 | 0.145 | 0.140 | 0.147 | 0.147 |
| a-Si | 0.076 | 0.065 | 0.081 | 0.075 | 0.062 | |
| c-Si | South | 0.128 | 0.140 | 0.146 | 0.144 | 0.137 |
| a-Si | 0.081 | 0.064 | 0.085 | 0.063 | 0.060 | |
| c-Si | Southeast | 0.140 | 0.142 | 0.145 | 0.133 | 0.129 |
| a-Si | 0.050 | 0.069 | 0.079 | 0.057 | 0.061 | |
| c-Si | East | 0.140 | 0.144 | 0.139 | 0.138 | 0.138 |
| a-Si | 0.089 | 0.060 | 0.081 | 0.058 | 0.048 |
| Module Type | Angle | 3° | 15° | 30° | 75° | 90° |
|---|---|---|---|---|---|---|
| Direction | ||||||
| c-Si | West | 86.9 | 85.7 | 89.3 | 53.2 | 49.1 |
| a-Si | 44.3 | 47.3 | 49.7 | 38.8 | 28.8 | |
| c-Si | Southwest | 92.1 | 99.5 | 100.8 | 77.8 | 64.8 |
| a-Si | 45.9 | 46.2 | 50.9 | 40.8 | 33.6 | |
| c-Si | South | 84.6 | 100.3 | 103.6 | 77.1 | 50.1 |
| a-Si | 49.5 | 51.9 | 57.1 | 36.4 | 32.3 | |
| c-Si | Southeast | 95.8 | 100.2 | 104.2 | 78.7 | 64.5 |
| a-Si | 38.6 | 51.5 | 52.0 | 31.3 | 32.6 | |
| c-Si | East | 89.8 | 91.5 | 92.6 | 60.2 | 64.8 |
| a-Si | 36.1 | 46.3 | 46.8 | 34.2 | 31.2 |
| BIPV Module Type | Installation Direction | Installation Angle | |||
|---|---|---|---|---|---|
| c-Si or a-Si | Dimensionless Value for Pm | Physical Direction | Dimensionless Value for Di | Physical Angle (°) | Dimensionless Value for Ai |
| 161 W (c-Si) | 161 | West | 0 | 3° | 3 |
| Southwest | 45 | 15° | 15 | ||
| South | 90 | 30° | 30 | ||
| 82 W (a-Si) | 82 | Southeast | 135 | 75° | 75 |
| East | 180 | 90° | 90 | ||
| BIPV Module Type | Selected Installation Direction | Selected Installation Angle | Annual Generated Power [kWh] | Normalized Error | Normalized Sum of Squared Errors | ||||
|---|---|---|---|---|---|---|---|---|---|
| Pm | Direction | Di | Ai | Measured | Calculated | (%) | (%) | (%) | |
| c-Si | 161 | West | 0 | 3 | 86.95 | 87.22 | 0.31 | 0.02 | 0.04 |
| South | 90 | 15 | 106.29 | 107.68 | 1.31 | ||||
| Southwest | 45 | 30 | 100.82 | 101.87 | 1.04 | ||||
| Southeast | 135 | 75 | 78.69 | 79.43 | 0.94 | ||||
| East | 180 | 90 | 64.77 | 62.64 | −3.30 | ||||
| a-Si | 82 | Southwest | 45 | 3 | 52.60 | 54.22 | 3.09 | 0.12 | |
| West | 0 | 15 | 46.08 | 44.50 | −3.44 | ||||
| South | 90 | 30 | 58.10 | 60.33 | 3.84 | ||||
| Southeast | 135 | 75 | 32.57 | 33.52 | 2.92 | ||||
| West | 0 | 90 | 9.33 | 9.55 | 2.39 | ||||
© 2020 by the authors. Licensee MDPI, Basel, Switzerland. This article is an open access article distributed under the terms and conditions of the Creative Commons Attribution (CC BY) license (http://creativecommons.org/licenses/by/4.0/).
Share and Cite
Lee, S.-J.; Kim, K.-J.; Kim, D.-S.; Ryu, E.-H.; Lee, J. The Construction of a Mock-Up Test Building and a Statistical Analysis of the Data Acquired to Evaluate the Power Generation Performance of Photovoltaic Modules. Energies 2020, 13, 1546. https://doi.org/10.3390/en13071546
Lee S-J, Kim K-J, Kim D-S, Ryu E-H, Lee J. The Construction of a Mock-Up Test Building and a Statistical Analysis of the Data Acquired to Evaluate the Power Generation Performance of Photovoltaic Modules. Energies. 2020; 13(7):1546. https://doi.org/10.3390/en13071546
Chicago/Turabian StyleLee, Seung-Joon, Kyu-Jin Kim, Da-Sol Kim, Eui-Hwan Ryu, and Jae Lee. 2020. "The Construction of a Mock-Up Test Building and a Statistical Analysis of the Data Acquired to Evaluate the Power Generation Performance of Photovoltaic Modules" Energies 13, no. 7: 1546. https://doi.org/10.3390/en13071546