Article

Thermal Response Characteristics of Intermittently Cooled Room with Tube-Embedded Cooling Slab and Optimization of Intermittent Control †

1
School of Civil Engineering, Chang’an University, Xi’an 710061, China
2
Lyles School of Civil Engineering, Purdue University, West Lafayette, IN 47907, USA
*
Author to whom correspondence should be addressed.
This paper is an extended version of our paper published in the 10th International Symposium on Heating, Ventilation and Air Conditioning Conference, ISHVAC 2017, Jinan, China, 19–22 October 2017; pp. 2639–2646.
Energies 2020, 13(7), 1568; https://doi.org/10.3390/en13071568
Submission received: 3 March 2020 / Revised: 23 March 2020 / Accepted: 25 March 2020 / Published: 29 March 2020
(This article belongs to the Section B: Energy and Environment)

Abstract

:
The heat storage effect of the tube-embedded slab cooling system (TESCS) makes the intermittent operation feasible, a reasonable intermittent strategy can fully realize the energy saving effect. This paper purposes to optimize the intermittent control schemes for TESCS by simulation. The response of the thermal environment intermittently cooled by TESCS is firstly studied. Then, the intermittent control schemes of TESCS are studied. On the basis of the dual-objective optimization for thermal comfort and energy efficiency, the optimal scheme is established. The results show that the tube-embedded slab has significant heat storage and release characteristics under intermittent cooling condition. Its maximum cooling capacity appears about one hour after the stop of cooling. Reducing the cooling duration can reduce the system energy consumption, but increasing the cooling duration can reduce the system peak load. Twenty-four-hour cooling can reduce the peak load by about 70%, 67%, and 41%, respectively, compared with 6-h, 8-h, and 12-h cooling. The effect of the cooling duration on the thermal comfort and energy efficiency is much greater than the cooling time distribution. Frequent starts and stops of the pump can increase the cooling capacity obtained by the room to a certain extent. Daytime cooling provides higher comfort and energy efficiency while night cooling can reduce the chiller’s peak cooling requirement by about 25%.

1. Introduction

According to statistics from the International Energy Agency in 2017, the global building sector accounts for over 30% of the total final energy consumption and one-third of global CO2 emissions [1]. Consequently, there is a great potential for energy use reduction in the building sector. Significant efforts are underway to develop sustainable buildings which aim to minimize the negative human impacts on the natural surroundings, materials, resources, and processes that prevail in nature. The users of sustainable buildings place higher demands on heating and cooling systems. Indoor comfort and energy efficiency are two key points of concern for users of sustainable buildings [2,3]. The radiant cooling system is a promising solution for building cooling systems in energy efficient buildings. The radiant cooling system uses a heat transfer fluid, normally water, to exchange heat mainly by radiation and convection within the conditioned space [4,5,6]. Compared to all-air systems, radiant cooling systems have the following advantages: (1) reducing the indoor vertical temperature gradient, thereby increasing the thermal comfort [7]; (2) reducing the discomfort caused by draft, due to the smaller air supply volume required [8,9]; (3) reducing system energy consumption because of the reduced sensing temperature of the human body [5,10]; (4) reducing transport energy consumption because of less air supply volume [11,12,13,14]; (5) reducing energy consumption of cooling transport because water with a much higher thermal capacity than air is used for energy delivery [5]; (6) a higher supply temperature of chilled water for radiant cooling systems increases the heat pump or chiller’s efficiency, which leads to a significant reduction in primary energy consumption [15,16]; (7) higher supply temperature of chilled water allows the possible use of renewable energy sources such as ground source heat pumps, free cooling, ground source heat exchangers, and aquifers [17,18]; and (8) the noise caused by high air velocity is decreased because of the sizes of ducts, due to the reduction of the air supply volume [19].
Depending on the position of the piping in the building, the radiant cooling system is usually classified into three main types [6,16]: (1) a radiant panel system (Figure 1a), which uses light-weight panels such as plaster boards or metal panels with integrated pipes mounted on the inner wall or ceiling of space [6,20]; (2) an embedded surface system (Figure 1b), in which cooling pipes are embedded in the surface layer of the slab/wall but are insulated from the main building structure [6,21]; (3) a thermally activated building system (TABS) (Figure 1c), which integrates cooling pipes in the main building structure (slab/wall) [6,21].
For TABS, the water tubes are commonly used and embedded in the concrete floor or ceiling. This paper mainly focuses on the tube-embedded slab cooling system (TESCS). The great feature of this type of radiant system is the thermal coupling of the emitting element (e.g., pipe coil) with the main building structure (concrete slab or wall) [22]. The storage and delivery of the cooling capacity are formed inside the concrete building envelopes and building’s thermal mass realizes the thermal activation, due to the cooling supply from embedded water tubes. Through the radiation and convection heat transfer of inner surface of the activated envelope with indoor thermal environment, the control of indoor thermal environment is achieved.
Compared to the radiant panel system and the embedded surface system, TESCS has the following unique advantages: (1) the thermal storage effect of a tube-embedded concrete slab can reduce the peak cooling load of a building, thus reducing installed capacity of chillers [23,24,25]; (2) the thermal inertness of a concrete slab and other passive envelopes makes indoor temperature fluctuate less, which greatly improves the thermal comfort of the human body [26,27]. However, the large thermal inertia of a concrete slab makes the cooling system respond slowly to operational changes/regulations [16,28]. The regulation of water supply temperature and flow cannot be quickly reflected on the indoor air temperature. This characteristic of a cooling delay makes the system control complicated and difficult [29]. Therefore, the operation and control strategy of TESCS is determined by using rational choice in the application and popularization of this system. To address the challenge of the control of TESCS with a dynamic nature and large thermal inertia, much research has been conducted to design and optimize control strategies with different conditions [30,31,32,33,34,35,36,37,38,39]. Accordingly, the operation control mode of the slab radiant cooling system can be grouped into a continuous operation regulation and an intermittent operation regulation [30]. The continuous operation regulation mainly includes the supply water temperature control [31], the supply water flow control [31], and the on/off control [30]. These types of control can also be used by the intermittent operation. In practical applications, the supply water temperature control and the variable water flow control are the most common continuous operation controls. As reported by J.H. Lim’s team, for a slab radiant system, it is easier to control the indoor air temperature by regulating the water supply temperature than regulating the water flow rate [31]. For the water temperature control, the most common controlling parameters are the outdoor air temperature with or without the indoor air temperature feedback [32,33]. Some other researchers suggested to use the slab surface temperature as a feedback parameter for higher energy efficiency and better local thermal comfort [29,34]. The on/off control is a very simple control that does not integrate information regarding the dynamics of the system. This control usually uses a controlled parameter, usually indoor air temperature, to set “on’’ or “off’’ to pumps [30]. According to the literature available, the intermittent operation can achieve an improved heat transfer, a shorter operation time, and a more effective peak load shifting than the continuous operation [35,36]. How and what is the best control strategy for TESCS has attracted a lot of research interest in recent years [16,30].
The tube-embedded concrete slab can be regarded as a cooling source and also a large cold-storage facility. Its thermal storage and delay characteristics enable the intermittent operation to enhance energy savings and thermal comfort. Therefore, the intermittent control is more advantageous than other control schemes for TESCS. Much of the literature emphasizes the shortened operational time of the system and the energy savings of the intermittent operation [25,35,37,38]. Rijksen et al. [25] studied the intermittent operation control for an office building in the Netherlands, by simulation in TRNSYS. The intermittent control strategy in their research is based on the average room temperature in combination with switching times. The cooling of the TABS was switched on outside working time periods from 6 p.m. until 6 a.m. During the weekends, the cooling system was switched off until Sunday at 3 p.m. During working hours, only the mechanical air supply system for the fresh air supply and humidity control was operated. The results showed that this intermittent control method, using nighttime cooling, could reduce the required cooling capacity of a chiller by one half. Olesen et al. [35] also conducted case studies for office buildings in Würzburg, in Germany, by using TRNSYS and a parametric study of different control strategies including the intermittent operation and the typical water supply temperature control. They proposed a time period for the intermittent operation, which can greatly affect the energy efficiency of the system. Gwerder et al. [37] proposed an intermittent operation control by using pulse width modulation (PWM) based on the first order Resistant and Capacitance (RC) model. It can automatically switch the heating and cooling mode according to the thermal comfort standard in the laboratory. In order to obtain energy consumption/savings, the research team then used TRNSYS to analyze the energy savings of a building in Zurich, due to this control method [38]. Their results showed that the intermittent control can save half of the system energy consumption, compared to the continuous control. However, intermittent operation schemes are sensitive to climatic characteristics, building load characteristics, and building codes and regulations. The specific intermittent operation schemes that were concluded by the researchers mentioned above cannot be blindly applied. Therefore, it is necessary to study the intermittent operation schemes for different climate characteristics, building load, and building thermal characteristics.
Although there is an increasing awareness of the advantages of intermittent cooling in practice, there is a lack of guidelines of how and when to use intermittent cooling, especially in China, so that a few cases of intermittent cooling were implemented. Those cases usually used weather condition judgment and their own operational experience to implement intermittent control. Therefore, the methods used for the intermittent cooling control did not fully achieve the potentials of energy savings.
In order to accurately implement the intermittent control strategy and parameter settings, indoor thermal environment characteristics and its dynamic responsive characteristics must be understood. The dynamic thermal process of an intermittently cooled space by TESCS involves a complex and unsteady heat transfer that is disturbed by internal and external disturbances and the intermittent operation mode. The complexity is reflected by the thermal coupling between the cooling elements and the building structure. Furthermore, there is also a heat storing/releasing process in the intermittent operation mode. Therefore, the dynamic thermal behaviors of the cooling system and indoor space are more complicated than those in the continuous operation mode. The existing literatures mainly focus on the evaluation of the energy saving and thermal comfort that is due to intermittent control, the control algorithm, and its application under the specific conditions [25,35,37,38]. There is a lack of scientific understanding of thermal environmental response characteristics of indoor space and theoretical guidance for the intermittent operation of TESCS. The research in this paper aims to address these needs. We first study the thermal response characteristics of the thermal environment by using intermittently cooled tube-embedded slabs through simulation. On that basis, the intermittent control schemes of TESCS are modeled and optimized. Finally, the optimal intermittent control scheme is established by leveraging the two objectives of system energy efficiency and indoor thermal comfort.

2. Methodology

The study of TESCS first analyzed the dynamic thermal response characteristics of a cooled room under the collective effect of the triple disturbances of internal and external disturbances and the intermittent operation. The dynamic thermal response characteristics of the indoor environment were analyzed by evaluating the response of the indoor air temperature and mean radiant temperature. The dynamic thermal response characteristics of the cooling slab and passive wall were analyzed by evaluating the response of the surface heat flux density. In addition, the dynamic characteristics of the indoor thermal environment that responds to night cooling and daytime were also compared.
Additionally, the researchers also studied the optimal intermittent cooling by considering the change in the duration of cooling and the distribution of time taken for cooling. This research was based upon a cold zone in China. The most ideal control for intermittent cooling is derived from dual-objective optimization to maximize thermal comfort and the efficiency of energy. The first step of the research involved the optimization of the total amount of time taken for cooling. After that, the optimal total duration for cooling was used to ensure that the distribution of the time used for cooling was effectively optimized. Finally, combined with the variable water temperature control, the optimal intermittent operation control scheme was further optimized.
Finally, we extended the optimization study to wider climate zones of China. The optimal intermittent operation schemes of TESCS were identified by using the same method for other climate zones including the severe cold zone, the hot summer and cold winter zone, and the hot summer and warm winter zone of China.

2.1. Simulation Tool

Simulation is useful and cost-effective for studying dynamical thermal behavior and control optimization of buildings and building energy systems. The simulation on the TESCS should be able to integrate the building environment and cooling system simulations. The research in the paper used Transient System Simulation Program (TRNSYS) [39] as the simulation tool. TRNSYS is a transient simulation tool, which integrates all the characteristics of a building and its equipment to provide a detailed study of the thermal behavior of the building. To study TESCS, we used the multi-zone building (TYPE 56 [39]) model to model the multi-zone building and the built-in active layer model for TESCS, which is actually an RC model initially developed by Koschenz and Lehman [40]. The validity and application of the RC model for TESCS can be found in the literatures of Weber et al. [41], Weber and Johannesson [42], and Sourbron et al. [43].

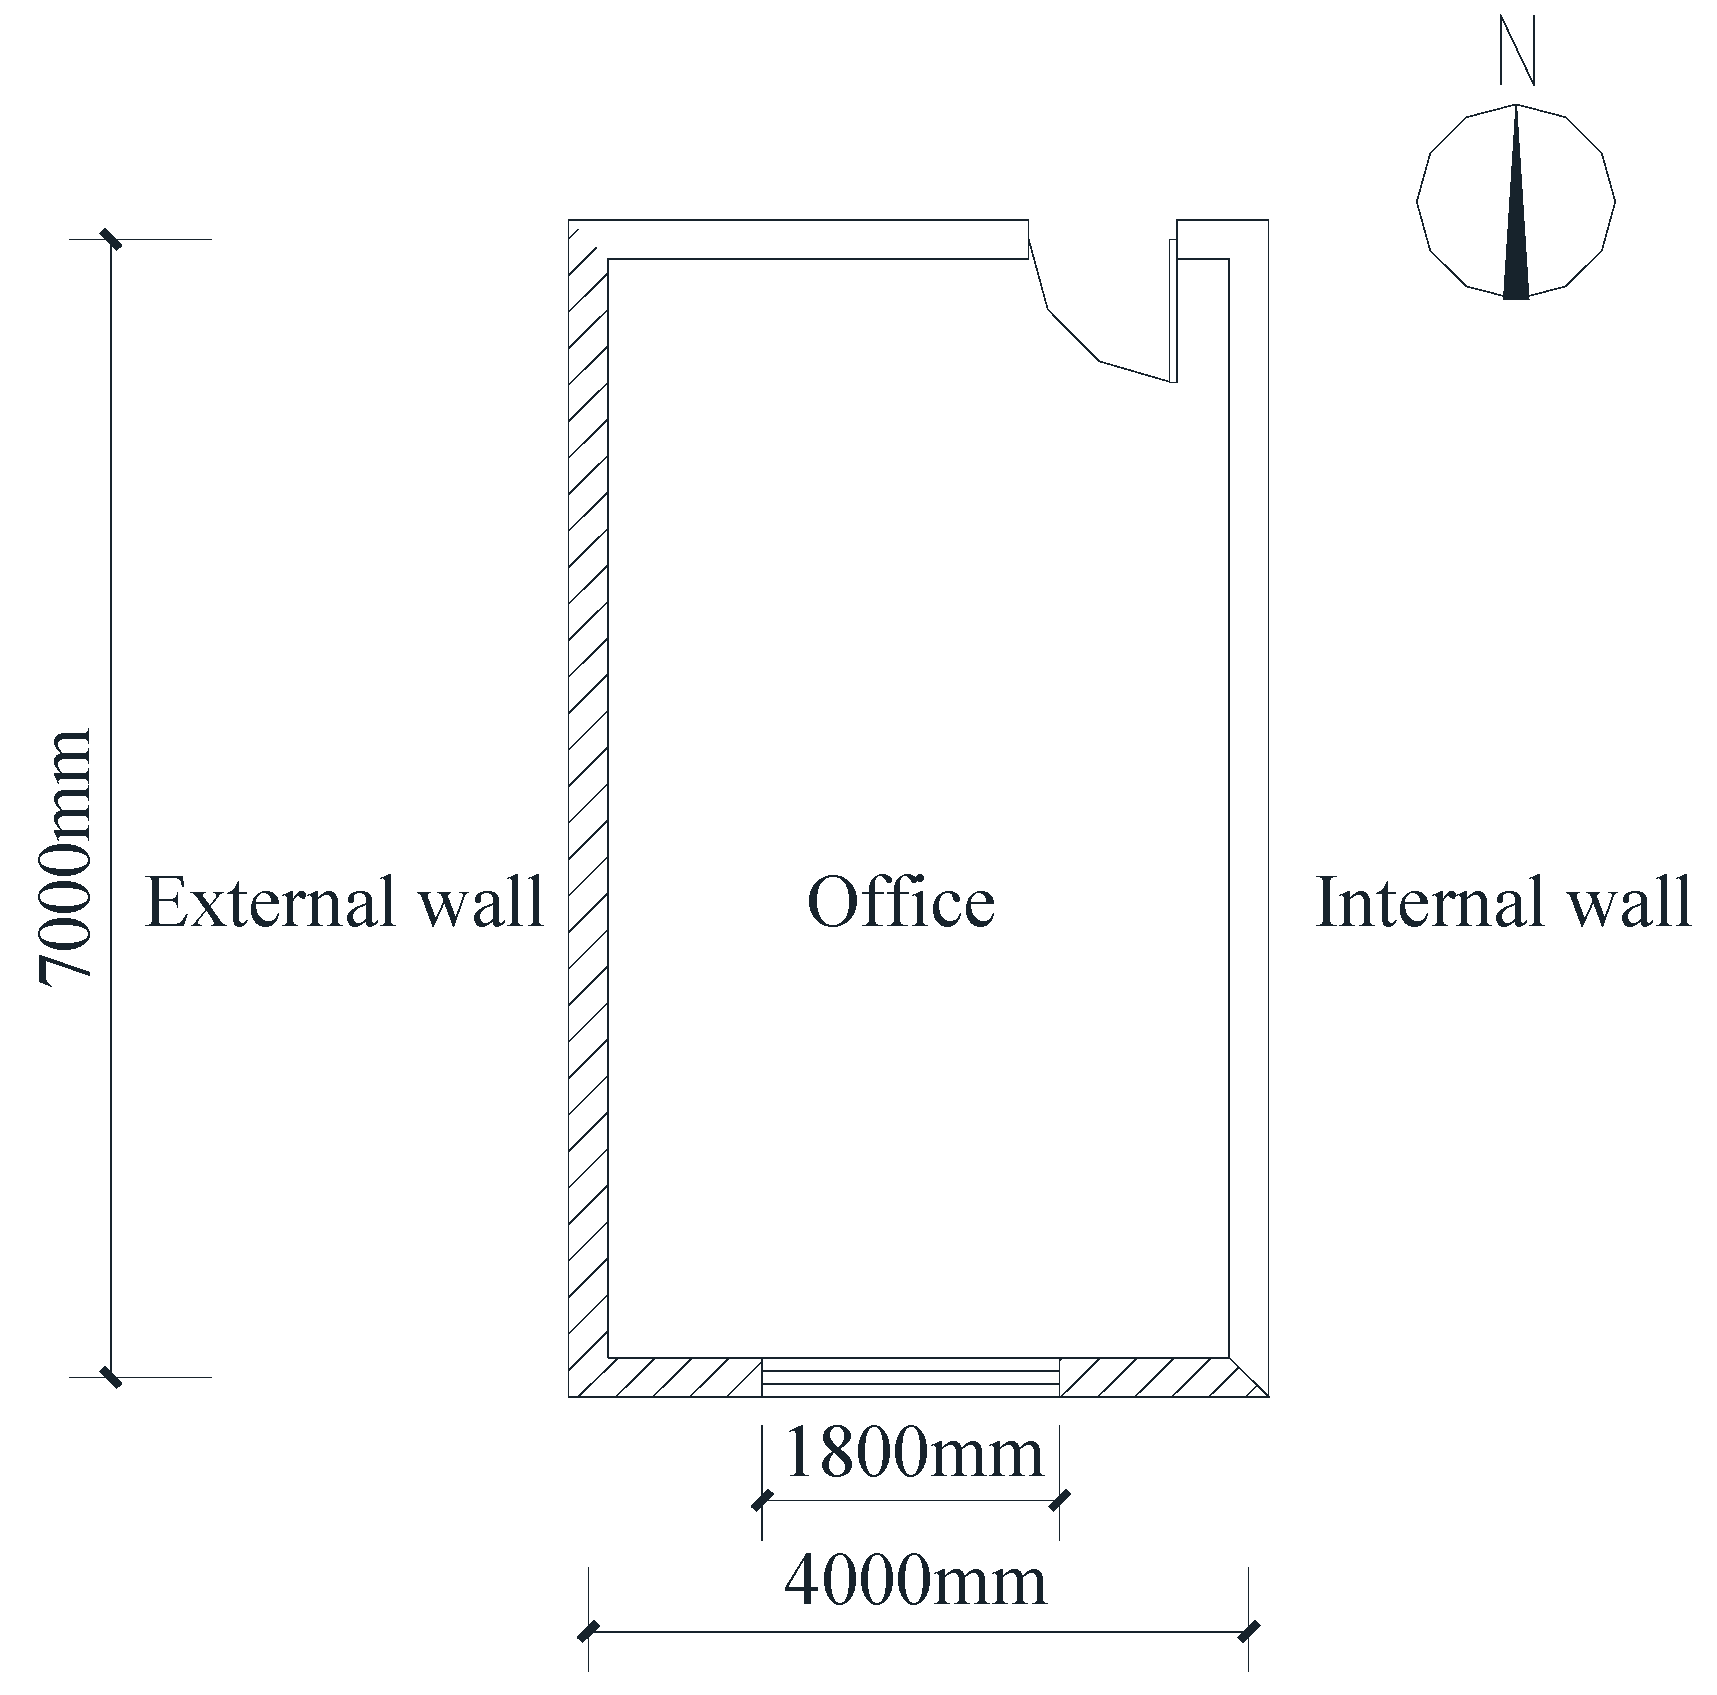
2.2. Building and System Simulation Model

In this study, a typical office block in Xi’an, a typical city representative of a cold zone in China was chosen to be the case study [44]. The studied building has three stories and a shape coefficient smaller than 0.3. All the rooms at the same location on every story were chosen as objects for this research. The floor plan of the room, studied on each floor, is shown in detail in Figure 2. The total area of the room studied is 28 m2 with a height of 4.5 m. Exterior walls are located to its south and west, while interior walls are located east and north. The rooms adjacent to the studied rooms are also air-conditioned. The internal heat gains were considered to include all equipment inside the office, all lighting, as well as people. The rooms are always occupied during working hours, i.e., Monday, Tuesday, Wednesday, Thursday, and Friday, from 8 a.m. to 6 p.m.
The thermal parameters of building envelopes are shown in Table 1. Concrete floors combined with ceiling radiant cooling were used to increase the cooling surface area. The cooling floor or ceiling is mainly composed of a load-bearing structure layer, a leveling layer, a surface layer, and embedded tubes, and a thermal insulation layer is increased in the cooling floor. The structure of the radiant cooling slab is shown in Figure 3. The cooling capacity of the tube-embedded slab is not only related to thermal parameters of envelopes but also to the geometric parameters of embedded tubes. The relevant geometric and thermophysical parameters of embedded-tubes in the concrete slab are shown in Table 2. One of the main factors influencing the cooling capacity of the cooling slab is the surface temperature of the cooling slab. The lower the cooling surface temperature, the greater the cooling capacity. However, in order to prevent condensation on the cooling surface and ensure the thermal comfort requirements of the human body, the temperature of the cooling surface should not be too low. The Chinese design code ‘Technical Specification for Radiant Heating and Cooling’ (JGJ 142-2012) [45] specifies that the lower limit of the mean temperature of cooling floor surface which people often occupy is 19 °C, and the lower limit of the mean temperature of the cooling ceiling surface is 17 °C. Because cooling the surface temperature depends on the water supply and return temperature, the water supply temperature should not be too low. In the simulation, the water supply temperature was set at 19 °C.
For the purpose of maintaining a supply of fresh air from outside to satisfy occupants’ requests for better indoor air quality and to remove excess moisture inside the room to prevent condensation build-up on the cooling surface, a dedicated outdoor air system was also intentionally installed to combine with the system of radiant cooling. Since the primary aim of the outdoor air system is to provide fresh air and dehumidify, and the office staff is the main indoor moisture source, the running time was set to coincide with the working time of the staff. Additionally, the volume of air supplied from outside was 30 m3/h for each person. A cooling dehumidification method was adopted in the outdoor air system, and the temperature of the air supply, which was provided using the dew point air supply method, was 14.7 °C.
The meteorological data in the simulation were based on the TRNSYS METEONORM weather data, where the typical meteorological year (TMY) of Xi’an is available. The data of TMY can represent the local long-term climate characteristics. The cooling period simulated in the study is from 10 June to 10 September and the time step of calculation is 0.5 h.

2.3. Intermittent Control Analysis and Optimization

The water supply temperature was constant and set at 19 °C. In the section about thermal environment response characteristics, the intermittent cooling was operated during 12–8 a.m. for 8 h of the total duration. The thermal environment parameters of the top room on 10 July, a typical summer day, were studied and analyzed.
In the section about the optimization of intermittent cooling schemes, the change in the time duration for cooling and the distribution of time taken for cooling were mainly considered in the setting of the intermittent schemes. Additionally, the effect on indoor thermal comfort and energy consumption by the system with varying cooling durations and varying distributions of cooling time was studied through simulation. The optimal intermittent operation control was identified by achieving the enhanced thermal comfort and energy efficiency.
Regarding the selection of comfort indicators, radiant systems are different from traditional convective systems. The air temperature alone is not an appropriate thermal indicator for radiant systems because the room in a building shows a non-uniform radiant field. The air temperature does not account for the heat loss caused by radiant energy exchange with the walls, windows, or the radiant heating/cooling system. When much heat exchange occurs by radiant energy, the operative temperature is a better index for general thermal comfort. The operative temperature can be said to be the weighted average of the air temperature and the mean radiant temperature. In most practical applications, the indoor air speed is low (<0.2 m/s) and the operating temperature can be approximately equal to the average of the air and mean radiant temperature. For the sizing and dimensioning of the radiant heating and cooling systems, the operative temperature is often chosen as the general thermal comfort index.
Because the radiant cooling system needs to be supplemented with the outdoor air system (a convective system), other factors that affect the thermal comfort of the human body, such as air speed and air humidity, should also be considered. Therefore, another more comprehensive thermal comfort evaluation index, predicted mean vote (PMV), was also used in this study. The PMV is an index that predicts the mean value of the thermal sensation votes (self-reported perceptions) of a large group of persons on a sensation scale expressed from –3 to +3. The PMV index takes into account the effects of six factors, including the metabolic rate, clothing insulation, air temperature, mean radiant temperature, air speed, and humidity. In the simulations of this study, the clothing insulation of the human body was set at 0.5 clo. The activity type of the office staff is very light or light work, and their metabolic rate in simulation was set at 1.2 met. The TRNSYS software cannot simulate indoor air distribution. With reference to some field measurement results of the TESCS [46,47], the air speed was set at a fixed value of 0.1 m/s in the simulation.
As the ISO 7730 standard [48] outlines, the desired thermal environment for any space is divided into three categories, A, B, and C, where Category A has the highest level of thermal comfort. ISO7730 proposes the level standards of thermal comfort in the comfort range with PMV as an index. Category A: −0.2 < PMV < +0.2; Category B: −0.5 < PMV < +0.5; Category C: −0.7 < PMV < +0.7. Meanwhile, ISO7730 also proposes the operating temperature range under various level standards under typical conditions of office buildings (based on typical levels of activity, for clothing of 0.5 clo during summer). For summer conditions, the operative temperature ranges were: Category A: 24.5 ± 1.0 °C; B: 24.5 ± 1.5 °C; C: 24.5 ± 2.5 °C [48]. In this study, the comfort of each intermittent control scheme was compared mainly by comparing the proportion of the time when the comfort index of each intermittent control scheme reached the comfort level of Category A in the entire cooling period.
Finally, since the results of the cold zone may not be suitable for other climate zones of China, this study also optimized the intermittent operation schemes of the TESCS for the other climate zones of China. Shenyang, Shanghai, and Guangzhou were selected as the representative cities of the severe cold zone, hot summer and cold winter zone, and hot summer and warm winter zone, respectively. The same typical office building and system models were used in this part. The thermal parameters of building envelopes were set within the recommended limit values of the Design Standard for Energy Efficiency of Public Buildings of China [49]. A similar optimization was carried out to identify the optimal cooling duration and cooling time distribution.

3. Results and Discussion

3.1. Thermal Environment Responsive Characteristics of Intermittently Cooled Room by Tube-embedded Slab

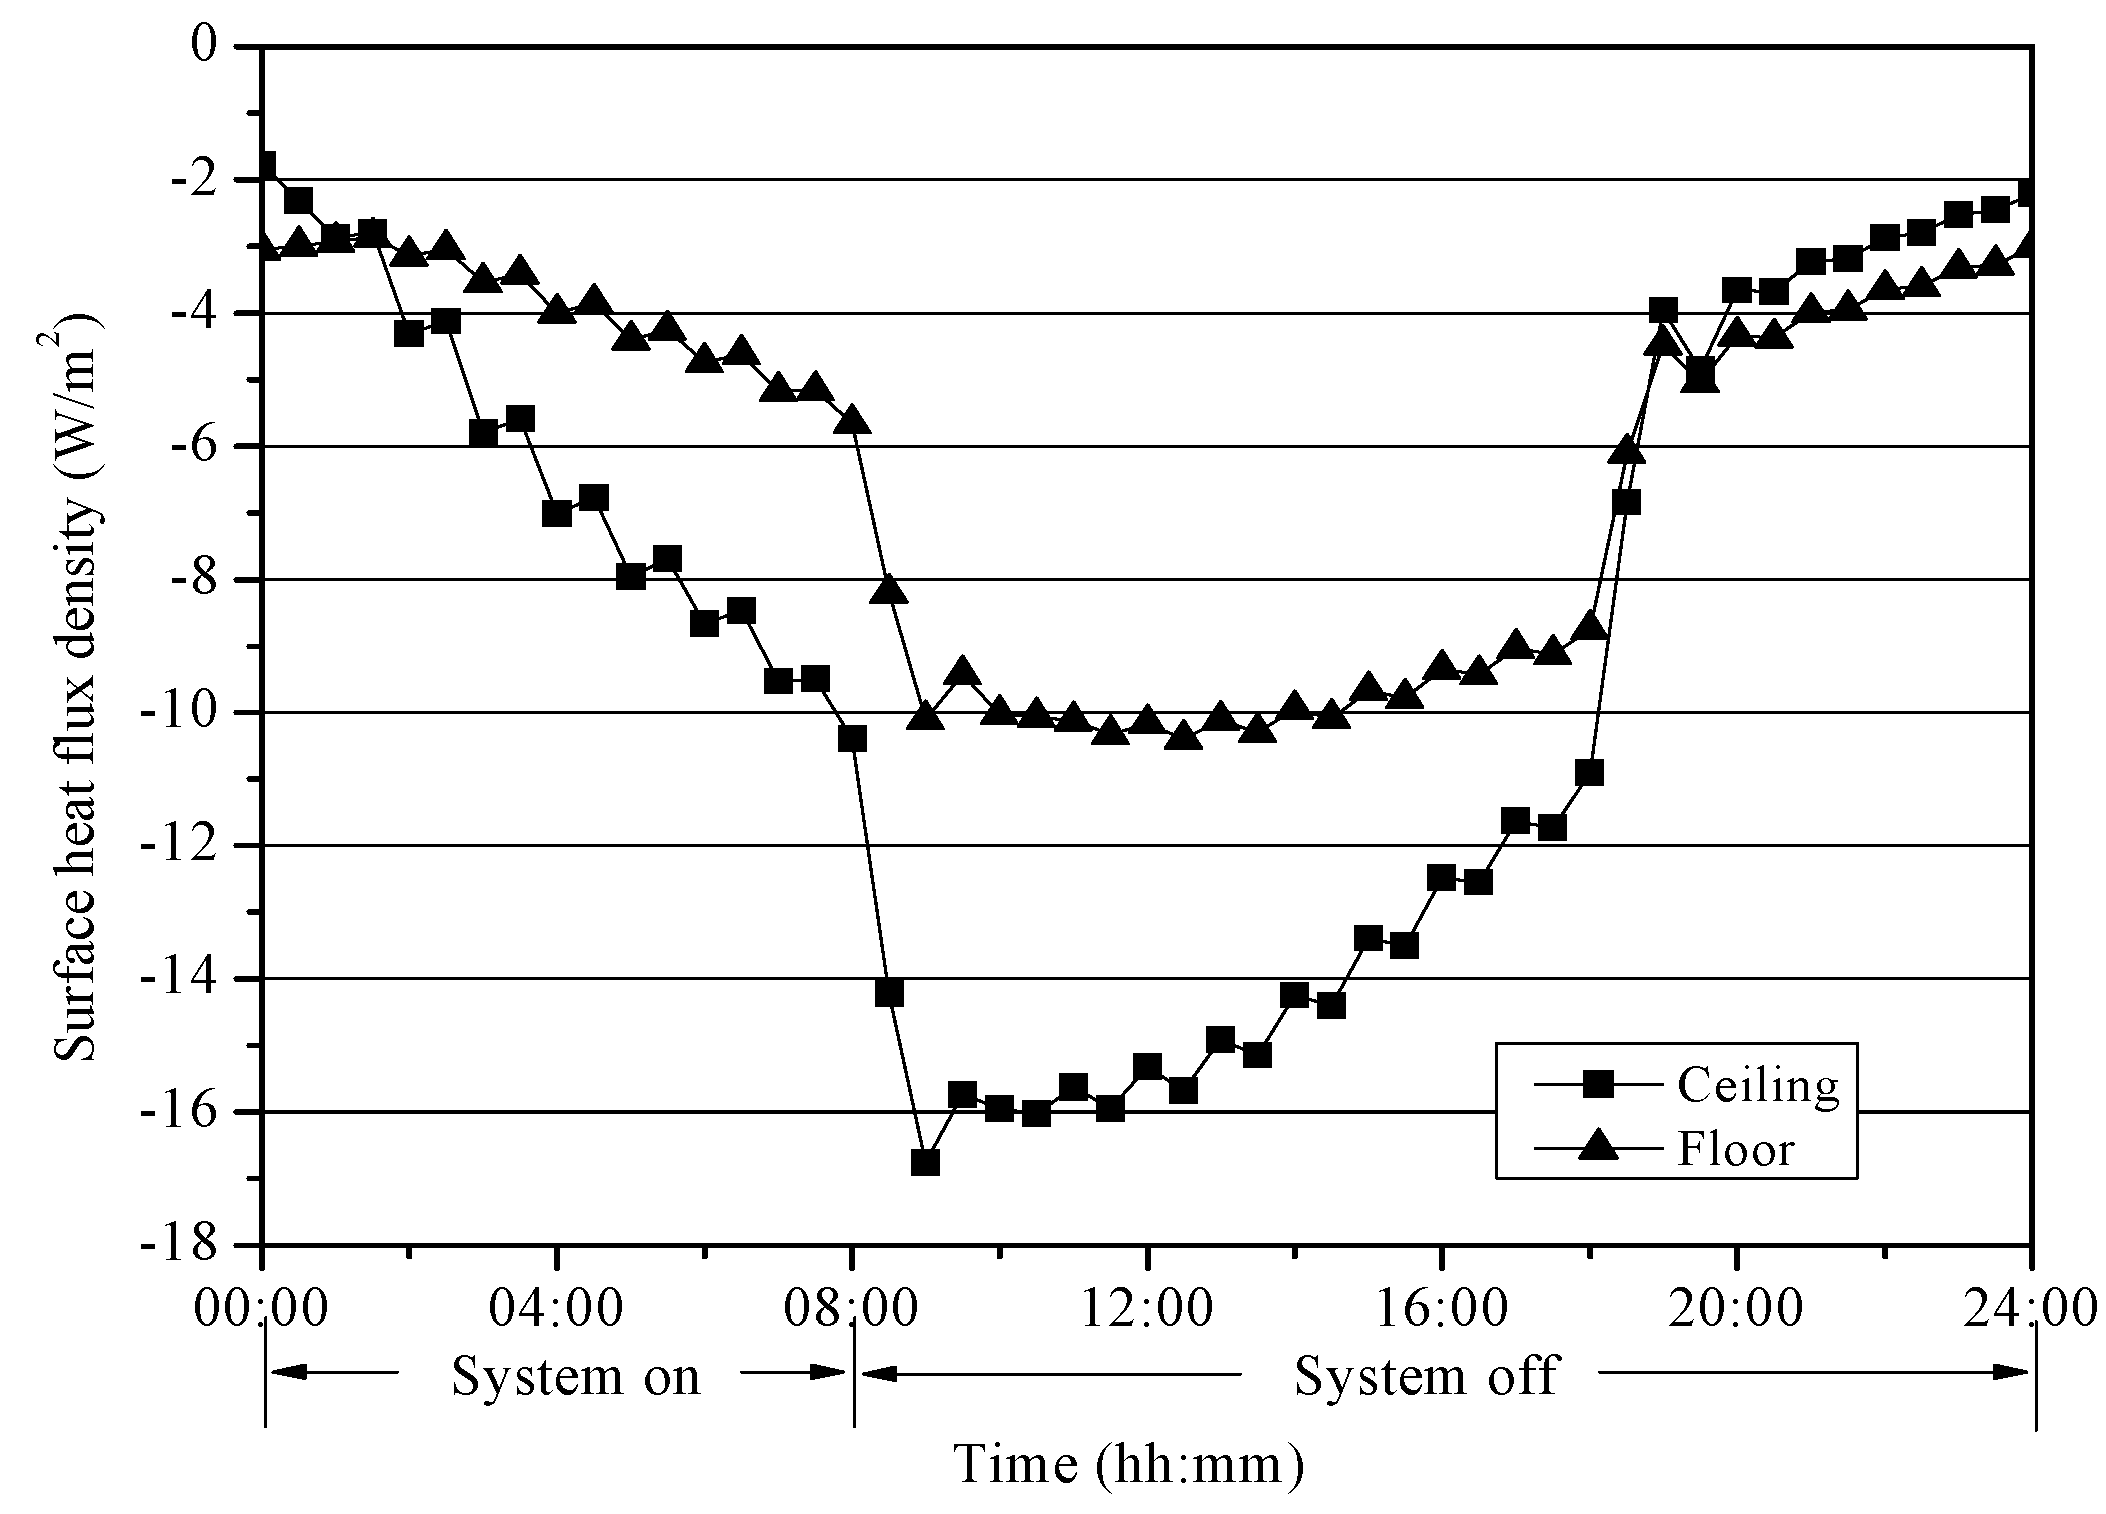
3.1.1. Dynamic Thermal Response Characteristics of Cooling Slab

Figure 4 shows the variation trends of the cooling surface temperatures and water return temperatures during a typical day. It can be seen that the cooling surface temperature decreases with the increase of the cooling time but gradually increases after the stop of cooling, due to the presence of indoor heat gains. The surface temperatures of the ceiling and floor vary in the range of 22 to 24 °C on 10 July, which meet the requirements of the Chinese standard ‘Technical Specification for Radiant Heating and Cooling’ (JGJ 142-2012) [44]. It can also be seen from the figure that the water return temperatures vary within a small range when the water supply temperature is constant. Their variation trends are similar to that of the cooling surface temperatures. They gradually decrease with the increase of cooling time and then gradually rise and are close to the cooling surface temperatures at the end. This shows that when the TESCS is intermittently operated, the water return temperature will fluctuate within a small range when the water supply temperature is constant.
Because concrete has a high thermal mass and a strong ability to store thermal energy, the tube-embedded cooling slab can be regarded as a cold source and also a large cold storage unit. The cooling capacity provided by embedded tubes is stored and transmitted inside the concrete slab. Because there are heat storage and release in the heat transfer process of the concrete radiant slab, the cooling capacity cannot be immediately reflected to the room. The transient cooling capacity of the cooling slab can be described by the indictor of the surface heat flux density, which is a flow of energy per unit of area of the TESCS per unit of time. Figure 5 shows the heat flux density variation trends of the cooling surface on July 10. It can be seen that due to the cold storage of the cooling slab, the heat flux densities of the ceiling and floor do not reach the maximum values when the cooling system starts to run but gradually increase with the increase of the system running time and reach the maximum values when the system stops cooling about one hour. Then, with the release of the storage capacity of the cooling slab, the surface heat flux density begins to become smaller gradually. It can be also seen from the figure that the surface heat flux density of the ceiling is greater than that of the floor, which indicates that the ceiling cooling has a higher cooling capacity than the floor cooling.

3.1.2. Response of Indoor Air Temperature and Mean Radiant Temperature to Intermittent Operation

As far as TESCS is concerned, the heat transfer between the human body and the indoor environment includes the convection between the human body and indoor air, and radiation between human body and building envelopes. The mean radiant temperature is usually used when considering the effect of the surface temperature of surrounding objects on the thermal radiation intensity emitted from the human body. In the radiant cooled environment, the mean radiant temperature is an important thermal environment parameter that affects the thermal comfort of the human body. The mean radiant temperature is defined as the uniform temperature of an imaginary enclosure in which the radiant heat transfer from the human body is equal to the radiant heat transfer in the actual non-uniform enclosure. Figure 6 shows the trends of the indoor air temperature and the mean radiant temperature during a typical day under the intermittent cooling condition of the TESCS. It can be seen that the indoor air temperature and mean radiant temperature during the cooling period gradually decrease with the increase of the cooling time. However, when the cooling system is off, both gradually increase due to the effect of people, equipment, lighting and other internal heat gains, as well as external factors such as solar radiation and outdoor air temperature. Then, they gradually decrease with the disappearance of internal heat gains and the decreases of outdoor temperature and solar radiation. It also can be seen that since 8 a.m. when the system stops cooling, although the outdoor air temperature increases significantly, the indoor air temperatures do not increase significantly, due to the release of the heat storage of the cooling slab. The mean value of the indoor air temperature during office hours is 25.3 °C with the maximum and minimum values of 25.7 °C and 22.9 °C, respectively. The fluctuation of the indoor air temperature is little and the maximum change is 2.8 °C during office hours. The mean radiant temperature during office hours varies in a range of 23.8 to 25 °C, with a fluctuation range of 1.2 °C. It can be concluded that the indoor air temperature and mean radiant temperature can be basically kept stable under the intermittent control scheme.

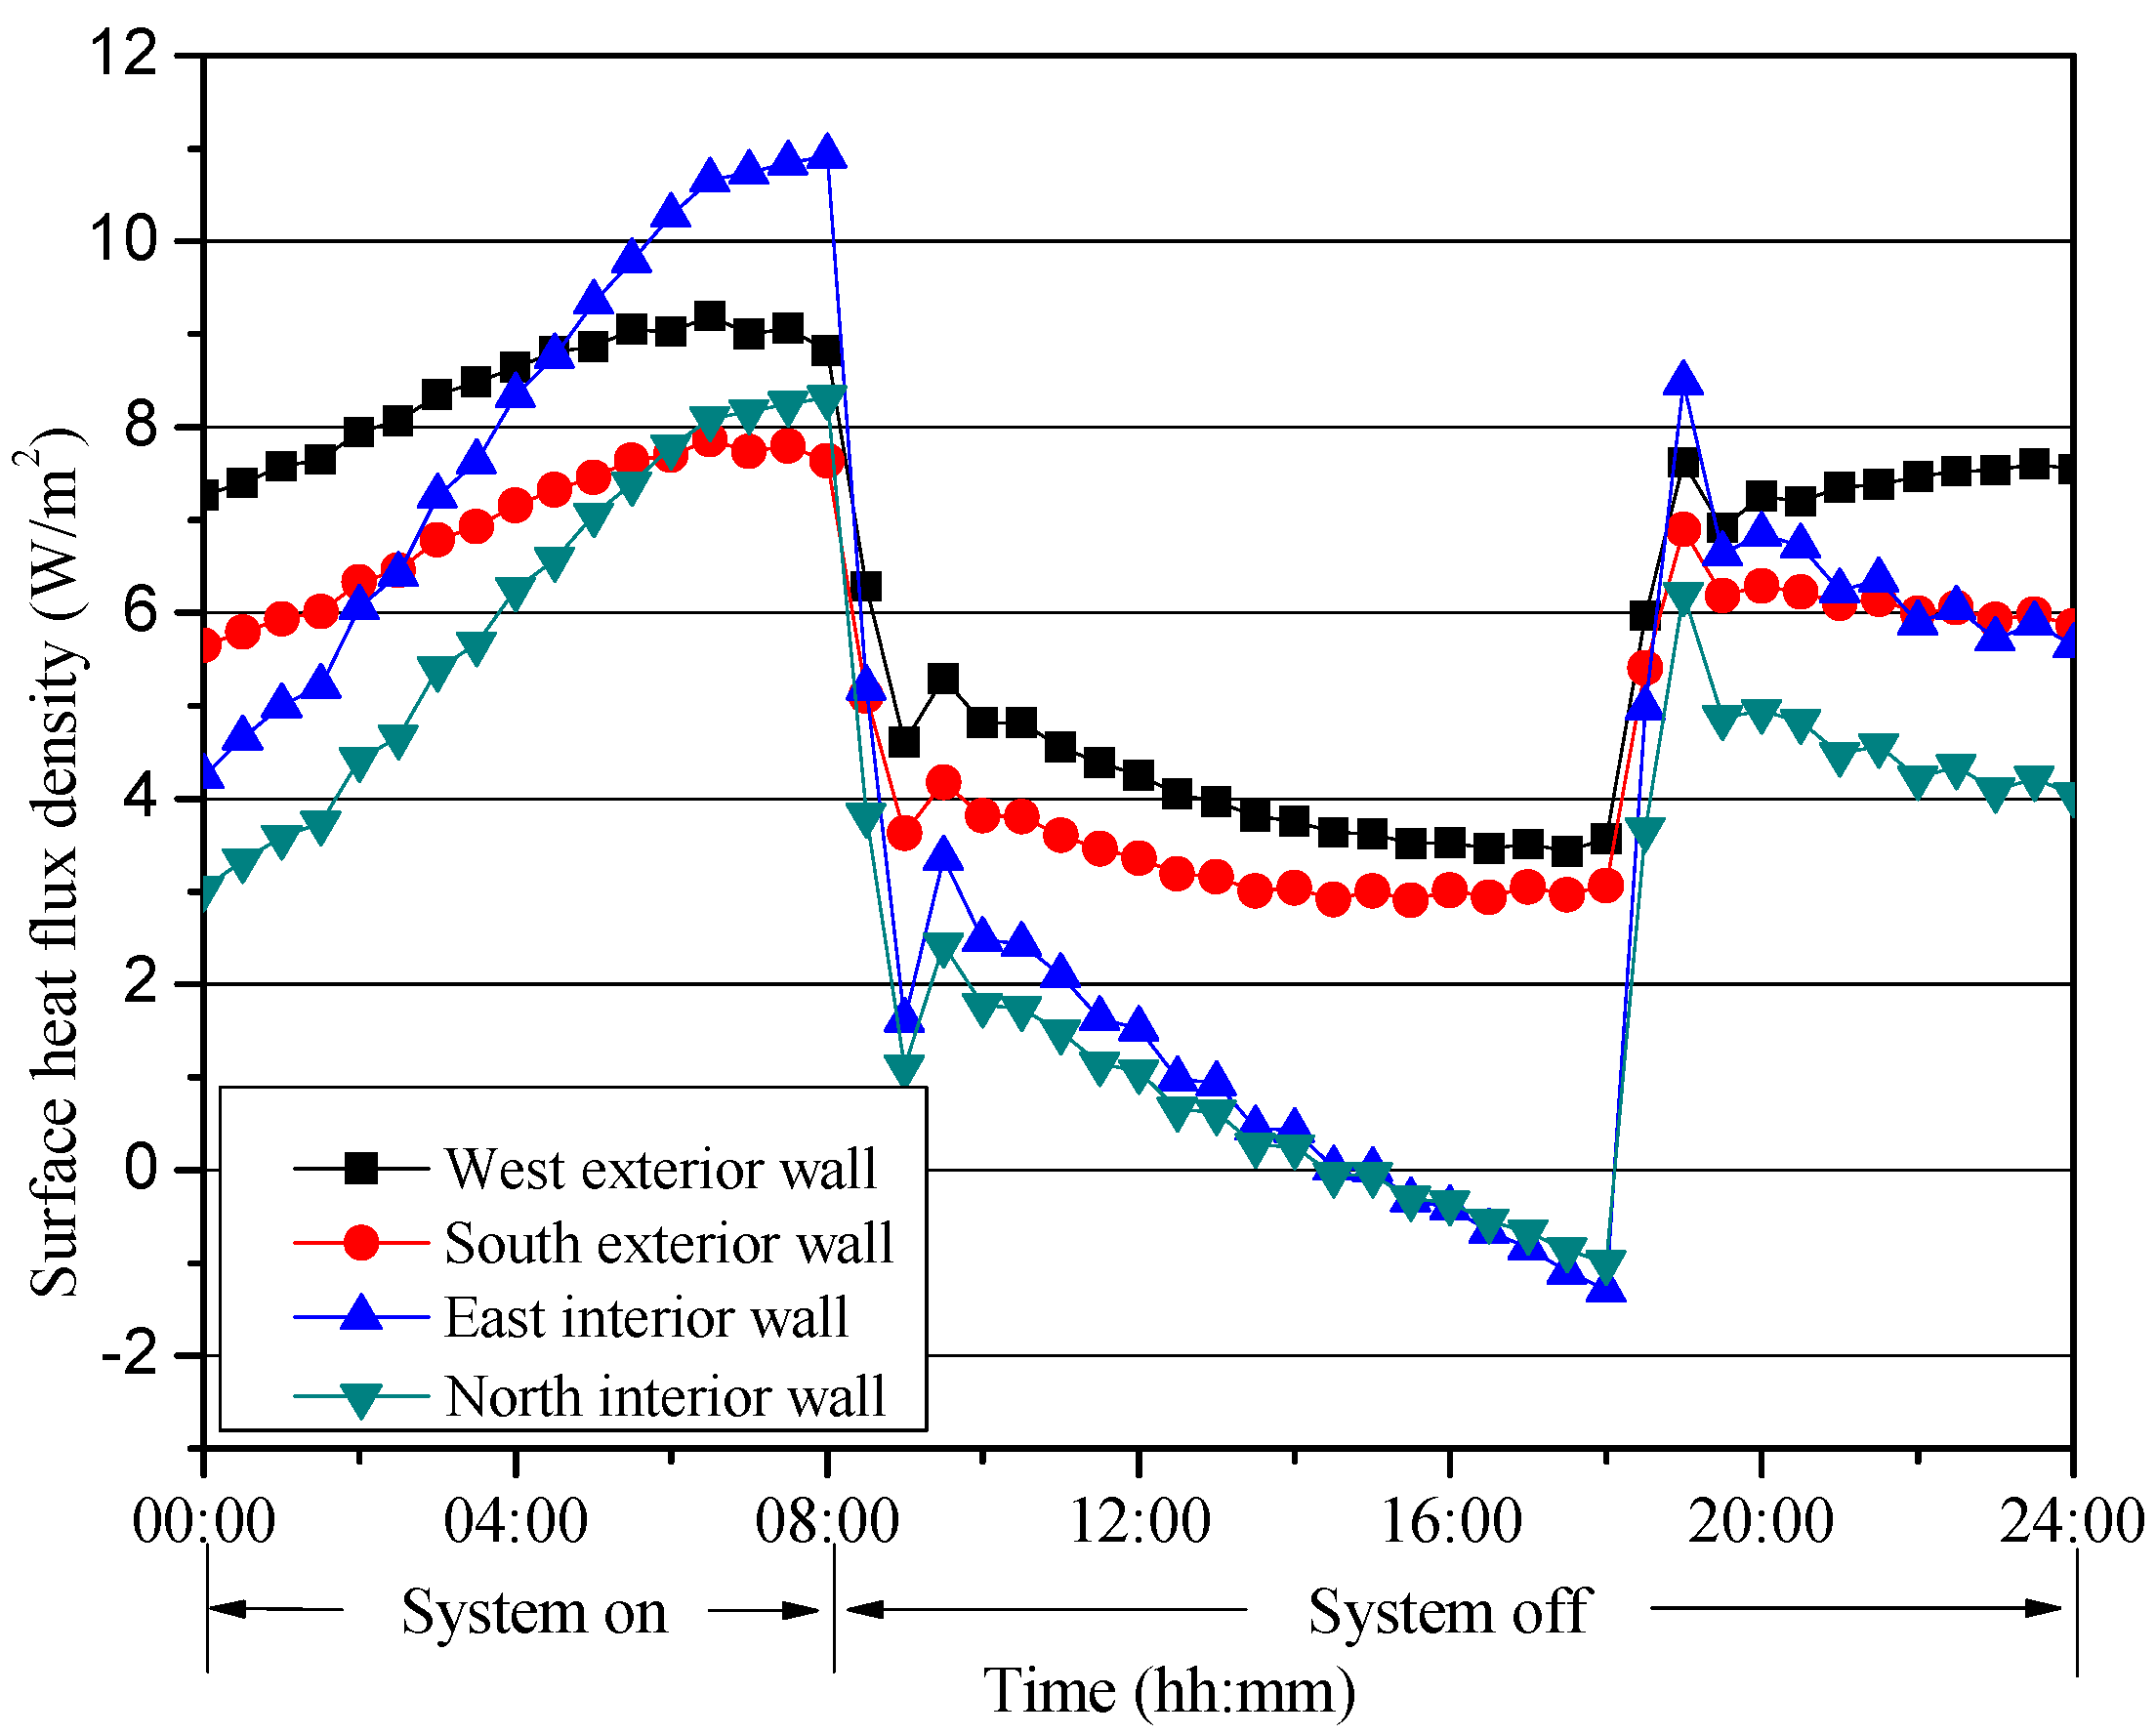
3.1.3. Dynamic Thermal Response Characteristics of Passive Wall

In the radiant cooled environment, two heat transfer mechanisms occur on the surface of the passive wall, including the radiant heat transfer between the passive wall and the radiant cooling surface and the convective heat transfer between the passive wall and indoor air. The presence of the radiant cooling surface makes the passive wall surface temperature lower than that of the conventional convective air conditioned room. When the surface temperature of the passive wall is lower than the indoor air temperature, the passive wall will release the cooling capacity. This section mainly analyzes the variation trends of the surface heat flux density of the passive wall to check whether there is a cooling capacity stored in the passive wall and obtain the effect of the passive wall on the indoor thermal environment. Figure 7 shows the heat flux density variation trends of the internal surface of the passive walls during a typical day. It can be seen from the figure that the internal surface heat flux densities of the south and west exterior walls during office hours (8 a.m. to 6 p.m.) are both positive values, which means heat is transferred from the outside of room to the inside. However, that of the east and north interior walls are negative values sometimes, which means there are a cooling storage and release in these two walls. This is mainly because there are heat exchanges between the exterior wall and the inside as well as the outside of room. Nonetheless, the heat transfer, due to the effect of outdoor air and solar radiation, is greater, so the internal surface flux density of the exterior wall is a positive value. However for the interior wall, there is heat exchange only between the interior wall and the indoor environment. Because there is heat exchange between the interior wall and the cooling slab, and thus some heat is stored in interior wall, it begins to release a cooling capacity when the cooling surface temperature is lower than the indoor air temperature. However, relative to the cooling slab, the cooling capacity released by these two interior walls is very small, almost negligible.

3.1.4. Comparison of Dynamic Response Characteristics of Indoor Thermal Environment between Nighttime Cooling and Daytime Cooling

TESCS has a strong cold storage capacity, so that nighttime cooling could be considered as the intermittent cooling scheme in order to shift energy use to off-peak hours for economical purposes. The principle of nighttime cooling is that cooling is active and stored at night, and it stops during working hours while releasing the stored cooling power to indoor spaces. This section mainly focuses on the comparative analysis of the thermal environment response characteristics between nighttime cooling and daytime cooling. The duration of cooling time of these two schemes are all eight hours. The cooling period of nighttime cooling and daytime cooling are 12 to 8 a.m., and 8 a.m. to 4 p.m., respectively. Figure 8 shows the indoor air temperature variation trends of the top room during a typical day. As seen, there is no significant difference in the quantity values of the indoor air temperature between nighttime cooling and daytime cooling, except that the stability of the indoor temperature of daytime cooling is better than that of the night cooling. Figure 9a shows the cooling capacity variation trends of the embedded tubes and the outdoor air system during a typical day, respectively. There is no significant difference between the total cooling capacity of the embedded tubes in the nighttime cooling condition and that in the daytime cooling condition. However, since the radiant terminal device and dedicated outdoor air system in daytime cooling have the cooling load all in the daytime, while the radiant terminal device and dedicated outdoor air system under the nighttime cooling condition have a cooling load at nighttime and daytime, respectively, so the nighttime cooling scheme can reduce the required cooling capacity for a chiller. Figure 9b shows the variation trends of the total cooling capacity of the composite system under the two different cooling modes, it can be concluded that the required peak cooling capacity of the chiller in the nighttime cooling mode can be reduced by about 25% compared to the daytime cooling mode. In addition, the power supply required by the cooling system for nighttime cooling is transferred to the nighttime, and only a dedicated outdoor air system is required during office hours. Under the daytime cooling condition the radiant cooling system and dedicated outdoor air system are running at the same time, and the power loads required by both systems are all during the office hours, so the total peak load of a chiller increases. Therefore, using nighttime cooling can shift the peak load off of peak hours, so that it can achieve the purpose of saving system operating costs by using low-price electricity at night.

3.2. Optimization of Intermittent Cooling Schemes

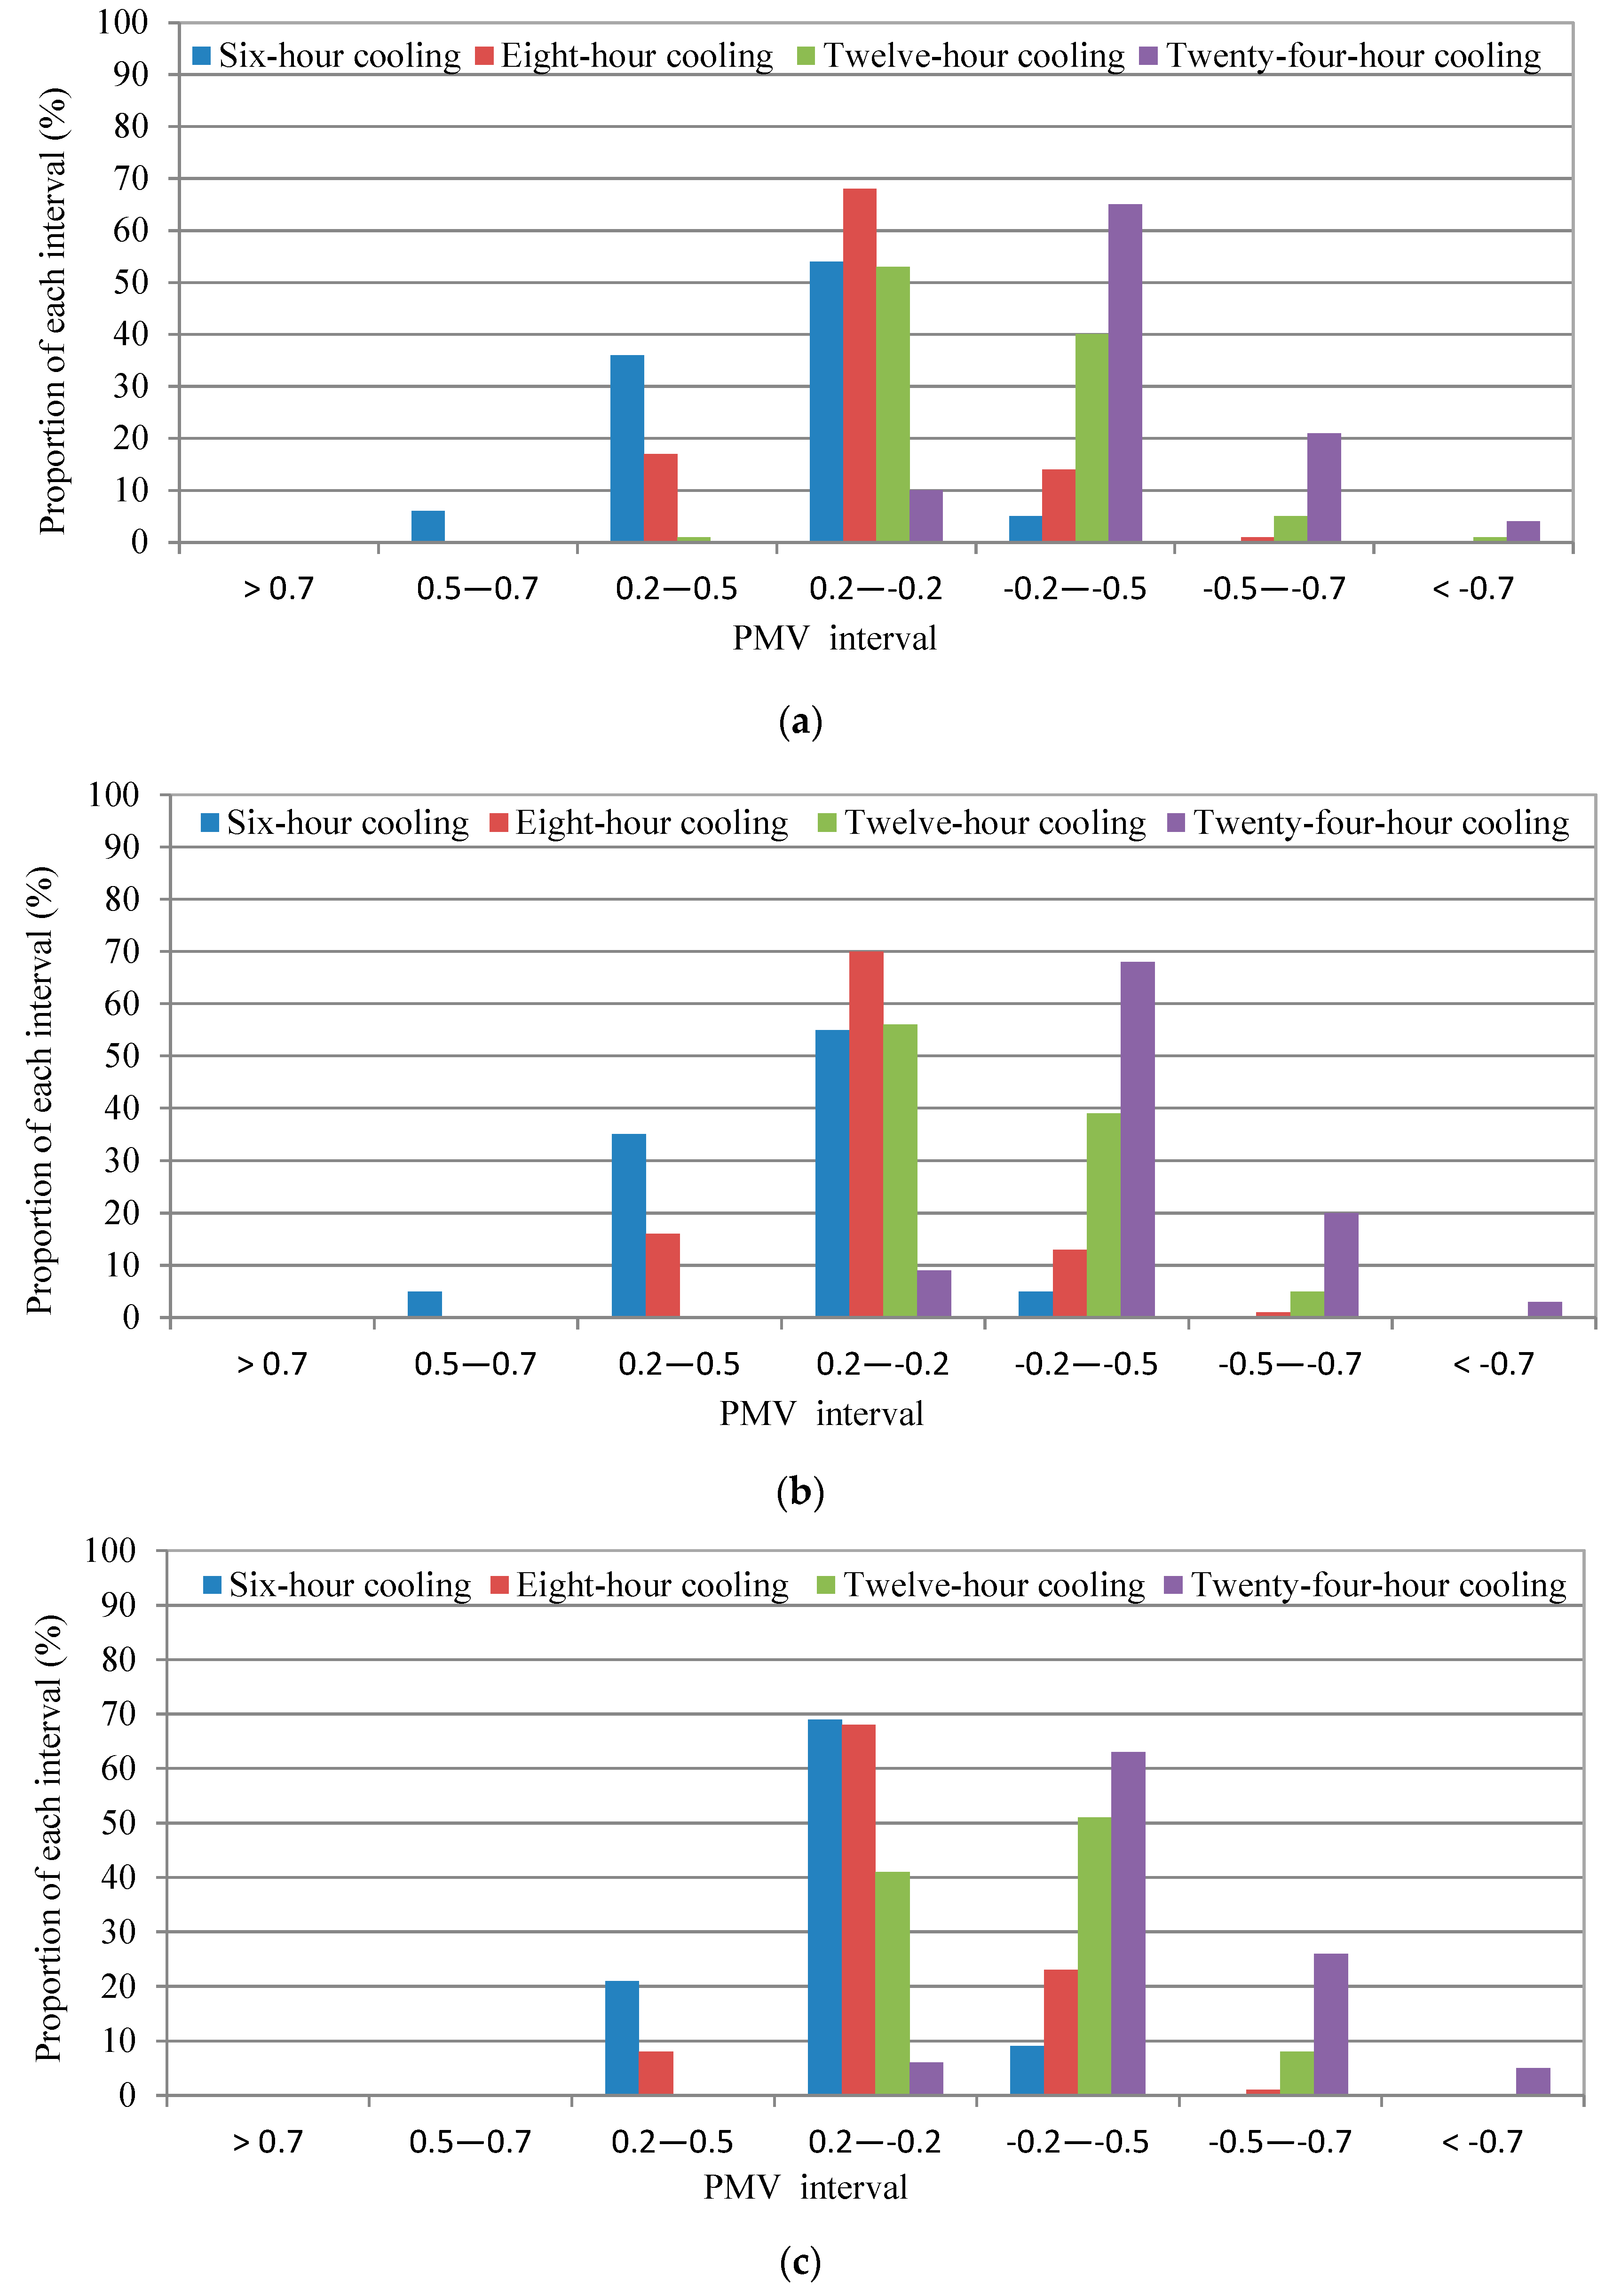
3.2.1. Optimization of Cooling Duration

This section aims to find out the optimal duration of the cooling time in order to achieve the best indoor thermal comfort as well as system energy saving. The functioning time of the radiant cooling slab system varies with the intermittent control scheme, while the functioning time of the dedicated outdoor air system coincides with the staff working schedule. It is known from Section 3.1.4 that nighttime cooling has many advantages including reducing the installed capacity of chiller, realizing a peak shift of the power consumption, and saving system operating costs. Therefore, nighttime cooling was primarily chosen as the intermittent operation scheme throughout this section and different cooling durations were considered. The main operation schemes are outlined: (1) six hours of continuous cooling: 2 to 8 a.m.; (2) 8 h of continuous cooling: 12 to 8 a.m.; (3) 12 h of continuous cooling: 8 p.m. to 8 a.m.; (4) 24 h of continuous cooling. The thermal environment of the studied room and the energy consumption of the system during the entire cooling period were simulated.
Figure 10 shows the proportions of time that different operative temperature intervals occur in the office hours of the entire cooling period under various cooling durations. It can be noted that a decrease in the operative temperature is associated with the cooling duration increasing. In the case of a very short cooling duration, relatively high operative temperature leads to the thermal comfort requirement not being well satisfied. However, it is not ideal for the cooling duration to be too long, as a long cooling duration tends to cause low operative temperature, which results in the thermal comfort requirement not being well met. All the rooms on different floors at the same location differ slightly from each other in terms of their operative temperatures. According to Figure 10, the 8 h cooling scheme accounts for the largest proportion of the operative temperature interval that meets the comfort criteria of Category A.
Figure 11 shows the proportions of time that different PMV intervals occur in the office hours of the whole cooling period under different cooling durations. It can also be seen that too short or too long cooling duration will cause the PMV to deviate from the optimal range, which will reduce the thermal comfort level of the human body. The proportion of different PMV intervals in rooms at the same location on different floors is slightly different. Figure 11 shows that among the four cooling duration conditions, the proportion of time during which the PMV meets the Category A standard during office hours of the cooling period under the eight-hour cooling duration condition is the largest. Combining the results shown in Figure 10 and Figure 11, it can be concluded that compared with the other three cooling time periods, the office staff has a longer and more comfortable indoor environment under the eight-hour cooling duration condition. Thus, in terms of thermal comfort, 8 h is the best duration for cooling.
As it is advised that TESCS is combined with the dedicated outdoor air system, the total energy consumption of this hybrid system consists of consumption of both parts. In this study, the dedicated outdoor air system maintains a constant level in the air supply volume as well as the temperature of the air supply. Since all the different cooling schemes have the same running times for outdoor air system, the energy consumption at the air side of the various intermittent control schemes is also identical to each other. As a result, our study primarily looked into the energy consumption of TESCS under the various control schemes. As high temperature cooling water is used in TESCS to reduce building envelope temperatures, the energy consumption of TESCS can be partly extracted from what the embedded tubes can provide for the room in our study, in terms of its total capacity for cooling. Table 3 exhibits the total cooling capacity that the radiant cooling system provided throughout the entire cooling period for the three rooms studied in this paper, under various durations for cooling. From studying the table, a positive relationship can be observed between the total capacity required for cooling and the duration for cooling. In addition, energy consumed by the pump is also a part of the total energy consumed by the radiant cooling system. Since the water supply volume of the water system is constant, a positive relationship between the duration for cooling and energy consumed by the water-side pump is expected. However, increasing the cooling duration has a significant advantage. It can reduce a peak load, as shown in Figure 12. Therefore, the total capacity installed of the chiller can be decreased, which in turn reduces the initial investment for the cooling system. It is shown in Figure 12 that the embedded tubes change in terms of their capacity for cooling in a typical 24-h day with various durations for cooling. According to Figure 12, the peak capacity for cooling supplied to the room from embedded tubes reduces with the increase of the cooling duration. It can be concluded that 24-h cooling can reduce the peak load about 70%, 67%, and 41%, respectively, compared with 6-h cooling, 8-h cooling, and 12-h cooling. Similar conclusions have also been made in some previous papers that all-day cooling with high cooling water temperature decreases the peak load by more than half, compared to using cooling water with low temperature and short-period cooling [38].
It is recommended that the control scheme is optimized to improve both thermal comfort and energy savings. The amount of energy consumed in the case with 6-h cooling is smaller than that of the case cooled with the 8-h duration. However, in terms of indoor thermal comfort, 8-h cooling produces a better result. In conclusion, to achieve both energy efficiency and requirement satisfaction of thermal comfort, 8-h duration for cooling is more effective.

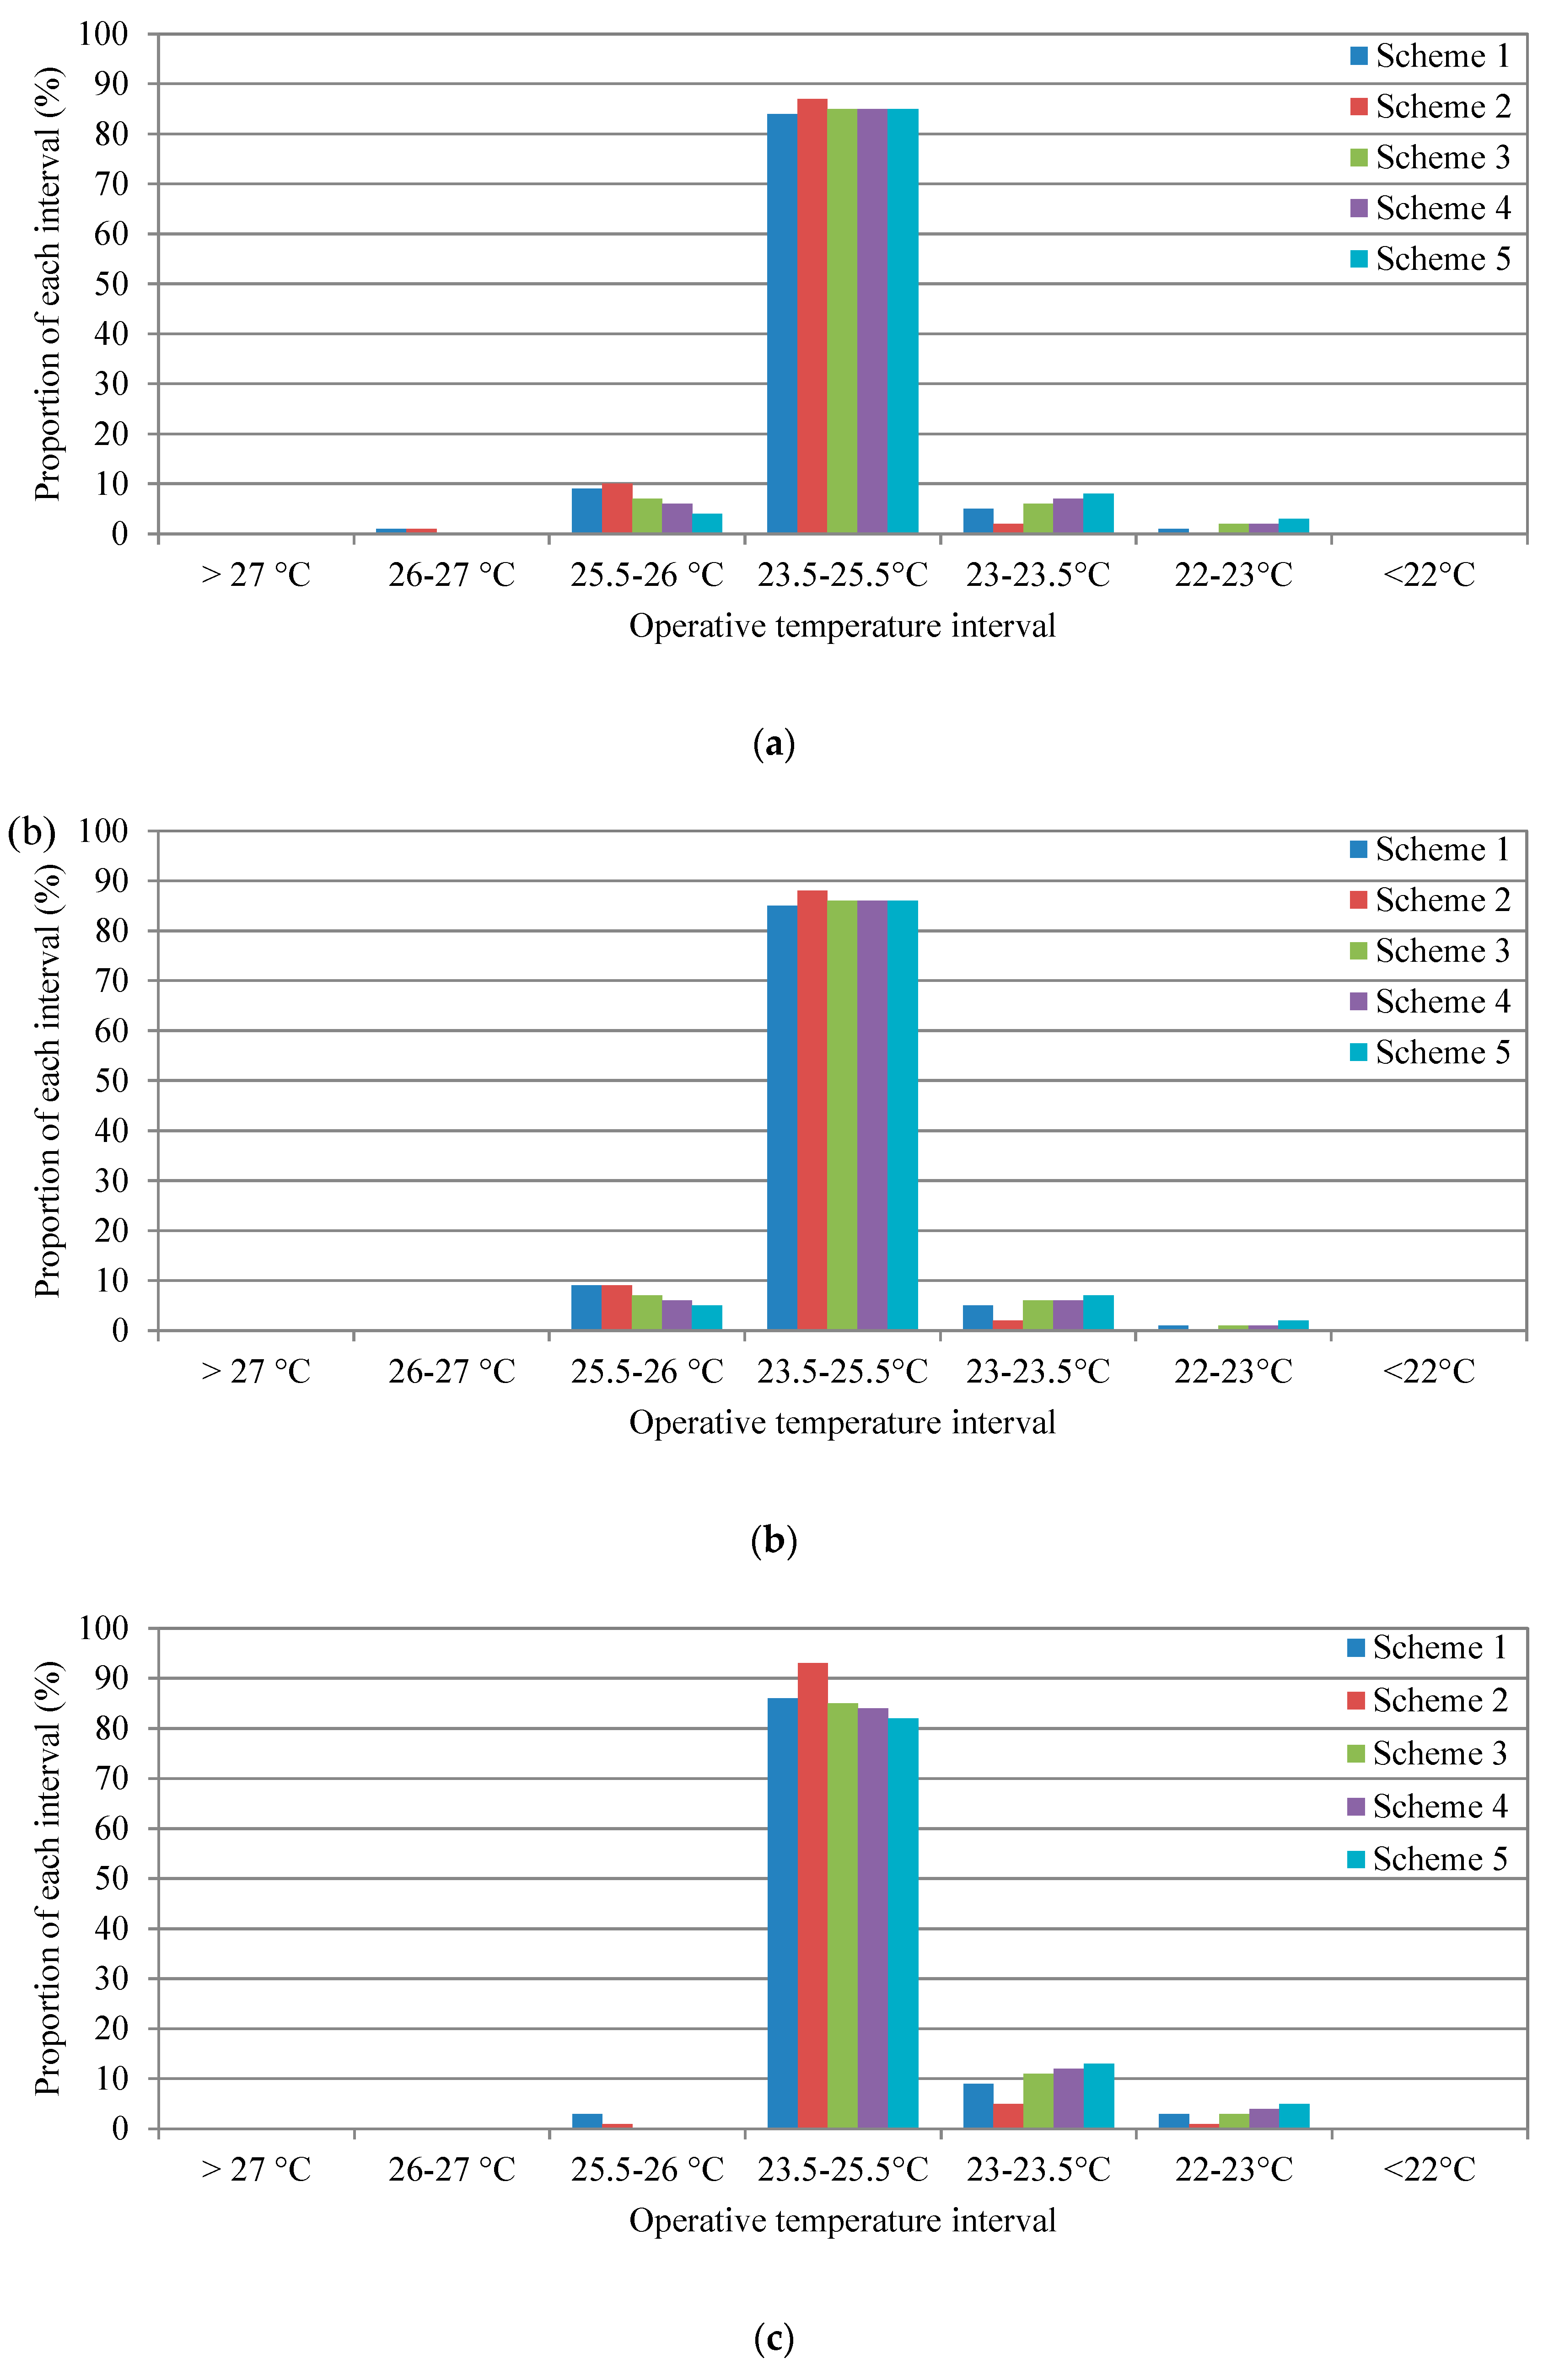
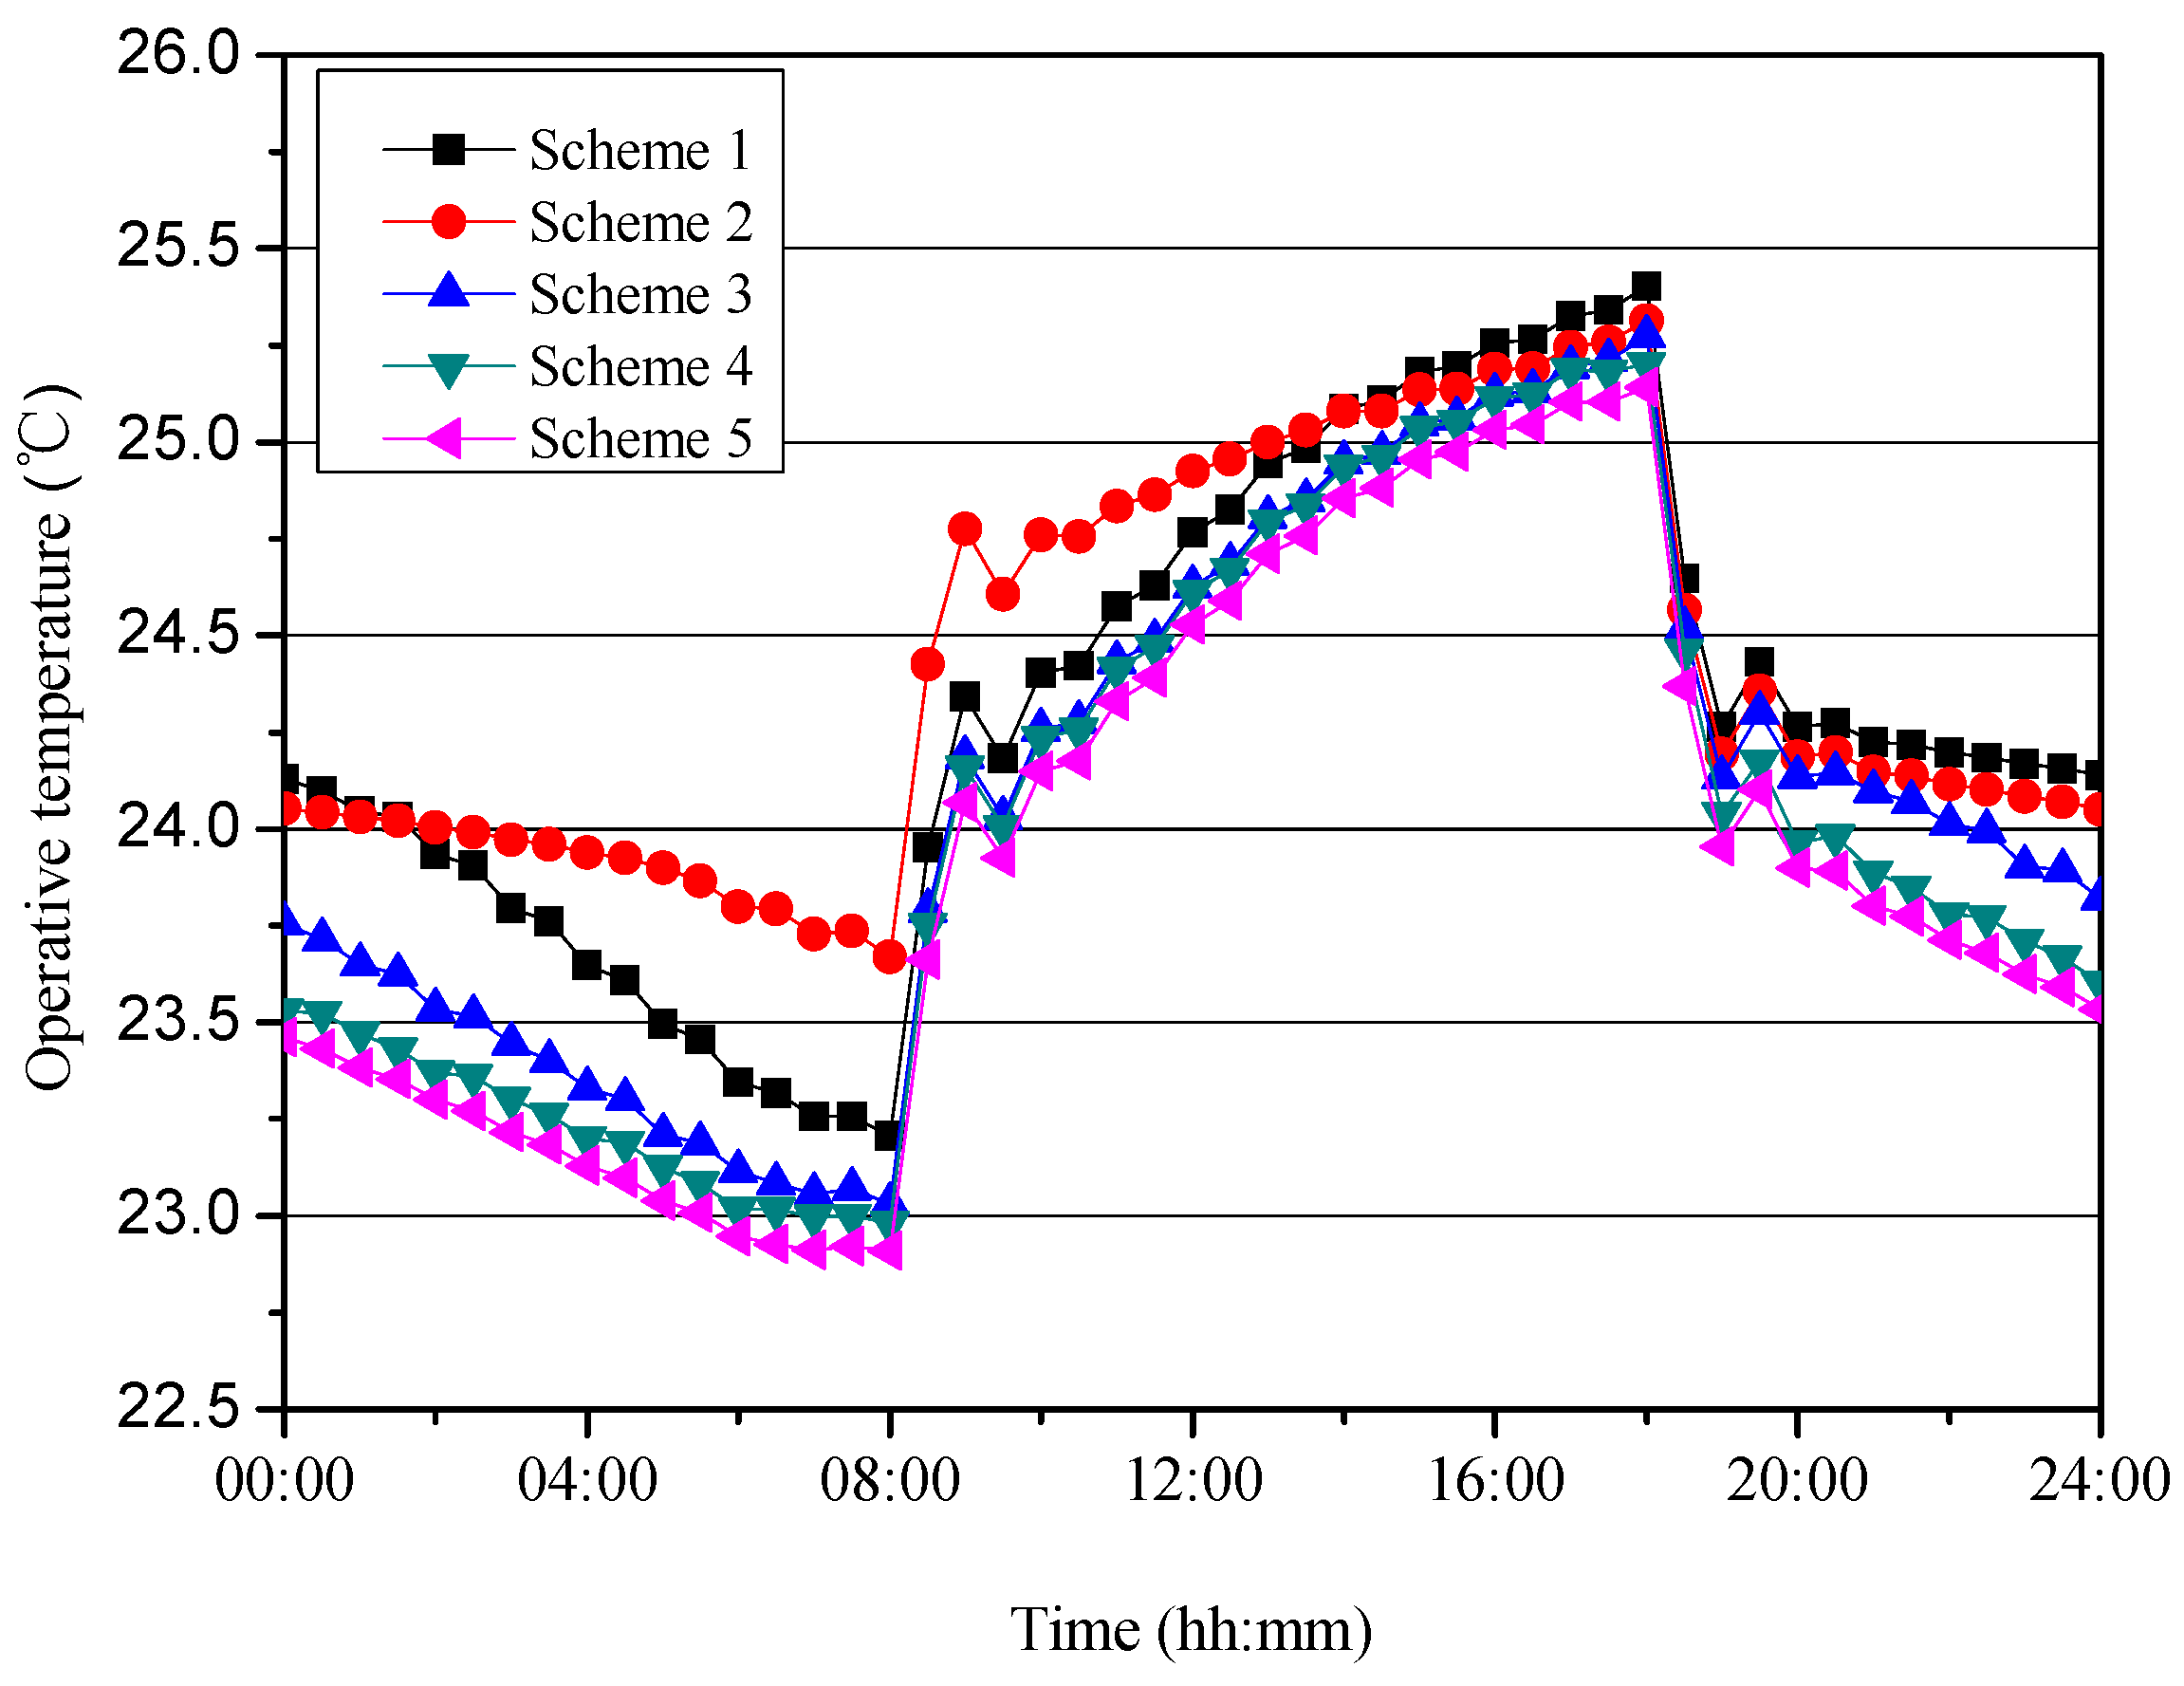
3.2.2. Optimization of Distribution of the Time for Cooling

Section 3.2.1 compared the indoor thermal comfort and system energy consumption of radiant cooled room with continuous cooling under various durations for cooling. However, the varying distributions of cooling time throughout the same duration for cooling will also have an impact on indoor thermal conditions and energy consumption by the system. The primary focus of this section was the optimization of the distribution of cooling time. The concluded optimal cooling duration of 8 h derived from Section 3.2.1 was used as the total cooling duration. Nighttime cooling was mainly considered in Section 3.2.1. However, when it comes to cooling during the daytime, as a result of indoor and solar radiation heat gain on the cooling surface, some of the heat gain can be directly cancelled out by cooling water, and hence there is a relatively large cooling capacity of the radiant system [50,51]. Therefore, daytime cooling was also taken into consideration in discussions of this section. In this section, the primary intermittent operation schemes are: (1) Scheme 1: 8 h of continuous cooling from 12 to 8 a.m.; (2) Scheme 2: 8 h of continuous cooling from 5 a.m. to 1 p.m.; (3) Scheme 3: 2 h on, 1 h off; (4) Scheme 4: 1 h on and 1 h off; (5) Scheme 5: 30 min on and 30 min off. The detailed cooling time distributions of each scheme are shown in Figure 13. Cooling activities in Schemes 1, 3, 4, and 5 all take place at night-time, while there is a small part of the cooling activity in Scheme 2 that happens at nighttime, it is mostly daytime cooling.
Figure 14 shows the proportions of time that different operative temperature intervals occur in working hours throughout the entire period of cooling under different cooling time distributions. According to the figure, the distribution of cooling time affects the operative temperature of the room. When all the night-time cooling schemes, i.e., Schemes 1, 3, 4, and 5, under the same duration for cooling are compared, a negative correlation can be observed between the frequency of the start and stop of the pump and the indoor operative temperature. In other words, frequent on and off switching of the pump with the same duration for cooling leads to an increased capacity for cooling received by the room that is the target for cooling. Figure 15 shows the proportions of time that different PMV intervals occur throughout the entire period of cooling under different cooling time distributions. It can be seen that among the five cooling time distribution schemes, the proportion of time during which the PMV meets the Category A standard during office hours of the cooling period under the Scheme 2 is the largest.
Figure 16 depicts the pattern of changes in the operative temperature of different cooling time distribution schemes on July 10. According to the figure, the temperature fluctuation of Scheme 2 throughout the office hours is the least amongst all, as a result of the particular condition of Scheme 2. More specifically, most of the running time coincides with office opening-hours, and there is a lower nighttime capacity for cooling and the reduction in the operative temperature is less marked. Throughout the part that overlapped with office opening-hours, the heat gains inside the room lead to an increase in both the difference in temperature between indoor air and the water tube and the capacity of the radiant slab for cooling, according to Figure 17. However, since most of the running time under Scheme 2 overlaps with office opening hours, low-cost electricity throughout the nighttime is not fully utilized under this scheme. Table 4 shows the total capacity for cooling supplied to all the three rooms through embedded tubes in the entire period for cooling with varying distributions of cooling time. According to Table 4, the biggest capacity for cooling is observed under Scheme 5, while the smallest is observed under Scheme 2. Figure 14 and Figure 15 show that the highest level of thermal comfort is achieved under Scheme 2. In conclusion, when ignoring night-time low-cost electricity and only considering energy savings and the improvement in thermal comfort, Scheme 2 is the optimal choice for this section.
By comparing Figure 10 and Figure 11 with Figure 14 and Figure 15, and comparing Table 3 with Table 4, it also can be concluded that under the nighttime cooling mode, the effect of the cooling duration on thermal comfort and energy efficiency is much greater than that of the cooling time distribution. Therefore, in the optimization of the intermittent operation and control strategy, it is very important to choose the appropriate duration for cooling.

3.2.3. Variable Water Temperature Control Scheme

The cooling period of Xi’an is very long and its outdoor air temperature fluctuates greatly. If the intermittent cooling scheme with the constant water supply temperature was used, the system may not function well enough to meet the indoor thermal comfort requirements and achieve the full energy efficiency potential. Therefore, one can consider further optimizing the intermittent operation scheme by combining it the with variable water temperature control scheme. In the setting of control parameters, the water supply temperature varies according to the variation of the outdoor air temperature. As for the empirical formula of variable water temperature control on the concrete radiant cooling system, some scholars have studied the buildings of Germany [35]. Olesen proposed a relationship function between the water supply temperature and outdoor air temperature [35], as shown in Equation (1).
t supply = 0.52 ( 20 t external ) 1.6 ( t op 22 ) + 20
where t supply is the water supply temperature (°C); t external is the outdoor air temperature (°C); t op is the indoor operative temperature (°C).
This study first used Olesen’s relationship function as the variable water temperature control scheme in simulation to determine whether it is suitable for the typical office building in Xi’an. In order to reduce the fluctuation range of the water supply temperature, the mean temperature of each hour was used for the setting value of outdoor air temperature in Equation (1). The optimal scheme (Scheme 2: eight hours for cooling duration at 5 a.m. to 1 p.m. for the cooling period), resulting from Section 3.2.2, was used for the intermittent operation scheme in this section. On this basis, the Equation (1) was used as the variable water temperature control function. Under this control scheme, the proportions of time at which different operating temperature and PMV intervals occur in office hours of the whole cooling period are shown in Table 5.
From Table 5, it can be seen that when using Equation (1) as the control function, the indoor operative temperature is very low, and the PMV values of part of cooling period are less than −0.5, which cannot meet the requirement of the standard ISO7730 [48]. In addition, when using Equation (1) in Xi’an, the calculated water supply temperature is too low, which will cause the risk of condensation on cooling surface. Figure 18 shows the variation trends of the water supply temperature during a day when Equation (1) was adopted. It can be seen from the figure that the water supply temperature changes in the range of 9–15 °C during a typical day. While the indoor air design temperature is 26 °C and the design relative humidity is 50%, which corresponds to a dew point temperature of 14.6 °C. Obviously, this will cause the risk of condensation on the radiant cooling surface. Therefore, Equation (1) was modified in this paper, so that the water supply temperature is higher than the dew point temperature, as shown in Equation (2).
t supply = 0.52 ( 20 t external ) 1.6 ( t op 22 ) + 26
Table 6 shows the proportions of time that different operating temperature and PMV intervals occur in office hours of the whole cooling period, when using Equation (2) as the control function. It can be seen that when using Equation (2) as the control function, the operative temperature of most time during the cooling period is in the range of 23.5–25.5 °C, and the PMV values are in the range of 0.2–0.2, which can meet the thermal comfort requirements well.
Table 7 shows the total cooling capacity of embedded tubes under these three control schemes including variable water supply temperature control using Equation (1) as the control function, variable water supply temperature control using Equation (2) as the control function, and the constant water supply temperature control scheme. As seen, the scheme of the intermittent operation combined with the variable water supply temperature control using Equation (2) can achieve the minimum energy consumption. This control scheme can achieve the dual goals of high thermal comfort and energy savings.

3.3. Optimization of Intermittent Cooling Schemes in Other Climate Zones of China

The optimization of the intermittent operation schemes of TESCS was focused on typical office buildings in a cold zone of China in Section 3.2. The results show that both different cooling durations and different cooling time distributions have an impact on indoor thermal comfort and system energy consumption, and that finding a suitable control scheme can achieve the two goals of high thermal comfort and low energy consumption. The optimal intermittent operation control scheme is given, but the results may not be suitable for other climate zones of China. Therefore, this section optimized the intermittent operation schemes of TESCS for the other climate zones of China including the severe cold zone, hot summer and cold winter zone, and hot summer and warm winter zone. A representative city in every climate zone was chosen, respectively. The intermittent control schemes considered in simulation and the optimization results of each other climate zone are shown in Table 8.
The results show that the optimum cooling duration and cooling time distribution are different for different climate zones under the condition of constant water supply temperature and constant water supply volume. Under the condition with the water supply temperature of 19 °C, the optimum cooling duration for typical office buildings with common envelopes in Shenyang, Shanghai, and Guangzhou are 4, 10, and 14 h respectively. Under the same cooling duration of the system, a high-frequency start and stop control of the pump can provide more cooling capacity for the room, which means the cooling capacity of the system is increased. Under the nighttime cooling mode, the effect of the cooling duration on the thermal comfort and energy efficiency is much greater than the cooling time distribution. These conclusions apply to any climate zone. The results of all other climate zones also show that daytime cooling provides higher thermal comfort and lower energy consumption than other intermittent cooling control schemes.

4. Conclusions

In this paper, the response characteristics of the thermal environment of intermittently cooled rooms by tube-embedded slabs were firstly studied and analyzed for a typical office building in the cold climate zone of China by TRNSYS software, and then the intermittent operation and control schemes of TESCS were optimized. The main conclusions are drawn as follows:
  • For TESCS, intermittent cooling will not cause indoor thermal environment parameters to fluctuate significantly and can keep indoor temperature basically stable.
  • The tube-embedded slab has significant heat storage and release characteristics under the intermittent cooling condition, and the maximum value of the heat flux density of the cooling surface appears about one hour after the stop of cooling. The passive interior wall also has a certain amount of cooling energy storage and also has heat storage and release characteristics under the intermittent cooling condition, but its cooling capacity is very small.
  • The required total cooling capacity increases with the increase of the cooling duration. Reducing the duration of the cooling can reduce the system energy consumption. However, increasing the cooling duration can reduce the peak load and the installed capacity of the chiller. The scheme of 24-h cooling can reduce the peak load about 70%, 67%, and 41%, respectively, compared with 6-h cooling, 8-h cooling, and 12-h cooling. Frequent starts and stops of the pump under the same duration of cooling can increase the cooling capacity obtained by the room to a certain extent. Under the nighttime cooling mode, the effect of the cooling duration on the indoor thermal comfort and system energy efficiency is much greater than the cooling time distribution. It is very important to choose the appropriate cooling duration in the optimization of the intermittent control strategy.
  • Compared with nighttime cooling, daytime cooling can provide a higher thermal comfort level and lower system energy consumption. However, nighttime cooling can reduce the chiller’s installed capacity by about 25%. It can also shift the peak load off of peak hours and use low-price nighttime electricity, which will lead to the savings of the operating cost.
  • On the basis of the intermittent operation, combining variable water temperature control can well restrain the fluctuation of indoor air temperature, due to the large change of the outdoor air temperature in the cooling season, so as to achieve the dual goals of thermal comfort and energy saving better.
  • From the perspective of dual-objective optimization for thermal comfort and energy-saving, four hours, eight hours, ten hours, and fourteen hours are the optimal cooling durations for the typical office building with a typical envelope structure and embedded tube parameters under the condition of using a supply water with a temperature of 19 °C in Shenyang, Xi’an, Shanghai and Guangzhou, respectively.
  • This study selected a typical office building in Xi’an, a typical, representative city of the cold zone in China as the case study, and the optimization study was also extended to wider climate zones of China. For office buildings with similar thermal characteristics, the results are representative. For other types of buildings with different thermal characteristics, such as houses, apartment, or hotels, and so forth, the results may be different. Due to the thermal coupling between the cooling elements of TESCS and the building structure, intermittent operating schemes are sensitive to climatic characteristics, building thermal characteristics, and building load characteristics. Therefore, the intermittent operation scheme has certain applicability to climatic characteristics and building load characteristics. Due to the heat storage characteristics of TESCS, the intermittent operation is also feasible in other types of buildings. However, the optimal intermittent operation scheme may take a different form from the results in this study. It requires further research in the future.

Author Contributions

Formal analysis, X.S.; methodology, X.S.; Software, H.W.; writing—original draft, H.W. and X.S.; writing—review and editing, M.Q. and H.L. All authors have read and agreed to the published version of the manuscript.

Funding

This research was supported by the National Natural Science Foundation of China (Grant No. 51308049), the Natural Science Foundation of Shaanxi Province (Grant No. 2019JM-453), and the Construction Technology Project of Department of Housing and Urban-Rural Development of Shaanxi Province (Grant No. 2015-K72).

Conflicts of Interest

The authors declare no conflicts of interest.

References

  1. International Energy Agency. Energy Technology Perspectives; International Energy Agency: Paris, France, 2017. [Google Scholar]
  2. Caniato, M.; Gasparella, A. Discriminating people’s attitude towards building physical features in sustainable and conventional buildings. Energies 2019, 12, 1429. [Google Scholar] [CrossRef] [Green Version]
  3. Sadollah, A.; Nasir, M.; Geem, Z.W. Sustainability and Optimization: From Conceptual Fundamentals to Applications. Sustainability 2020, 12, 2027. [Google Scholar] [CrossRef] [Green Version]
  4. Chartered Institution of Building Services Engineers. CIBSE Guide B-heating, Ventilating, Air Conditioning and Refrigeration; The Chartered Institution of Building Services Engineers: London, UK, 2007. [Google Scholar]
  5. Feustel, H.E.; Stetiu, C. Hydronic radiant cooling-preliminary assessment. Energy Build. 1995, 22, 193–205. [Google Scholar] [CrossRef]
  6. Babiak, J.; Olesen, B.W.; Petrás, D. Low Temperature Heating and High Temperature Cooling; Federation of European Heating and Air Conditioning Associations: Brussels, Belgium, 2009. [Google Scholar]
  7. Imanari, T.; Omori, T.; Bogaki, K. Thermal comfort and energy consumption of the radiant ceiling panel system: Comparison with the conventional all-air system. Energy Build. 1999, 30, 167–175. [Google Scholar] [CrossRef]
  8. Nagano, K.; Mochida, T. Experiments on thermal environmental design of ceiling radiant cooling for supine human subjects. Build. Environ. 2004, 39, 267–275. [Google Scholar] [CrossRef]
  9. Lin, B.R.; Wang, Z.; Sun, H.L.; Zhu, Y.X.; Ouyang, Q. Evaluation and comparison of thermal comfort of convective and radiant heating terminals in office buildings. Build. Environ. 2016, 106, 91–102. [Google Scholar] [CrossRef]
  10. Sui, X.M.; Zhang, X. Analysis on combinations of indoor thermal microclimate parameters in radiant cooled residential buildings and drawing of new thermal comfort charts. Build. Serv. Eng. Res. Technol. 2016, 37, 66–84. [Google Scholar] [CrossRef]
  11. Tian, Z.; Love, J.A. Energy performance optimization of radiant slab cooling using building simulation and field measurements. Energy. Build. 2009, 41, 320–330. [Google Scholar] [CrossRef]
  12. Wang, S.; Morimoto, M.; Soeda, H.; Yamashita, T. Evaluating the low exergy of chilled water in a radiant cooling system. Energy Build. 2008, 40, 1856–1865. [Google Scholar] [CrossRef]
  13. Niu, J.L.; Zhang, L.Z.; Zuo, H.G. Energy savings potential of chilled-ceiling combined with desiccant cooling in hot and humid climates. Energy Build. 2002, 34, 487–495. [Google Scholar] [CrossRef]
  14. Niu, J.L.; Kooi, J.V.D.; Rhee, H.V.D. Energy saving possibilities with cooled ceiling system. Energy Build. 1995, 23, 147–158. [Google Scholar] [CrossRef]
  15. Saber, E.M.; Tham, K.W.; Leibundgut, H. A review of high temperature cooling systems in tropical buildings. Build. Environ. 2016, 96, 237–249. [Google Scholar] [CrossRef] [Green Version]
  16. Rhee, K.; Olesen, B.W.; Kim, K.W. Ten questions about radiant heating and cooling systems. Build. Environ. 2017, 112, 367–381. [Google Scholar] [CrossRef] [Green Version]
  17. European Committee for Standardization. EN 15377-3: Heating Systems in Buildings-design of Embedded Water Based Surface Heating and Cooling Systems, Part 3: Optimizing for Use of Renewable Energy Sources; European Committee for Standardization: Brussels, Belgium, 2007. [Google Scholar]
  18. Ren, J.; Zhu, L.; Wang, Y.; Wang, C.; Xiong, W. Very low temperature radiant heating/cooling indoor end system for efficient use of renewable energies. Sol. Energy 2010, 84, 1072–1083. [Google Scholar] [CrossRef]
  19. International Organization for Standardization. ISO 11855-1: Building Environment Design-Design, Dimensioning, Installation and Control of Embedded Radiant Heating and Cooling Systems; Part 1: Definition, Symbols, and Comfort Criteria; International Organization for Standard: Geneva, Switzerland, 2012. [Google Scholar]
  20. ASHRAE. 2016 ASHRAE Handbook-HVAC Systems and Equipment; American Society of Heating, Refrigerating, and Air Conditioning Engineers, Inc.: Atlanta, GA, USA, 2016. [Google Scholar]
  21. International Organization for Standardization. ISO 11855-2: Building Environment Design-Design, Dimensioning, Installation and Control of Embedded Radiant Heating and Cooling Systems, Part 2: Determination of the Design Heating and Cooling Capacity; International Organization for Standard: Geneva, Switzerland, 2012. [Google Scholar]
  22. Olesen, B.W. Using building mass to heat and cool. ASHRAE J. 2012, 54, 44–52. [Google Scholar]
  23. Koschenz, M.; Dorer, V. Interaction of an air system with concrete core conditioning. Energy Build. 1999, 30, 139–145. [Google Scholar] [CrossRef]
  24. Lehmann, B.; Dorer, V.; Koschenz, M. Application range of thermally-activated building systems TABS. Energy Build. 2007, 39, 593–598. [Google Scholar] [CrossRef]
  25. Rijksen, D.O.; Wisse, C.J.; Van Schijndel, A.W.M. Reducing peak requirements for cooling by using thermally activated building systems. Energy Build. 2010, 42, 298–304. [Google Scholar] [CrossRef]
  26. Karmann, C.; Schiavon, S.; Bauman, F. Thermal comfort in buildings using radiant vs. all-air systems: A critical literature review. Build. Environ. 2017, 111, 123–131. [Google Scholar] [CrossRef] [Green Version]
  27. Kim, K.; Olesen, B.W. Radiant heating and cooling systems: Part 2. ASHRAE J. 2015, 57, 28–37. [Google Scholar]
  28. Hu, R.; Niu, J.L. A review of the application of radiant cooling & heating systems in Mainland China. Energy Build. 2012, 52, 11–19. [Google Scholar]
  29. Güntensperger, W.; Gwerder, M.; Haas, A.; Lehmann, B.; Renggli, F. Control of concrete core conditioning systems. In Proceedings of the 8th REHVA World Congress for Building Technologies-CLIMA, Lausanne, Switzerland, 9–12 October 2005. [Google Scholar]
  30. Romaní, J.; De Gracia, A.; Cabeza, L.F. Simulation and control of thermally activated building systems (TABS). Energy Build. 2016, 127, 22–42. [Google Scholar]
  31. Lim, J.H.; Jo, J.H.; Kim, Y.Y.; Yeo, M.S.; Kim, K.W. Application of the control methods for radiant floor cooling system in residential buildings. Build. Environ. 2006, 41, 60–73. [Google Scholar] [CrossRef]
  32. Olesen, B.W. Radiant heating and cooling by embedded water-based systems. ASHRAE J. 1996, 1, 1–19. [Google Scholar]
  33. Song, D.; Kim, T.; Song, S.; Wang, S.H.; Leigh, S.B. Performance evaluation of a radiant floor cooling system integrated with dehumidified ventilation. Appl. Therm. Eng. 2008, 28, 299–1311. [Google Scholar] [CrossRef]
  34. Sourbron, M.; Helsen, L. Thermally activated building systems in office buildings: Impact of controller settings on energy performance and thermal comfort. In Proceedings of the 8th international Conference on System Simulation in Buildings, Liege, Belgium, 13–15 December 2010. [Google Scholar]
  35. Olesen, B.W.; Sommer, K.; Dïchting, B. Control of slab heating and cooling systems studied by dynamic computer simulations. ASHRAE Trans. 2002, 108, 698–707. [Google Scholar]
  36. Cho, S.H.; Zaheeruddin, M. Predictive control of intermittently operated radiant floor heating systems. Energy Convers. Manag. 2003, 44, 1333–1342. [Google Scholar] [CrossRef]
  37. Gwerder, M.; Tödtli, J.; Lehmann, B.; Dorer, V.; Güntensperger, W.; Renggli, F. Control of thermally activated building systems (TABS) in intermittent operation with pulse width modulation. Appl. Energy 2009, 86, 1606–1616. [Google Scholar] [CrossRef]
  38. Lehmann, B.; Dorer, V.; Gwerder, M.; Renggli, F.; Tödtli, J. Thermally activated building systems (TABS): Energy efficiency as a function of control strategy, hydronic circuit topology and (cold) generation system. Appl. Energy 2011, 88, 180–191. [Google Scholar] [CrossRef]
  39. TRNSYS 16. A Transient System Simulation Program; University of Wisconsin: Madison, WI, USA, 2006.
  40. Koschenz, M.; Lehmann, B. Thermoaktive Bauteilsysteme Tabs; EMPA Dübendorf Zentrum für Energie und Nachhaltigkeit: Dübendorf, Switzerland, 2000. [Google Scholar]
  41. Weber, T.; Johannesson, G.; Koschenz, M.; Lehmann, B.; Baumgartner, T. Validation of a FEM-program (frequency-domain) and a simplified RC-model (time-domain) for thermally activated building component systems (TABS) using measurement data. Energy Build. 2005, 37, 707–724. [Google Scholar] [CrossRef]
  42. Weber, T.; Johannesson, G. An optimized RC-network for thermally activated building components. Build. Environ. 2005, 40, 1–14. [Google Scholar] [CrossRef]
  43. Sourbron, M.; De Herdt, R.; Van Reet, T.; Van Passel, W.; Baelmans, M.; Helsen, L. Efficiently produced heat and cold is squandered by inappropriate control strategies: A case study. Energy Build. 2009, 41, 1091–1098. [Google Scholar] [CrossRef]
  44. Sui, X.; Wang, H.; Yan, J.; Guo, H. Optimal intermittent regulation of tubes-embedded building envelope cooling system. In Proceedings of the 10th International Symposium on Heating, Ventilation and Air Conditioning Conference, Jinan, China, 19–22 October 2017; pp. 2639–2646. [Google Scholar]
  45. Ministry of Housing and Urban-Rural Development of the People’s Republic of China. JGJ142-2012: Technical Specification for Radiant Heating and Cooling; China Architecture & Building Press: Beijing, China, 2012.
  46. Sui, X. Study on Sharing Rate of Cooling Load of Radiant Terminal Device and Air Supply Terminal Device in Residential Buildings. Ph.D. Thesis, Tongji University, Shanghai, China, 2009. [Google Scholar]
  47. Zhang, M. Research on Human Thermal Comfort in Non-uniform Radiant Cooling Environment and Design Optimization of It. Master’s Thesis, Chang’an University, Xi’an, China, 2014. [Google Scholar]
  48. International Organization for Standardization. ISO 7730: Moderate Thermal Environments: Determination of the PMV and PPD Indices and Specification of the Conditions for Thermal Comfort; International Standard Organization for Standardization: Geneva, Switzerland, 2005. [Google Scholar]
  49. Ministry of Housing and Urban-Rural Development of the People’s Republic of China. GB50189-2015: Design Standard for Energy Efficiency of Public Buildings; China Architecture & Building Press: Beijing, China, 2015.
  50. De Carli, M.; Tonon, M. Effect of modelling solar radiation on the cooling performance of radiant floors. Sol. Energy 2011, 85, 689–712. [Google Scholar] [CrossRef]
  51. Feng, J.J.; Schiavon, S.; Bauman, F. Impact of solar heat gain on radiant floor cooling system design. In Proceedings of the 11th REHVA World Congress, Prague, Czech Republic, 16–19 June 2013. [Google Scholar]
Figure 1. Types of radiant cooling systems. (a) Radiant panel system; (b) embedded surface system and (c) thermally activated building system [6,16].
Energies 13 01568 g001
Figure 2. Floor plan of the room studied on every floor.
Energies 13 01568 g002
Figure 3. Structure of radiant cooling slab.
Energies 13 01568 g003
Figure 4. Cooling surface temperature and water return temperature variation trends on 10 July.
Energies 13 01568 g004
Figure 5. Heat flux density variation trends of cooling surface on 10 July.
Energies 13 01568 g005
Figure 6. Variation trends of indoor and outdoor air temperature and mean radiant temperature on 10 July.
Energies 13 01568 g006
Figure 7. Heat flux density variation trends of passive walls on 10 July.
Energies 13 01568 g007
Figure 8. Indoor air temperature variation trends under daytime cooling and nighttime cooling during a typical day.
Energies 13 01568 g008
Figure 9. System cooling capacity variation trends during a typical day. (a) Embedded tubes and outdoor air system; (b) composite system.
Energies 13 01568 g009
Figure 10. Proportions of time that different operative temperature intervals occur throughout the entire period of cooling under various cooling durations. (a) Top floor room; (b) second floor room; and (c) ground floor room.
Energies 13 01568 g010
Figure 11. Proportions of time that different predicted mean vote interval occurs throughout the entire period of cooling under various cooling durations. (a) Top floor room; (b) second floor room; and (c) ground floor room.
Energies 13 01568 g011
Figure 12. Pattern of variations in cooling capacity of embedded tubes with various durations for cooling in a typical 24-h day.
Energies 13 01568 g012
Figure 13. Different cooling time distribution schemes.
Energies 13 01568 g013
Figure 14. Proportions of time that different operative temperature intervals occur throughout the entire period of cooling under different distributions of time for cooling. (a) Top floor room; (b) second floor room; and (c) ground floor room.
Energies 13 01568 g014
Figure 15. Proportions of time that different PMV intervals occur throughout the entire period of cooling under different distributions of time for cooling. (a) Top floor room; (b) second floor room; and (c) ground floor room.
Energies 13 01568 g015
Figure 16. Operative temperature variation trends of different cooling time distribution schemes on 10 July.
Energies 13 01568 g016
Figure 17. Heat flux densities of the ceiling in the top-floor room with varying distributions of time for cooling.
Energies 13 01568 g017
Figure 18. Variation trends of water supply temperature during a typical day.
Energies 13 01568 g018
Table 1. Thermal parameters of building envelopes.
EnvelopeStructural LayerThickness
(mm)
Thermal Conductivity Coefficient
(W/m·K)
Heat Capacity
(kJ/kg·K)
Density
(kg/m3)
U-Value
(W/m2·K)
South/west wallCement mortar201.250.8420000.587
Concrete block2000.5111400
Low density polyurethane250.021.4735
North/east wallCement mortar201.250.8420001.479
Concrete block2500.5111400
SlabCeramic tile200.830.8417002.831
Cement mortar401.250.842000
Reinforced concrete2802.20.842400
RoofReinforced concrete2802.20.8424000.522
Polystyrene foam450.031.4715
FloorCeramic tile200.830.8417000.558
Cement mortar401.250.842000
Reinforced concrete2802.20.842400
Polystyrene foam400.031.4715
Table 2. Relevant geometric and thermophysical parameters of tubes embedded (PE-X) in slab.
Tube Spacing
(mm)
Tube Diameter
(mm)
Tubing Wall Thickness
(mm)
Thermal Conductivity Coefficient of Tubing Wall
(W/m·K)
Water Supply Volume
(kg/h)
1502020.35600
Table 3. Total capacity of the embedded tubes for cooling during the cooling period with various durations for cooling.
Duration for Cooling6 h8 h12 h24 h
Capacity for cooling (kW·h)2721301235334014
Table 4. Total capacity for cooling of the embedded tubes with varying distributions of the cooling time.
Scheme CategoriesScheme 1Scheme 2Scheme 3Scheme 4Scheme 5
Capacity for cooling (kW·h)30122992315432283269
Table 5. Proportions of time at which different operating temperature and PMV intervals occur during the whole cooling period under the scheme using Equation (1).
Thermal Comfort IndexPartition IntervalProportion (%)
Top Floor RoomSecond Floor RoomGround Floor Room
Operative temperature>27 °C000
26–27°C000
25.5–26°C000
23.5–25.5°C14133
23–23.5°C434317
22–23°C434377
< 22°C000
PMV> 0.7000
0.5–0.7000
0.2–0.5000
0.2 to −0.2440
−0.2 to −0.5828246
−0.5 to −0.7141448
<−0.7005
Table 6. Proportions of time that different operating temperature and PMV intervals occur under the scheme using Equation (2).
Thermal Comfort IndexPartition IntervalProportion (%)
Top Floor RoomSecond Floor RoomGround Floor Room
Operative temperature>27 °C000
26–27 °C000
25.5–26 °C320
23.5–25.5 °C9798100
23–23.5 °C000
22–23 °C000
<22 °C000
PMV>0.7000
0.5–0.7000
0.2–0.512112
0.2 to −0.2878793
−0.2 to −0.5126
−0.5 to −0.7000
<−0.7000
Table 7. Total cooling capacities of embedded tubes under various water temperature control schemes.
Control SchemeEquation (1)Equation (2)Constant Water Supply Temperature (19 °C)
Capacity for cooling (kW·h)391428832992
Table 8. Intermittent cooling control schemes and optimization results of other climate zones.
Climate ZoneRepresentative CityOptimization of Cooling DurationOptimization of Cooling Time Distribution
Intermittent Control SchemeOptimal DurationIntermittent Control SchemeOptimal Scheme
Severe cold zoneShenyang
(1)
3 h of continuous cooling: 5:00–8:00;
(2)
4 h of continuous cooling: 4:00–8:00;
(3)
5 h of continuous cooling: 3:00–8:00;
(4)
6 h of continuous cooling: 2:00–8:00.
4 h
(1)
4 h of cooling: 4:00–8:00;
(2)
4 h of cooling: 5:00–9:00;
(3)
2 h on and 1 h off. Cooling time: 3:00–5:00, 6:00–8:00;
(4)
1 h on and 1 h off. Cooling time: 1:00–2:00, 3:00–4:00, 5:00–6:00, 7:00–8:00;
(5)
30 min on and 30 min off. Cooling time: 0:00–0:30, 1:00–1:30, 2:00–2:30, 3:00–3:30, 4:00–4:30, 5:00–5:30, 6:00–6:30, 7:00–7:30.
Scheme 2
Hot summer and cold winter zoneShanghai
(1)
9 h of continuous cooling: 23:00–8:00;
(2)
10 h of continuous cooling: 22:00–8:00;
(3)
11 h of continuous cooling: 21:00–8:00;
(4)
12 h of continuous cooling: 20:00–8:00.
10 h
(1)
10 h of cooling: 22:00–8:00;
(2)
10 h of cooling: 5:00–15:00;
(3)
2 h on and 1 h off. Cooling time: 0:00–2:00, 3:00–5:00, 6:00–8:00, 18:00–20:00, 21:00–23:00;
(4)
1 h on and 1 h off. Cooling time: 1:00–2:00, 3:00–4:00, 5:00–6:00, 7:00–8:00, 9:00–10:00, 11:00–12:00, 17:00–18:00, 19:00–20:00, 21:00–22:00, 23:00–0:00;
(5)
30 min on and 30 min off. Cooling time: 0:00–0:30, 1:00–1:30, 2:00–2:30, 3:00–3:30, 4:00–4:30, 5:00–5:30, 6:00–6:30, 7:00–7:30, 8:00–8:30, 9:00–9:30, 10:00–10:30, 11:00–11:30, 16:00–16:30, 17:00–17:30, 18:00–18:30, 19:00–19:30, 20:00–20:30, 21:00–21:30, 22:00–22:30, 23:00–23:30.
Scheme 2
Hot summer and warm winter zoneGuangzhou
(1)
13 h of continuous cooling: 19:00–8:00;
(2)
14 h of continuous cooling: 18:00–8:00;
(3)
15 h of continuous cooling: 17:00–8:00;
(4)
16 h of continuous cooling: 17:00–9:00.
14 h
(1)
14 h of cooling from 18:00 to 8:00;
(2)
14 h of cooling from 4:00 to 18:00;
(3)
2 h on and 1 h off. Cooling time: 0:00–2:00, 3:00–5:00, 6:00–8:00, 9:00–11:00, 12:00–14:00, 18:00–20:00, 21:00–23:00.
Scheme 2

