Article

Effects of Nanoparticle Additives on Spray Characteristics of Liquid Jets in Gaseous Crossflow

1
Department of Thermal Science and Energy Engineering, University of Science and Technology of China, Hefei 230026, China
2
Research Institute of Chemical Defense, Beijing 102205, China
*
Author to whom correspondence should be addressed.
Energies 2020, 13(7), 1574; https://doi.org/10.3390/en13071574
Submission received: 25 February 2020 / Revised: 28 March 2020 / Accepted: 30 March 2020 / Published: 1 April 2020
(This article belongs to the Section D1: Advanced Energy Materials)

Abstract

:
Nanofluids are attracting attention as future energy carriers owing to their high performance for improving combustion and heat transfer. In this study, the macroscopic characteristics of nanofluid jets in a subsonic gaseous crossflow were investigated by focusing on the influence of nanoparticle additives on the breakup process. Based on a distribution map of the image grayscale standard deviation, we propose an improved method to process transverse injection shadowgraphs. A simplified model of the transition mechanism from column breakup to surface breakup at a small Weber number was established. The effects of nanoparticles on the jet trajectory and column fracture position were analyzed according to the deviations from the pure liquid. To interpret the effects of the nanoparticles, a new nondimensional parameter was introduced into the empirical correlation of the column fracture position. The results indicated that at low concentrations of nanoparticles, the surface tension of the nanofluids increased slightly, while the viscosity increased significantly (by up to 23%). These changes in the physical properties had little effect on the breakup regimes or jet trajectory. Moreover, the nanoparticles promoted cavitation inside the liquid column, resulting in an additional primary breakup mode for the nanofluids. Consequently, the length of the column fracture was reduced by up to 20% compared with that of the basic fluid.

Graphical Abstract

1. Introduction

Liquid injection into a subsonic gaseous crossflow has been widely applied to energy and power systems, such as subsonic–combustion ramjets, lean premixed pre-evaporation low-emission burners, and diesel engines [1,2]. The spray of fuels significantly affects the combustion efficiency, flame stability, and emission characteristics; therefore, studies have been performed on the spray characteristics for decades [3,4]. Regarding the physical complexities of transverse injection, researchers have provided various useful correlations based on experiments to quantify the primary breakup regime, penetration characteristics, and atomization performance [5]. Several reports have indicated that the Weber number of the crossflow (Weg) plays a key role in defining nonturbulent primary breakup regimes [6,7]. The most widely used diagram for partitioning the different breakup modes of transverse injection is the Wegq map, which was proposed by Wu et al. in 1997 [1]. In their report, the primary breakup regimes were classified into four modes: enhanced capillary, bag, multi-mode, and shear breakup. Wu et al. described an interesting aspect of the breakup process—the surface breakup—and provided an empirical correlation of the transition line between surface breakup and onefold column breakup. Subsequently, many different correlations based on experimental data have been reported [8,9]. Broumand et al. summarized these correlations and proposed two boundary lines of the transition area, which are expressed as W e g = 10 k log ( q ) , where k = 3–3.7 [5]. Sallam et al. found that the primary breakup regimes are independent of Oh for low-viscosity liquids and suggested qualitative similarities between the primary breakup of nonturbulent liquid jets in a gaseous crossflow and the secondary breakup of droplets subjected to shock wave disturbances [7]. According to an analysis involving the boundary-layer stripping model, they proposed an expression of the ligament formation time in the shear breakup mode.
Analysis of the jet trajectory is important for evaluating the mixing performance of transverse injection. Several methods have been reported for analyzing the trajectory correlation, including experimental image processing and data fitting [10,11], simplified theoretical analysis of the flow around a cylinder [12], and simulation and interface capture with volume of fluid (VOF) method [13]. In most correlations, the penetration coordinate z/dj is described as an exponential function of the transverse coordinate x/dj and the jet momentum ratio q. A few researchers introduced Weg [14,15] and the viscosity ratio (μLg) [16,17] into the correlation of the trajectory. Moreover, numerous empirical correlations involving the column fracture position have been reported [18,19,20]. The nondimensional fracture position xb/dj is generally in the range of 6–12, and zb/dj is typically calculated according to the correlation of the jet trajectory. Owing to the difficulties in identifying fracture points of different transverse injections, it is necessary to further study the image identification method and the deviation in different breakup modes.
Additionally, nanofluids have been widely studied as a medium for heat-transfer enhancement [21,22]. Recently, a new fuel-modification method, i.e., dispersing nanoparticles of metals, metallic oxides, and C materials into fuel as catalysts, has proven to be effective [23,24,25]. The suspensions, which are called nanofuels, have excellent performance for improving combustion, e.g., an increased combustion enthalpy, increased energy density, reduced ignition delay, and reduced pollutant emissions [26]. It has been shown that mixing fuels with a small amount of nanoparticles (w < 5 wt.%) can increase the fuel economy by 15%–20% while reducing the pollutant emissions by 40%–60% [27]. Although there is no consensus on the relevant regularities and internal mechanisms, this new improved fuel is likely to become a common energy carrier, and can even change the global energy landscape [27]. Compared with fuels with microparticles, nanofuels have better characteristics of heat transfer, diffusion, evaporation, and combustion, owing to the larger specific surface area, better suspension stability, and particular microscopic motion of nanoparticles. Gan et al. found that the combustion of a nanofuel droplet involves two unique phenomena: a surfactant flame and a nanoparticle flame. Pure fuels undergo three common stages: preheating and ignition, classical combustion, and micro-explosion [28]. Miglani and Basu [29] reported that the combustion performance of nano-titania droplets was not enhanced in proportion to the increasing particle concentration. After the concentration reached a certain level, the change in concentration no longer affected the combustion performance significantly. They found that the proper addition of nanoparticles yielded a large number of heterogeneous nucleation sites, increasing the probability of bubble growth inside the fuel. This promoted fuel atomization. However, the redundant addition of particles accelerates the formation of the semi-solid porous shell. The outer casing separates the external free convection and prevents the liquid phase from diffusing to the periphery of the droplet, thereby suppressing the evaporation of the droplet. Therefore, evaluation of the optimal nanoparticle addition amount for each nanofuel is essential.
Most research has focused on the physical properties of the mixture, such as the viscosity and thermal conductivity, as well as the combustion characteristics [30,31,32]. However, there are few reports on the characteristics of atomization, which is one of the key stages affecting combustion. In particular, the effect of nanoparticles on transverse injection has not been reported in the literature until now. Kannaiyan et al. examined the effect of Al2O3 nanoparticles on the swirling spray performance of Jet A-1 fuel [33,34]. Experimental results indicated that the nanoparticles tended to slightly alter the transient nature of the spray formation. During the steady spray state, the nanoparticles increased the jet instability and reduced the column fracture length, while the average size of the atomized particles was reduced. Li et al. recently performed an experiment on the electrostatic atomization of an Al-ethanol nanofuel [35]. They found that as the concentration of nano-Al increased, the density, surface tension, and viscosity increased. Additionally, the nanofuel exhibited better atomization performance when an electrical field was applied. Similar to the addition of nanoparticles, Bolszo et al. added micron-sized water droplets to DF2 fuel and studied the atomization characteristics of the emulsion in air crossflow [36]. According to a dimensional analysis of current physical problems, it was verified that the liquid jet trajectory correlation reported by Wu et al. can successfully predict the penetration of an emulsion jet. An additional primary breakup mode for emulsion spray, which is called the interfacial tension breakup, was discovered to cause the column fracture in advance and influence the droplet size distribution. For the analysis and data fitting of the droplet size, a new nondimensional quantity was proposed to account for the effects of body forces and interfacial tension. This research method provides a good reference for the transverse injection of nanofluids.
It has been reported that the addition of nanoparticles to basic fluid can induce changes relevant to the atomization process, including changes in the physical properties and spray characteristics, such as the viscosity, surface tension, cavitation, and velocity distribution. Therefore, the detailed effects of these changes on fuel atomization deserve further study. In light of the meaningful physical problems and current research gaps, the effects of alumina nanoparticle dispersions on the transverse injection of water were examined in this study. A series of experiments were performed at room temperature and the atmospheric pressure. The macroscopic spray characteristics and primary breakup regimes were investigated, mainly via high-speed shadowgraphs and statistical image processing of the grayscale standard deviation (SD).

2. Materials and Methods

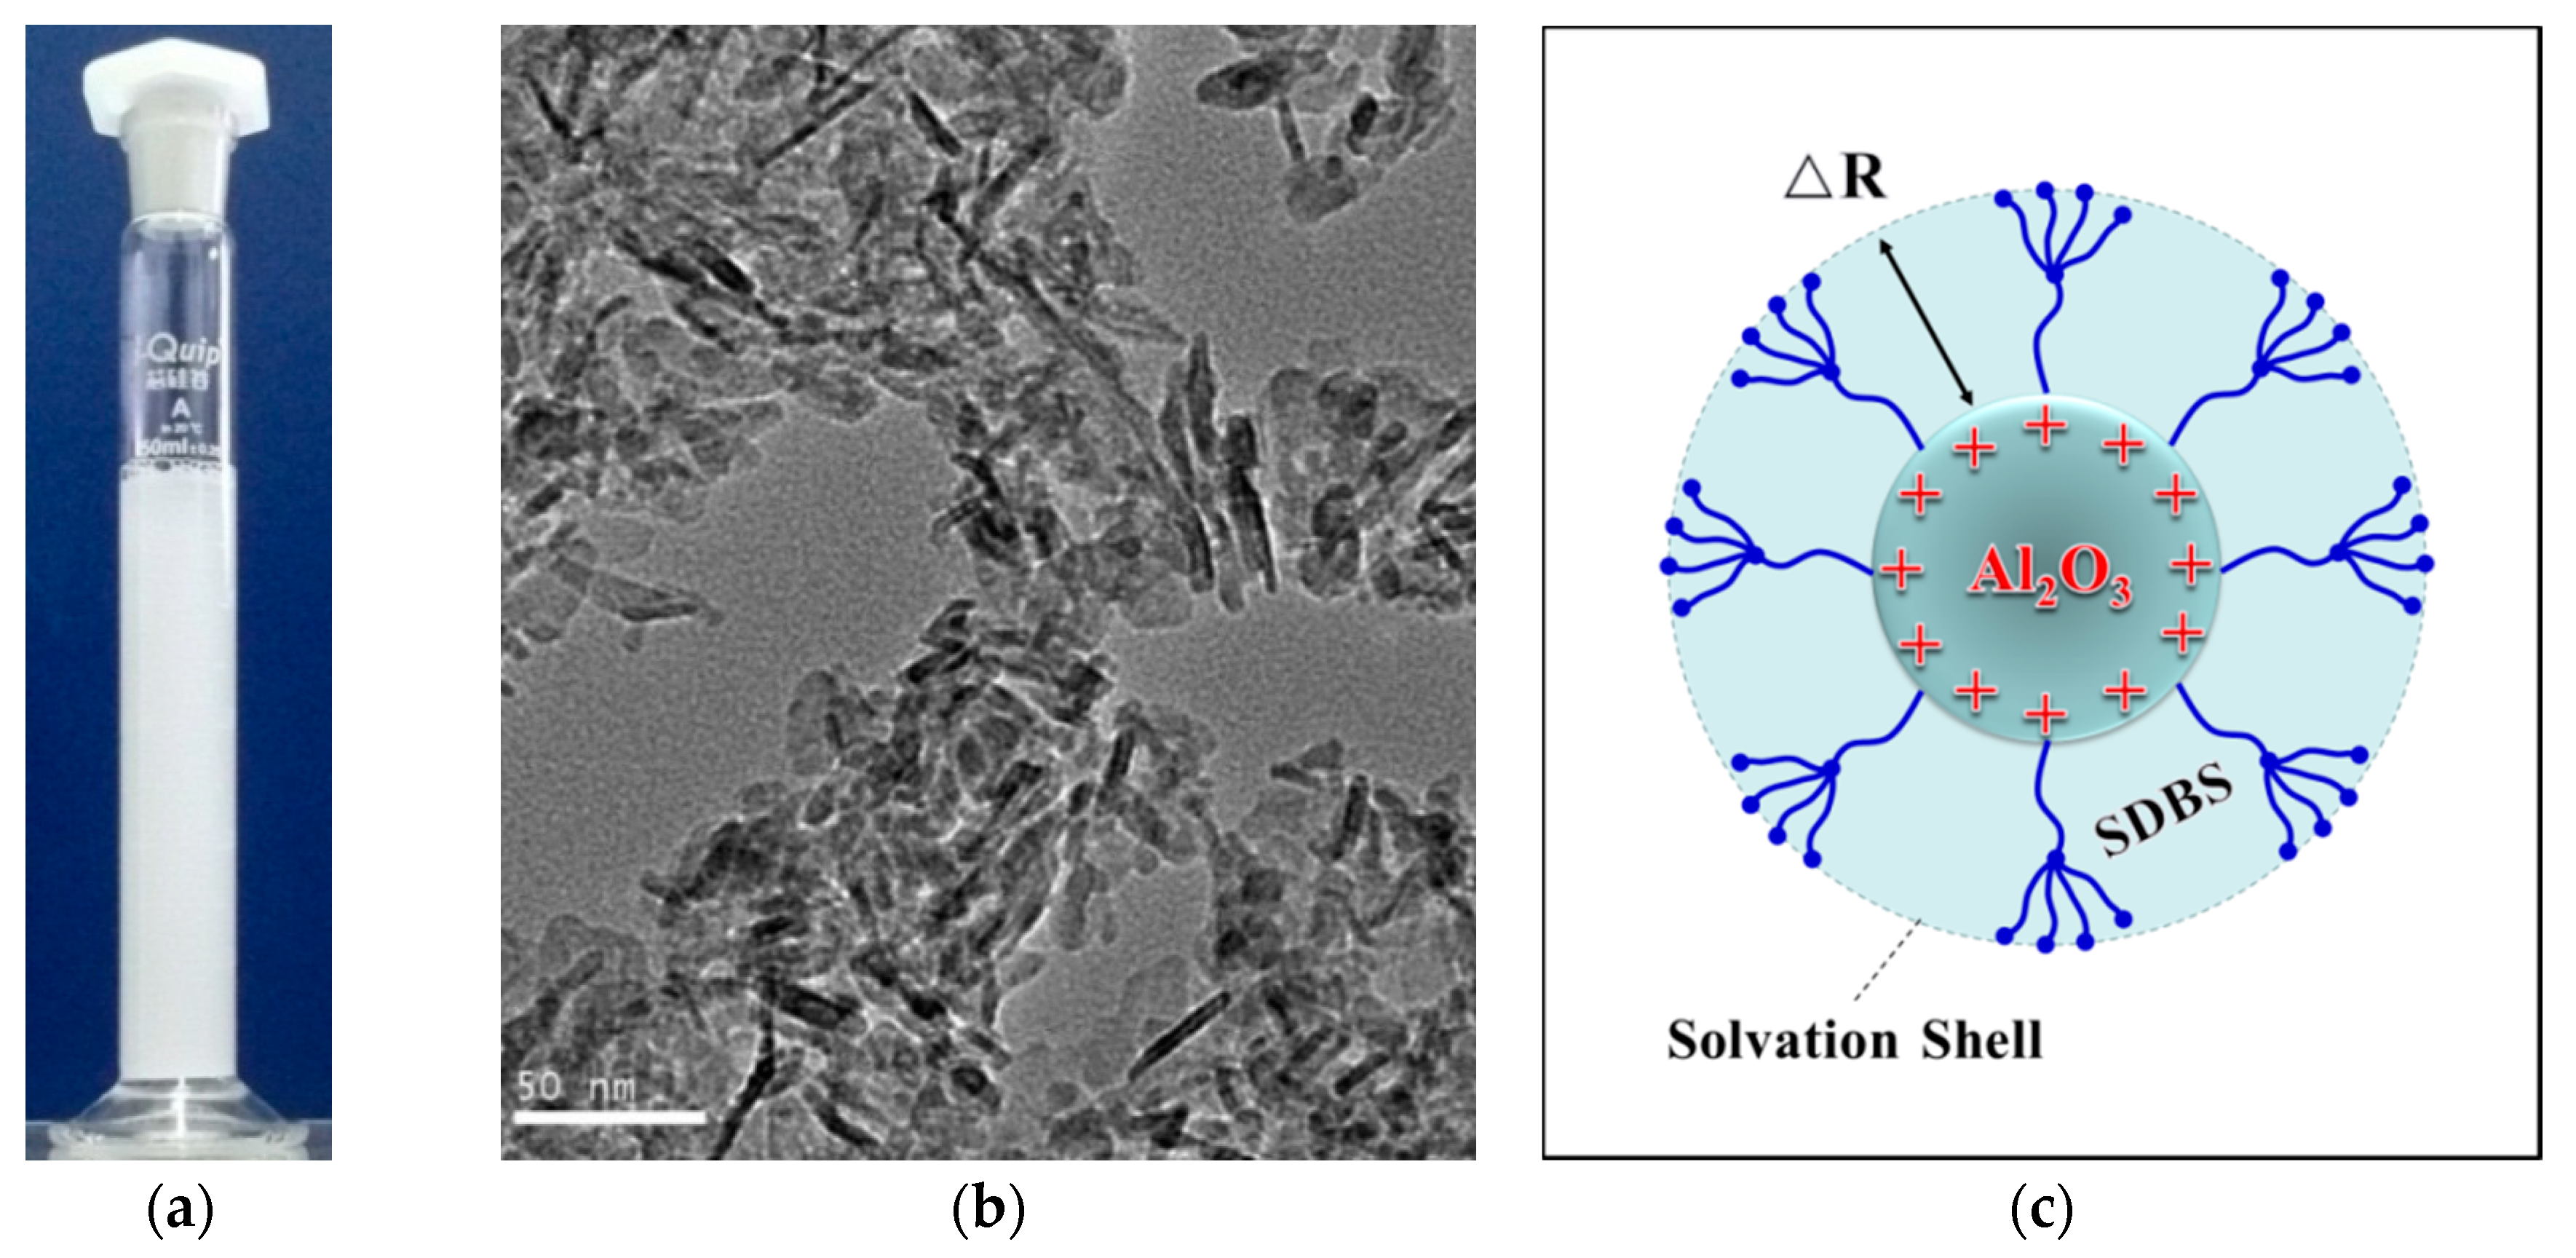
2.1. Preparation and Properties of Nanofluids

Alumina nanoparticles of the γ crystal form (γ-Al2O3) with high catalytic activity were selected as the additives. They had an average diameter of 20 nm and a true density of 3.97 g/cm3 (Shanghai Aladdin Biochemical Technology, Inc., Shanghai, China). As repeated spraying was involved, deionized (DI) water (Shanghai Macklin Biochemical Co., Ltd., Shanghai, China), instead of fuel, was selected as the injection liquid. Sodium dodecylbenzene sulfonate (SDBS) was used as a surfactant to improve the suspension stability (Shanghai Aladdin Biochemical Technology Inc.).
Al2O3-H2O nanofluids were prepared via a well-known two-step method. First, to simplify the comparison of fluids with different nanoparticle concentrations, SDBS at a fixed proportion of 0.2 wt.% was added to DI water (called the “basic fluid”), according to a dispersion stability test. Subsequently, the mixture was mechanically stirred for 20 min at a suitable rotation speed (approximately 600 rpm, to avoid a large amount of foam). Finally, a certain proportion of alumina nanoparticles were added in, and ultrasonic dispersion was conducted for 40 min (Scientz-2400F ultrasonic disperser, Ningbo Scientz Biotechnology Co., Ltd., Ningbo, China). The optimized dispersing conditions were an ultrasonic frequency of 20 kHz, power of 960 W, and a water bath temperature of 25 °C. In a turbidity test for dispersion stability evaluation, the prepared nanofluids exhibited no stratification or sedimentation over 4 h (as shown in Figure 1). With the addition of SDBS as an anionic surfactant, the alumina nanoparticles were well dispersed in water in a stable structure of the electron double layer.
The density of the nanofluids was calculated according to the mixing rule, i.e., ρ n f = φ ρ p + ( 1 φ ) ρ L , while the effect of the surfactant was disregarded. The viscosity was measured using a rotational viscometer (LVDV-1T, Shanghai FangRui Insurument Co., Ltd., Shanghai, China). The surface tension was measured via the pendant-drop method (Dataphysics OCA25, DataPhysics Instruments GmbH, Filderstadt, Germany). A single test was performed, with 3–5 repeated measurements for data reliability. The equation for converting the mass fraction of nanoparticles into the volume fraction is φ = ρ L / ( ρ p / w + ρ L ρ p ) .
The liquid properties are presented in Table 1 and Figure 2.
The test results indicated that both the viscosity and surface tension of the nanofluids increased with an increase in the concentration of nanoparticles. With the addition of 0.51 vol.% nanoparticles, the surface tension of the Al2O3-H2O nanofluids increased with a maximum ratio of 2.6% relative to the basic fluid.
The surface tension depends on the physical and chemical properties of dispersions, nanoparticles, and surfactants, as well as their mixed states. The increase in the surface tension in current experiment was attributed to the higher surface free energy of the nanofluids relative to the basic fluid. The reason for this at the microscale is that alumina nanoparticles tend to accumulate at the water–air interface, which increases the van der Waals attraction between them [37]. A small amount of surfactant significantly affected the surface tension. The surface tension of the basic fluid was 55% lower than DI water, which may significantly affect the liquid breakup.
The increase in viscosity is attributed to additional Brownian motion, stronger van der Waals forces, etc. As previously reported [38], even nanofluids with a small amount of nanoparticles are Newtonian fluids. In the present experiment, the viscosity of the Al2O3-H2O nanofluids increased significantly, by up to 23%. For a sparse suspension (φ < 2%), Einstein proposed a classical viscosity model [39]: μ n f / μ b f = 1 + 2.5 φ . For nanoparticles, the actual volume fraction increases owing to the formation of a solvation shell (as shown in Figure 1). Thus, the calculation model needs to be partly modified. Combined with the experimental data, the new correlation is:
μ n f μ b f = ( 1 + 2.5 × 14.9 × φ ) · ( 1 + 1.9 × d m 0 d p 0 ) R 2 = 0.95
where, dp0 represents the mean diameter of monodispersed nanoparticles (20 nm), and dm0 represents the equivalent diameter of water molecules (0.39 nm), which is calculated as follows:
d m 0 = ( 6 M N π ρ 0 ) 1 / 3
where M represents the molar mass of water molecules, N represents Avogadro’ s constant, and ρ0 represents the water density at 293 K.
Compared with the classical equation, the equivalent volume fraction is changed to 14.9φ, and the thickness of the solvation layer is calculated as 2 Δ R / d p 0 = 1.46 . This parameter is used later in the breakup analysis.

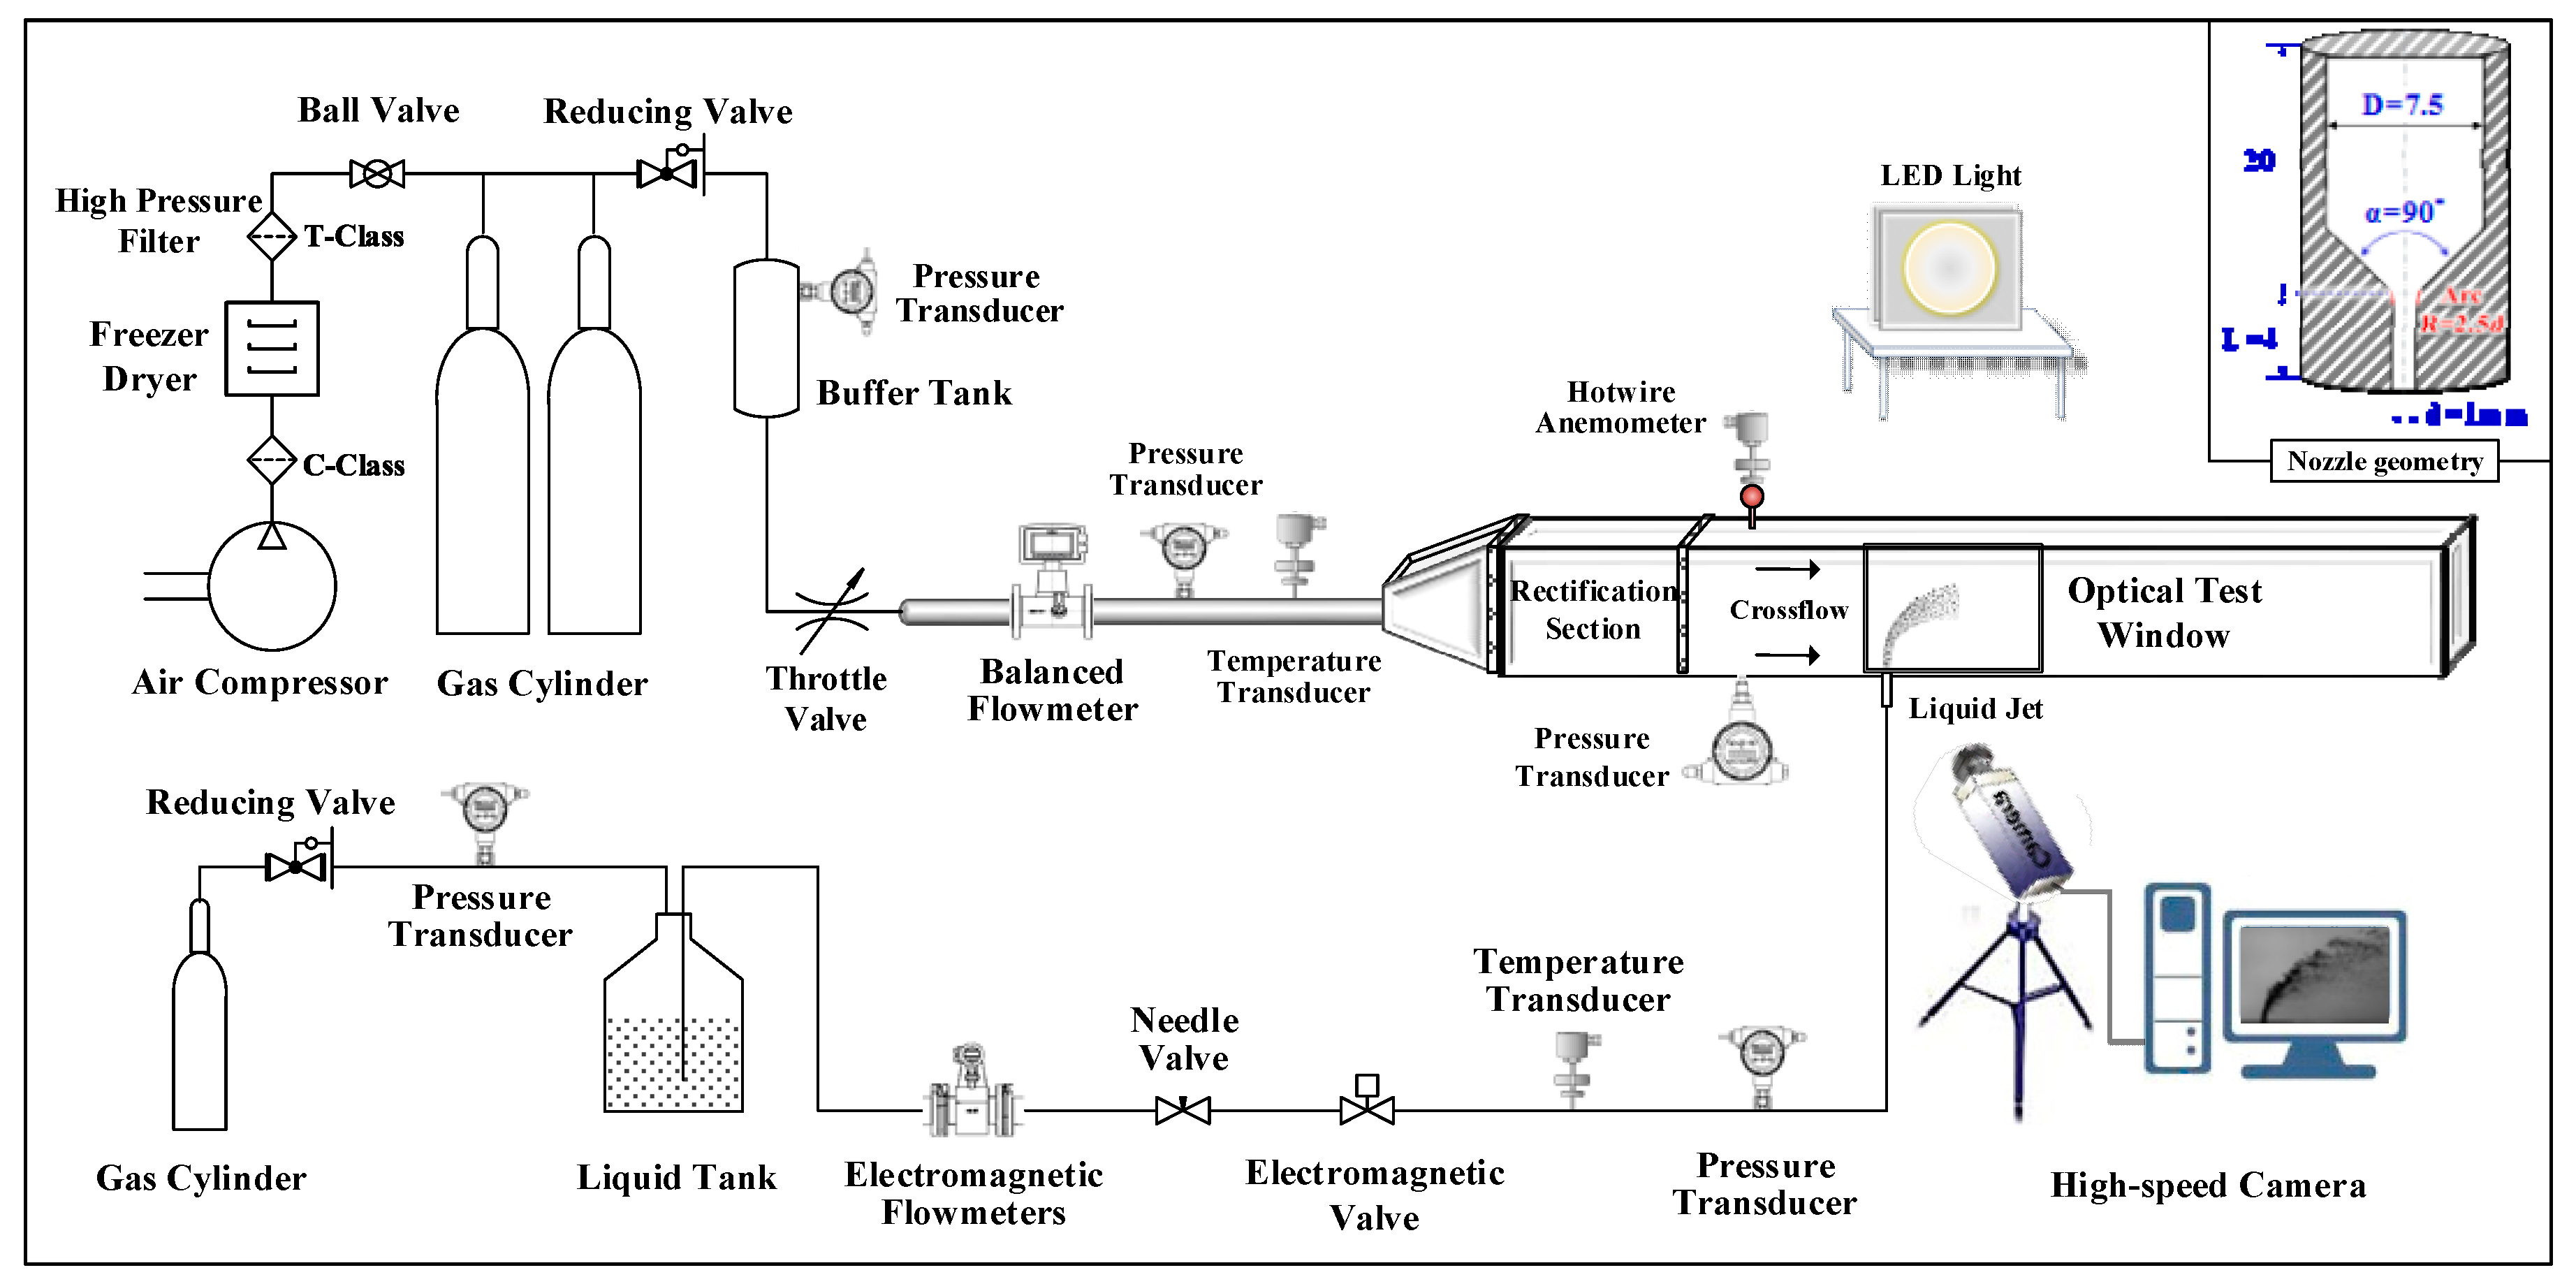
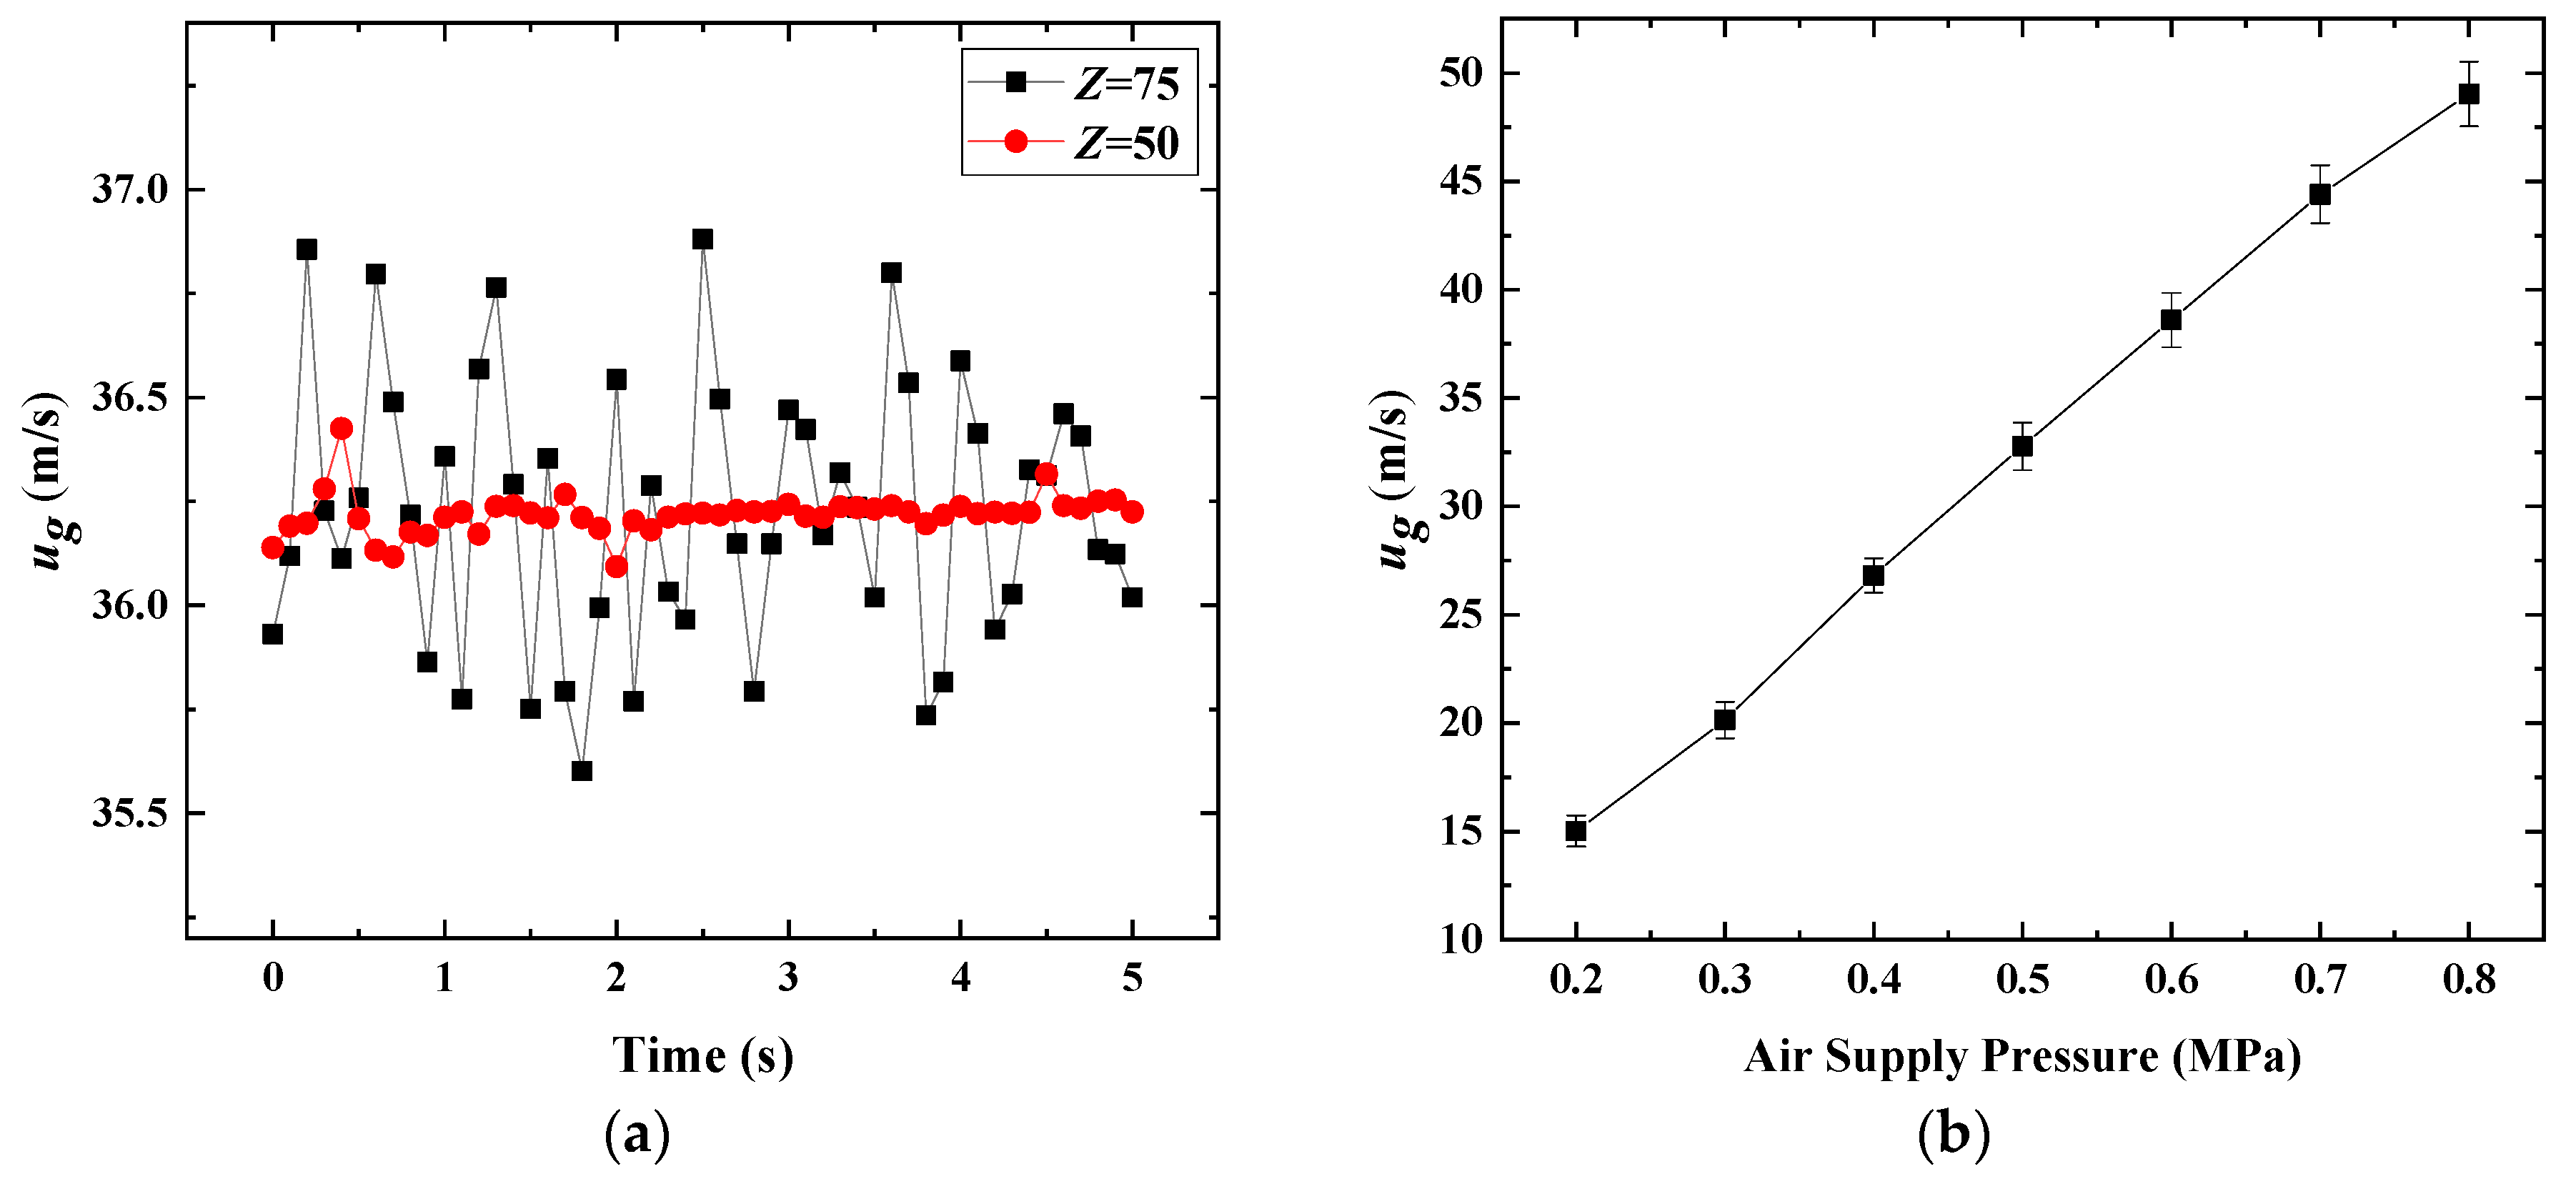
2.2. Spray Experimental Facility

As shown in Figure 3, the experimental system mainly comprised three parts: a liquid spray unit, an airflow control unit, and a shadow imaging unit. The spray unit provided continuous liquid injection through a multifunctional pressure tank (5 L/1 MPa). The flow rate of the nanofluids was adjusted by a needle valve and measured using an electromagnetic flowmeter (RONK DN4, Chongqing Sichuan Instrument Co., Ltd., Chongqing, China). A high-precision pressure sensor was used to monitor the injection pressure. To inhibit extra interferences from cavitation and turbulence, a conical nozzle with a length/diameter ratio of 4 was used as described by Wu et al. [1] (Figure 3). With reference to the conclusion of Faeth et al. [40], a sufficiently long straight pipe section (length-to-diameter ratio of 40) was arranged upstream of the nozzle inlet. Therefore, the flow in the tube was fully developed, and the liquid at the nozzle inlet was uniform in all directions.
The airflow control unit uses a large-capacity gas tank (2000 L/4 MPa) for air supply. After filtration and drying using a cold dryer, the tank was filled with air by an uprated compressor. The airflow was precisely controlled using a decompressor group, buffer tank, and throttle valves. A multi-hole balance flowmeter (RONK DN65) was used to monitor the airflow rate, and a hot-wire anemometer (MODEL 8465, TSI Incorporated, Minnesota, USA) was installed in the test section for calibration. To obtain a uniform air crossflow, three rectifying nets were arranged at different connections of the variable cross-section upstream. The cross section of the test zone was rectangular, with a size of 100 × 75 mm2, and there was a transparent window made of quartz glass with a size of 100 × 200 mm2. A high-speed data collector was used to obtain the real-time flow status, including the pressure, temperature, flow rate of the airflow and liquid jetflow. To verify the stability of the air crossflow, a TSI 8465 sensor was used to measure the air velocities at two different positions under an air supply pressure of 0.6 MPa. One position was the center of the air-duct cross section, directly above the nozzle exit (Z = 50), and the other was 75 mm above the nozzle exit (Z = 75).
As shown in Figure 4, the average airflow velocities at these two locations were highly close (36.224 and 36.218 m/s), and they changed little within 5 s, indicating that the airflow had good spatial uniformity and time stability. The air velocity in the central area of the duct was relatively stable (with an SD of 0.03 m/s), while the velocity near the wall exhibited large fluctuations (with an SD of 0.26 m/s), which was mainly caused by disturbances due to the boundary layer. Additionally, the average velocity and its SD were calculated via three repetitive tests at different air supply pressures. The maximum deviation was <4%, indicating the good reliability of the air supply system.
Experiments were performed at room temperature and the atmospheric pressure. The test conditions are presented in Table 2.
The shadow imaging unit consisted of a high-speed complementary metal–oxide semiconductor camera (Phantom V2640, Vision Research Inc., New Jersey, USA), a light-emitting diode (LED) (1000 W), and a homogenizing plate. A Nikon macro-lens (100 mm, f2.8D, Nikon Corporation, Tokyo, Japan) was installed on the camera. Spray shadowgraphs were obtained at a frame rate of 4000 fps and an exposure time of 5 μs, and the size of each image was 2048 × 1952. After calibration with a Vernier caliper, the size of a single pixel was 91.7 μm. To obtain well-focused images of the spray plume distributed across the entire cross section, the aperture was adjusted to obtain a suitable depth of field, while a sufficient light input was ensured during exposure.

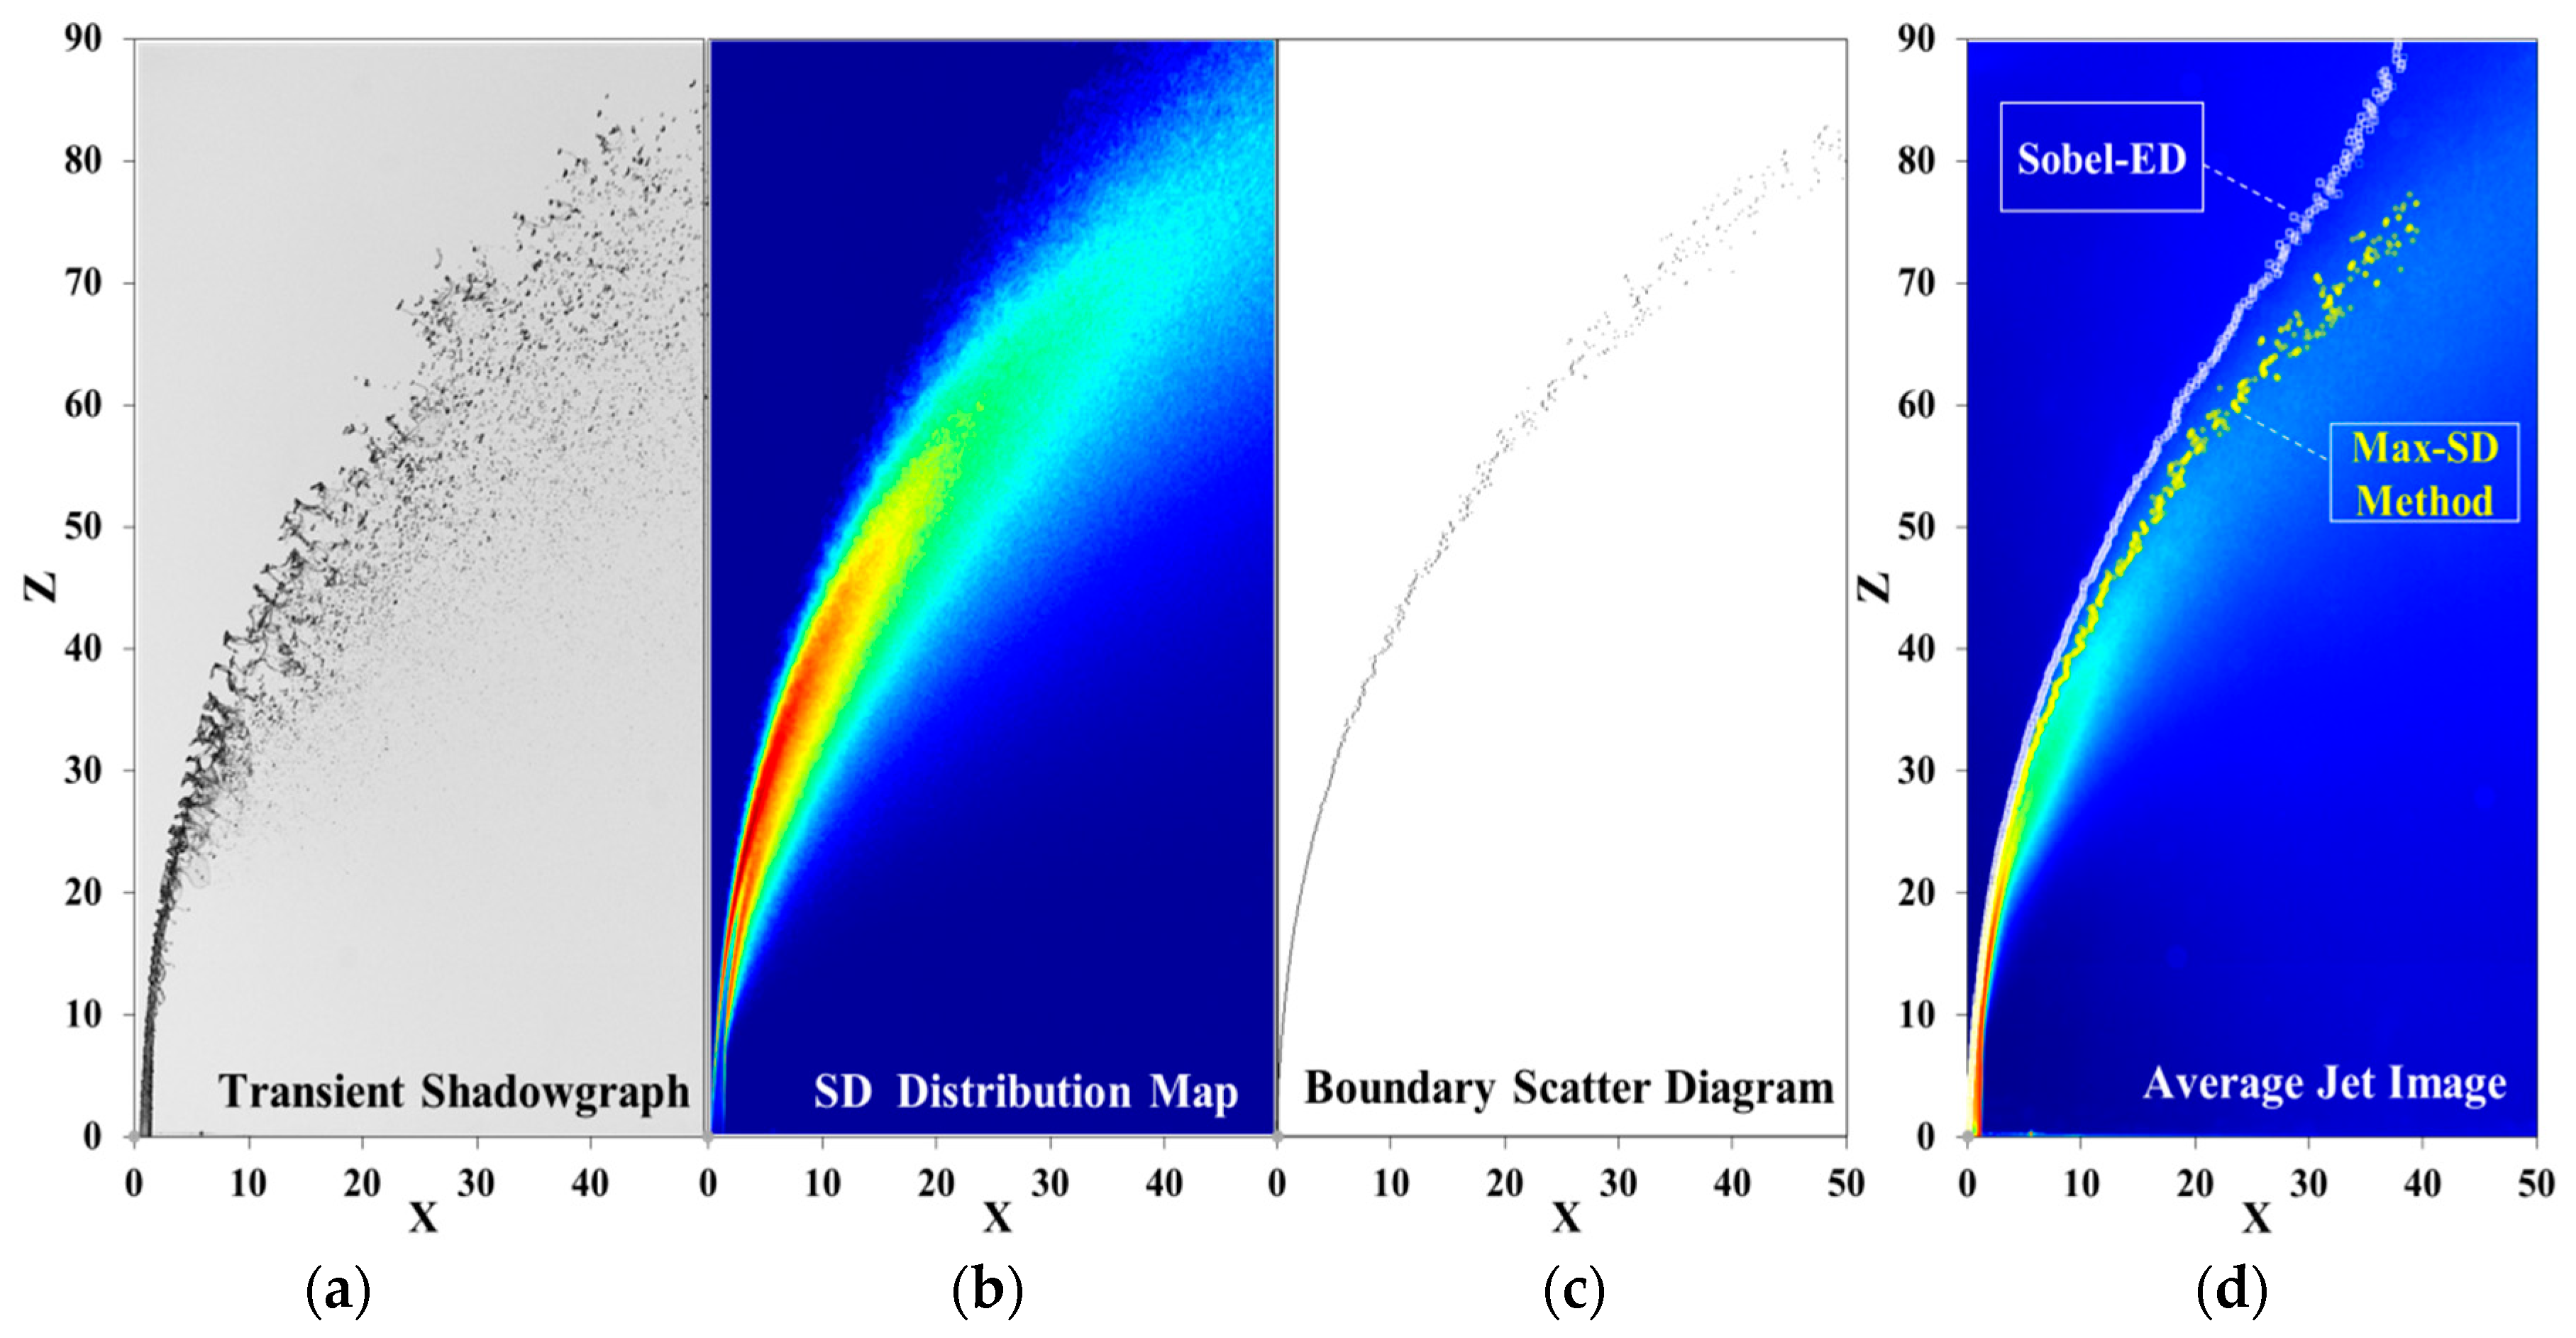
2.3. Image Processing

To counteract the interference of random jet oscillation, 1000 transient shadowgraphs of the stable jet flow with a time interval of 1 ms (one image selected every four frames) were captured and statistically processed.
First, an image-processing method for the jet boundary was established and verified, as shown in Figure 5. Referring to the method proposed by Kannaiyan et al. [33], we established a distribution map of the maximum grayscale SD to identify the boundary of a transverse jet (Max-SD method). Because the liquid column was unstable and oscillated, the zone near the boundary was occupied with liquid and air by turns. The corresponding gray value of the shadow image changed more sharply than that of other locations. Therefore, the maximum of the grayscale SD can be used to indicate the boundary position. The image-processing steps are as follows.
First, statistics were obtained for 1000 shadowgraph frames with an interval of 1 ms and a total duration of 1 s. The grayscale SD (i, j) corresponding to each spatial pixel cell (i, j) at 1000 different times were calculated. Additionally, the spatial distribution map of the SD (i, j) was drawn (Figure 5a). Subsequently, by scanning point-by-point along the lines parallel to the X-axis, the maximum SD value and its location (i1, j1) were recorded for each line. Finally, the distribution map of the maximum SD positions was drawn in the form of a binary image (Figure 5b). Almost all the maximum-SD points were distributed in the upwind boundary of the transverse jet. This is attributed to two factors: first, the upwind boundary oscillated more intensely than the downwind boundary; second, the grayscale contrast in the downwind boundary was reduced by the nearby surface breakup.
To verify the accuracy of the Max-SD method, the classical method of Sobel edge detection was adopted (Sobel-ED method). Referring to the method reported by Bolszo et al. [36], the average grayscale image was first obtained using the statistics for 1000 shadowgraph frames. An optimal threshold was then determined via the maximum interclass variance method (using “graythresh” function in MATLAB), and the average image was converted into a binary image according to this threshold. Finally, the Sobel operator was used for edge detection to obtain a jet boundary image.
The jet boundaries obtained via the Max-SD and Sober-ED methods were plotted on the average jet shadowgraph (Figure 5c). The boundary curve obtained via the Max-SD method exhibited closer agreement with our expectations and the parabolic characteristics. Compared with the Sobel-ED method, the Max-SD method is usually more efficient. This new method does not require an additional process to filter out the interference due to the background and noise and is not affected by threshold selection.
Second, a new identification method for the liquid-column fracture location was established and verified, as shown in Figure 6. The fracture position was obtained using the contour map of the grayscale SD (SD-contour method). Because of the flow instability, the fracture position of the liquid column normally did not correspond to a precise point; statistically, it should correspond to a zone. The liquid in this area changed from a continuous cylinder to discrete ligaments or droplets. This morphological transformation affected the grayscale SD of the jet shadowgraphs. The objective of the SD-contour method is to determine the central position of the aforementioned area.
On the SD contour map, the liquid column is the main body in the area surrounded by the upwind and downwind boundary lines, which corresponds to a series of maximum SD values on the upper and lower sides, respectively. In the outer zone of the boundaries, the broken liquid ligaments or droplets are the main body. The contour line closest to the downwind boundary line connects the surface breakup zone on the right to the liquid-column fracture zone on the top. After the SD contour map is uniformly transformed into a 0–255 grayscale image, this contour line can be used to indicate the starting position of the liquid-column fracture. In this study, the nearest contour line outside the downwind boundary was tracked. The detection point was moved up to the intersection area of the upper and lower boundaries to determine the column fracture location, as shown in Figure 6a. In identifying the fracture position via the SD-contour method, the distance between the two adjacent contour lines affects the location precision. Thus, to reduce the deviation, the contour lines were drawn with a sufficient density, and the number of lines was kept constant (30 lines) in the processing.
To verify the accuracy of the SD-contour method, a classical method was also adopted. Here, an image-processing program was used to search for the break point, replacing the human eye. McDonell et al. [41] proposed searching for the fracture location by tracking the jet trajectory on transient shadowgraphs, as shown in Figure 6b. This is called the TT-Search method.
The processing results of the TT-Search method and the proposed SD-Contour method are plotted in Figure 6c. Under different Weg values and nanoparticle concentrations, the trends of the two groups of data were consistent, and the differences between them were small. Therefore, the reliability of the SD-contour method is comparable to that of the TT-Search method. Furthermore, SD-Contour method does not need additional process to filter out the interference from background, as well as is not affected by threshold selection.
Third, to verify the convergence of the Max-SD and SD-Contour methods, the effects of the sample size of the shadowgraphs on the processing results were examined, as shown in Figure 7. 200–1000 samples were selected for image processing, and the results for the upwind jet boundary were essentially the same between the two methods when the number of images reached 200. The column fracture position Xb converged when the number of samples reached 600, which was consistent with the trend of the maximum SD. Therefore, in this study, 1000 shadowgraphs with 1-ms intervals were selected to ensure good convergence.

3. Results and Discussion

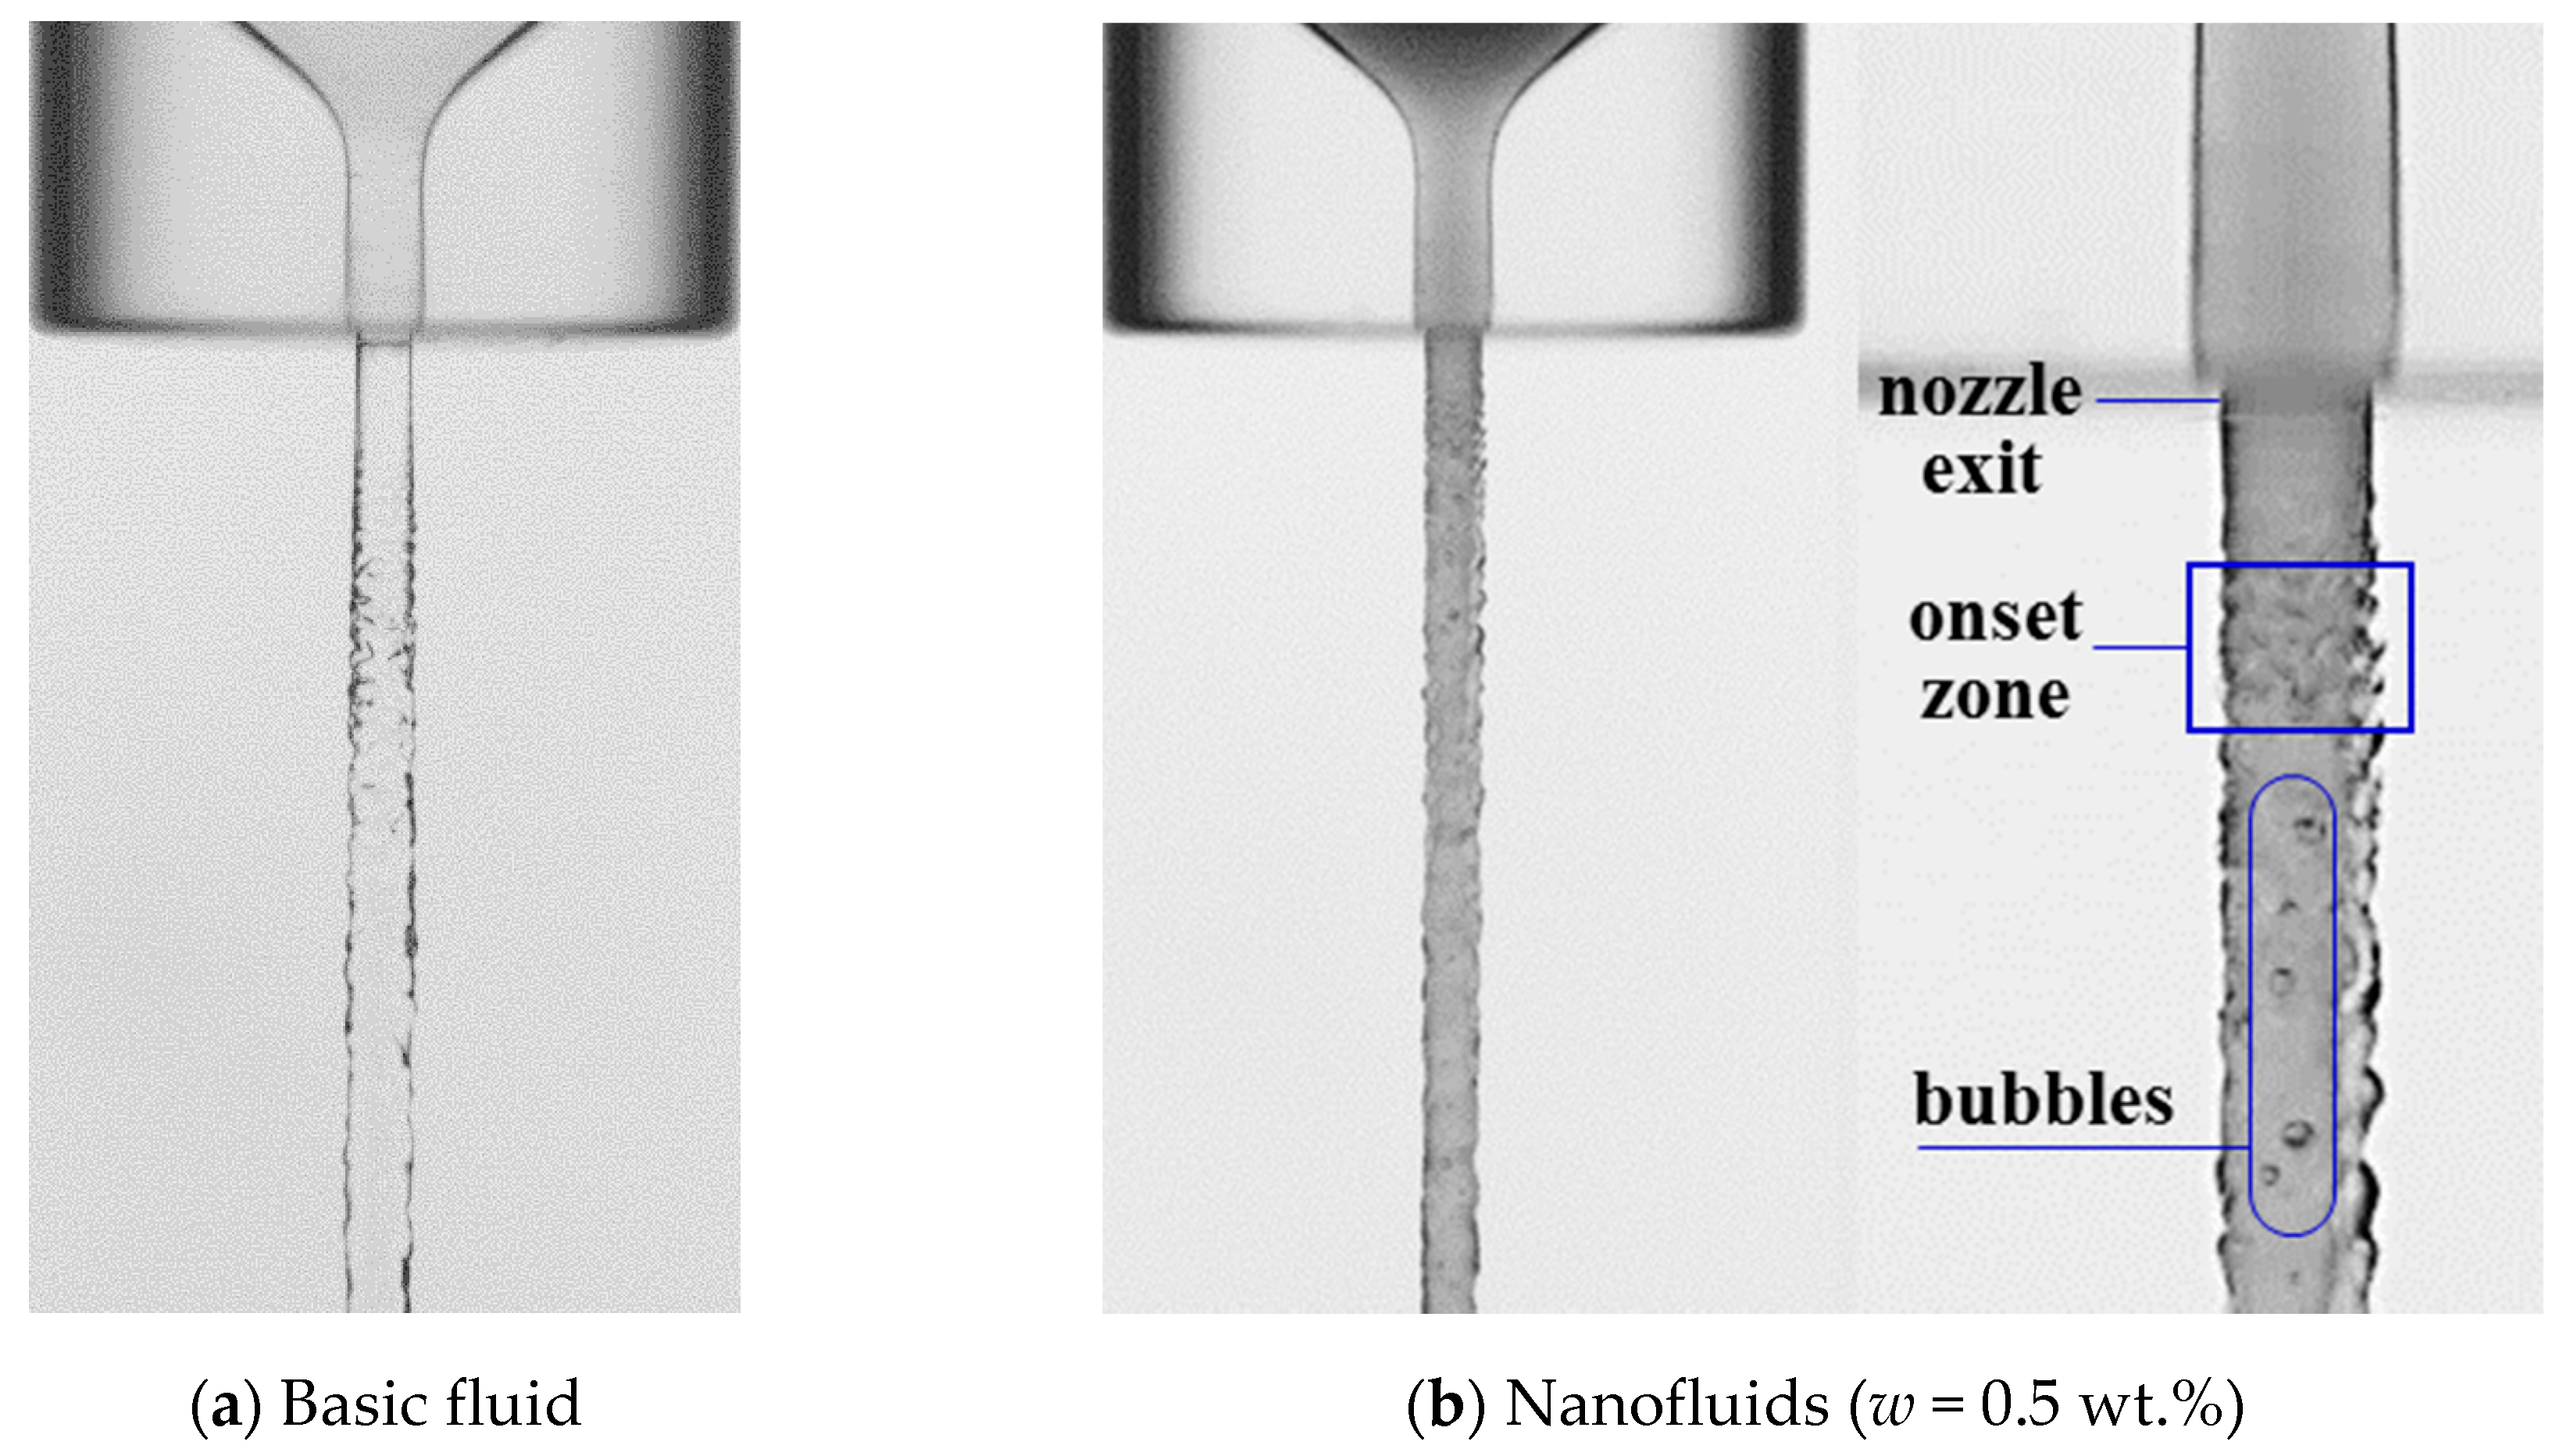
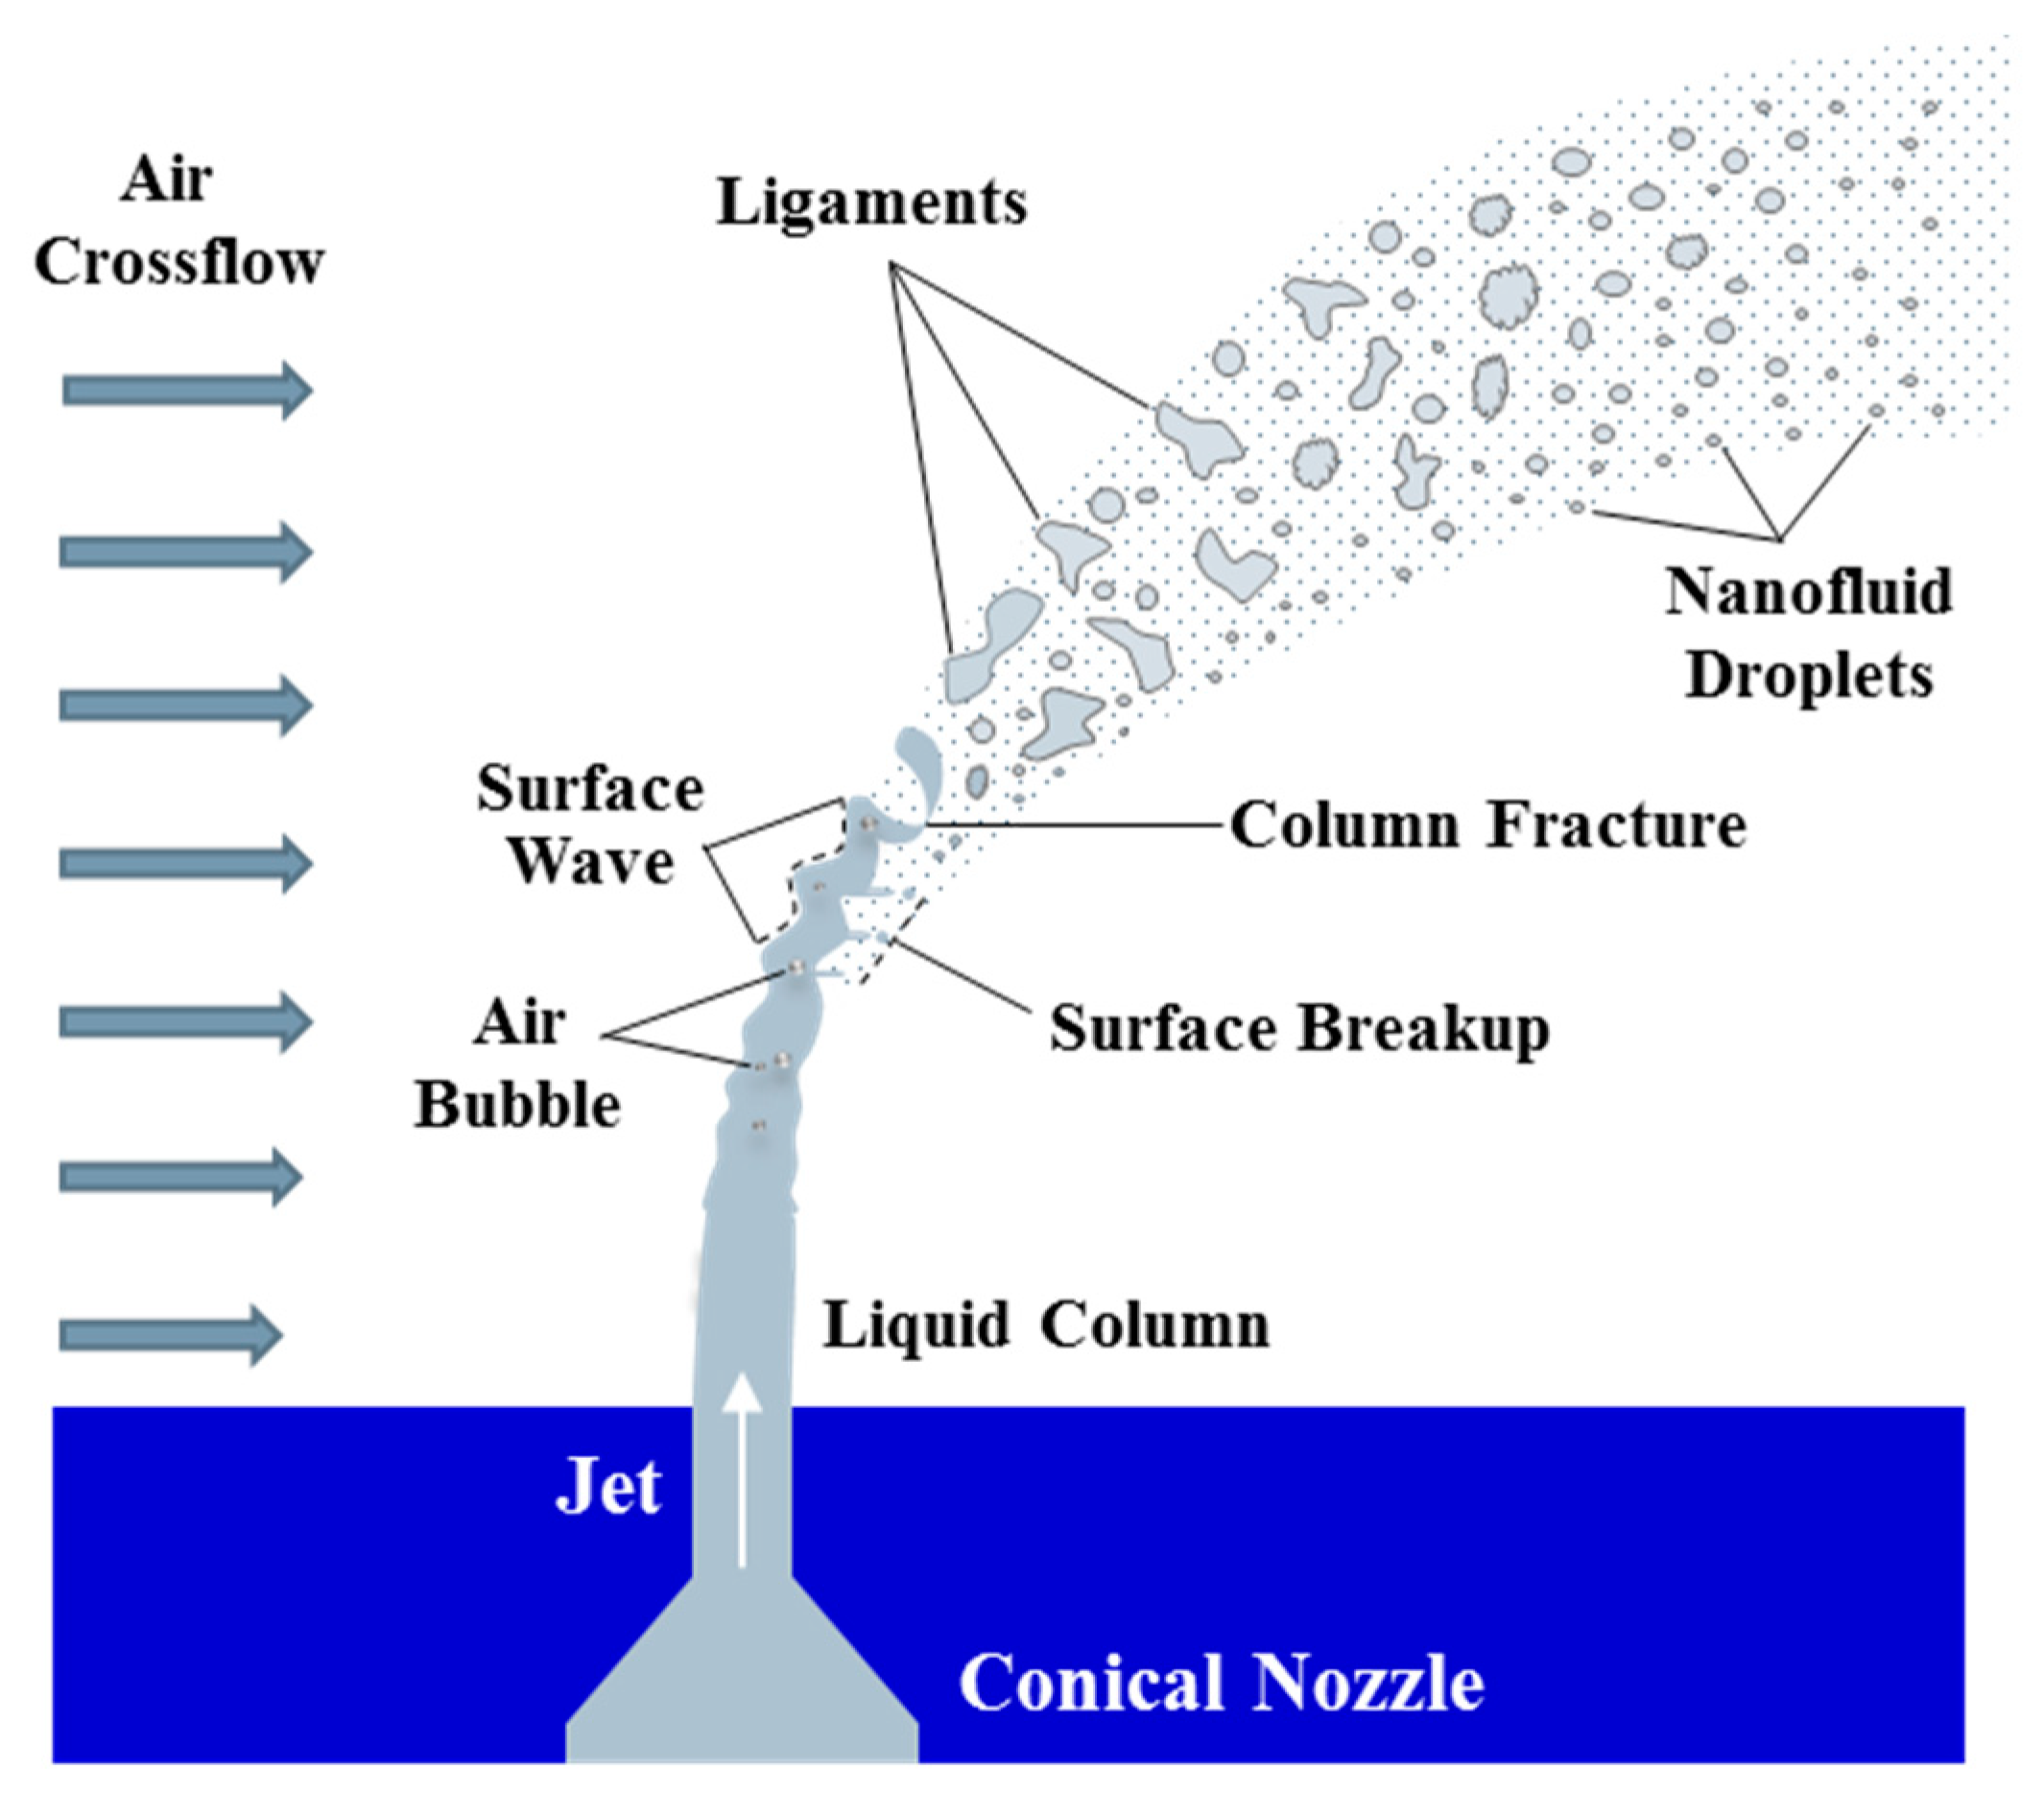
3.1. Flow Visualization

To verify the flow regime of injection from the nozzles used in the present study, a typical shadowgraph of the jet without a crossflow (u = 0, Rej = 15085) was examined, as shown in Figure 8.
The surface of the liquid column was relatively smooth, with only a slight waveform disturbance. No droplet generation was observed before the liquid traveled a distance 30 times the jet diameter. Thus, the injection was characterized by a nonturbulent flow. In the experiments, as Weg increased from 16.3 to 100.7, the breakup mode of the basic fluid changed from bag breakup to multi-mode breakup and then to shear breakup. For nanofluids with a concentration of 2.0 wt.%, a critical state between the enhanced capillary breakup and the bag breakup was observed at Weg = 15.3. Overall, the spray morphology of the Al2O3-H2O nanofluids was almost identical to that of the basic fluid, although lower light transmittance was observed for the nanofluid jet. (For more details, a few typical videos of the jets can be seen in the Supplementary Materials.)

3.2. Breakup Regimes

To investigate the differences in the primary breakup regime due to the nanoparticles, a Wegq regime map was drawn for all the liquids, as shown in Figure 9. The results were consistent with those reported by Wu et al. [1]. In the map, the critical Weg of water, basic fluid, and nanofluid overlapped, indicating that the nanoparticles had no effect on the transition of breakup modes.
The transition from column breakup to surface breakup is an important topic. In the surface breakup mode, the early stripping of liquid ligaments significantly affects the formation and distribution of fine droplets on the downstream side, as well as the development of surface waves at the upwind boundary.
An auxiliary method was also proposed to distinguish the surface breakup from the column breakup, as shown in Figure 9. According to the SD contour map, all images with similar q values (i.e., the jets with similar trajectories) were combined to compare the breakup starting positions near the downwind boundary. The starting positions could be essentially divided into two types: the positions at a small Weg were significantly higher (corresponding to column breakup), and the positions at a large Weg were significantly lower (corresponding to surface breakup). In some cases, the starting positions obtained from 3–4 repetitive tests were not uniform. Some of them were slightly higher and some were lower, and the cases corresponded to a mixed breakup mode.
Several different empirical correlations of the transition curve have been proposed. However, no relevant analysis of the internal mechanism or mathematical description has been reported thus far. The physical mechanism underlying this transition is discussed below.
Whether surface breakup occurs before liquid-column fracture is determined by the relative speeds of the two processes. When the speed at which ligaments were stripped from the sideways boundary layer exceeded the speed of disturbance development along the liquid jet, a surface breakup mode was observed. When transverse injection was conducted at a small Weg (15 < Weg < 100), the spray exhibited bag breakup or multi-mode breakup. In this case, the surface wave generated by aerodynamic instability gradually developed into a column wave, which affected the entire shape of the jet. Consequently, the jet trajectory changed from a smooth parabola to a U-type wave form with a wavelength of λc (as shown in Figure 10a).
The liquid column was significantly deflected under the drag force of a crossflow. An additional force caused by relative motion cannot then be neglected, and was relevant to the injection initial velocity uj. Moreover, the windward area of the liquid column gradually increased as the cross section was compressed from a circular shape to an elliptical shape. Therefore, the total aerodynamic force continuously increased along the jet flow direction. A liquid column unit with a single wavelength was selected for force analysis.
When the aerodynamic force (Fa) exceeded the surface tension of both ends (2Fσ), the liquid-column fractured. Therefore, the critical state of column breakup should satisfy the following condition:
F a = 2 F σ  
F a = 1 2 C D S 1 ρ g u g 2
Here, S1 represents the windward area of the liquid column:
S 1 = d m a x h ,   h = 1 2 λ c
According to an analysis of the Rayleigh–Taylor instability performed by Ng et al. [42], λc is expressed as:
λ c d j = C λ 6 π 3 C D W e g 0.5 ~ W e g 0.5
Because the variation range of the current air velocity was relatively small, the drag coefficient CD-round was considered as a constant, with reference to the results of Wu et al. [1].
The drag coefficient CD changes with the deformation of the liquid column. Considering the similarity between the primary breakup of a transverse jet and the secondary breakup of a droplet [7], a simplified model of the droplet drag coefficient was cited, which was proposed by Reitz et al. [43]:
C D C D r o u n d = 1 + 2.632 [ 1 ( d j d m a x ) 2 ]
Here, CD-round represents the drag coefficient of the liquid column with a circular cross section. It was treated as a constant within the Reynolds-number range of this study.
The equivalent velocity of air crossflow ug at the position of column fracture is given as:
u g = u sin θ + u j cos θ
Here, θ represents the angle between the X-axis and the tangent of the jet trajectory at the fracture point.
According to a mechanical analysis performed by Wu et al. [1], the theoretical jet trajectory (simplified as air flowing around a circular cylinder) can be described as follows:
Z = A X q
The X-position of the column fracture is   X b = C X .
Here, both A and CX are constants. Thus:
tan θ = d Z d X | X b = 1 2 A X b 0.5 q 0.5 = B q
where the constant B is given by B = 1 2 A C X 0.5 . Hence,
sin θ = 1 1 + 1 / tan 2 θ = B q 1 + B q ,   cos θ = 1 1 + tan 2 θ = 1 1 + B q
Because the variation range of the physical parameters for the current fluids was relatively small, to simplify the analysis, ρLg, μLg, and σ were considered as constant.
By substituting S1 and ug for the aforementioned expressions into Equation (4), Fa can be approximated as follows:
F a = 1 2 C D d m a x h ρ g ( u sin θ + u j cos θ ) 2   ~   C D 0.5 W e g 0.5 q 1 + B q σ d m a x
Moreover, Fσ can be expressed as:
F σ   ~   σ l c
Here, lc represents the cross-sectional perimeter of the liquid column. Under significant deformation, the cross section can be simplified as a rectangle:
l c 2 ( d m a x 2 δ + d i )
In contrast, surface breakup was regarded as a process of ligaments being stripped from the boundary layer, and the mechanism was similar to Rayleigh breakup. The boundary layer on the front and rear sides developed and accelerated continuously, accompanied by deflection and deformation of the liquid column. When the momentum of the liquid in the boundary layer exceeded the surface tension of a ligament with a size of δ, surface breakup occurred. According to an analysis performed by Sallam et al. [7], the mechanism can be expressed as follows:
δ d j C l μ L / μ g W e g = B 2 W e g 1 2 ,         B 2 = C l μ L μ g
The surface breakup time tli can be expressed as:
t l i = C t μ L / μ g W e g · d j 2 ν L = C t d j 2 ρ L μ g 1 W e g ~ W e g 1
where B2, Cl, Ct, d, ρL, and µg are constants.
The development distance of the boundary layer (ul·tli) should be equivalent to the short-axis length di of the liquid-column cross section. Therefore:
d i d j   ~   u l · t l i d   ~   u W e g 1   ~   W e g 1 2     ~   δ d j
Hence, a constant B1 and B2 can be introduced. We obtain:
d i d j = B 1 W e g 1 / 2 ,   δ d j = B 2 W e g 1 / 2
Moreover, according to the mass conservation law, the cross-sectional area of the liquid column should change slightly. Subsequently:
S c i r c l e = π 4 d j 2 S e l l i p s e = π 4 d m a x d i
By introducing Equations (12)–(19) into Equation (3), a final correlation is obtained:
[ 1 + 2.632 ( 1 B 1 2 W e g ) ] 0.5 W e g 0.5 · q 1 + B q     ~     1 + ( B 1 2 B 2 ) B 1 W e g q = 1 C 0 W e g 0.5 [ 1 + 2.632 ( 1 B 1 2 W e g ) ] 0.5 1 + C 1 W e g 1 B
where C0 and C1 are constants. C1 is defined as   C 1 = ( B 1 2 B 2 ) B 1 .
According to the experimental data, the constants can be determined via data fitting of the dimensionless parameter (Weg, q) corresponding to the mixed breakup mode. Finally, a semiempirical correlation of the transition line between the column breakup and surface breakup at a small Weg is proposed, as follows:
q = 60 0.284 ( W e g 2.25 ) 0.5 ( 1 3.18 W e g 1 ) 1 , R 2 = 0.95 , ( W e g = 15 100 )
As shown in Figure 9, the current correlation (solid line) is consistent with the correction of Wu et al. [1] (dotted line) for the intersection test cases (Weg = 57–100) [1]. Additionally, the critical value of q increases exponentially at low Weg, according to the present experiment results and correlation. The jet is close to the enhanced capillary breakup mode when Weg < 20. The breakup is mainly dominated by surface tension rather than crossflow, and surface breakup hardly occurs.
In conclusion, nanoparticle additives at low concentrations do not significantly affect the transformation of primary breakup modes.

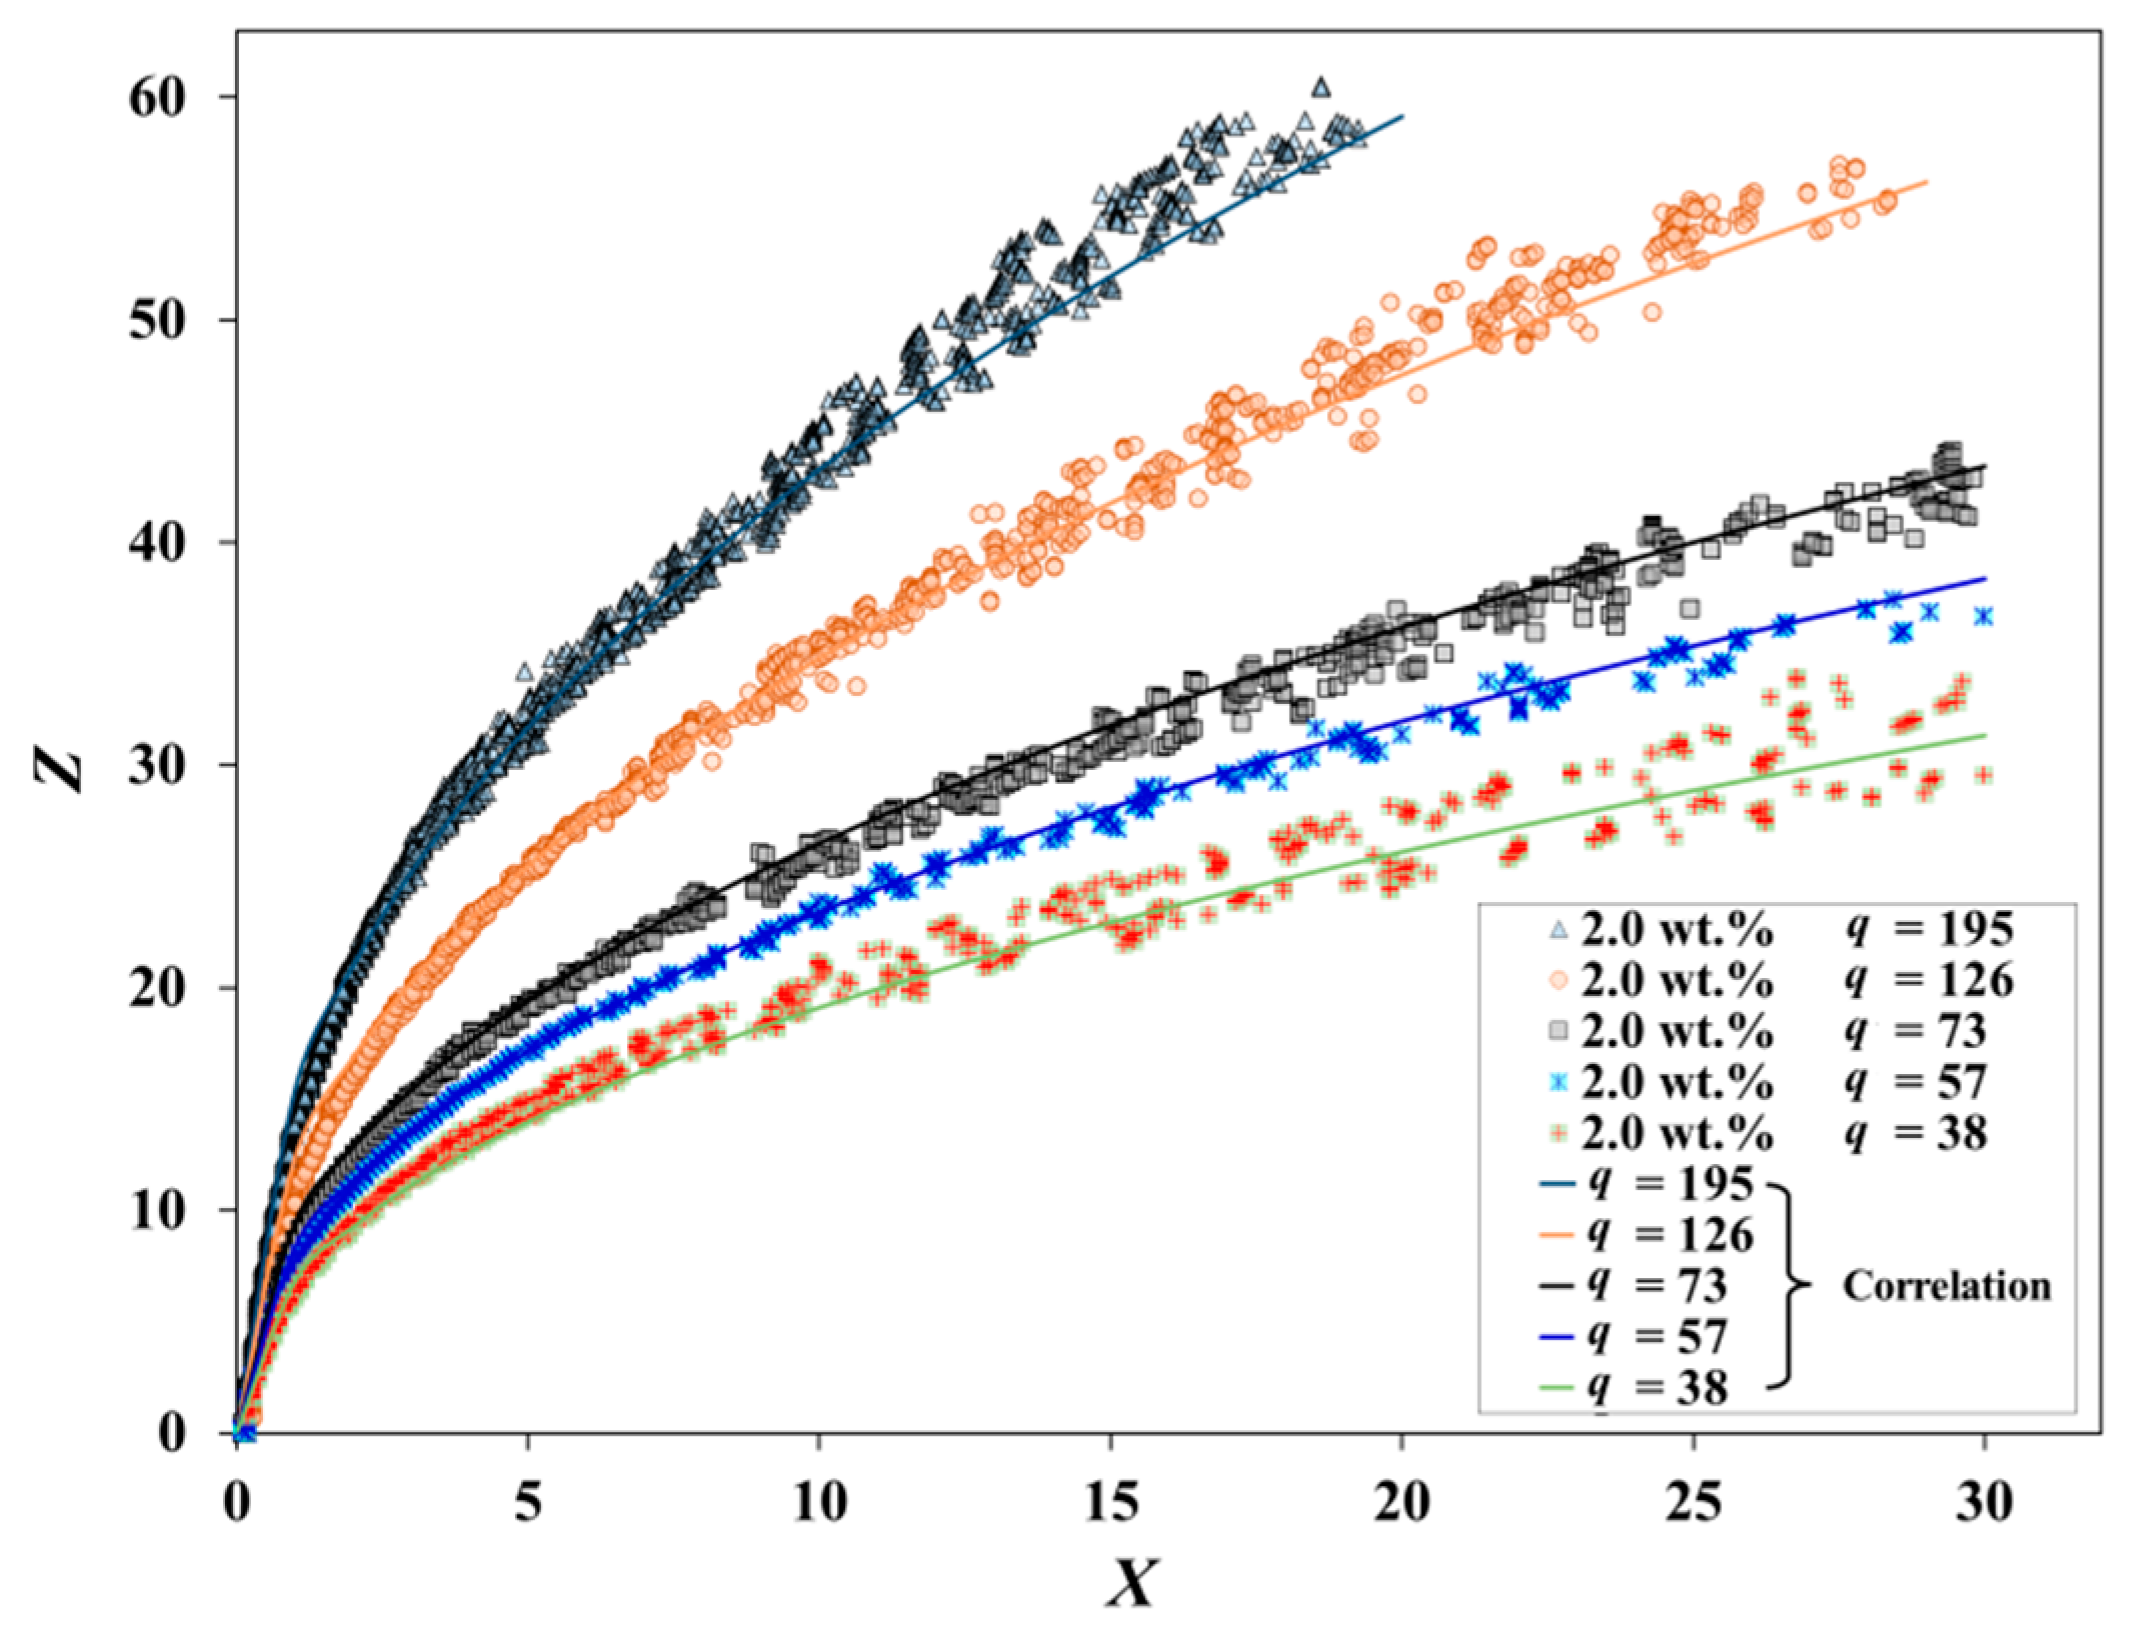
3.3. Penetration Behaviors

The jet penetration behavior is an important factor in combustion chamber design, as it affects the distribution of the spray plume, mixing rate with O2, and evaporation rate. To investigate the effects of nanoparticle additives, a comparison of the upwind jet boundary between nanofluids and the basic fluid was performed while q was kept constant. The results are presented in Figure 11.
The results indicated that adding a small amount of nanoparticles had almost no effect on the jet trajectory. Thus, for the jet trajectory of nanofluids, the nondimensional ordinate Z is an exponential function of X and q. Related constants were determined using the MATLAB Curve Fitting Toolbox.
The best-fit correlation for the present experiments was as follows:
Z = y d j = 1.1 × ( x d j ) 0.45 × q 0.5 ,   R 2 = 0.98
The correlation coefficient of the fit was 0.98. This fitting result is approximate to the previously reported expression, i.e., Z = A X q , which is based on mechanical analysis. Both indices of q are 0.5, while the present index of X is slightly smaller owing to a stronger drag force caused by the column deformation. As shown in Figure 12, the fitting curves are consistent with the experimental data of the jet trajectory over a wide q range.

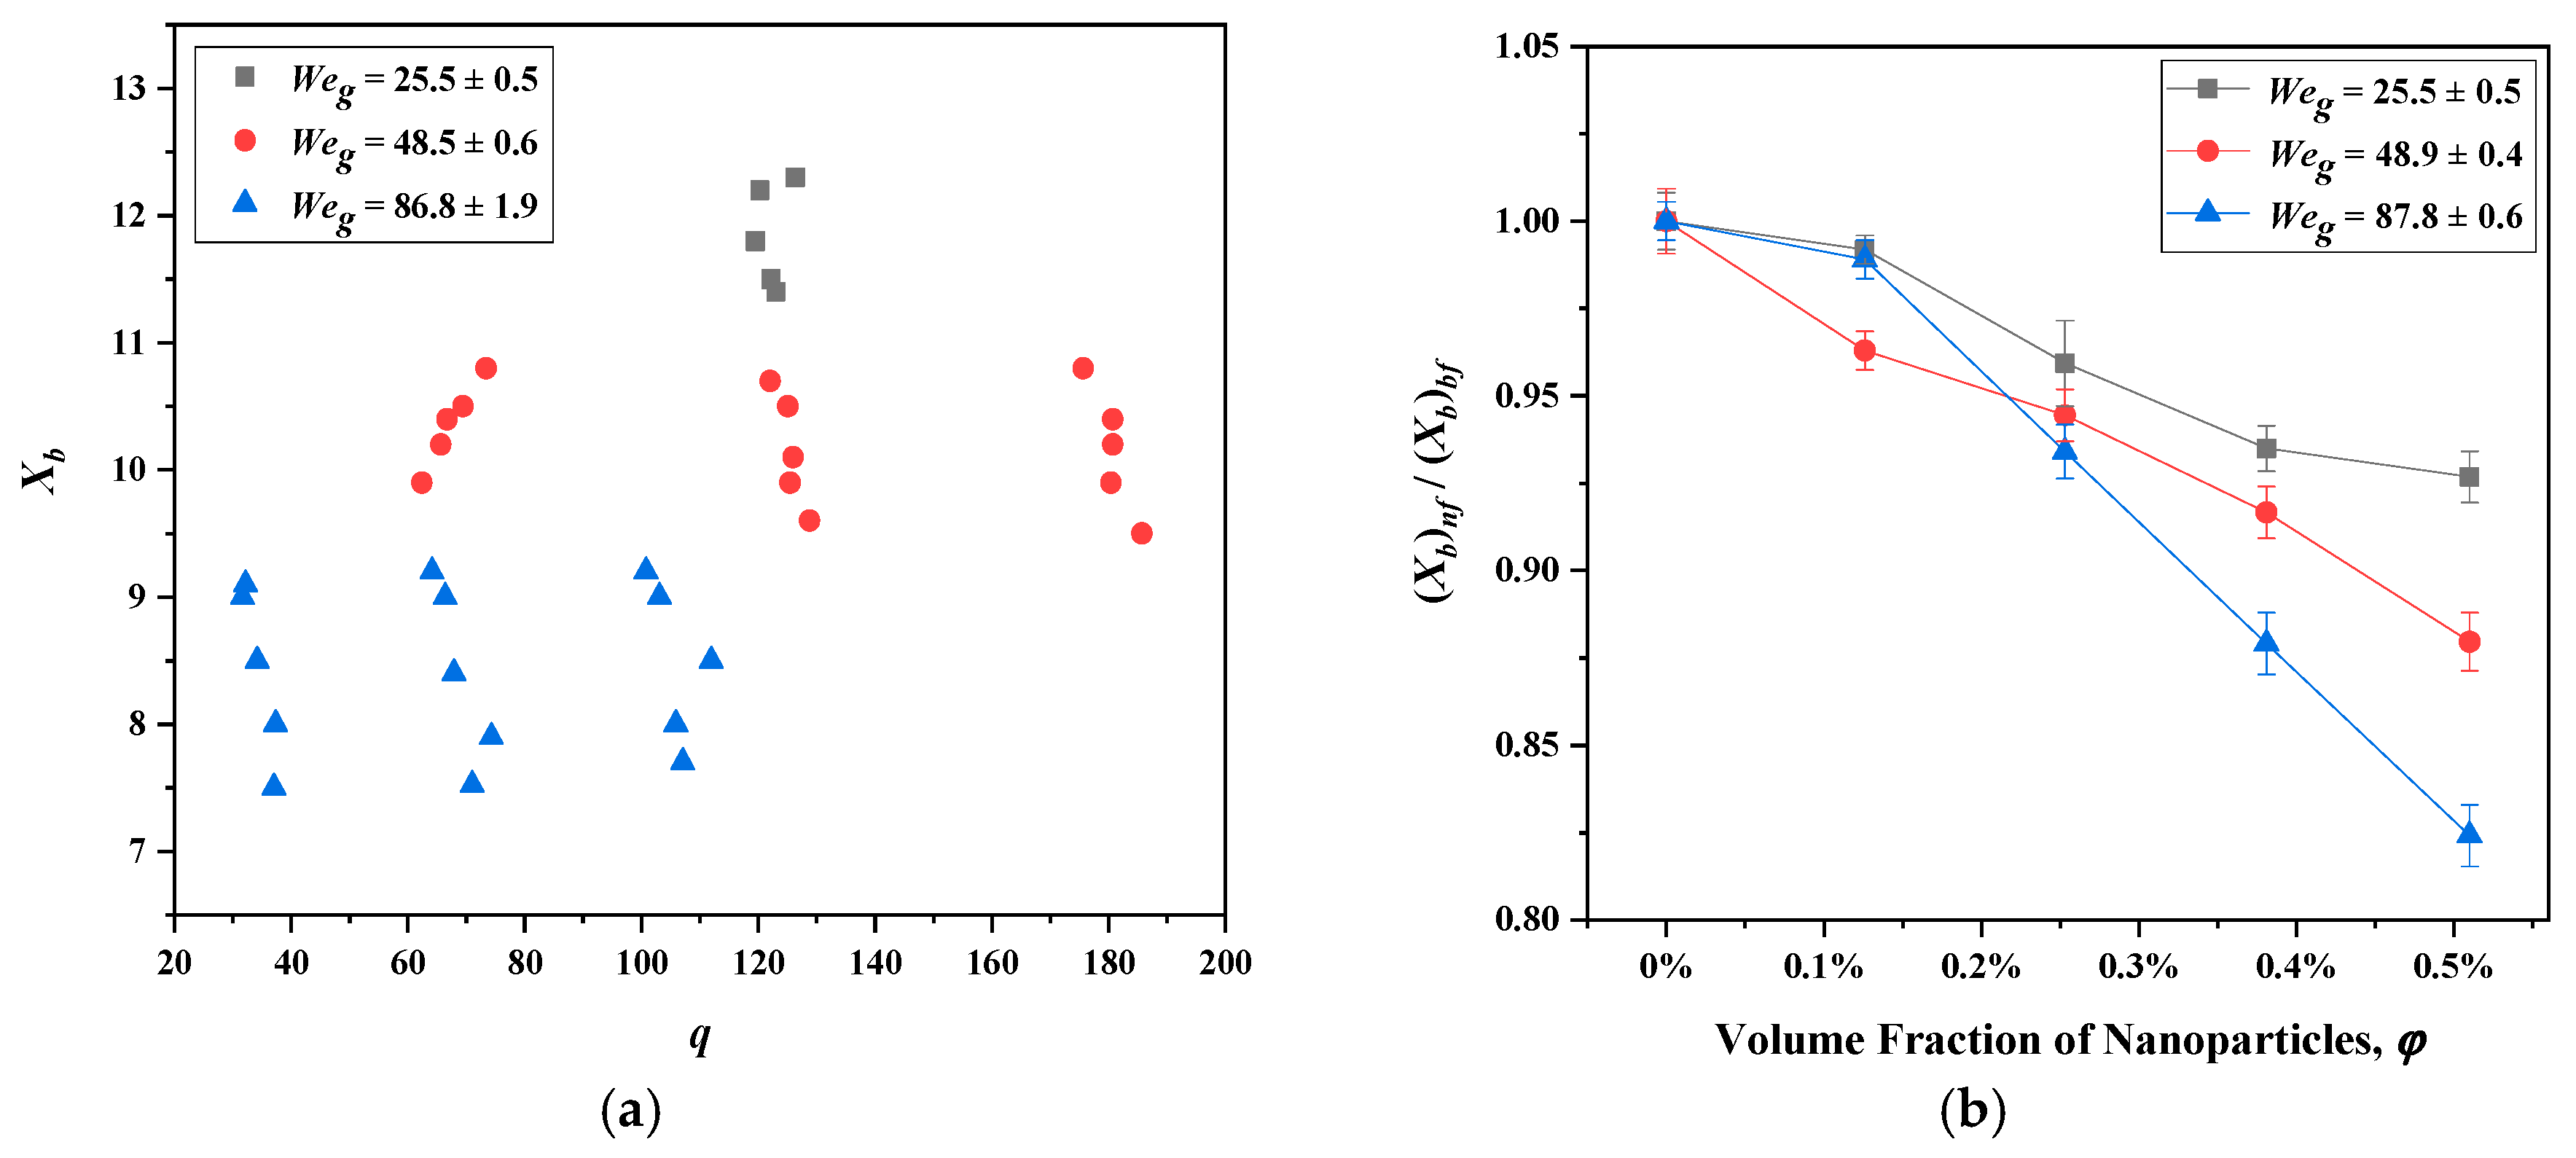
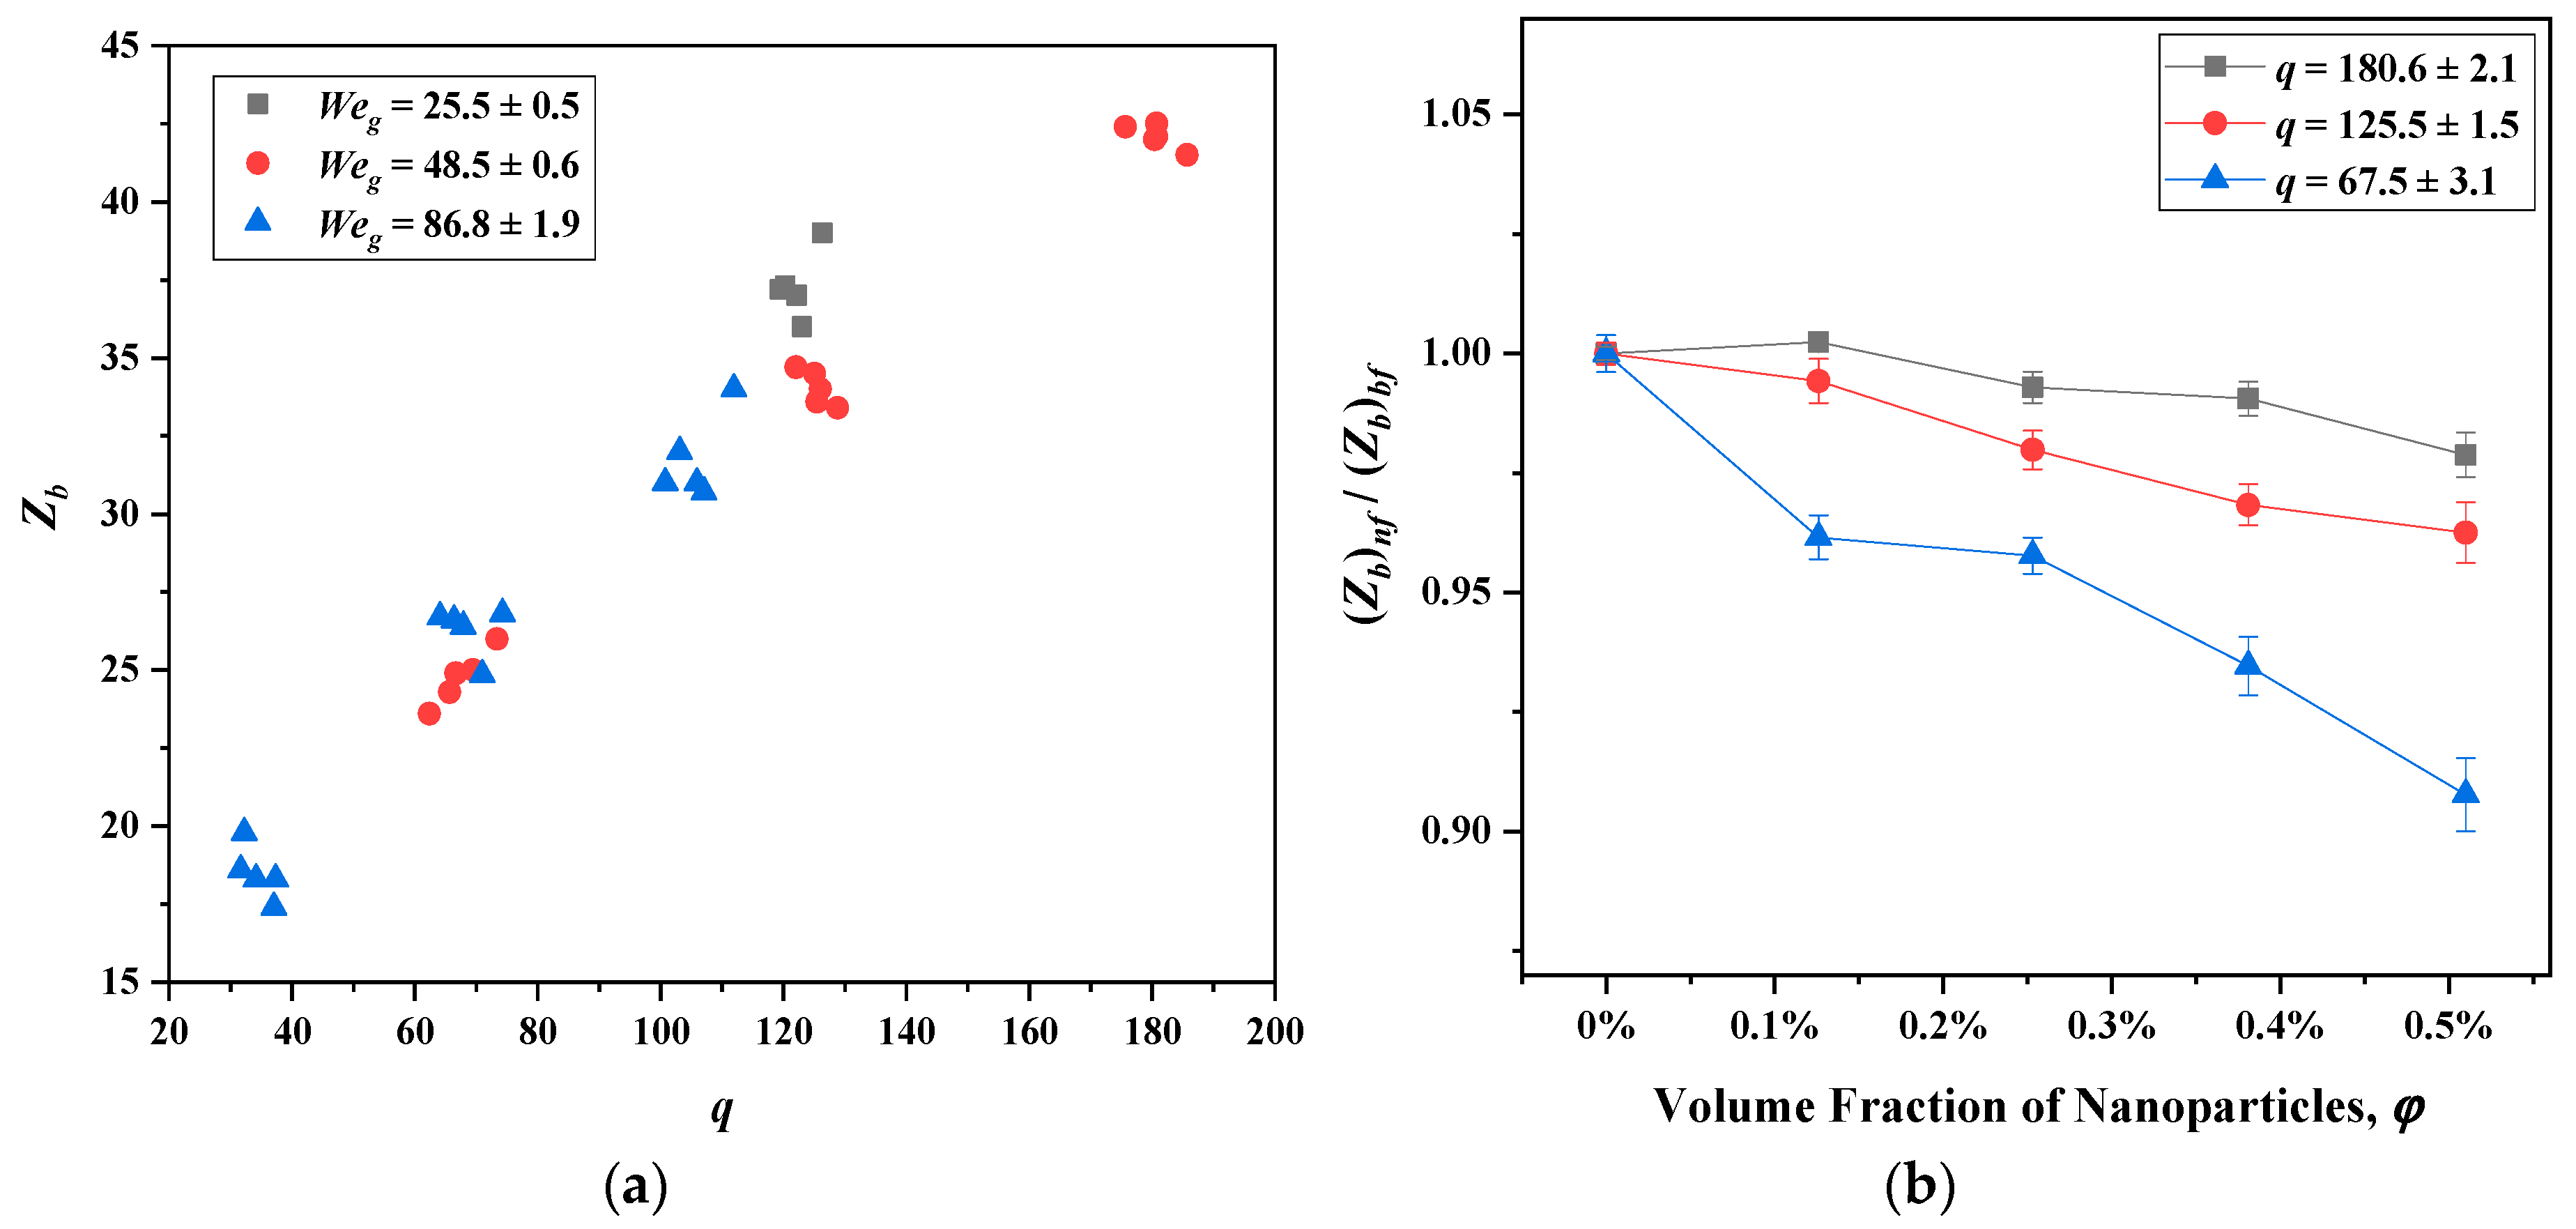
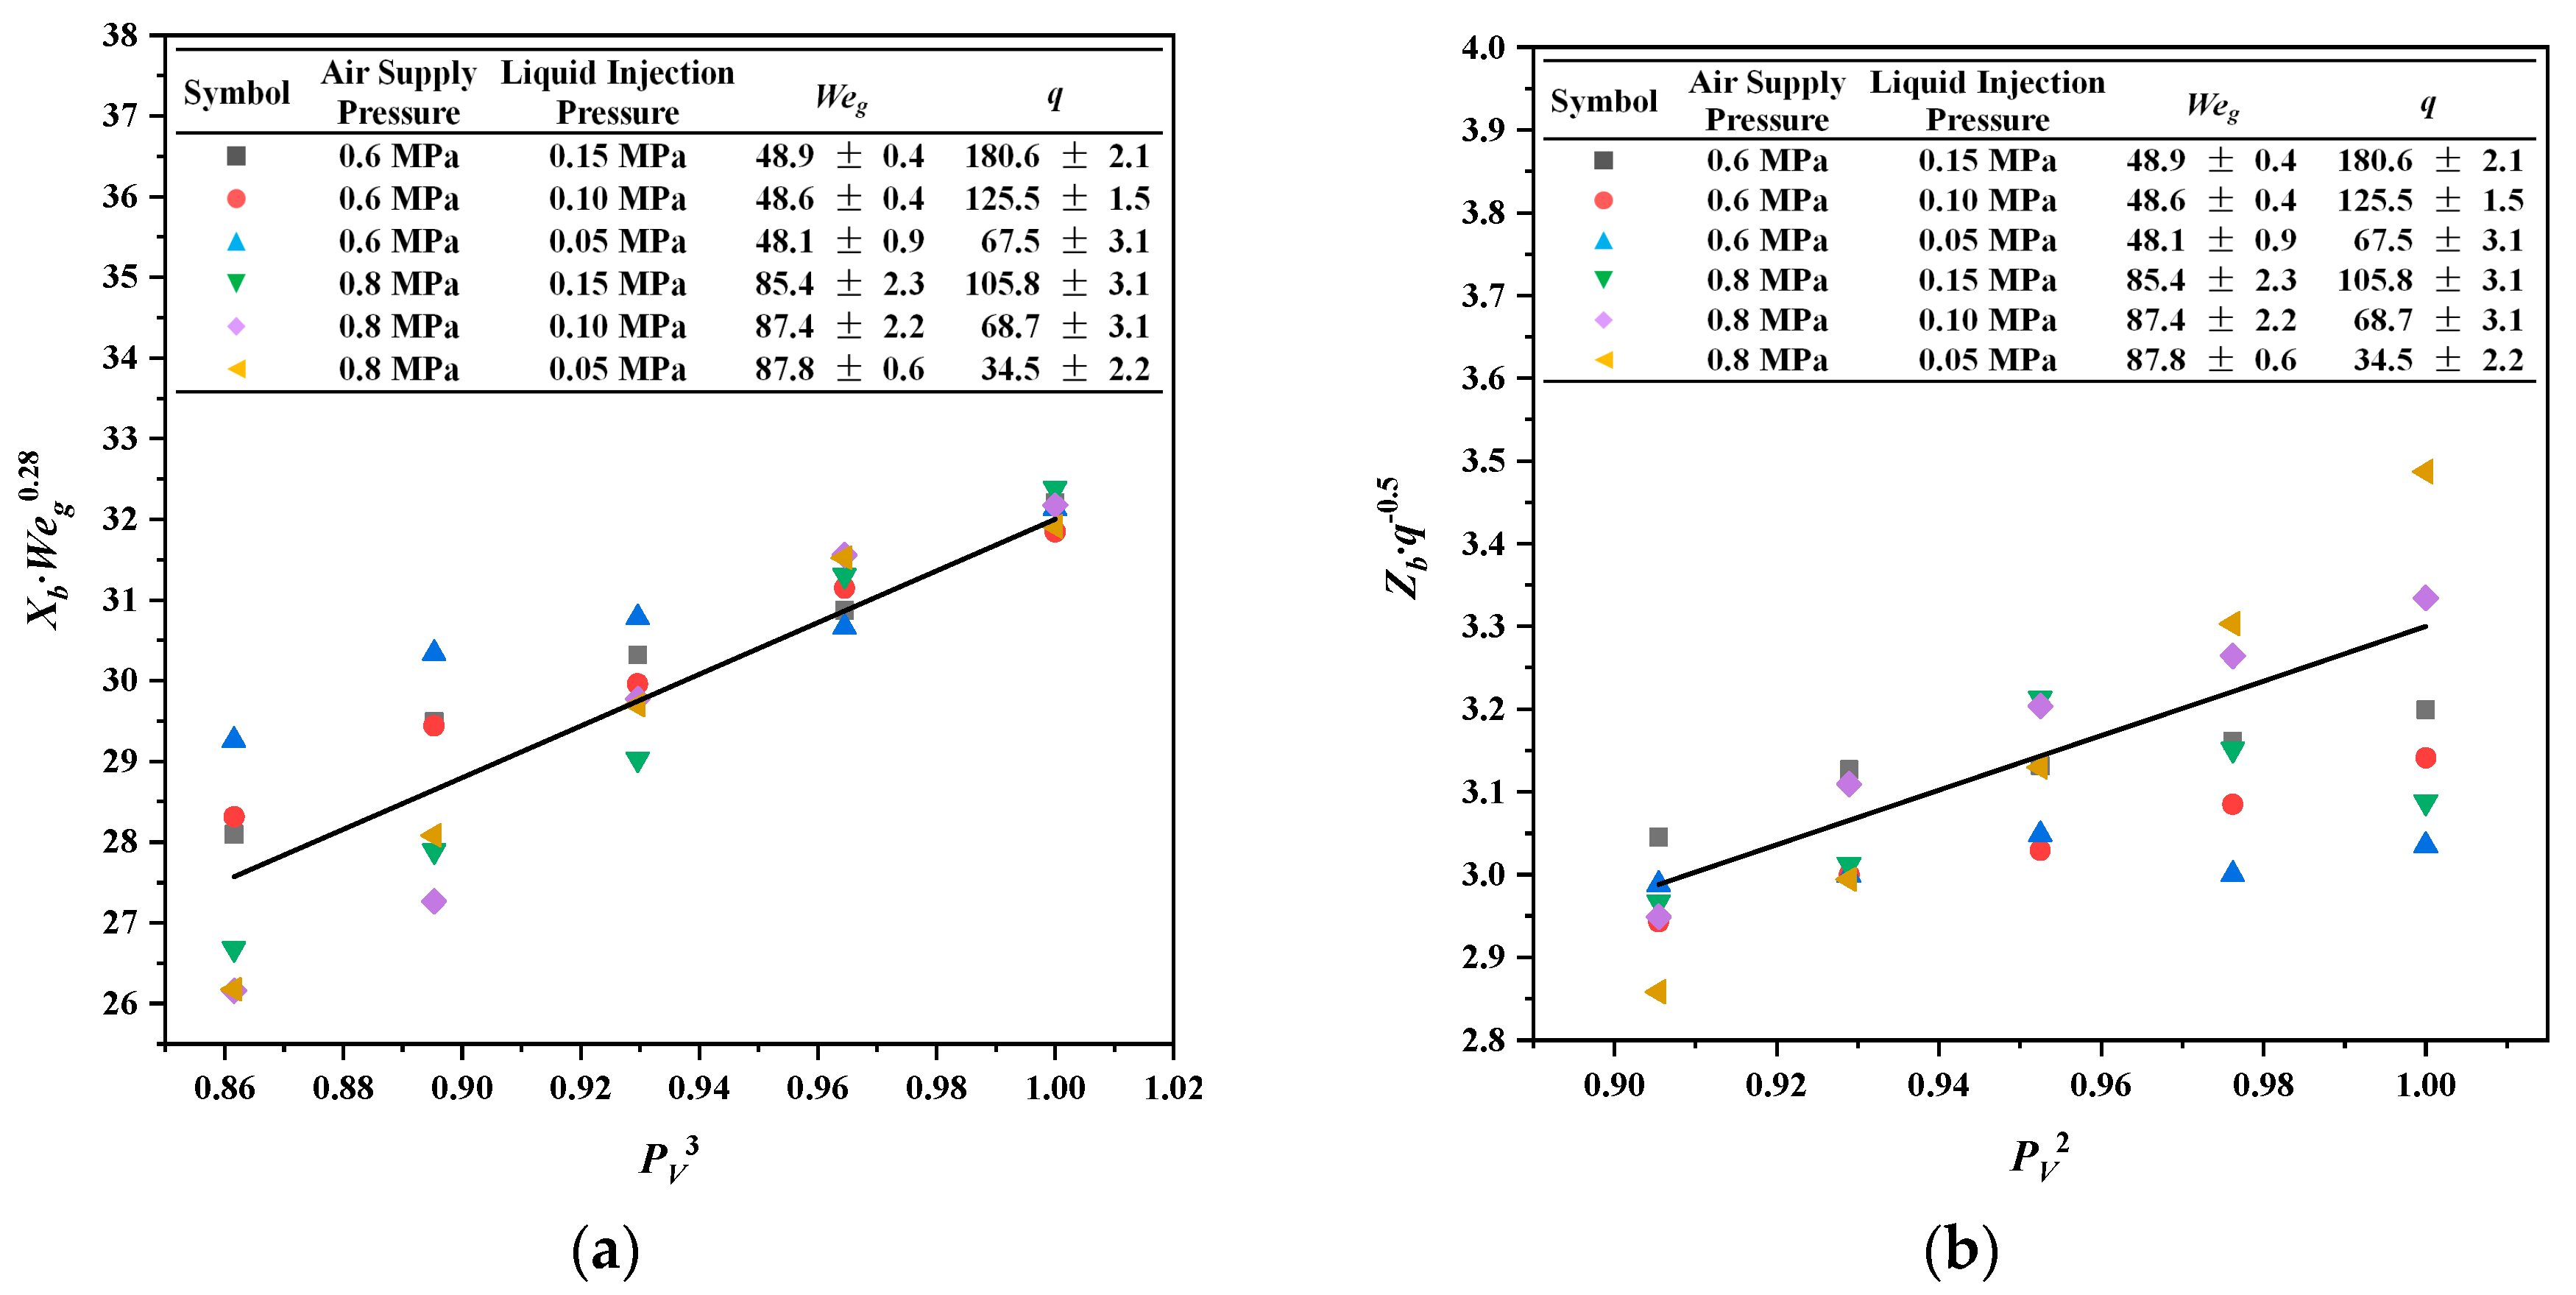
3.4. Column Fracture Regularity

To confirm the facticity of the additional physical breakup mode for the nanofluids, the column fracture positions were plotted in different graphs. As shown in Figure 13, the X-positions of column fracture (Xb) were scattered within the range of 9.9 ± 2.4 under the present conditions of Weg = 25–92 and q = 32–186. Compared with the Xb value of 8.06 ± 1.46 reported by Wu et al. [1], there was a deviation, which was mainly attributed to two factors: the different breakup modes at a small Weg and the different methods of selecting the fracture location.
The fracture location is mostly selected on the upwind boundary of the jet in the literature, while the position was selected in the middle area of the upper and lower jet boundaries in this study. From the viewpoint of applications, it is sometimes more meaningful to detect the location in the middle area, which can indicate the central position with the maximum fracture probability of a random-oscillation liquid column.
The results indicate that Xb increased with a decrease in Weg but had almost no correlation with q (Figure 13a). Zb increased with q but had almost no correlation with Weg (Figure 14a). The fracture distance of the liquid column decreased as the nanoparticle concentration increased. Relative to the basic fluid, the fracture location Xb of nanofluids descended more rapidly at a larger Weg number, and the location Zb descended more rapidly at a smaller q number. This is consistent with the conclusions of Kannaiyan et al. [33] and Li et al. [35]. When the mass concentration of nano-alumina was 2.0 wt.% (corresponding volume fraction was 0.51%), the fracture distance Xb in the present test was shortened by approximately 20% (Weg = 92, Rej = 19074) compared with that of the basic fluid, and the breakup length was reduced by approximately 17% (Rep = 27450) reported by Kannaiyan et al. [33], which was on the same order of magnitude.
In contrast to the present study, Kannaiyan et al. used a swirling spray nozzle, and the reduction of the breakup length was attributed to the decrease in the nanofluid surface tension. Possibly because of different basic fluids, we found that the surface tension of water was slightly increased by adding nanoparticles, which is consistent with the results of Saad and Li [37]. Therefore, there should be other reasons why the nanoparticles change the fracture positions in transverse injection. According to [29,36], it is likely that the cavitation in the jet core is changed by the nanoparticles. It is necessary to determine whether the cavitation is enhanced by the nanoparticles, which would cause internal interface breakup. Therefore, a round jet test (u = 0) was performed using a twice-magnification transparent nozzle made of plexiglass.
As shown in Figure 15, in the absence of visible bubbles upstream the nozzle exit, no bubbles were observed inside the basic fluid jet. However, for nanofluids with a concentration of 0.5 wt.%, a stream of bubbles with sizes of 0.2–0.4 mm appeared in the jet core region. The bubbles emerged from the jet inner zone with enhanced disturbance near the nozzle (blue rectangle in Figure 15b). Thus, the addition of nanoparticles increased the amount of nucleation sites and promoted cavitation in the jet. Additionally, the generation of bubbles caused interface breakup inside the jet, accelerating the fracture of the liquid column.
Accordingly, a new nondimensional quantity associated with nanoparticles should be introduced for the correction of the column fracture position. In this paper, it is defined as PV, which is mainly determined by two factors. The first consists of basic characteristics of particle phase, including the particle concentration, true density, size distribution, and thickness of the solvation layer. The second consists of characteristics relevant to the jet flow field, mainly including the Peclet number (Pep) and Reynolds number of the particles (Rep), which represents the dispersion uniformity and following feature.
At the nanoscale, both the particle dispersion inhomogeneity and moving relaxation are low. Thus, Pep and Rep can be ignored. Among the remaining factors, the particle concentration was the most influential. Referring to the corrected form of the nanofluid viscidity based on the equivalent volume concept, PV is expressed as follows:
P V = 1 C φ ,   C = ( Δ R d p 0 / 2 ) 3 × ρ p ρ L ρ L × ( 1 + d m 0 d p 0 )
Hence, PV represents the extent to which the nanofluids deviate from the pure liquid. For the present Al2O3-H2O nanofluids, C was calculated as C = 1.46 3 × 3 × 1.019 = 9.5 .
According to the foregoing analysis, the X and Z coordinates of the column fracture position can be expressed as follows:
X b = C X b W e g a 1 P V b 1   ,     Z b = C Y b q a 2 P V b 2
According to the experimental data, the following corrections are established:
X b = 32.05 W e g 0.28 P V 3   ,   R 2 = 0.96
Z b = 3.3 q 0.5 P V 2 ,   R 2 = 0.96
where the correlation coefficients of the fits were both 0.96.
As shown in Figure 16, the fitting curves agreed well with the experimental data. For the addition of nanoparticles, the X-position of the liquid-column fracture was proportional to PV3, and the Z position was proportional to PV2.

4. Summary and Conclusions

For the first time, a nanofluid jet injected into a subsonic gaseous crossflow was investigated with a focus on three aspects: the primary breakup regimes, penetration behaviors, and column fracture features. A series of experiments were performed at room temperature and the atmospheric pressure. The experimental setup involved one conical nozzle, three sets of injection pressures, five different concentrations of nanoparticles, and seven crossflow rates. First, an improved image-processing method was developed for statistical analysis of transverse injection. According to the distribution map of the grayscale SD, the jet trajectory, column fracture position, and morphology of the column/surface breakup were obtained. Second, for the first time, a simplified mathematical description of the transition mechanism from column breakup to surface breakup at a small Weg was established. The correlation of the transition line, which was obtained via morphological modeling and force analysis, agreed well with the experimental correlation reported by Wu et al. [1]. Finally, the effects of adding alumina nanoparticles on the upwind jet trajectory and column fracture position were investigated through comparisons between nanofluids and the basic fluid. On the basis of research method for emulsion injection and the equivalent volume concept for fitting the nanofluid viscidity, a new nondimensional parameter called PV was introduced. The following conclusions are drawn.
In the case of a small Weg, the fracture of the liquid column was caused by column wave expansion with aerodynamic instability, while the surface breakup was dominated by the boundary-layer stripping process caused by the crossflow. When the speed at which ligaments were stripped from the boundary layer exceeded the speed of disturbance development along the liquid jet, the surface breakup mode was observed. When the momentum of the liquid in the boundary layer exceeded the surface tension of the ligament with a size equivalent to δ, droplets were stripped sideways from the column. The following semiempirical correlation of the transition line between the column breakup and surface breakup was proposed:
q = 60 0.284 ( W e g 2.25 ) 0.5 ( 1 3.18 W e g 1 ) 1 ,   R 2 = 0.95 ,   ( W e g = 15 100 )
With the addition of a small amount of nanoparticles (φ < 2.0 wt.%), the surface tension increased slightly, while the viscosity increased significantly (by up to 23%). The changes in these physical properties hardly affected the breakup regimes and jet trajectory. The trajectory correlation of the transverse injection for nanofluids can be expressed as follows:
Z = y d j = 1.1 × ( x d j ) 0.45 × q 0.5 ,   R 2 = 0.98
The addition of nanoparticles promotes cavitation and bubble generation inside the liquid jet, resulting in an additional primary breakup mode called internal interface breakup. Consequently, the liquid column fractures, and its horizontal length is reduced by up to 20%. The X and Z coordinates of the column fracture location are expressed as follows:
X b = 32.05 W e g 0.28 P V 3 ,   R 2 = 0.96
Z b = 3.3 q 0.5 P V 2 ,   R 2 = 0.96
The primary breakup of nanofluid jets in a crossflow at a small Weg is depicted in Figure 17. After being ejected from the nozzle, the liquid column is deflected and compressed by the crossflow. Two types of breakups occur, accompanied by an increase in instability: (i) the formation of a column wave when the threshold of the amplitude of the surface wave is reached, which causes the liquid column to fracture, and (ii) cavitation caused by disturbance in the nanofluid jet, which is followed by internal interface breakup. In some cases of a high Weg or q, the surface breakup occurs in the form of boundary-layer stripping, similar to Rayleigh breakup, which results in smaller droplets.

Supplementary Materials

The following are available online at https://www.mdpi.com/1996-1073/13/7/1574/s1. Video S1: Data of spray movies.

Author Contributions

Conceptualization and methodology, W.S., Q.L. and L.Z.; test method and data acquisition, W.S., F.L. and L.C.; image processing program, W.S., F.L. and G.F.; resources and supervision, Q.L. and L.Z.; investigation, W.S. and F.L.; writing—original draft preparation, W.S. All authors have read and agreed to the published version of the manuscript.

Funding

This research received no external funding.

Acknowledgments

A special thanks to Wei Fu and Liufang Yu, for their suggestions on test method and supports in image device.

Conflicts of Interest

The authors declare no conflict of interest.

Nomenclature

CD
di
dj
dL
dmax
dp0
ΔR
Fa
Fσ
h
lc
Oh
Pep
PV
q
Rej
Rep
S1
Scircle
Sellipse
tli
ug
uj
ul
w
Weg
X
Z
δ
θ
λc
μ
ν
ρ
σ
φ
liquid column average drag coefficient
width of liquid column cross-section, m
liquid jet diameter at the nozzle exit, m
equivalent diameter of water molecules, m
length of liquid column cross-section, m
mean diameter of monodispersed nanoparticles, m
thickness of solvation layer, m
aerodynamic drag force, N
surface tension, N
characteristic height of column cell, m
cross-section perimeter of liquid column, m
Ohnesorge number, μ L / ρ L d j σ
particle Peclet number, d p | u L u p | / α p
nanofluids-jet parameter, 1 C · φ
jet momentum flux ratio, ρ L u j 2 / ρ g u 2
jet Reynolds number, ρ L u j d j / μ L
particle Reynolds number, ρ L d p | u L u p | / μ L
windward area of liquid column, m2
rounded cross-section area of liquid column, m2
elliptic cross-section area of liquid column, m2
onset of surface breakup time, s
air crossflow velocity, m/s
liquid velocity at the nozzle exit, m/s
mean velocity of ligament in boundary layer, m/s
mass fraction of nanoparticles, wt.%
gas phase Weber number, ρ g u 2 d j / σ
non-dimensional x-coordinate, x/dj
non-dimensional z-coordinate, z/dj
thickness of liquid boundary layer, m
angle between X axis and tangent of jet trajectory
column wave length, m
dynamic viscosity, Pa·s
kinematic viscosity, m2/s
density, kg/m3
surface tension, N/m
volume fraction of nanoparticles, vol.%
Subscripts
b
bf
g
j
L
nf
p
location of liquid column fracture
basic fluid
gas
jet
liquid
nanofluids
nanoparticle
ambient gas

References

  1. Wu, P.K.; Kirkendall, K.A.; Fuller, R.P.; Nejad, A.S. Breakup processes of liquid jets in subsonic crossflows. J. Propuls. Power 1997, 13, 64–73. [Google Scholar] [CrossRef]
  2. Zhang, H.B.; Bai, B.F.; Liu, L.; Sun, H.J.; Yan, J.J. Experimental study of the mixing of two impinging pressure-swirl sprays in crossflow. Exp. Therm. Fluid Sci. 2013, 49, 67–74. [Google Scholar] [CrossRef]
  3. Karagozian, A.R. Transverse jets and their control. Prog. Energy Combust. Sci. 2010, 36, 531–553. [Google Scholar] [CrossRef]
  4. Park, J.; Kim, T.; Kim, D.; Park, S. Prediction of wall impingement in a direct injection spark ignition engine by analyzing spray images for high-pressure injection up to 50 MPa. Fuel Process. Technol. 2018, 179, 238–249. [Google Scholar] [CrossRef]
  5. Broumand, M.; Birouk, M. Liquid jet in a subsonic gaseous crossflow: Recent progress and remaining challenges. Prog. Energy Combust. Sci. 2016, 57, 1–29. [Google Scholar] [CrossRef]
  6. Tambe, S.B.; Jeng, S.M.; Mongia, H.; Hsiao, G. Liquid Jets in Subsonic Crossflow. In Proceedings of the 43rd AIAA Aerospace Sciences Meeting and Exhibit, Reno, NV, USA, 10–13 January 2005. [Google Scholar]
  7. Sallam, K.A.; Aalburg, C.; Faeth, G.M. Breakup of round nonturbulent liquid jets in gaseous crossflow. AIAA J. 2004, 42, 2529–2540. [Google Scholar] [CrossRef] [Green Version]
  8. Brown, C.; McDonell, V. Near Field Behavior of a Liquid Jet in a Crossflow. In Proceedings of the ILASS-Americas, Toronto, ON, Canada, 23–26 May 2006. [Google Scholar]
  9. Song, J.; Cary Cain, C.; Guen Lee, J. Liquid jets in subsonic air crossflow at elevated pressure. J. Eng. Gas Turbine Power 2015, 137, 041502. [Google Scholar] [CrossRef]
  10. Iyogun, C.O.; Birouk, M.; Popplewell, N. Trajectory of water jet exposed to low subsonic cross-flow. At. Sprays 2006, 16, 963–980. [Google Scholar] [CrossRef]
  11. Das, S.K.; Kim, K.; Lim, O. Experimental study on non-vaporizing spray characteristics of biodiesel-blended gasoline fuel in a constant volume chamber. Fuel Process. Technol. 2018, 178, 322–335. [Google Scholar] [CrossRef]
  12. Broumand, M.; Birouk, M. A model for predicting the trajectory of a liquid jet in a subsonic gaseous crossflow. At. Sprays 2015, 25, 871–893. [Google Scholar] [CrossRef]
  13. Farvardin, E.; Dolatabadi, A. Simulation of Biodiesel Jet in Cross Flow. In Proceedings of the ICLASS 2012, 12th Triennial International Conference on Liquid Atomization and Spray Systems, Heidelberg, Germany, 2–6 September 2012. [Google Scholar]
  14. Stenzler, J.; Lee, J.; Santavicca, D. Penetration of Liquid Jets in a Crossflow. In Proceedings of the 41st Aerospace Sciences Meeting and Exhibit, American Institute of Aeronautics and Astronautics, Reno, NV, USA, 6–9 January 2003; pp. 887–906. [Google Scholar]
  15. Birouk, M.; Iyogun, C.O.; Popplewell, N. Role of viscosity on trajectory of liquid jets in a cross-airflow. At. Sprays 2007, 17, 267–287. [Google Scholar] [CrossRef]
  16. Stenzler, J.N.; Lee, J.G.; Santavicca, D.A.; Lee, W. Penetration of Liquid Jets in a Crossflow. At. Sprays 2006, 16, 887–906. [Google Scholar] [CrossRef]
  17. Lin, K.C.; Kennedy, P.J.; Jackson, T.A. A Review on Penetration Heights of Transverse Liquid Jets in High-Speed Flows. In Proceedings of the 15th Annual Conference on Liquid Atomization and Spray Systems, Madison, WI, USA, 14–17 May 2002; pp. 345–349. [Google Scholar]
  18. Lee, K.; Aalburg, C.; Diez, F.J.; Faeth, G.M.; Sallam, K.A. Primary breakup of turbulent round liquid jets in uniform crossflows. AIAA J. 2007, 45, 1907–1916. [Google Scholar] [CrossRef]
  19. Thawley, S.M.; Mondragon, U.M.; Brown, C.T.; Mcdonell, V.G. Evaluation of Column Breakpoint and Trajectory for a Plain Liquid Jet Injected into a Crossflow. In Proceedings of the ILASS-Americas 21st Annual Conference on Liquid Atomization and Spray Systems, Orlando, FL, USA, 18–21 May 2008; pp. 1–11. [Google Scholar]
  20. Ragucci, R.; Bellofiore, A.; Cavaliere, A. Breakup and breakdown of bent kerosene jets in gas turbine conditions. Proc. Combust. Inst. 2007, 31, 2231–2238. [Google Scholar] [CrossRef]
  21. McGrailn, B.P.; Thallapally, P.K.; Blanchard, J.; Nune, S.K.; Jenks, J.J.; Dang, L.X. Metal-organic heat carrier nanofluids. Nano Energy 2013, 2, 845–855. [Google Scholar] [CrossRef]
  22. Mahian, O.; Kianifar, A.; Heris, S.Z.; Wen, D.S.; Sahin, A.Z.; Wongwises, S. Nanofluids effects on the evaporation rate in a solar still equipped with a heat exchanger. Nano Energy 2017, 36, 134–155. [Google Scholar] [CrossRef]
  23. Mehta, R.N.; Chakraborty, M.; Parikh, P.A. Nanofuels: Combustion, engine performance and emissions. Fuel 2014, 120, 91–97. [Google Scholar] [CrossRef]
  24. Mardi, K.M.; Antoshkiv, O.; Berg, H.P. Experimental analysis of the effect of nano-metals and novel organic additives on performance and emissions of a diesel engine. Fuel Process. Technol. 2019, 196, 106166. [Google Scholar] [CrossRef]
  25. Manigandan, S.; Gunasekar, P.; Devipriya, J.; Nithya, S. Emission and injection characteristics of corn biodiesel blends in diesel engine. Fuel 2019, 235, 723–735. [Google Scholar] [CrossRef]
  26. Nour, M.; El-Seesy, A.I.; Abdel-Rahman, A.K.; Bady, M. Influence of adding aluminum oxide nanoparticles to diesterol blends on the combustion and exhaust emission characteristics of a diesel engine. Exp. Therm. Fluid Sci. 2018, 98, 634–644. [Google Scholar] [CrossRef]
  27. Basu, S.; Miglani, A. Combustion and heat transfer characteristics of nanofluid fuel droplets: A short review. Int. J. Heat Mass Transf. 2016, 96, 482–503. [Google Scholar] [CrossRef]
  28. Gan, Y.N.; Qiao, L. Combustion characteristics of fuel droplets with addition of nano and micron-sized aluminum particles. Combust. Flame 2011, 158, 354–368. [Google Scholar] [CrossRef]
  29. Miglani, A.; Basu, S. Effect of particle concentration on shape deformation and secondary atomization characteristics of burning nanotitania dispersion droplet. ASME J. Heat Transf. 2015, 137, 102001. [Google Scholar] [CrossRef]
  30. Sonawane, S.; Patankar, K.; Fogla, A.; Puranik, B.; Bhandarkar, U.; Sunil Kumar, S. An experimental investigation of thermos-physical properties and heat transfer performance of Al2O3-aviation turbine fuel nanofluids. J. Appl. Therm. Eng. 2011, 31, 2841–2849. [Google Scholar] [CrossRef]
  31. Villarejoa, R.G.; Martínb, E.I.; Coronillac, A.S.; Aguilar, T. Towards the improvement of the global efficiency of concentrating solar power plants by using Pt-based nanofluids: The internal molecular structure effect. Appl. Energy 2018, 228, 2262–2274. [Google Scholar] [CrossRef]
  32. Kim, D.M.; Baek, S.W.; Yoon, J. Ignition characteristics of kerosene droplets with the addition of aluminum nanoparticles at elevated temperature and pressure. Combust. Flame 2016, 173, 106–113. [Google Scholar] [CrossRef]
  33. Kannaiyan, K.; Sadr, R. The effects of alumina nanoparticles as fuel additives on the spray characteristics of gas-to-liquid jet fuels. Exp. Therm. Fluid Sci. 2017, 87, 93–103. [Google Scholar] [CrossRef]
  34. Kannaiyan, K.; Anoop, K.; Sadr, R. Effect of nanoparticles on the fuel properties and spray performance of aviation turbine fuel. J. Energy Resour. Technol. 2017, 139, 032201. [Google Scholar] [CrossRef]
  35. Li, S.J.; Zhuo, Z.; He, L.J.; Huang, X.F. Atomization characteristics of nano-Al/ethanol nanofluid fuel in electrostatic field. Fuel 2019, 236, 811–819. [Google Scholar] [CrossRef]
  36. Bolszo, C.D.; McDonell, V.G.; Gomez, G.A.; Samuelsen, G.S. Injection of water-in-oil emulsion injection into a subsonic crossflow: An experimental study. At. Sprays 2014, 24, 303–348. [Google Scholar] [CrossRef] [Green Version]
  37. Tanvir, S.; Qiao, L. Surface tension of nanofluid-type fuels containing suspended nanomaterials. Nanoscale Res. Lett. 2012, 7, 226. [Google Scholar] [CrossRef] [Green Version]
  38. Zhu, D.S.; Li, X.F.; Wang, X.J. Experimental investigation on viscosity of Cu-H2O nanofluids. J. Wuhan Univ. Technol. Mater. Sci. 2008, 23, 436–441. [Google Scholar]
  39. Einstein, A. EineneueBestiininung der MoIekuldimensionen. Ann. Phys. 1906, 324, 289–306. [Google Scholar] [CrossRef] [Green Version]
  40. Faeth, G.M.; Hsiang, L.P.; Wu, P.K. Structure and breakup properties of sprays. Int. J. Multiph. Flow 1995, 21, 99–127. [Google Scholar] [CrossRef]
  41. Wang, Q.; Mondragon, U.M.; Brown, C.T.; McDonell, V.G. Characterization of trajectory, break point, and break point dynamics of a plain liquid jet in a crossflow. At. Sprays 2011, 21, 203–219. [Google Scholar] [CrossRef]
  42. Ng, C.L.; Sankarakrishnan, R.; Sallam, K.A. Bag breakup of nonturbulent liquid jets in crossflow. Int. J. Multiph. Flow 2008, 34, 241–259. [Google Scholar] [CrossRef]
  43. Liu, A.B.; Mather, D.; Reitz, R.D. Modeling the Effect of Drop Drag and Breakup on Fuel Sprays. SAE Trans. 1993, 102, 930072. [Google Scholar]
Figure 1. Dispersion stability of Al2O3-H2O nanofluids and its microcosmic mechanism: (a) Nanofluids standing for 4 h; (b) Scanning electron microscopy images of γ-Al2O3 nanoparticles; (c) Stable structure of the electron double layer.
Energies 13 01574 g001
Figure 2. Viscosity and surface tension of the nanofluids increased with the addition of nanoparticles.
Energies 13 01574 g002
Figure 3. Experimental setup for studying the liquid jet in the crossflow.
Energies 13 01574 g003
Figure 4. Characterization of the air crossflow velocity: (a) Air velocities at different moments and positions; (b) Average velocity and its SD at different air supply pressures.
Energies 13 01574 g004
Figure 5. Image processing method for the jet boundary: (a) Transient shadowgraph of a transverse jet; (b) Grayscale SD distribution map; (c) Upwind boundary relevant to Max-SD; (d) Comparison with Sobel-ED method.
Energies 13 01574 g005
Figure 6. Image identification method for the column fracture location: (a) SD-contour method; (b) TT-Search method; (c) Comparison of processing results between the two methods.
Energies 13 01574 g006
Figure 7. Effects of the sample size of the shadowgraphs on the processing results: (a) Jet boundary; (b) Liquid-column fracture location Xb and maximum grayscale SD.
Energies 13 01574 g007
Figure 8. Transient shadowgraphs of transverse injection.
Energies 13 01574 g008
Figure 9. Primary breakup regimes plotted on the Wegq map.
Energies 13 01574 g009
Figure 10. Phenomenological analyses of the liquid breakup at a small Weg: (a) Column breakup caused by aerodynamic instability; (b) Surface breakup caused by boundary-layer stripping.
Energies 13 01574 g010
Figure 11. Penetration Z-coordinates at different w values.
Energies 13 01574 g011
Figure 12. Jet trajectories at different q values.
Energies 13 01574 g012
Figure 13. X-positions of column fracture in different cases: (a) Different Weg and q; (b) Different Weg and φ.
Energies 13 01574 g013
Figure 14. Z-positions of column fracture in different cases: (a) Different Weg and q; (b) Different q and φ.
Energies 13 01574 g014
Figure 15. Comparison of cavitation in the liquid column of a round jet at Rej = 17260.
Energies 13 01574 g015
Figure 16. Fitting curves and experimental data for the column fracture position. (a) X-positions change with PV 3; (b) Z-positions change with PV 2.
Energies 13 01574 g016
Figure 17. Primary breakup of nanofluids under transverse injection at a small Weg.
Energies 13 01574 g017
Table 1. Liquid properties (298 K, 101 kPa).
LiquidsDI WaterBasic FluidNanofluids
Nanoparticle concentration (w) (wt.%)000.5/1.0/1.5/2.0
Density (ρL) (kg/m3)997.1997.11000.9–1012.3
Viscosity (μL) (mPa·s)0.8940.8970.987–1.106
Surface tension (σ) (mN/m)71.9732.3132.58–33.15
Table 2. Test conditions.
FluidDI WaterBasic FluidNanofluids
Air Crossflow Velocity (u) (m/s)36–4020–5620–50
Liquid Jet Exit Velocity (uj) (m/s)10–17.39.5–17.19.5–17.3
Liquid Reynolds Number (Rej)11157–1930210563–190139083–17442
Crossflow Weber Number (Weg)22–2615–10115–92
Momentum Flux Ratio (q)56–16732–23432–232
Liquid Jet Ohnesorge Number (Oh)0.00330.0050.0055–0.006
Liquid/Gas Density Ratio (ρLg)841841845–854
Liquid/Gas Viscosity Ratio (μLg)494954–60
The air crossflow occurred at 101 kPa and 298 K in the test section, resulting in a density of 1.185 kg/m3 and a viscosity of 0.0184 mPa·s.

