Validation of GreenH2armony® as a Tool for the Computation of Harmonised Life-Cycle Indicators of Hydrogen


Abstract
:1. Introduction
2. Materials and Methods
2.1. Methodological Background: Main Features of the Harmonisation Framework
2.2. Main Features of the Software GreenH2armony® and Validation Procedure
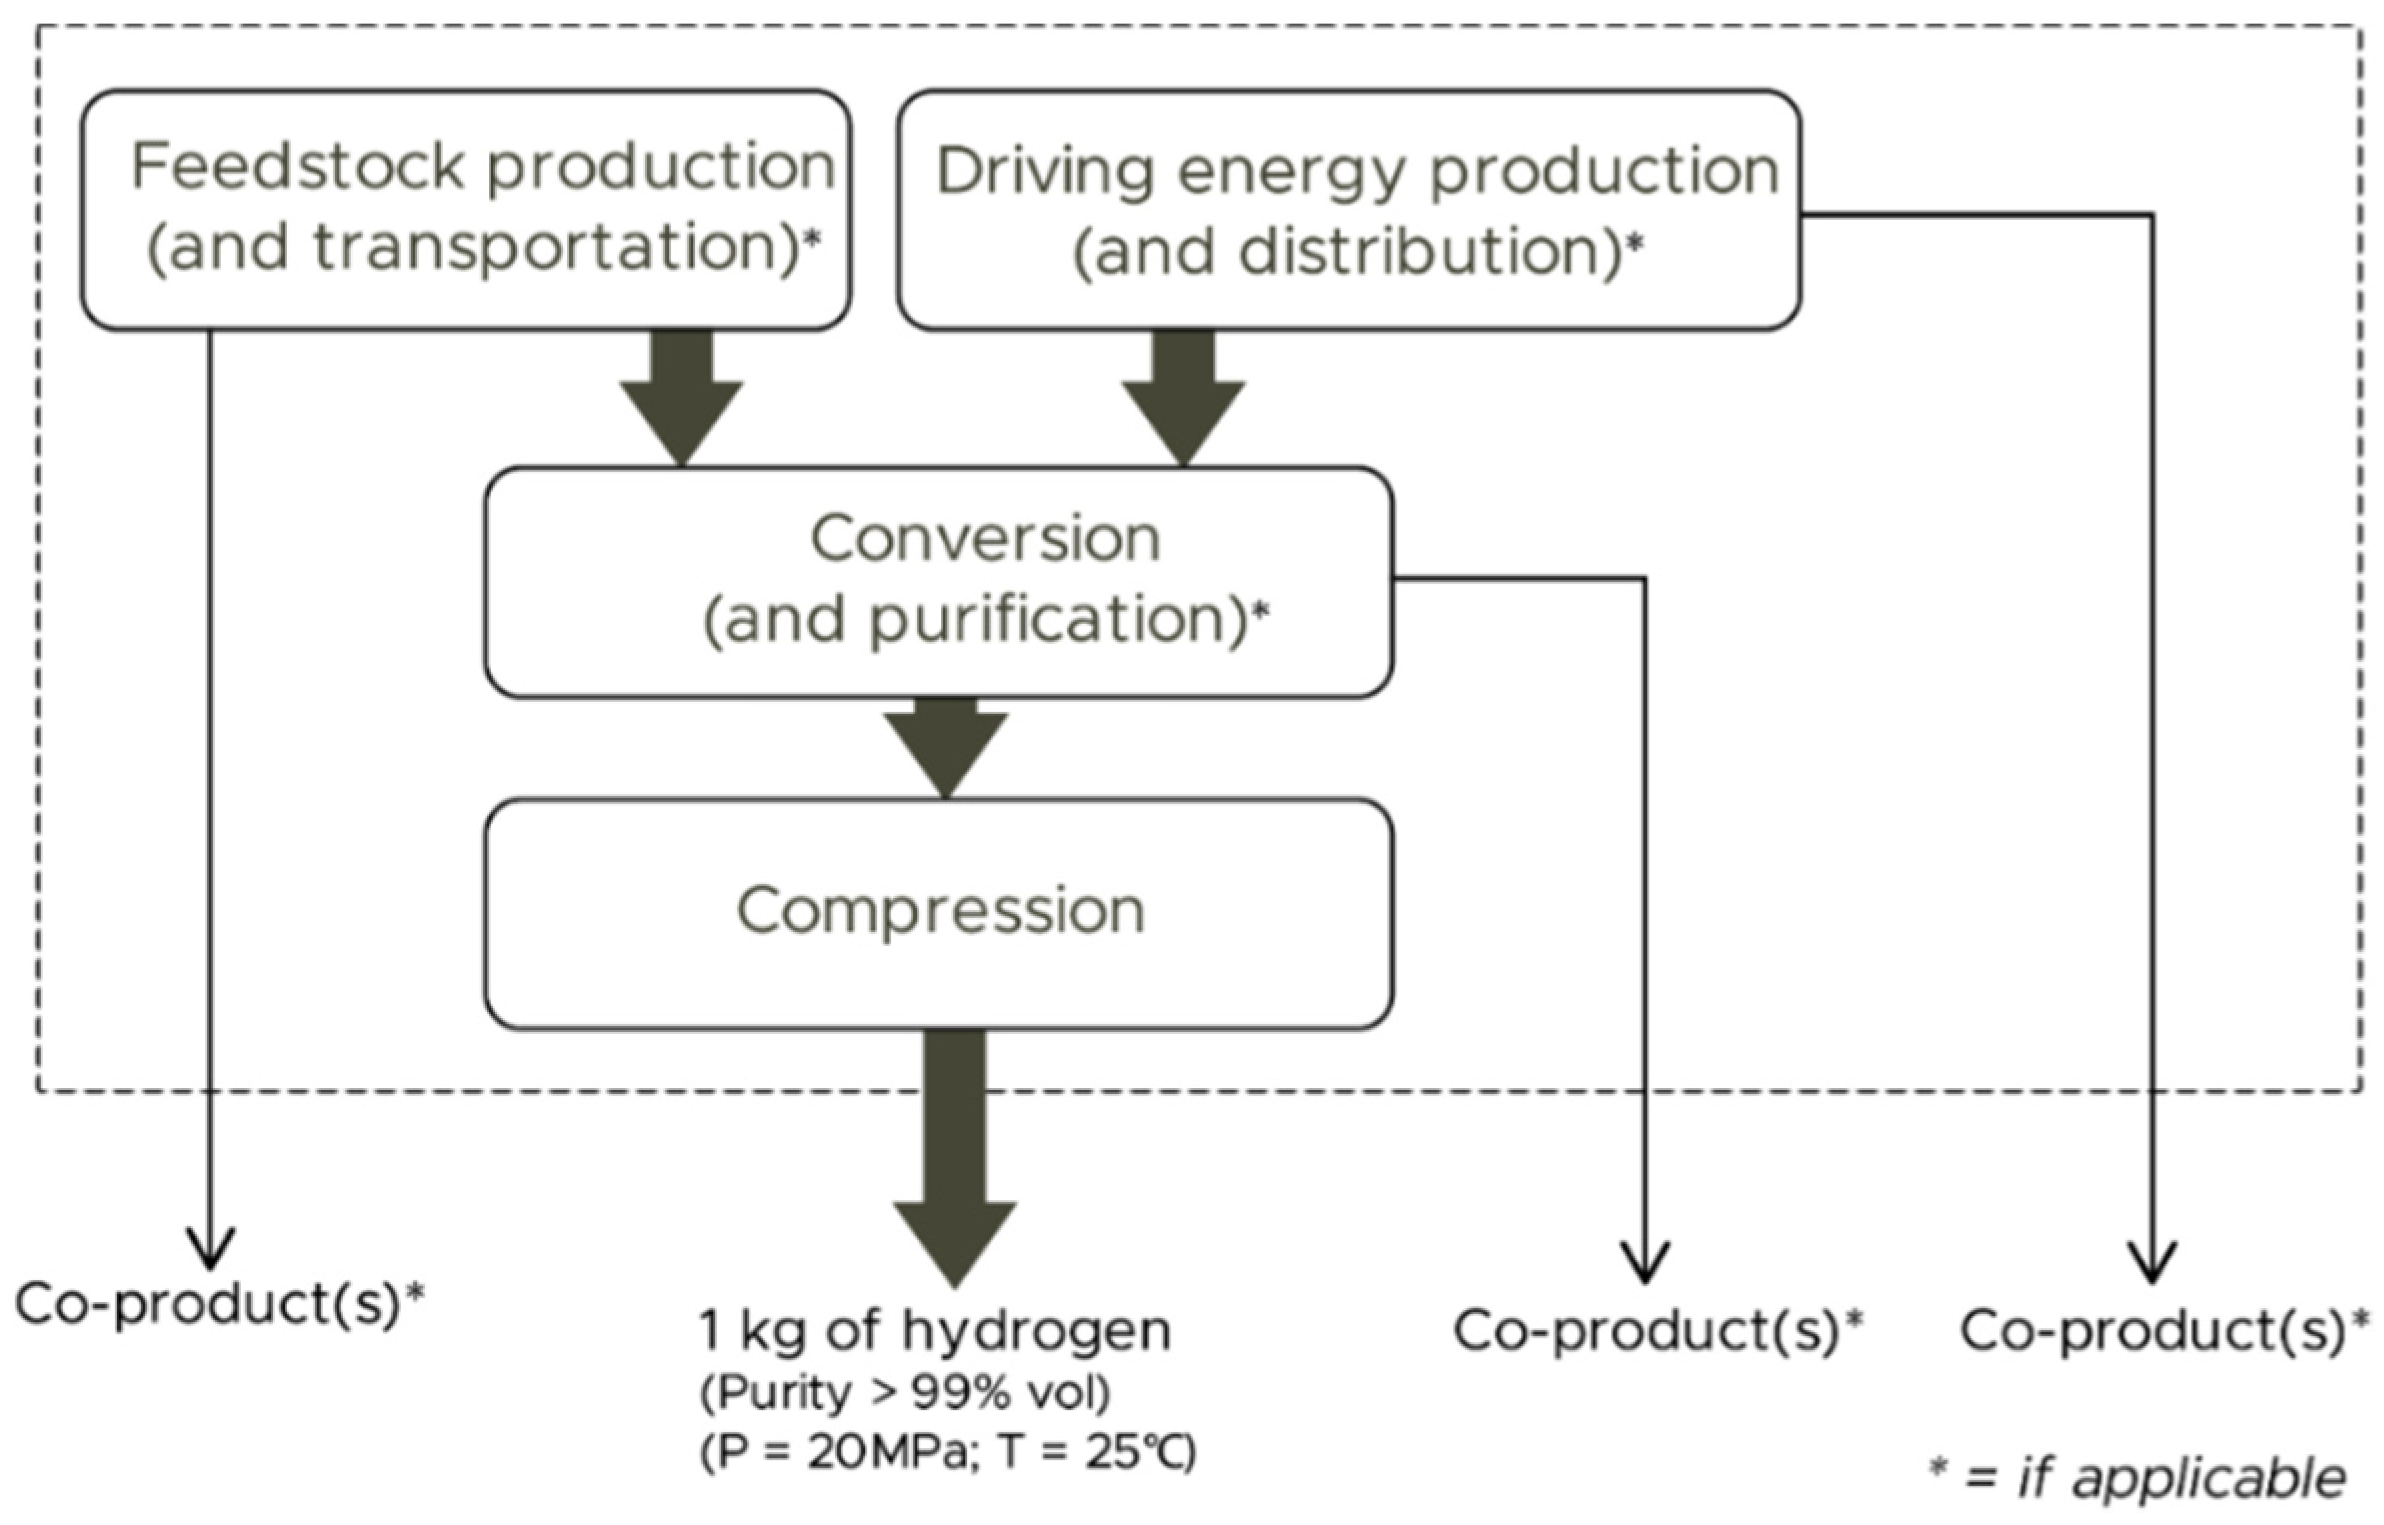
- The user must have an LCA study of a hydrogen energy system whose carbon, energy and/or acidification footprint the user is willing to harmonise.
- Such a study must be based on an attributional modelling approach and include a hydrogen production stage in the system’s boundaries.
- The user must be able to identify the hydrogen production technology involved, the hydrogen carrier and the driving energy.
- The user must know the functional unit used in the original study.
- The user must know the stages involved in the system’s life cycle.
- The user must know the original results for the indicators to be harmonised.
- When the system includes stages beyond hydrogen purification, the user must know the impacts specific to these additional stages.
- The user must be able to identify multifunctional subsystems and quantitatively define the multifunctionality approach originally followed.
- Regarding carbon footprint, the impact assessment method used in the original study must involve IPCC-based characterisation factors (100-year horizon; at least for CO2, N2O, and CH4; kg CO2 eq units).
- Regarding energy footprint, the impact assessment method must be based on the quantification (in MJ) of the sum of fossil and nuclear energy demand from a life-cycle perspective.
- Concerning acidification, the impact assessment method used in the original study must be CML-based and expressed in kg SO2 eq.
- In the first step, information regarding the core technology (reforming, electrolysis, etc.), the type of inputs (heat, electricity, and feedstock) and the reference year and region is requested.
- In the second step, the tool requires the original functional unit, the stages considered, and the impacts per functional unit.
- In the third stage, information regarding multifunctionality (if present) is requested for those subsystems in which multifunctionality takes place. If, according to the protocols, modifications to the original multifunctionality approach are needed, the tool asks for additional information about the amount of co-products, the original allocation factors (if applied), and the original impacts associated with the subsystem.
- In the fourth step, if needed, the tool requests quantitative information on the impacts associated with the life-cycle stages after hydrogen production (i.e., compression/liquefaction, storage, distribution, and use).
- In the fifth step, regarding the conditioning stage, information about the initial pressure (if known) and the type of electricity used for compression is collected. It should be noted that, to increase the applicability of the harmonisation procedure in the event of data scarcity, the tool offers the possibility of using default values at some specific points (e.g., infrastructure, electricity and feedstock impacts).
- Finally, in the sixth step, the tool requests qualitative information about capital goods and quantitative data for relevant inputs (amount of hydrogen carrier and/or driving energy).
3. Results and Discussion
4. Conclusions
Supplementary Materials
Author Contributions
Funding
Conflicts of Interest
Appendix A

| Reference | Code | Hydrogen Production Process | Harmonised Indicators |
|---|---|---|---|
| [22] | SMR1 | Steam reforming of natural gas | GWP |
| [23] | SMR2 | Steam reforming of natural gas | GWP, CED, AP |
| [24] | TCC1 | NiFe2O thermochemical 2-step cycle (heat from solar reactor) | GWP |
| [25] | TCC2 | ZnO thermochemical 2-step cycle (heat from solar reactor) | GWP |
| [25] | SBR1 | Bioethanol reforming (wheat grains) | GWP, AP |
| [26] | SBR2 | Bio-oil reforming (rapeseed oil) | GWP |
| [26] | SBR3 | Bio-oil reforming (palm oil) | GWP |
| [27] | SBR4 | Bioethanol (56%) + CH4 (44%) reforming (cassava) | GWP, AP |
| [27] | SBR5 | Bioethanol reforming (from cassava) | GWP, AP |
| [25] | SBR6 | Autothermal reforming of bioethanol (wheat grains) | GWP, AP |
| [25] | SBR7 | Autothermal reforming of biomethane (cattle manure) | GWP, AP |
| [28] | SBR8 | Biomethane reforming (non-food biowaste) | GWP, AP |
| [28] | SBR9 | Biomethane reforming (German substrate mix) | GWP, AP |
| [29] | SBR10 | Biogas reforming (farm waste) | GWP, CED |
| [25] | SBR11 | Biomethane reforming (cattle manure) | GWP, AP |
| [30] | SBR12 | Bio-oil reforming (fast pyrolysis of wood chips) | GWP, CED |
| [30] | SBR13 | Bio-oil reforming (fast pyrolysis of willow) | GWP, CED |
| [31] | SBR14 | Bio-oil reforming (fast pyrolysis of poplar) | GWP, CED, AP |
| [25] | POX1 | Partial oxidation of biomethane (cattle manure) | GWP, AP |
| [32] | BMG1 | Biomass gasification (short-rotation poplar) | GWP, CED, AP |
| [28] | BMG2 | Biomass gasification (willow) | GWP, AP |
| [33] | BMG3 | Biomass gasification (wood chips) | GWP |
| [23] | BMG4 | Biomass gasification (poplar) | GWP, CED, AP |
| [34] | BMG5 | Biomass gasification (woody biomass) | GWP, AP |
| [35] | BMG6 | Biomass gasification (woody biomass) | GWP |
| [36] | BMG7 | Biomass gasification (vine pruning waste) | GWP, AP |
| [37] | BMG8 | Biomass gasification (woody biomass) | GWP, CED |
| [38] | BMG9 | Biomass gasification with CO2 capture (short-rotation poplar) | GWP, AP |
| [39] | WPE1 | Water electrolysis (wind power) | GWP |
| [40] | WPE2 | Water electrolysis (wind power) | GWP |
| [41] | WPE3 | Water electrolysis (wind power) | GWP |
| [42] | WPE4 | Water electrolysis (wind power) | GWP |
| [43] | WPE5 | Water electrolysis (wind power) | GWP |
| [44] | WPE6 | Water electrolysis (wind power) | GWP |
| [45] | WPE7 | Water electrolysis (wind power) | GWP |
| [35] | WPE8 | Alkaline water electrolysis (wind power) | GWP, CED |
| [46] | WPE9 | Alkaline water electrolysis (asbestos membrane) (wind power) | GWP, AP |
| [46] | WPE10 | Alkaline water electrolysis (advanced membrane) (wind power) | GWP, AP |
| [46] | WPE11 | Alkaline water electrolysis (advanced membrane; optimised system) (wind power) | GWP, AP |
| [47] | WPE12 | Alkaline water electrolysis (Na-Cl cell) (wind power) | GWP |
| [48] | WPE13 | Alkaline water electrolysis (wind power) | GWP |
| [49] | WPE15 | PEM water electrolysis (wind power) | GWP |
| [50] | WPE16 | High-temperature water electrolysis (wind power) | GWP, CED, AP |
| [51] | WPE17 | Alkaline water electrolysis (wind power) | GWP |
| [50] | WPE18 | High-temperature electrolysis (wind power) | GWP, CED, AP |
| [50] | WPE19 | High temperature electrolysis (wind + biogas back-up) | GWP, CED, AP |
| [35] | PVE1 | Alkaline water electrolysis (PV power) | GWP, CED |
| [45] | PVE2 | Water electrolysis (PV power) | GWP |
| [39] | PVE3 | Water electrolysis (PV power) | GWP |
| [40] | PVE4 | Water electrolysis (PV power) | GWP |
| [42] | PVE5 | Water electrolysis (PV power) | GWP |
| [47] | PVE6 | Alkaline water electrolysis (Na-Cl cell) (PV power) | GWP |
| [49] | PVE7 | PEM water electrolysis (PV power) | GWP |
| [51] | PVE8 | Alkaline water electrolysis (PV power) | GWP |
| [52] | PVE9 | Alkaline water electrolysis (PV power) | GWP |
| [51] | CSE1 | Alkaline water electrolysis (thermal solar power) | GWP |
| [35] | CSE2 | Alkaline water electrolysis (thermal solar power) | GWP, CED |
| [35] | HE1 | Alkaline water electrolysis (hydropower) | GWP, CED |
| [53] | HE2 | Alkaline water electrolysis (hydropower) | GWP, CED, AP |
| [51] | HE3 | Alkaline water electrolysis (hydropower) | GWP |
| [52] | HE4 | Alkaline water electrolysis (hydropower) | GWP |
| [51] | BME1 | Alkaline water electrolysis (biomass gasification electricity) | GWP |
| [54] | RNE1 | Alkaline water electrolysis (undefined renewable power) | GWP |
| [33] | RNE2 | Alkaline water electrolysis (undefined renewable power) | GWP |
| [55] | BMF1 | Two-stage fermentation (wheat straw) | GWP |
| [55] | BMF2 | Two-stage fermentation (potatoes peels) | GWP |
| [55] | BMF3 | Two-stage fermentation (sweet stalk) | GWP |
| [56] | BMF4 | Photo-fermentation (sugarcane) | GWP, CED |
| [56] | BMF5 | Dark fermentation (sugarcane) | GWP, CED |
| [56] | BMF6 | Two-stage fermentation (sugarcane) | GWP, CED |
| [57] | MAF1 | Dark fermentation (microalgal sugar) | GWP |
| [57] | MAF2 | Dark fermentation (microalgal sugar) | GWP |
References
- Intergovernmental Panel on Climate Change. Global Warming of 1.5 °C; IPCC: Geneva, Switzerland, 2018. [Google Scholar]
- International Energy Agency. Technology Roadmap-Hydrogen and Fuel Cells; OECD/IEA: Paris, France, 2015. [Google Scholar]
- Dincer, I. Green methods for hydrogen production. Int. J. Hydrog. Energy 2012, 37, 1954–1971. [Google Scholar] [CrossRef]
- International Organization for Standardization. ISO 14040:2006 Environmental Management—Life Cycle Assessment—Principles and Framework; ISO: Geneva, Switzerland, 2006. [Google Scholar]
- International Organization for Standardization. ISO 14044:2006 Environmental Management—Life Cycle Assessment—Requirements and Guidelines; ISO: Geneva, Switzerland, 2006. [Google Scholar]
- De Rosa, M.; Pizzol, M.; Schmidt, J. How methodological choices affect LCA climate impact results: The case of structural timber. Int. J. Life Cycle Assess. 2018, 23, 147–158. [Google Scholar] [CrossRef]
- Ahlgren, S.; Björklund, A.; Ekman, A.; Karlsson, H.; Berlin, J.; Börjesson, P.; Ekvall, T.; Finnveden, G.; Janssen, M.; Strid, I. Review of methodological choices in LCA of biorefinery systems—Key issues and recommendations. Biofuel. Bioprod. Bioref. 2015, 9, 606–619. [Google Scholar] [CrossRef] [Green Version]
- Huang, Y.; Spray, A.; Parry, T. Sensitivity analysis of methodological choices in road pavement LCA. Int. J. Life Cycle Assess. 2013, 18, 93–101. [Google Scholar] [CrossRef]
- Valente, A.; Iribarren, D.; Dufour, J. How do methodological choices affect the carbon footprint of microalgal biodiesel? A harmonised life cycle assessment. J. Clean. Prod. 2019, 207, 560–568. [Google Scholar] [CrossRef]
- Bhandari, R.; Trudewind, C.A.; Zapp, P. Life cycle assessment of hydrogen production via electrolysis—A review. J. Clean. Prod. 2014, 85, 151–163. [Google Scholar] [CrossRef]
- Valente, A.; Iribarren, D.; Dufour, J. Life cycle assessment of hydrogen energy systems: A review of methodological choices. Int. J. Life Cycle Assess. 2017, 22, 346–363. [Google Scholar] [CrossRef]
- Valente, A.; Iribarren, D.; Dufour, J. Harmonised life-cycle global warming impact of renewable hydrogen. J. Clean. Prod. 2017, 149, 762–772. [Google Scholar] [CrossRef]
- Valente, A.; Iribarren, D.; Dufour, J. Harmonising the cumulative energy demand of renewable hydrogen for robust comparative life-cycle studies. J. Clean. Prod. 2018, 175, 384–393. [Google Scholar] [CrossRef]
- Valente, A.; Iribarren, D.; Dufour, J. Harmonising methodological choices in life cycle assessment of hydrogen: A focus on acidification and renewable hydrogen. Int. J. Hydrog. Energy 2019, 44, 19426–19433. [Google Scholar] [CrossRef]
- Valente, A.; Iribarren, D.; Dufour, J. Cumulative Energy Demand of Hydrogen Energy Systems. In Energy Footprints of the Energy Sector; Muthu, S.S., Ed.; Springer: Singapore, Singapore, 2019; pp. 47–75. [Google Scholar]
- Valente, A.; Iribarren, D.; Dufour, J. GreenH2armony®—Harmonised Life Cycle Assessment of Hydrogen Energy Systems. Available online: https://www.greenh2armony.org (accessed on 18 March 2020).
- Valente, A.; Iribarren, D.; Dufour, J. GreenH2armony® v.1.0.0—User’s Guide; IMDEA Energy: Móstoles, Spain, 2019; Available online: https://imdeaenergy.greenh2armony.org/files/user_guide.pdf (accessed on 26 December 2019).
- Singh, A.; Sevda, S.; Abu Reesh, I.M.; Vanbroekhoven, K.; Rathore, D.; Pant, D. Biohydrogen production from lignocellulosic biomass: Technology and sustainability. Energies 2015, 8, 13062–13080. [Google Scholar] [CrossRef] [Green Version]
- Gao, L.; Winfield, Z.C. Life cycle assessment of environmental and economic impacts of advanced vehicles. Energies 2012, 5, 605–620. [Google Scholar] [CrossRef]
- Intergovernmental Panel on Climate Change. Climate Change 2013: The Physical Science Basis—Contribution of Working Group I to the Fifth Assessment Report of the Intergovernmental Panel on Climate Change; Cambridge University Press: Cambridge, UK, 2013. [Google Scholar]
- Guinée, J.B.; Gorrée, M.; Heijungs, R.; Huppes, G.; Kleijn, R.; de Koning, A.; van Oers, L.; Wegener Sleeswijk, A.; Suh, S.; de Haes, H.A.U. Life Cycle Assessment—An Operational Guide to the ISO Standards; Centre of Environmental Science: Leiden, The Netherlands, 2001. [Google Scholar]
- Spath, P.L.; Mann, M.K. Life Cycle Assessment of Hydrogen Production via Natural Gas Steam Reforming; NREL: Golden, CO, USA, 2001.
- Susmozas, A.; Iribarren, D.; Dufour, J. Life-cycle performance of indirect biomass gasification as a green alternative to steam methane reforming for hydrogen production. Int. J. Hydrog. Energy 2013, 38, 9961–9972. [Google Scholar] [CrossRef]
- Dufour, J.; Serrano, D.P.; Gálvez, J.L.; González, A.; Soria, E.; Fierro, J.L.G. Life cycle assessment of alternatives for hydrogen production from renewable and fossil sources. Int. J. Hydrog. Energy 2012, 37, 1173–1183. [Google Scholar] [CrossRef]
- Hajjaji, N.; Pons, M.N.; Renaudin, V.; Houas, A. Comparative life cycle assessment of eight alternatives for hydrogen production from renewable and fossil feedstock. J. Clean. Prod. 2013, 44, 177–189. [Google Scholar] [CrossRef]
- Marquevich, M.; Sonnemann, G.W.; Castells, F.; Montané, D. Life cycle inventory analysis of hydrogen production by the steam-reforming process: Comparison between vegetable oils and fossil fuels as feedstock. Green Chem. 2002, 4, 414–423. [Google Scholar] [CrossRef]
- Authayanun, S.; Suwanmanee, U.; Arpornwichanop, A. Enhancement of dilute bio-ethanol steam reforming for a proton exchange membrane fuel cell system by using methane as co-reactant: Performance and life cycle assessment. Int. J. Hydrog. Energy 2015, 40, 12144–12153. [Google Scholar] [CrossRef]
- Wulf, C.; Kaltschmitt, M. Life cycle assessment of biohydrogen production as a transportation fuel in Germany. Bioresour. Technol. 2013, 150, 466–475. [Google Scholar] [CrossRef]
- Hajjaji, N.; Martinez, S.; Trably, E.; Steyer, J.P.; Helias, A. Life cycle assessment of hydrogen production from biogas reforming. Int. J. Hydrog. Energy 2016, 41, 6064–6075. [Google Scholar] [CrossRef]
- Heracleous, E. Well-to-Wheels analysis of hydrogen production from bio-oil reforming for use in internal combustion engines. Int. J. Hydrog. Energy 2011, 36, 11501–11511. [Google Scholar] [CrossRef]
- Susmozas, A.; Iribarren, D.; Dufour, J. Assessing the life-cycle performance of hydrogen production via biofuel reforming in Europe. Resources 2015, 4, 398–411. [Google Scholar] [CrossRef] [Green Version]
- Iribarren, D.; Susmozas, A.; Petrakopoulou, F.; Dufour, J. Environmental and exergetic evaluation of hydrogen production via lignocellulosic biomass gasification. J. Clean. Prod. 2014, 69, 165–175. [Google Scholar] [CrossRef]
- Wulf, C.; Kaltschmitt, M. Life cycle assessment of hydrogen supply chain with special attention on hydrogen refuelling stations. Int. J. Hydrog. Energy 2012, 37, 16711–16721. [Google Scholar] [CrossRef]
- Weinberg, J.; Kaltschmitt, M. Life cycle assessment of mobility options using wood based fuels—Comparison of selected environmental effects and costs. Bioresour. Technol. 2013, 150, 420–428. [Google Scholar] [CrossRef]
- Simons, A.; Bauer, C. Life cycle assessment of hydrogen production. In Transition to Hydrogen—Pathways toward Clean Transportation; Wokaun, A., Wilhelm, E., Eds.; Cambridge University Press: Cambridge, UK, 2011; pp. 13–57. [Google Scholar]
- Martín-Gamboa, M.; Iribarren, D.; Susmozas, A.; Dufour, J. Delving into sensible measures to enhance the environmental performance of biohydrogen: A quantitative approach based on process simulation, life cycle assessment and data envelopment analysis. Bioresour. Technol. 2016, 214, 376–385. [Google Scholar] [CrossRef]
- Koroneos, C.; Dompros, A.; Roumbas, G. Hydrogen production via biomass gasification—A life cycle assessment approach. Chem. Eng. Process. 2008, 47, 1261–1268. [Google Scholar] [CrossRef]
- Susmozas, A.; Iribarren, D.; Zapp, P.; Linβen, J.; Dufour, J. Life-cycle performance of hydrogen production via indirect biomass gasification with CO2 capture. Int. J. Hydrog. Energy 2016, 41, 19484–19491. [Google Scholar] [CrossRef]
- Ramos Pereira, S.; Coelho, M.C. Life cycle analysis of hydrogen—A well-to-wheels analysis for Portugal. Int. J. Hydrog. Energy 2013, 38, 2029–2038. [Google Scholar] [CrossRef]
- Granovskii, M.; Dincer, I.; Rosen, M.A. Life cycle assessment of hydrogen fuel cell and gasoline vehicles. Int. J. Hydrog. Energy 2006, 31, 337–352. [Google Scholar] [CrossRef]
- Spath, P.L.; Mann, M.K. Life Cycle Assessment of Renewable Hydrogen Production via Wind/Electrolysis; NREL: Golden, CO, USA, 2004.
- Granovskii, M.; Dincer, I.; Rosen, M.A. Exergetic life cycle assessment of hydrogen production from renewables. J. Power Sources 2007, 167, 461–471. [Google Scholar] [CrossRef]
- Khan, F.I.; Hawboldt, K.; Iqbal, M.T. Life Cycle Analysis of wind–fuel cell integrated system. Renew. Energy 2005, 30, 157–177. [Google Scholar] [CrossRef]
- Miotti, M.; Hofer, J.; Bauer, C. Integrated environmental and economic assessment of current and future fuel cell vehicles. Int. J. Life Cycle Assess. 2017, 22, 94–110. [Google Scholar] [CrossRef] [Green Version]
- Cetinkaya, E.; Dincer, I.; Naterer, G.F. Life cycle assessment of various hydrogen production methods. Int. J. Hydrog. Energy 2012, 37, 2071–2080. [Google Scholar] [CrossRef]
- Koj, J.C.; Schreiber, A.; Zapp, P.; Marcuello, P. Life cycle assessment of improved high pressure alkaline electrolysis. Energy Procedia 2015, 75, 2871–2877. [Google Scholar] [CrossRef] [Green Version]
- Suleman, F.; Dincer, I.; Agelin-Chaab, M. Environmental impact assessment and comparison of some hydrogen production options. Int. J. Hydrog. Energy 2015, 40, 6976–6987. [Google Scholar] [CrossRef]
- Lee, J.Y.; An, S.; Cha, K.; Hur, T. Life cycle environmental and economic analyses of a hydrogen station with wind energy. Int. J. Hydrog. Energy 2010, 35, 2213–2225. [Google Scholar] [CrossRef]
- Reiter, G.; Lindorfer, J. Global warming potential of hydrogen and methane production from renewable electricity via power-to-gas technology. Int. J. Life Cycle Assess. 2015, 20, 477–489. [Google Scholar] [CrossRef]
- Patyk, A.; Bachmann, T.M.; Brisse, A. Life cycle assessment of H2 generation with high temperature electrolysis. Int. J. Hydrog. Energy 2013, 38, 3865–3880. [Google Scholar] [CrossRef]
- Koroneos, C.; Dompros, A.; Roumbas, G.; Moussiopoulos, N. Life cycle assessment of hydrogen fuel production processes. Int. J. Hydrog. Energy 2004, 29, 1443–1450. [Google Scholar] [CrossRef]
- Lombardi, L.; Carnevale, E.; Corti, A. Life cycle assessment of different hypotheses of hydrogen production for vehicle fuel cells fuelling. Int. J. Energy Environ. Eng. 2011, 2, 63–78. [Google Scholar]
- Valente, A.; Iribarren, D.; Dufour, J.; Spazzafumo, G. Life-cycle performance of hydrogen as an energy management solution in hydropower plants: A case study in Central Italy. Int. J. Hydrog. Energy 2015, 40, 16660–16672. [Google Scholar] [CrossRef]
- Mori, M.; Jensterle, M.; Mržljak, T.; Drobnič, B. Life-cycle assessment of a hydrogen-based uninterruptible power supply system using renewable energy. Int. J. Life Cycle Assess. 2014, 19, 1810–1822. [Google Scholar] [CrossRef]
- Djomo, S.N.; Blumberga, D. Comparative life cycle assessment of three biohydrogen pathways. Bioresour. Technol. 2011, 102, 2684–2694. [Google Scholar] [CrossRef] [PubMed]
- Manish, S.; Banerjee, R. Comparison of biohydrogen production processes. Int. J. Hydrog. Energy 2008, 33, 279–286. [Google Scholar] [CrossRef]
- Pacheco, R.; Ferreira, A.F.; Pinto, T.; Nobre, B.P.; Loureiro, D.; Moura, P.; Gouveia, L.; Silva, C.M. The production of pigments & hydrogen through a Spirogyra sp. biorefinery. Energy Convers. Manag. 2015, 89, 789–797. [Google Scholar]
- Valente, A.; Iribarren, D.; Dufour, J. GreenH2armony® v.1.0.0—Demo Video; IMDEA Energy: Móstoles, Spain, 2019; Available online: https://imdeaenergy.greenh2armony.org/video/demo.mp4 (accessed on 27 December 2019).
| Code | Library-Based GWP | Tool-Based GWP | Error [Absolute] (Relative) | Comment |
|---|---|---|---|---|
| SMR1 | 12.95 | 12.85 | [−0.10] (−0.8%) | Negligible error |
| SMR2 | 11.43 | 11.32 | [−0.11] (−1.0%) | Negligible error |
| BMG4 | 0.18 | 0.05 | [−0.13] (−260%) | Negligible error |
| HE2 | 0.77 | 0.77 | [0.00] (0.0%) | Negligible error |
| BMG1 | 2.09 | 2.10 | [0.01] (0.5%) | Negligible error |
| BMG2 | 4.40 | 4.36 | [−0.04] (−0.9%) | Negligible error |
| SBR8 | 6.98 | 6.86 | [−0.12] (−1.7%) | Negligible error |
| SBR9 | 7.22 | 7.14 | [−0.08] (−1.1%) | Negligible error |
| WPE15 | 0.74 | 0.75 | [0.01] (1.3%) | Negligible error |
| PVE7 | 3.22 | 3.23 | [0.01] (0.3%) | Negligible error |
| WPE7 | 1.15 | 1.16 | [0.01] (0.6%) | Negligible error |
| PVE2 | 2.59 | 2.61 | [0.02] (0.8%) | Negligible error |
| WPE16 | 0.63 | 0.64 | [0.01] (0.9%) | Negligible error |
| WPE18 | 0.81 | 0.81 | [0.00] (0.0%) | Negligible error |
| WPE19 | 2.29 | 2.31 | [0.02] (0.9%) | Negligible error |
| WPE13 | 0.85 | 0.85 | [0.00] (0.0%) | Negligible error |
| RNE2 | 3.52 | 3.52 | [0.00] (0.0%) | Negligible error |
| BMF1 | 4.51 | 4.52 | [0.01] (0.2%) | Negligible error |
| BMF2 | 2.39 | 2.39 | [0.00] (0.0%) | Negligible error |
| BMF3 | 4.96 | 5.02 | [0.06] (1.2%) | Negligible error |
| WPE17 | 0.84 | 0.84 | [0.00] (0.0%) | Negligible error |
| CSE1 | 2.20 | 2.20 | [0.00] (0.0%) | Negligible error |
| PVE8 | 5.04 | 5.04 | [0.00] (0.0%) | Negligible error |
| HE3 | 1.99 | 1.99 | [0.00] (0.0%) | Negligible error |
| BME1 | 1.72 | 1.58 | [−0.14] (−8.9%) | Negligible error |
| BMG8 | 10.47 | 10.49 | [0.02] (0.2%) | Negligible error |
| BMF4 | 5.01 | 4.83 | [−0.18] (−3.7%) | Negligible error |
| BMF5 | 7.36 | 7.19 | [−0.17] (−2.4%) | Negligible error |
| BMF6 | 4.89 | 4.62 | [−0.27] (−5.8%) | Negligible error |
| WPE1 | 1.08 | 1.06 | [−0.02] (−1.9%) | Negligible error |
| PVE3 | 5.75 | 5.73 | [−0.02] (−0.3%) | Negligible error |
| WPE2 | 0.97 | 0.99 | [0.02] (2.0%) | Negligible error |
| WPE3 | 0.96 | 0.96 | [0.00] (0.0%) | Negligible error |
| WPE4 | 0.96 | 0.99 | [0.03] (3%) | Negligible error |
| PVE5 | 2.37 | 2.38 | [0.01] (0.4%) | Negligible error |
| WPE5 | 0.51 | 0.64 | [0.13] (20.3%) | Negligible error |
| WPE6 | 2.02 | 2.29 | [0.27] (11.8%) | Negligible error |
| WPE9 | 0.73 | 0.71 | [−0.02] (−2.8%) | Negligible error |
| WPE10 | 0.68 | 0.66 | [−0.02] (−3.0%) | Negligible error |
| WPE11 | 0.68 | 0.66 | [−0.02] (−3.0%) | Negligible error |
| WPE12 | 0.16 | 0.16 | [0.00] (0.0%) | Negligible error |
| PVE6 | 0.69 | 0.69 | [0.00] (0.0%) | Negligible error |
| PVE9 | 7.54 | 7.30 | [−0.24] (−3.3%) | Negligible error |
| RNE1 | 6.11 | 6.07 | [−0.04] (−0.7%) | Negligible error |
| TCC1 | 6.81 | 6.39 | [−0.42] (−6.6%) | Negligible error |
| TCC2 | 6.69 | 6.36 | [−0.33] (−5.2%) | Negligible error |
| SBR1 | 10.36 | 10.25 | [−0.11] (−1.1%) | Negligible error |
| SBR6 | 9.94 | 9.83 | [−0.11] (−1.1%) | Negligible error |
| SBR7 | 5.79 | 5.67 | [−0.12] (−2.1%) | Negligible error |
| SBR11 | 5.80 | 5.69 | [−0.11] (−1.9%) | Negligible error |
| POX1 | 5.88 | 5.78 | [−0.10] (−1.7%) | Negligible error |
| SBR10 | 7.34 | 7.24 | [−0.10] (−1.4%) | Negligible error |
| SBR2 | 7.35 | 7.24 | [−0.11] (−1.5%) | Negligible error |
| SBR3 | 5.25 | 5.14 | [−0.11] (−2.1%) | Negligible error |
| SBR4 | 5.04 | 4.92 | [−0.12] (−2.4%) | Negligible error |
| SBR5 | 11.78 | 11.67 | [−0.11] (−0.9%) | Negligible error |
| SBR12 | 5.82 | 5.75 | [−0.07] (−1.2%) | Negligible error |
| SBR13 | 7.42 | 7.30 | [−0.12] (−1.6%) | Negligible error |
| BMG5 | 4.16 | 4.53 | [0.37] (8.2%) | Negligible error |
| BMG7 | −0.13 | −0.17 | [−0.04] (23.5%) | Negligible error |
| SBR14 | 5.24 | 5.15 | [−0.09] (−1.7%) | Negligible error |
| BMG9 | −24.19 | −23.10 | [1.09] (−4.7%) | Negligible error |
| MAF1 | 51.70 | 51.60 | [−0.10] (−0.2%) | Negligible error |
| MAF3 | 1707.60 | 1707.50 | [−0.10] (0.0%) | Negligible error |
| HE4 | 11.54 | 9.20 | [−2.34] (−25.4%) | Human factor: misreading of the original impact |
| HE1 | 1.02 | 1.82 | [0.80] (44.0%) | Human factor: wrong functional unit conversion |
| PVE1 | 2.18 | 3.98 | [1.80] (45.2%) | Human factor: wrong functional unit conversion |
| CSE2 | 1.72 | 3.30 | [1.58] (47.9%) | Human factor: wrong functional unit conversion |
| WPE8 | 1.20 | 2.10 | [0.90] (42.9%) | Human factor: misreading of the original impact |
| BMG6 | 8.00 | 18.52 | [10.52] (56.8%) | Human factor: misreading of the original impact |
| PVE4 | 3.98 | 2.29 | [−1.69] (−73.8%) | Human factor: incorrect harmonisation of compression |
| BMG3 | 1.62 | 3.18 | [1.56] (49.1%) | Human factor: incorrect harmonisation of compression |
| Code | Library-Based CED | Tool-Based CED | Error [Absolute] (Relative) | Comment |
|---|---|---|---|---|
| SMR2 | 200.95 | 200.39 | [−0.56] (−0.3%) | Negligible error |
| BMG4 | 25.36 | 24.79 | [−0.57] (−2.3%) | Negligible error |
| HE2 | 8.71 | 8.70 | [−0.01] (−0.1%) | Negligible error |
| BMG1 | 41.86 | 41.96 | [0.10] (0.2%) | Negligible error |
| WPE16 | 8.07 | 8.06 | [−0.01] (−0.1%) | Negligible error |
| WPE18 | 11.46 | 11.41 | [−0.05] (−0.4%) | Negligible error |
| WPE19 | 17.57 | 17.55 | [−0.02] (−0.1%) | Negligible error |
| BME1 | 35.50 | 36.80 | [1.30] (3.5%) | Negligible error |
| BMF4 | 91.12 | 89.32 | [−1.80] (−2.0%) | Negligible error |
| BMF5 | 183.72 | 185.58 | [1.86] (1.0%) | Negligible error |
| BMF6 | 87.74 | 87.73 | [−0.01] (0.0%) | Negligible error |
| HE1 | 23.90 | 24.00 | [0.10] (0.4%) | Negligible error |
| PVE1 | 59.37 | 56.50 | [−2.87] (−5.1%) | Negligible error |
| CSE1 | 44.28 | 40.09 | [−4.19] (−10.5%) | Negligible error |
| WPE8 | 29.93 | 29.87 | [−0.06] (−0.2%) | Negligible error |
| SBR12 | 111.22 | 111.93 | [0.71] (0.6%) | Negligible error |
| SBR13 | 113.98 | 112.71 | [−1.27] (−1.1%) | Negligible error |
| MBG7 | 3.00 | 4.90 | [1.90] (38.8%) | Negligible error |
| SBR14 | 114.66 | 114.56 | [−0.10] (−0.1%) | Negligible error |
| BMG8 | 20.40 | 20.20 | [−0.20] (−1.0%) | Negligible error |
| SBR10 | 98.19 | 42.11 | [−56.08] (−133.2%) | Human factor: wrong consideration of capital goods |
| Code | Library-Based AP | Tool-Based AP | Error [Absolute] (Relative) | Comment |
|---|---|---|---|---|
| SMR2 | 1.86·10−2 | 1.85·10−2 | [−1.00·10−4] (−0.5%) | Negligible error |
| BMG4 | 1.45·10−2 | 1.43·10−2 | [−2.00·10−4] (−1.4%) | Negligible error |
| HE2 | 2.23·10−3 | 2.15·10−3 | [−8.00·10−5] (−3.7%) | Negligible error |
| BMG1 | 1.72·10−2 | 1.72·10−2 | [2.00·10−5] (0.1%) | Negligible error |
| BMG2 | 1.49·10−2 | 1.44·10−2 | [−5.00·10−4] (−3.5%) | Negligible error |
| SBR8 | 9.29·10−2 | 9.37·10−2 | [8.00·10−4] (0.9%) | Negligible error |
| SBR9 | 1.24·10−1 | 1.20·10−1 | [−4.14·10−3] (−3.5%) | Negligible error |
| WPE16 | 2.40·10−3 | 2.40·10−3 | [0.00] (0.0%) | Negligible error |
| WPE18 | 3.70·10−3 | 3.73·10−3 | [3.00·10−5] (0.8%) | Negligible error |
| WPE9 | 4.15·10−3 | 4.30·10−3 | [1.50·10−4] (3.5%) | Negligible error |
| WPE10 | 3.05·10−3 | 3.10·10−3 | [5.00·10−5] (1.6%) | Negligible error |
| WPE11 | 3.05·10−3 | 3.10·10−3 | [5.00·10−5] (1.6%) | Negligible error |
| SBR1 | 5.61·10−2 | 5.62·10−2 | [1.00·10−4] (0.2%) | Negligible error |
| SBR6 | 5.38·10−2 | 5.38·10−2 | [0.00] (0.0%) | Negligible error |
| SBR7 | −3.81·10−2 | −3.81·10−2 | [0.00] (0.0%) | Negligible error |
| SBR11 | −4.40·10−2 | −4.40·10−2 | [0.00] (0.0%) | Negligible error |
| POX1 | −3.71·10−2 | −3.71·10−2 | [0.00] (0.0%) | Negligible error |
| BMG5 | 1.63·10−2 | 1.64·10−2 | [1.00·10−4] (0.6%) | Negligible error |
| BMG7 | 9.62·10−3 | 9.65·10−3 | [3.00·10−5] (0.3%) | Negligible error |
| SBR14 | 7.27·10−2 | 7.27·10−2 | [0.00] (0.0%) | Negligible error |
| BMG9 | 2.01·10−2 | 2.02·10−2 | [1.00·10−4] (0.5%) | Negligible error |
| SBR4 | 7.02·10−3 | 1.23·10−2 | [5.28·10−3] (42.9%) | Human factor: wrong functional unit conversion |
| SBR5 | 2.56·10−2 | 2.75·10−3 | [−2.29·10−2] (−830.9%) | Human factor: wrong functional unit conversion |
© 2020 by the authors. Licensee MDPI, Basel, Switzerland. This article is an open access article distributed under the terms and conditions of the Creative Commons Attribution (CC BY) license (http://creativecommons.org/licenses/by/4.0/).
Share and Cite
Valente, A.; Iribarren, D.; Dufour, J. Validation of GreenH2armony® as a Tool for the Computation of Harmonised Life-Cycle Indicators of Hydrogen. Energies 2020, 13, 1603. https://doi.org/10.3390/en13071603
Valente A, Iribarren D, Dufour J. Validation of GreenH2armony® as a Tool for the Computation of Harmonised Life-Cycle Indicators of Hydrogen. Energies. 2020; 13(7):1603. https://doi.org/10.3390/en13071603
Chicago/Turabian StyleValente, Antonio, Diego Iribarren, and Javier Dufour. 2020. "Validation of GreenH2armony® as a Tool for the Computation of Harmonised Life-Cycle Indicators of Hydrogen" Energies 13, no. 7: 1603. https://doi.org/10.3390/en13071603