Article

Dynamics of Large Scale Turbulence in Finite-Sized Wind Farm Canopy Using Proper Orthogonal Decomposition and a Novel Fourier-POD Framework

1
General Electric Company (GE Global Research), Niskayuna, NY 12309, USA
2
Mechanical and Aerospace Engineering, Arizona State University, Tempe, AZ 85287, USA
*
Author to whom correspondence should be addressed.
Energies 2020, 13(7), 1660; https://doi.org/10.3390/en13071660
Submission received: 25 February 2020 / Revised: 22 March 2020 / Accepted: 25 March 2020 / Published: 2 April 2020
(This article belongs to the Special Issue Fluid Mechanics and Turbulence in Wind Farms)

Abstract

:
Large scale coherent structures in the atmospheric boundary layer (ABL) are known to contribute to the power generation in wind farms. In order to understand the dynamics of large scale structures, we perform proper orthogonal decomposition (POD) analysis of a finite sized wind turbine array canopy in the current paper. The POD analysis sheds light on the dynamics of large scale coherent modes as well as on the scaling of the eigenspectra in the heterogeneous wind farm. We also propose adapting a novel Fourier-POD (FPOD) modal decomposition which performs POD analysis of spanwise Fourier-transformed velocity. The FPOD methodology helps us in decoupling the length scales in the spanwise and streamwise direction when studying the 3D energetic coherent modes. Additionally, the FPOD eigenspectra also provide deeper insights for understanding the scaling trends of the three-dimensional POD eigenspectra and its convergence, which is inherently tied to turbulent dynamics. Understanding the behaviour of large scale structures in wind farm flows would not only help better assess reduced order models (ROM) for forecasting the flow and power generation but would also play a vital role in improving the decision making abilities in wind farm optimization algorithms in future. Additionally, this study also provides guidance for better understanding of the POD analysis in the turbulence and wind farm community.

1. Introduction

Wind farms in the atmospheric boundary layer (ABL) pose a complex dynamical system with turbulent phenomenology occurring at multiple length scales, mainly due to the interaction of atmospheric boundary layer turbulent eddies [1] and the turbulence generated by the wind turbine wakes [2,3,4]. These interactions are manifested not only in the small scale structures (of the order or smaller than the turbine rotor diameter) but also in the large scale structures (one or two orders of magnitude larger than the turbine rotor diameter) [5]. In the current paper, we are concerned with the understanding of these large turbulent structures which arguably can serve as mediators to the generation of large scale motions or very large scale motions [6] (LSMs or VLSMs) which has significant contribution to wind farm power [4,7]. Several researchers have shown before that large scale counter-rotating roll cell structures are formed in the atmospheric boundary layer [8,9]. From the perspective of understanding the phenomenology, Chauhan et al. [10] predicted the dynamics of such large structures using two-point correlations from field experiments in Utah’s western desert. Hutchins et al. [11] predicted the universality of these structures in laboratory scale and an atmospheric surface layer. In particular, Ref. [11] also illustrated the similarity of neutrally-stratified atmospheric surface layer flows and canonical wall-bounded turbulence and the formation of large-scale counter rotating roll vortices in both flows. Further details of the roll-cells in planetary boundary layers can be found in the work of Etling et al. [8] and Yong et al. [9]. In the presence of wind farms, the ABL modulates such structures in and around the turbine rotors as illustrated in the field [12], laboratory-scale experiments [7,13] as well as LES simulations [2,5,14]. Proper orthogonal decomposition (POD) [15,16,17], has been popularly used by the community to perform detailed analysis of these large scale roll structures [15], because of its inherent nature to “rank” the coherent turbulent eddies based on their kinetic energy content (POD eigenvalues). In the current manuscript we are primarily interested in the POD analysis of a finite-sized wind farm where the flow is heterogeneous in the streamwise direction. Finite sized wind farms have multiple applications, e.g., fundamentally understanding the entrance region of very large wind farms [18] without being restrained by computational expense. These finite sized turbine arrays also find their place in utility scale farms e.g., in a distributed wind setup aimed for powering rural or remote sub-urban community [19]. One of the key problems, in the snapshot-based POD analysis [20,21] (more popular because it is computationally cheap), is that the snapshots need to be quite far spaced (more than three flow though times apart), such that the snapshots are linearly independent of each other for the generation of the correlation matrix in POD, and hence capture the large scale structures/modes (having large decorrelation times). Restrained by the computational expense, the number of snapshots in such a case involving finite sized wind farm canopy will be quite limited, which will detrimentally impact the scaling and the convergence of the POD eigenspectra. Previous work by turbulence/wind community have not addressed this issue explicitly [22]. This problem was circumvented by performing the analysis on a periodic wind farm [15]. In this way even though very few distant spaced (3 flow through times apart) snapshots are generated by solving the Navier-Stokes equation, the number can be artificially amplified by “shifting” the snapshot data across the streamwise and spanwise distance between the turbines. The shifting method only works if the wind farms are arranged in a completely matrix setting ( n x × n y turbines) in a horizontally periodic framework. In this case the total number of snapshots generated for POD would be n x n y times the snapshots obtained from simulations. In the finite sized wind farm, as in the current manuscript, due to the heterogeneity of the farm layout and the geometry of the domain, such shifting is not possible, and at most we can increase the number of snapshots by two times by reflecting the data across the x z plane of symmetry passing through the middle row of turbines. Thus the data from finite-sized wind farm simulation serves as a perfect candidate for performing such POD analysis studies. As we will see later, this creates a limitation on the total number of snapshots we can generate that impacts negatively on the convergence of the POD eigenspectra. Additionally after performing detailed analysis of the eigenspectra and understanding the dynamics of the 3D eigenmodes, we adapt a Fourier-POD (FPOD)-based framework for better understanding of the eigenspectra (most importantly their convergence) as well as the modes. In this methodology, we perform POD analysis of laterally/spanwise Fourier transformed snapshots rather than the 3D snapshots themselves. As will be discussed in the subsequent section, we see that the FPOD modes can provide better insights to the scaling laws of the eigenspectra as well as elucidate on the turbulent structures which contribute to the problem of “slower convergence” of the spectra. Ideas for computing POD with a similar spirit exists in the literature, e.g., spectral POD (SPOD) by Towne and coworkers [23], where the temporal Fourier transform of the correlation function is used for POD eigendecomposition problem in order to understand the modal frequency content. Towne and coworkers also showed the connection between SPOD and dynamic mode decomposition (DMD) [24]. Recently, Zhang et al. [17] have utilized SPOD analysis specifically for the wind farm problem. Hamilton and coworkers [25,26] have introduced methodologies like dual POD as well as 2D-POD at each streamwise location in an effort to understand the streamwise dependencies of the coherent structures for wind farms. Glegg and Devenport [27] have also shown that for a problem involving turbulence-acoustics interference, POD can be performed in combination with linear stochastic estimator in the homogeneous direction (space or time for homogeneous/stationary flows) to describe flows and that such analysis requires less modes for a flow representation than the conventional 3D POD. The methods described above have utilized POD such that additional information of length scale dynamics and/or decoupling streamwise and spanwise length scales is possible. The concept of Fourier-POD itself is not uncommon in the turbulence community and can be found in many canonical flows having a homogeneous direction, the most recent being Rayleigh Benard convection [28,29]. Contrary to the previous methods, the FPOD methodology (operated on complex-valued two dimensional fields) and its novelty in the current work lies in its introduction to: (1) gaining physical insight to the convergence of the 3D eigenspectra and (2) showing a comparison of the reconstructed physical modes from both FPOD and 3D POD decomposition. Additionally, FPOD also helps us decouple length scales of the energetic eddies based on the spanwise and streamwise direction of the flow.
The aim of the current work is to understand the dynamics of the coherent structures in a finite-sized wind farm using POD analysis. In this context, we first evaluate a traditional 3D POD methodology in the form of a method of snapshots, and then propose an improvement to the traditional methodology, the so-called Fourier-POD method, which demonstrates a faster convergence of the eigenspectra owing to an imposition of analytically optimum modes (Fourier modes) in a periodic direction. The second objective of the manuscript is to propose a physical interpretation of the FPOD modes and compare them with the corresponding 3D-POD results. This work would help us better assess the potential of reduced order models (ROM) for a compact representation of the complex wind farm flow physics, and their ultimate utilization for a forecasting the flow and power generation in heterogeneous wind farms.
The paper is organized as follows. First, we briefly discuss the numerical setup with regards to the large eddy simulation (LES) framework used for the wind farm simulations. Second, we introduce the mathematical formulation of both 3D-POD, and a novel 2D Fourier-POD analysis framework. Subsequently, we present the results of 3D-POD and 2D FPOD methodology. Finally, we conclude by highlighting the merits of a 2D Fourier-POD methodology in understanding the physics of wind farm flows as compared to its 3D POD counterpart.

2. Numerical Setup

The database for the finite sized wind farm was obtained from spectral element simulations in LES carried out in our previous work [5,30,31]. In particular, we used the open-source exponentially accurate spectral element code Nek5000 [32,33] for setting up the LES simulation. Nek5000 solves the incompressible Navier-Stokes equation in a variational/weak formulation with tessellating the domain into 3D hexahedral elements. The variables, velocity, pressure etc., are expanded as higher order Legendre polynomials within each element and the gridpoints where the polynomials are defined correspond to the roots of the polynomials. For the velocity, Gauss-Lobatto-Legendre (GLL) points were used within each element while for pressure, Gauss-Lobatto (GL) points were used in the current formulation.
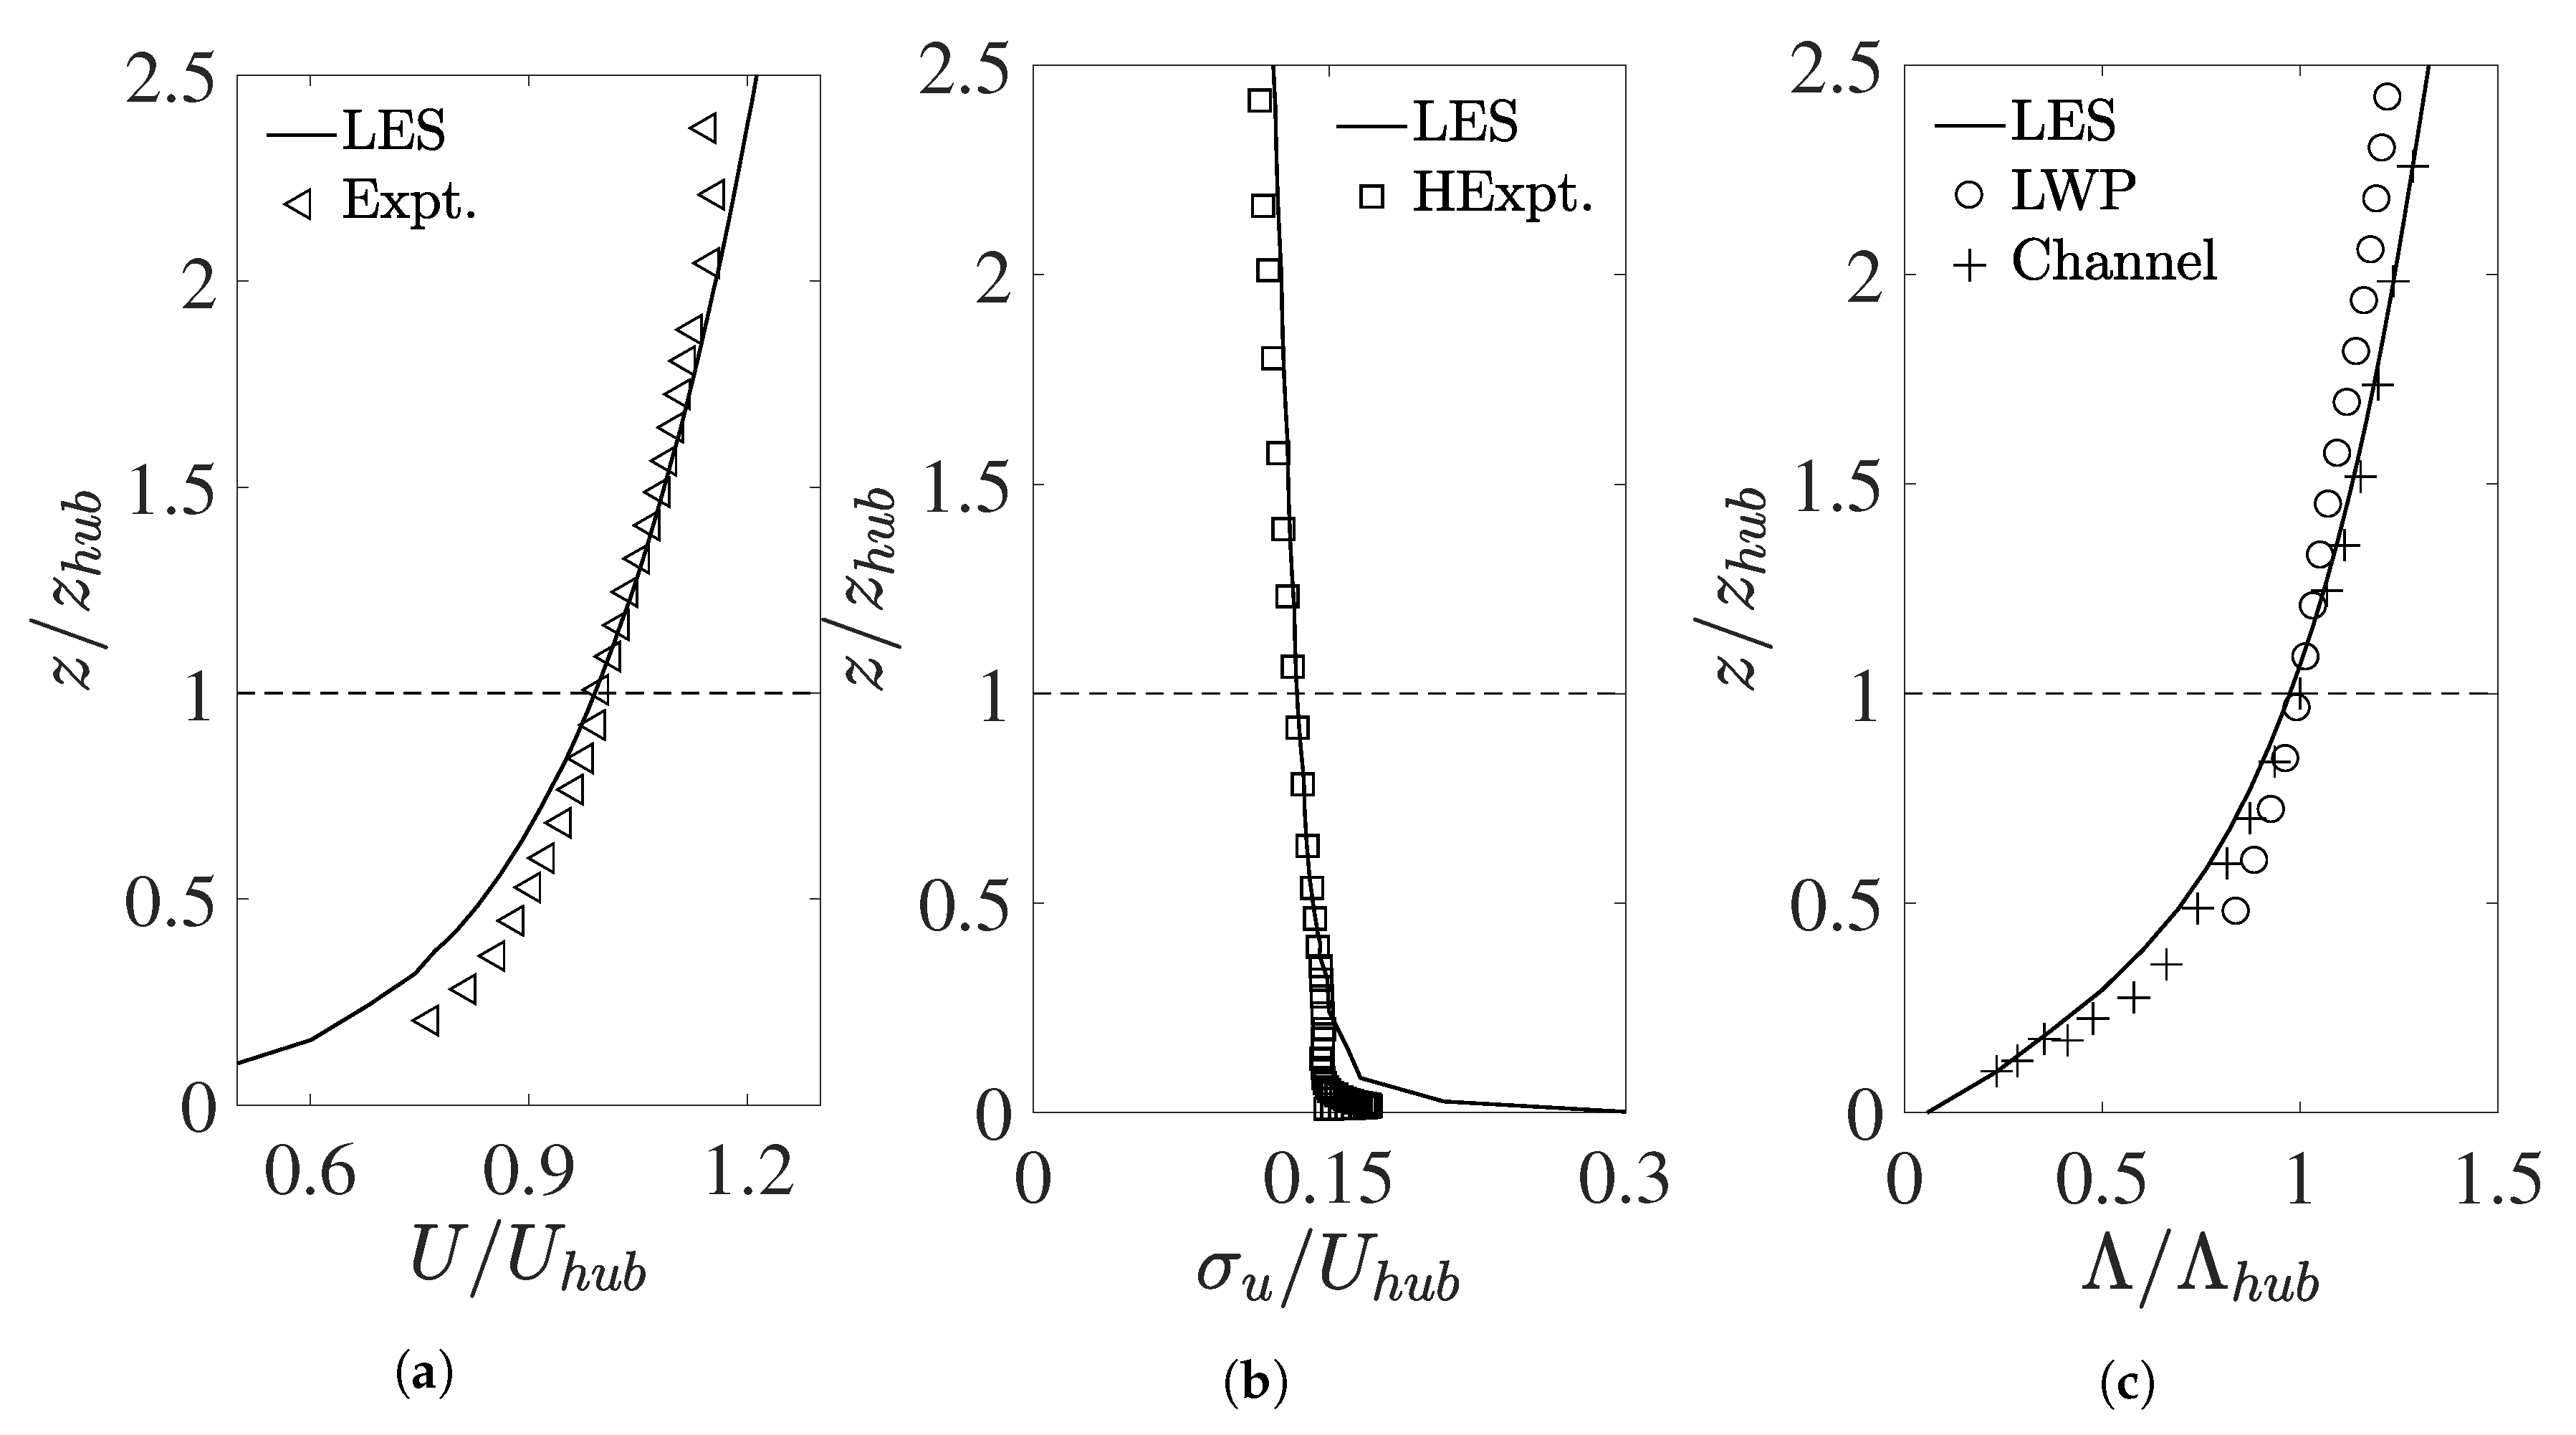
The domain consisted of a 3 × 3 , finite-sized, wind turbine array (WT) layout in an inflow-outflow [30,34] setup. (Please see Figure 1 for the 3 dimensional schematic of the layout). The inter-turbine streamwise and spanwise distances were 7 d and 3 d respectively. The wind turbine rotors in the finite sized array, d were set to be 20 % of the ABL thickness, H: d = 0.2 H , and the hub-height being z h u b = d = 0.2 H . Such a setup of hub-heights is consistent with the wind-tunnel laboratory scale wind turbine tests carried out in the past [7,35]. The vertical height of the domain was H = 5 d . The LES framework involved wall-modeled large eddy simulation with the subgrid scale closure designed as an algebraic wall-damped Mason and Thompson model [36,37,38] and the bottom wall boundary condition prescribed as a wall shear-stress (corresponding to the log-law of the wall). The validation of the wall-modeled LES framework for the precursor neutral ABL [5] (used as an inflow boundary condition to the WT array) compared against experimental data is illustrated in Figure 2. The streamwise velocity, streamwise variance and the integral length scale for the neutral ABL showed expected trends when compared against experimental data obtained from both wind tunnel [39,40] and field experiments [41], as well as high-fidelity numerical simulations [42]. Additionally, our LES model tested in a neutral ABL framework manifested correct logarithmic trends of the velocity profile at the log-layer and inverse scaling laws of the energy spectra [37] at large wavenumbers.
For more details related to the validation of the LES framework of neutral ABL and wind farm simulations in spectral elements, please refer to the authors’ previous work [5,43]. The wind turbines are modeled as actuator-line (AL) models [39,44,45,46] without having to resolve the blades. In the current AL simulations, Tjæreborg turbines have been used [44]. The lift and drag coefficients for the blades were taken from the NACA 44xx series aerofoil wind tunnel measurements performed on NACA airfoils at a chord Reynolds number, R e c = 6 × 10 6 . The equivalent time-varying thrust coefficient of the turbines is in the range of C T 0.7–0.8, which is similar to C T = 0.75 used in the actuator disk model of [2]. Each actuator line is discretized using 30 uniformly sized blade elements (i.e., per rotor radius) as in [44]. The AL model is of a higher fidelity than the actuator-disc model ([2,15,47]) commonly used in numerical computations of wind farms, in its capability to capture the tip vortices being shed in the near wake ([44,45]).
Moreover, the finite-sized layout is inherently heterogeneous due to the streamwise growth of the internal boundary layer, wake impingement effects etc. The top boundary condition of the finite-sized wind farm array is “symmetry” or no mass transport in nature which mimics an inversion layer as in a conventionally neutral boundary layer [48,49]. For the current setup, the artificial inversion layer is five times the hub-height (equivalently, five times the rotor diameter) of the turbines and can be thought of as low-lying [48]. From the perspective of canopy turbulence, it is apparent that the ABL above the wind turbine canopy is essentially the “canopy sub-layer” (vertical domain size 5 d = 5 z h u b ). (The canopy sublayer is where the turbulent eddy effects of the canopy are still felt and is roughly five times the canopy height or even larger, see [50,51,52] for details of recent canopy/roughness sublayer fundamentals). Table 1 shows the specification of the domain size of the wind turbine array as well as the precursor neutral ABL which is concurrently simulated to generate inflow conditions [30,31]. Additionally, the grid counts and the average normalized grid sizes for the farm layout as well as neutral ABL (turbulent scales fed to the inflow) can be found in Table 2. This illustrates that the smallest resolved length scales is an order of magnitude smaller than the turbine rotor size, d. Note, here that the definition of lengthscales or wavelength resolved is based on the Nyquist limit of the coarsest grid size (twice the coarsest grid size). For more details of how the grid sizes were defined, see [5,46]. From Table 1 it is apparent that the precursor neutral ABL has a much uniform distribution of grids compared to the wind turbine (WT) domain. This is primarily because of the fact that the WT domain grids were build on top of the ABL domain, with grid refinements around the turbine rotors (∼30 gridpoints per actuator line blade) for capturing the wake turbulence accurately [30,34,46,53].
The number of snapshots obtained from the simulations was 3285, which were spaced 1 / 5 T e apart ( T e = 15 π d / U is the flow-through time). Since, the domain/layout is symmetric about y = 2.5 π d , we created 2 × 3285 = 6570 snapshots by reflecting and shifting of the snapshot data about x z plane at y = 2.5 π d (similar to the shifting method by Verhulst et al. [15]).
In the subsequent section we discuss the mathematical details of the 3D POD and the Fourier-POD methodology that we use in our analysis in the manuscript.

3. Analysis Methods—Proper Orthogonal Decomposition

3.1. 3D POD—Method of Snapshots

The POD analysis was carried out using the method of snapshots [20] developed in the spectral element code Nek5000. The 3D velocity vector field was represented as
u ( x , t ) u i ( x , y , z , t ) i = 1 , , 3 . Here, u i ( x , y , z , t ) Ω ( R 3 , [ 0 , ) L 2 ( R 3 ) ) , R 3 is the 3D real space, L 2 ( R 3 ) is the space of square-integral functions in the 3D real space, for which the L 2 , or energy norm, can be defined. The velocity field can be decomposed into a set of orthonormal basis functions φ V Ω ( R 3 L 2 ( R 3 ) ) ,
u ( x , t ) = j = 0 a j ( t ) φ j ( x )
where the turbulent velocity fluctuation field u ( x , t ) = u ( x , t ) u ( x , t ) T , and u ( x , t ) T is the time average of the velocity field, ( φ i , φ j ) = δ i j i , j . The POD problem can be cast as a constrained variational problem (See [54] for details), with the maximization of the objective function J ( φ ) = | ( u , φ ) | 2 T Λ ( | φ | | 2 1 ) , T is a temporal averaging procedure. A necessary condition of the extrema dictates that the functional derivative vanish for all variations φ + ε ψ V , ε R , i.e., d d ε J ( φ + ε ψ ) | ε = 0 = 0 . The method of snapshots is an approximation to the solution of d d ε J ( φ + ε ψ ) | ε = 0 = 0 [55] using temporal correlation instead of a spatial correlation. Mathematically, the POD method of snapshots [20] of the velocity field dataset arises when solving for the projection of the dataset P r : V V r of fixed rank r, minimizing the error j = 0 N t 1 | | u j P r u j | | 2 in the least-squares sense with the constraint | | φ | | = 1 ( | | . | | is the norm corresponding to the inner product ( , ) V ). The temporal snapshots of the velocity field u ( x , t j ) j = 1 , , N t have been written as u j in the error expression for brevity. The projection P r can be written as
P r u m = j = 0 r 1 ( φ j , u m ) φ j = j = 0 r 1 a j ( t m ) φ j ( x ) , r N t
The correlation matrix in indicial notation can be obtained from the inner product of the snapshots and is given as
C m n = 1 N t ( u ( x , t m ) , ( u ( x , t n ) )
This method ensures that the eigenvalue problem arising is independent of the size of V which is equal to Ω ( R 3 k ) (k: number of coordinates in u ( x , t ) at discrete grid points). In the eigenvalue problem in Equation (4) below, Λ is the eigenvalue corresponding to the turbulent kinetic energy and v is the eigenvector.
[ C ] v = Λ v
The POD eigenmode can be constructed from the eigenvalues and eigenvectors as
φ k ( x ) = j = 0 N t 1 b k ( t j ) u ( x , t j )
for some coefficients b k . Using Equation (2) for u ( x , t j ) , Equation (5) can be expanded as
φ k ( x ) = j = 0 N t 1 b k ( t j ) l = 0 N t 1 a l ( t j ) φ l ( x ) = j = 0 N t 1 l = 0 N t 1 b k ( t j ) a l ( t j ) φ l ( x )
Since, ( φ k , φ l ) = δ k l , it is straightforward to see from Equation (6) that b k ( t j ) a l ( t j ) = δ k l / N t j . Mathematical details analysing the relation of b k , a k can be found in [15]. It is important to note, that Parseval’s identity can be applied in POD (orthonormal basis functions) which from the inner product (taken in spatial domain, defined in V) gives rise to | | u ( x , t ) | | 2 = j = 0 N t 1 a j ( t ) 2 , and hence a j ( t ) a k ( t ) T = λ j δ j k j = 0 , , N t 1 . Thus, since b k a l = δ k l / N t , the coefficient b k can be defined as b k = a k λ k N t . Additionally, the eigenvector v k = a k λ k N t is consistent with the orthonormality of φ .

3.2. Fourier-POD Methodology

For the Fourier-POD methods, analogous to the projections methods of 3D POD, we can write the projection P f , r as
P f , r u m = j = 0 r 1 ( φ ^ j , u ^ m ) φ ^ j e i k y y d y = j = 0 r 1 a ^ j ( k y , t m ) φ ^ j ( x , z , k y ) e i k y y d y , r N t
In a similar spirit, the correlation matrix can be written as
C ^ m n = 1 N t ( u ^ ( x , k y , z , t m ) , ( u ^ ( x , k y , z , t n ) )
where u ^ is the Fourier transform in the lateral/spanwise y direction of the velocity fluctuation vector u ( x , t m ) .
u ^ ( x , k y , z , t m ) = 1 2 π u ( x , y , z , t m ) e i k y y d y
Since the snapshots in FPOD methods are complex valued rather than being real-valued as in the 3D POD case, the modes are expected to be complex in nature as well. Note, however that the correlation coefficient (3D POD as well as 2D Fourier-POD) are based on the inner products of snapshots. If χ is a matrix containing columns of snapshot χ i = [ χ 1 , χ 2 , χ 3 , , χ n ] , then the correlation matrix can be written as χ χ T while for complex snapshots (e.g., 2D FPOD), the inner product can be written as χ χ H , where [ ] T and [ ] H represent transpose and Hermitian (complex conjugate transpose) respectively. Subsequently, it is apparent that while the eigenvectors and hence the modes can be complex for FPOD, the eigenvalues (or the diagonal eigenvalue matrix) are given by d i a g ( λ ) = Σ Σ H (since svd can be complex for real systems ), where Σ is the matrix containing singular values at diagonal entries from the SVD of the snapshot matrix χ . Consequently, the eigenvalues of 3D POD as well as complex 2D Fourier-POD are always real-valued and represent kinetic energy content the mode. The FPOD analysis has been carried out in an open-source python code MODRED [56] written as a high-level class interface using spectral methods.

4. Results

4.1. 3D POD

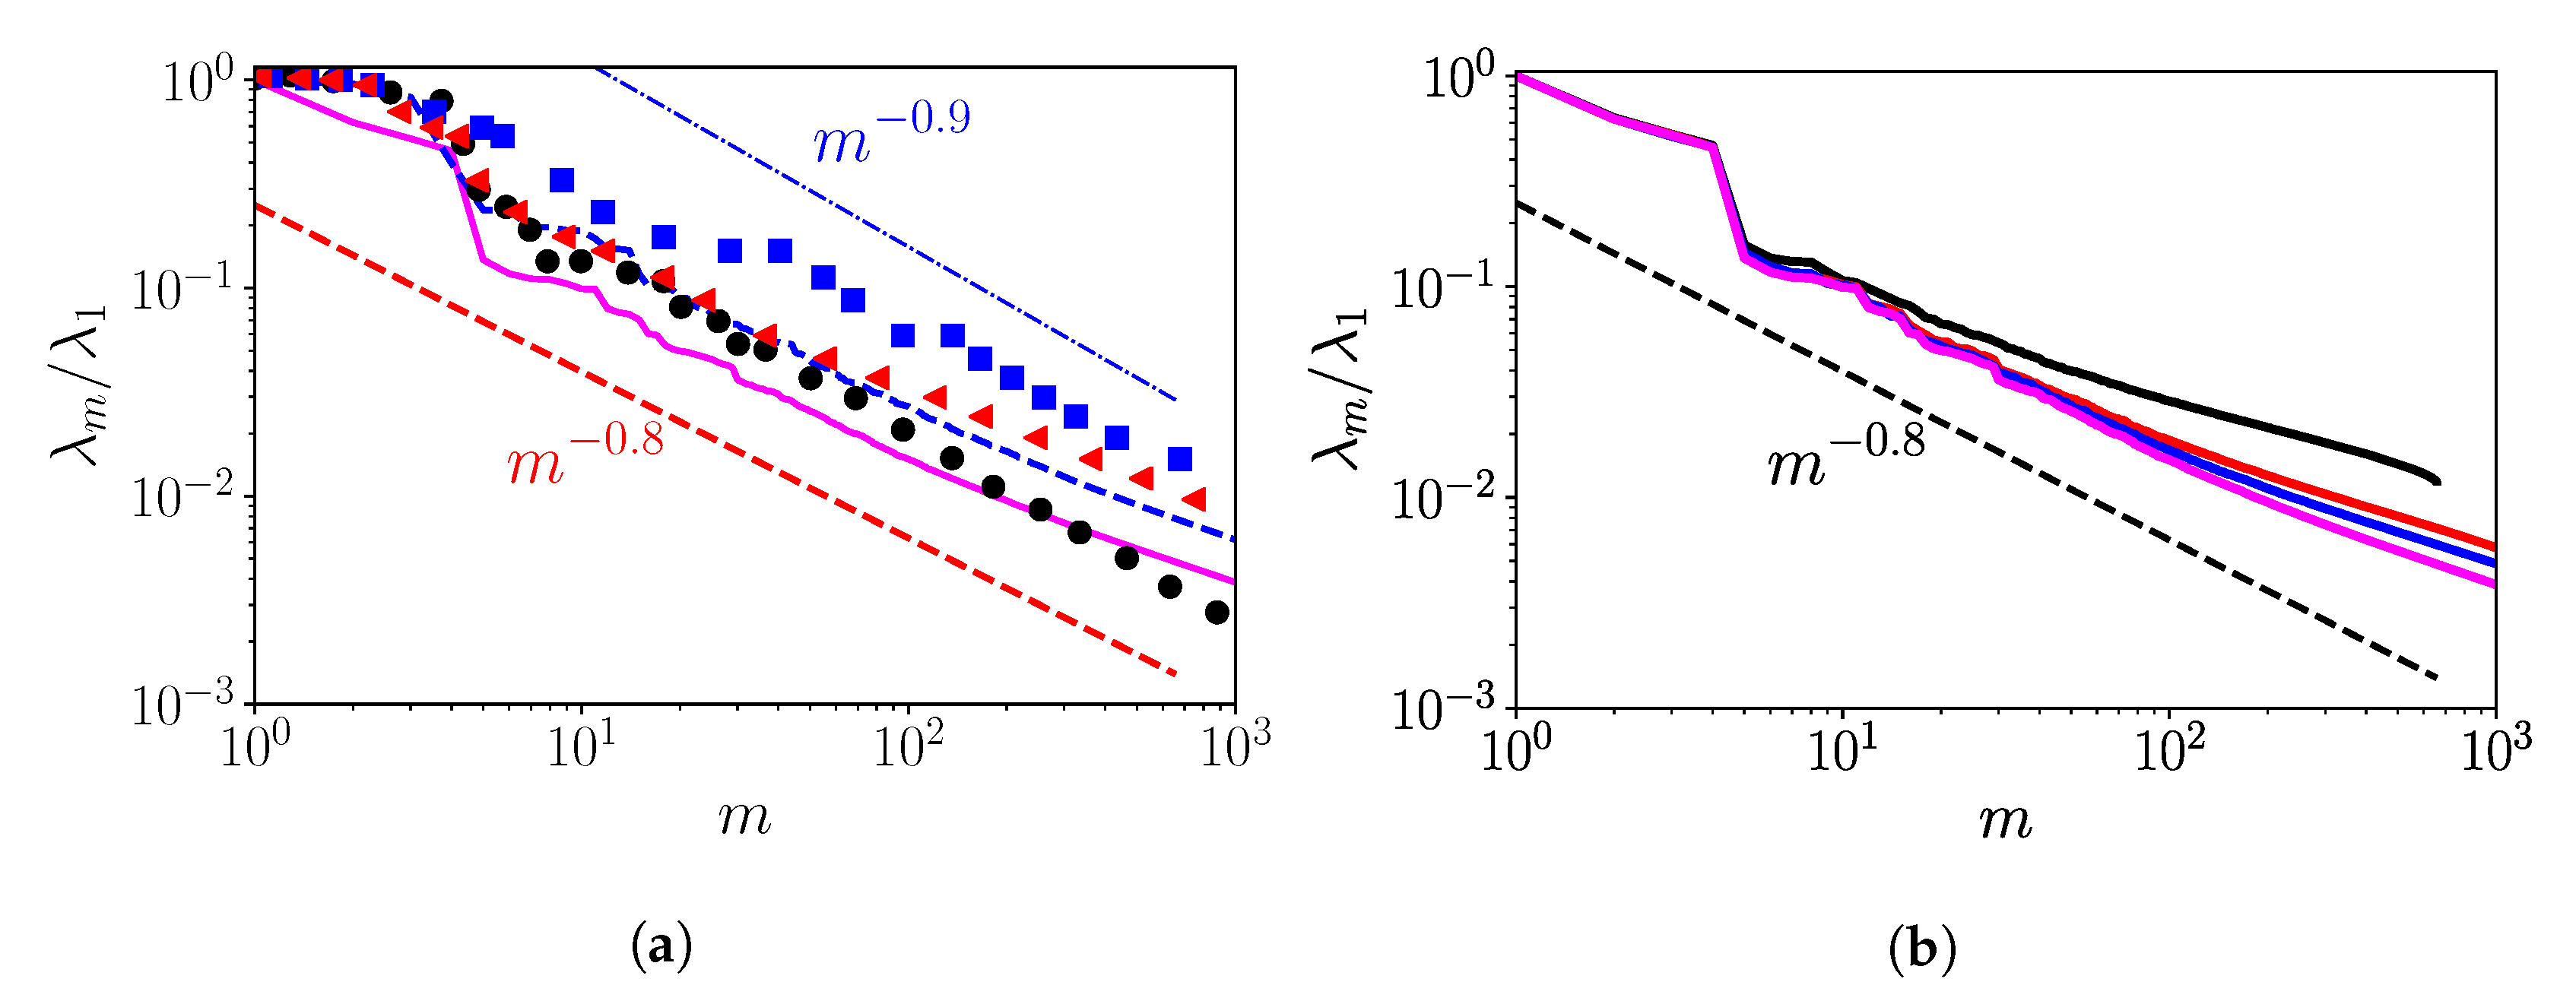
In this section we present the results obtained from the POD analysis of a finite-sized wind turbine array. Unless otherwise mentioned, the results (also shown in the plot labels) were normalized with the free-stream velocity scale, U and rotor diameter d as deemed necessary. The snapshots for the layout were each T e / 5 ( T e is the flow through time) snapshots apart, which were much frequent than the snapshots “ 3 T e apart” as reported in Ref. [15]. This essentially means that the current POD analysis were carried out in the framework of “smaller time scales”. The snapshots 3 T e apart in the previous literature [15] in the context of asymptotic wind farms ensure that the temporal autocorrelation of the velocities completely decay to zero. In the current manuscript we resorted to snapshots separated by time T e / 5 , when the velocity correlations were roughly ∼0.2. However, we also used snapshots which were 2 T e / 5 , 3 T e / 5 and 4 T e / 5 times apart to test the convergence of the eigenspectra. The time extent of 600 T e was used for the analysis of the LES database. Note, that during convergence study, we chose to keep the time extent of the database for POD analysis fixed and only varied the time spacing between the two snapshots. Ref. [15] performed POD analysis on periodic wind farm layout, and hence after generating a set of snapshots, 3 T e apart, artificially increased the number of snapshots by an order of magnitude by exploiting the stationarity of the flow and the large scale statistical symmetry of the flow around every turbines in the streamwise and spanwise direction (method of “shifting”). Figure 3 shows the normalized eigenspectra of the finite-sized farm layout compared with the spectra of a periodic 8 × 6 array with domain size 20 π d × 10 π d × 10 d ( 2 π H × π H × H ) [5], 3D POD modes were calculated using one shifting due to a spanwise symmetry to increase the number of snapshots.
The eigenspectra of the 3D POD modes was validated for the periodic and developing wind farm simulations with the results from the previous literature in Figure 3a. In particular, we considered the periodic wind farm layout from Verhulst et al. [15], and periodic as well as developing large wind farms from Zhang et al. [17]. The geometry for all three reference simulations is summarized in Table 3. The developing wind farm geometry of Zhang et al. [17] was the same as the geometry of their periodic wind farm simulations cited in Table 3, albeit with a lesser number of turbines (12 versus 16) in a streamwise direction. Note that the inter-turbine distance was the same for all three references [5,15,17] but different from the current finite-sized wind farm study. Additionally, the turbine diameter d was set as d = 0.1 H , and the hub-height z h u b = d = 0.1 H , for all the three studies [5,15,17].
We note that our periodic wind farm case matches better with the periodic case of Zhang et al. [17], underscoring the fact that both these studies performed the POD eigendecomposition with similar number of snapshots. We also illustrate the convergence behaviour of the eigenspectra for the finite sized farm in Figure 3b. Note, instead of comparing the eigenvalues for different POD problems λ m , we compared the normalized eigenvalues λ m / λ 1 (m is the number of mode), which ensured better convergence of the scaling trends.The current convergence plots were shown for a POD computed for a same time extent of 600 T e , but the snapshots were spaced for different fractions of flow-through times apart. However, similar trends in convergence could be observed when performed with the POD for fixed spacing of the snapshots ( T e / 5 ) and progressively adding more snapshots with each case (results not added for brevity). The eigenspectra and their convergence trends clearly indicated the following features, (i) convergence is observed by increasing N t , the number of snapshots, (ii) with increasing number of snapshots, the scaling law of the modes for m > 10 , clearly changed from m 0.5 [16] to m 0.8 which is extremely close to m 0.9 as observed by the periodic wind farms in [15]. For the same number of snapshots, Zhang et al. [17] also illustrated the m 0.8 scaling for the m 10 1 10 2 for periodic farms and m > 10 for developing farms. Additionally we can also comment that obtaining the convergence of m 0.9 scaling law iwas primarily dependent on the number of snapshots rather than the spacing of the snapshots. Incidentally, a similar scaling law m 1.2 was also observed in experimental studies, particularly for 2D POD eigenspectra performed at different streamwise locations of wind turbine array by Hamilton and coworkers [26]. We hypothesize that with increasingly more number of snapshots, the scaling law for modes m > 10 , should approach m 0.9 . However, restrained by the bottleneck of the computational expense we cannot add further snapshots from simulation or take advantage of the symmetric shifting to generate more “artificial” snapshots. Consequently, in order to gain more insights on the scaling law of the eigenspectra and their convergence, we propose a different methodology based on Fourier-POD analysis, which essentially deals with the POD of the snapshots of the lateral/spanwise Fourier transformed velocities for different wavenumbers instead of the 3D snapshots themselves. We provide a dedicated section (Section 3.2) for introducing the mathematical formulation and the results and insights of the FPOD analysis, but for now we continue our discussion related to the results of the 3D POD analysis.
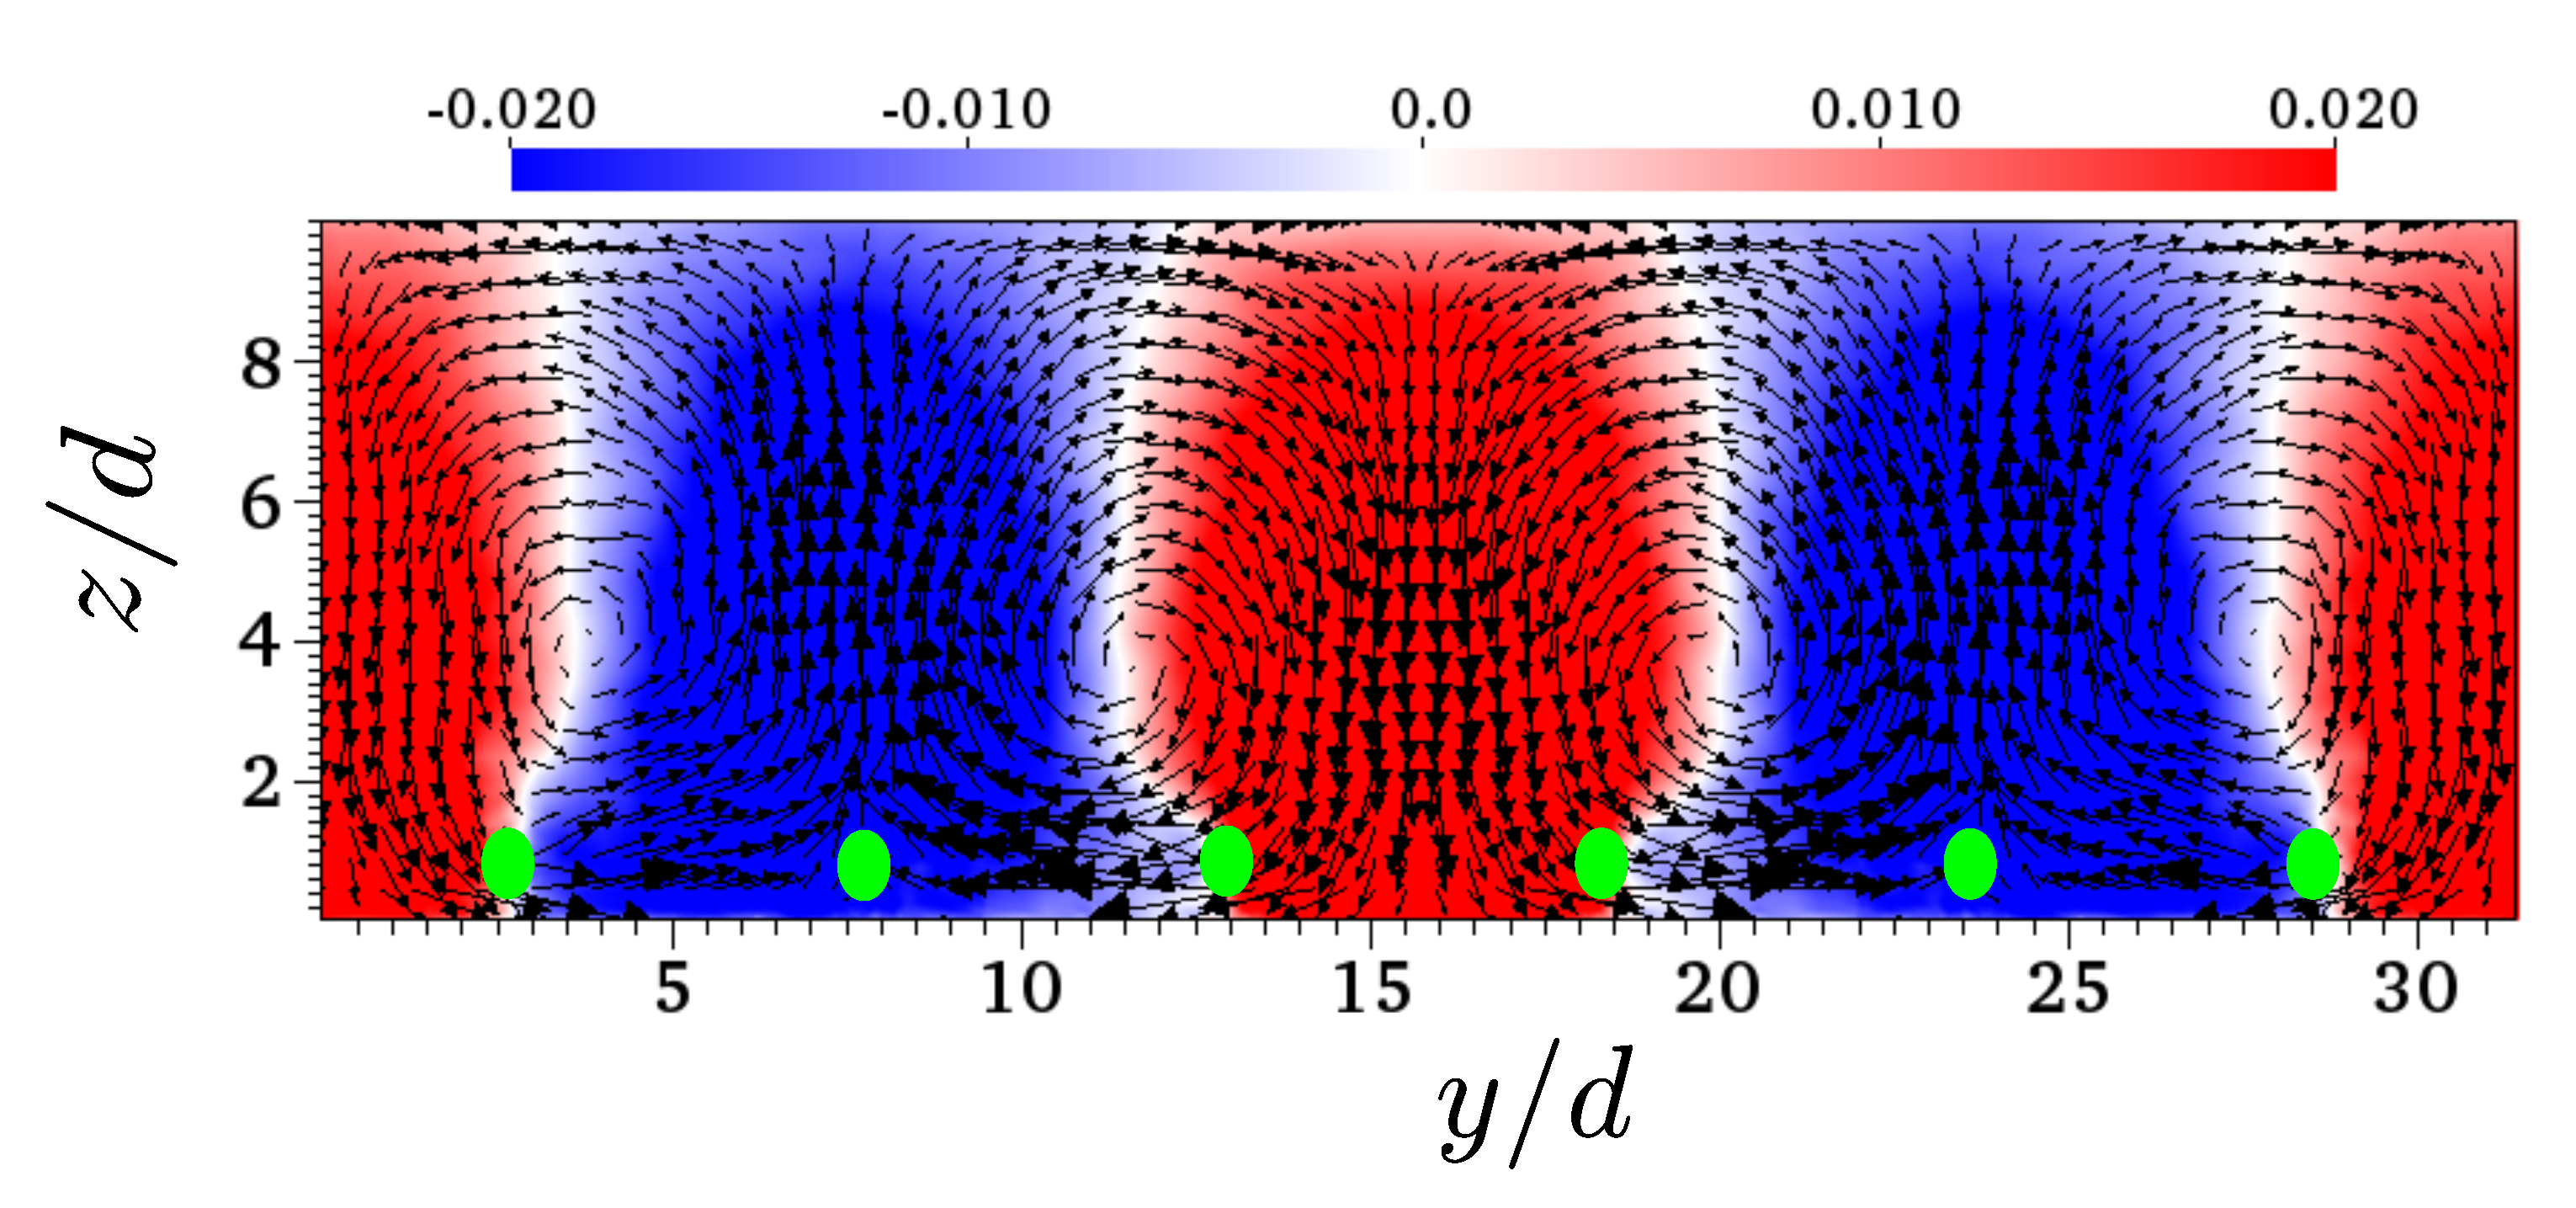
The first 3D-POD mode of the periodic wind farm case ( 8 × 6 array [5]) is shown in Figure 4 for validation purposes. The mode illustrates 2 pairs of counter-rotating roll-cells (global sweeps and ejections) as the most energetic features in the periodic farm. Similar roll-cell features were also observed in the periodic farm POD computations in [15,17]. Verhulst et al. [15] noticed that the gap between the roll-cells depends on the global dynamics of wall-bounded turbulence and is independent of the domain size. We observe the most energetic mode in [15] had 1 pair of counter-rotating rolls for a domain size of 10 π d × 10 π d × 10 d , and 3 pair of rolls (or features reminiscent of rolls) in [17] for a domain size of 40 π d × 20 π d × 10 d . Note, the differences in the energy contribution of the modes having 1 and 2 pairs of roll-cells were 1 % , as reported by [15]. Table 3 describes the roll shape and the features observed in the POD computation of the periodic wind farms in the literature as well as the current authors [5], manifesting good similarity in their topology. Additionally, we also observed that the roll cells approximately covered around two turbine columns similar to the observation by [17], and the value of the streamwise modal velocity was on par with [15].
Analyzing the number of roll cells per domain width and their size obtained for different simulations [5,15,17], we can conclude it was unlikely that the domain width played a role in determination of these quantities, similar to the conclusion of [15]. Again, our simulations [5] were closer to that of [17] rather than that of [15], due to a closer similarity in the number of snapshots used in both [5] and [17] studies. The fact that the energy difference between the mode-1 and mode-2 (in terms of the number of counter-rotating vortex pairs) was less than 1 % further testifies to a relatively equal importance of these two most dominant modes in the wind farm energetics.
Here we discuss the results of the finite-sized wind array. Figure 5 shows the frontal ( y z plane) picture of the POD modes for the first eight eigenvalues. In particular, the figures illustrate the colour contours of the streamwise modes overlayed on the top of in-plane (vertical, spanwise) modes represented as vectors. The modes clearly manifested circulatory features, reminiscent of the counter-rotating roll-cell structures and the downdrafts and updrafts of these circulations coincide with the positive (higher energy) and negative (lower energy) streamwise modal structures. Interestingly, the finite-sized layout also showed the most energetic mode containing two pairs of roll-cells similar to the periodic computations by the authors [5]. Additionally, the roll-cells in the finite-sized turbine array also manifested the “mode-pairing” feature [15] where two modes with the same number of roll-cell paired with similar energy content can be observed. The number of roll-cells observed in the layout was related to the modes and hence the eigenvalues/kinetic energy of the flow domain. The height of the roll cells for m = 0 , 1 mode was 2.5 d = 0.5 H , which was similar to 4 d = 0.4 H observed in periodic wind farms. Additionally, we note that the height of the roll-cells was not constant and varied with the mode rank and the number of roll-cells in the layout. Figure 6 gives a 3D perspective to the circulatory roll-cell features we discussed above, in particular, mode m = 0 . The isosurface of the streamwise velocity modes indeed showed the long counter rotating roll-cell feature spanning the whole domain. This is corroborative of the fact that these roll-cell features are a phenomenology of the atmospheric boundary layer turbulence [11,15]. The streamtube picture depicted in Figure 6b further illustrates the three-dimensional nature of the large-scale structure manifested by the most dominant POD mode. The three sets of the circulatory features depicted by the streamtubes are formed in and around the 3 columns of the turbines.
In order to get a better understanding of how the wind farm modulates these large scale structures we took a closer look at the streamwise variation of the modes in Figure 7 illustrated as the contour plots of the POD mode velocity magnitude. As we will see later that the streamwise plots also assisted us to make a one-to-one comparison with the Fourier-POD modes discussed in the subsequent sections. We observed the streamwise (almost) homogeneous streaks which were essentially footprints of the roll-structures for lower modes. Interestingly, in those footprints we could observe “wake like features” which were clearly manifestation from the wind turbine array. For modes m < 3 , we observed that the wake like features (velocity-deficits) extended for scales 7 d (inter-turbine distances) embedded in the roll-cell footprints. Particularly, for mode m = 3 , the “wake” footprints could be conspicuously observed with high-velocity regions near the turbine wake rotors and is a clear manifestation of the modulation of the flow structure modes by wake-turbulence. This is reminiscent of the generation of turbulent kinetic energy at the wakes due to vertical entrainment at the inner layer. The mode m = 3 was a clear example of the mode that was entirely due to wind-farm-ABL interactions and would not form in a pure ABL case. Apart from the rolls, at higher modes ( m 7 ), we also observed large structures starting from the wall and inclined at an angle of 15–20 degrees [57,58]. We believe that these inclined structures were footprints of clusters of hairpin vortices which together formed the framework of “attached eddies” [59,60].
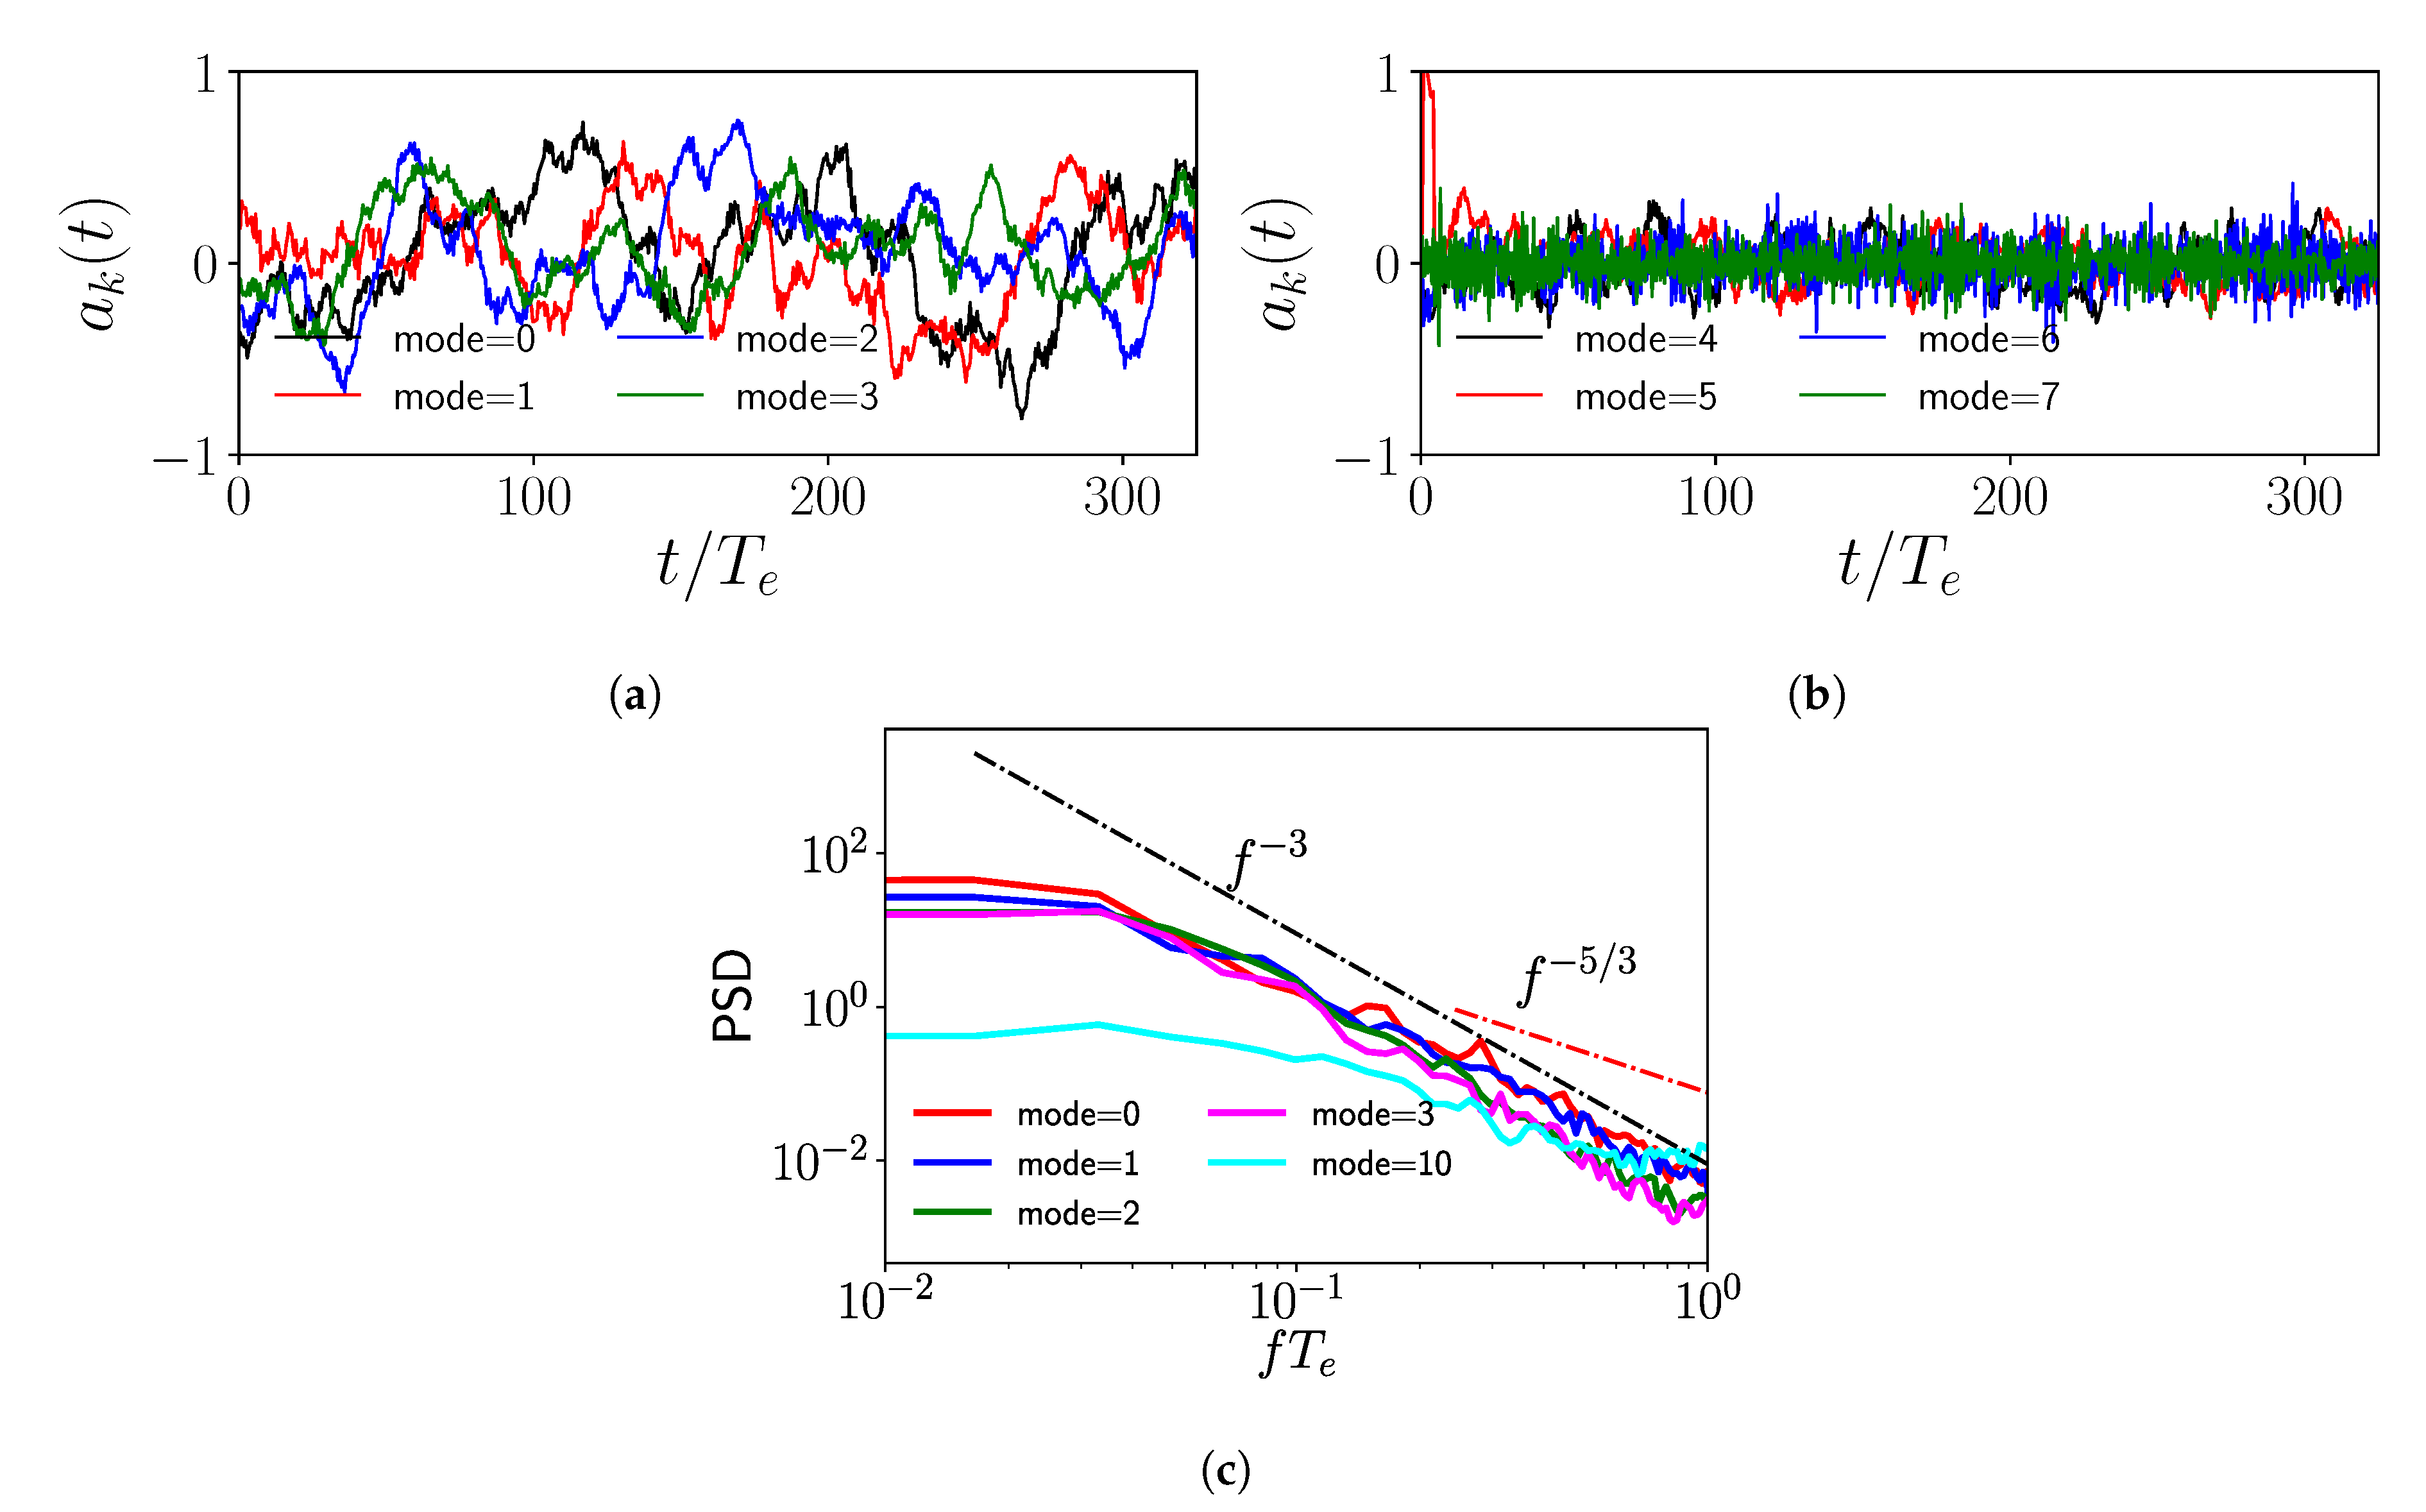
The dynamics or the temporal variation of the modes are imprinted in the projection coefficients illustrated in Figure 8. Since, | | u ( x , t ) | | 2 = j = 0 N t 1 a j ( t ) 2 , as explained in the mathematical formulation owing to Parseval’s theorem, the coefficients a k ( t ) bore the temporal/dynamical footprints of the kinetic energy contained in the velocity fluctuations. Expectedly, the projection coefficients corresponding to the lower order modes (0–3) showed low frequency fluctuations compared to the projection coefficients corresponding to modes 4 or more, indicating the fact that larger scales of motion are supposedly made by eddies of larger time scales. Additionally, the power spectral density of the projection coefficients (in frequency space) of the large scale modes ( m < 5 ) manifested a f 3 scaling law (f is the frequency) which was attributed to the phenomenon of “merging of eddies” by previous literature [61,62] (Figure 8c). Note, we started observing the f 5 / 3 law for modes m = 9 (and higher) manifesting energy cascade. Consequently, it can be argued that the low-time scale dynamics of the structures comprising of the lower 3D POD modes are predominantly governed by merging of eddies.
In the next section, we discuss the results from the Fourier-POD methodology for complex Fourier-transformed velocity snapshots.

4.2. Fourier-POD

Before moving into the results related to Fourier-POD analysis, we present the spanwise Fourier energy spectra of the velocity snapshots (Figure 9).
The spanwise spectra (averaged in the streamwise, vertical direction as well as time) can be given as
E ˜ u i x , z , T a v g = 1 T a v g 0 T a v g 1 L x L z x m i n x m a x z m i n z m a x u i ( x , λ y , z , t ) * u i ( χ , λ y , z , t ) d y d z dt ,
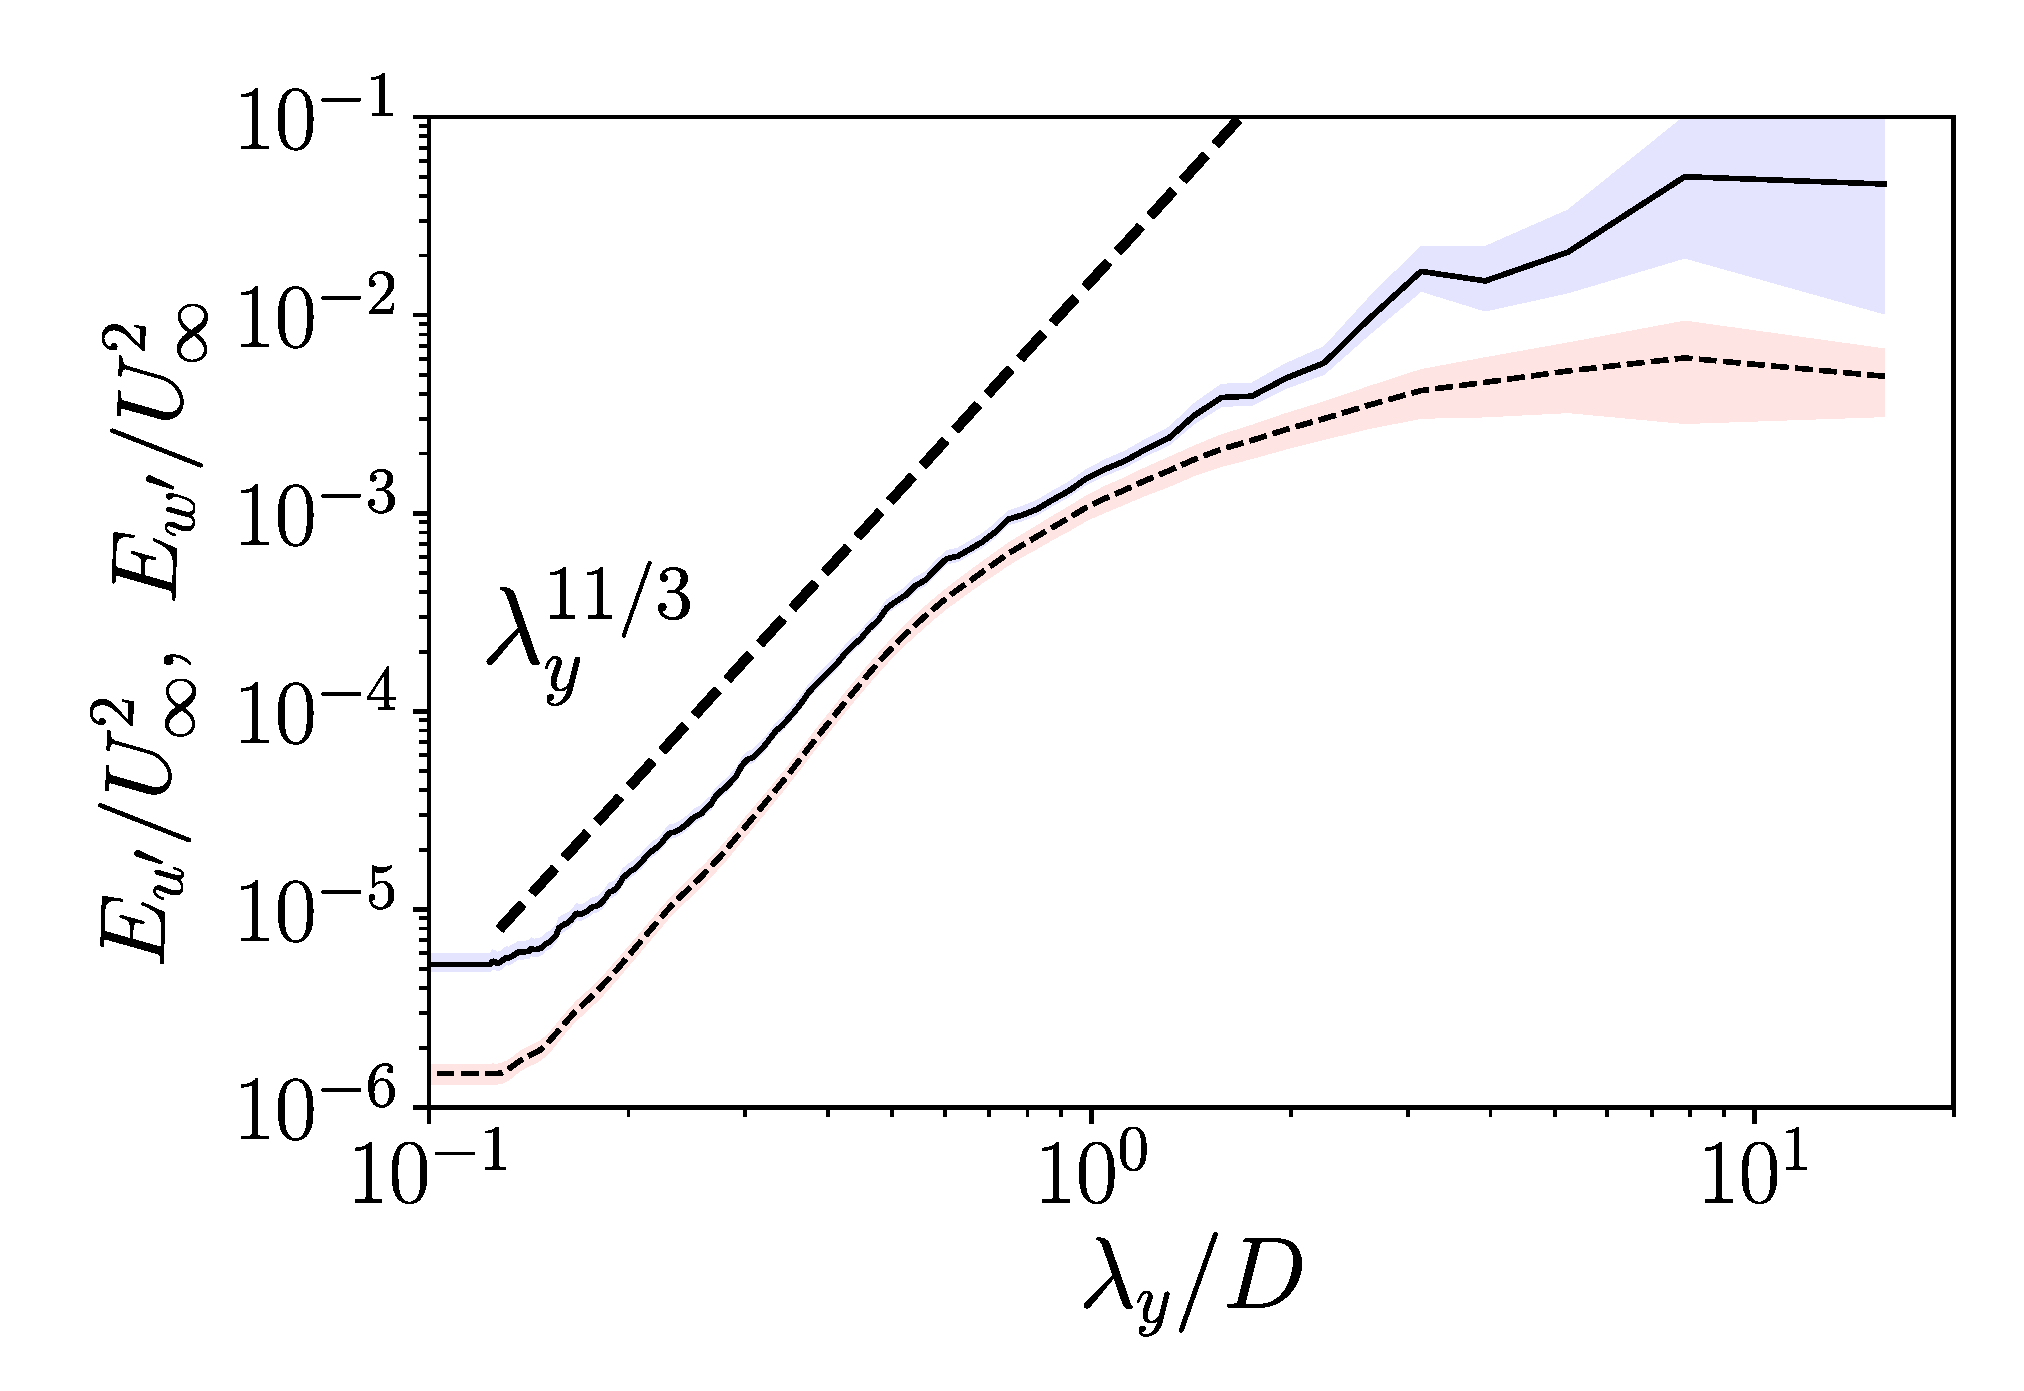
where x , y are the streamwise and spanwise direction respectively. Note the presence of the λ y 11 / 3 or k y 11 / 3 law near the tail of the spectrum. This appears to be a filtering of the k y 5 / 3 spectrum, as G ( k y ) k y 5 / 3 , with G ( k y ) = k y 2 spectrum. Such filtering is possibly an outcome of vertical averaging of the spectra, streamwise averaging of the heterogeneity owing to wind turbine array and is mainly an observational documentation. Note for performing the Fourier transform a total of 512 uniform grid points are chosen in the spanwise/lateral direction which ensures a total of lateral resolved length scale (Nyquist limit) of 5 π d / 256 = 0.06 d , which is lower than what the LES simulation with Navier-Stokes solver could resolve (1). Such a high number of grid points for the FFT ensures that the aliasing error could be avoided during the reconstruction of the 3D POD mode from the 2D complex Fourier-POD modes. Figure 9 not only indicates energy cascade from the larger to the smaller length scales in the spanwise spectra, but also illustrates that the larger length scales were associated with higher degrees of uncertainties (larger decorrelation time scales) than their smaller scale counterpart.
Figure 10 manifesting the Fourier-transformed velocity magnitude serves as a sanity test of the Fourier-transform itself, with the snapshot at k y d = 0 representing the temporal snapshot of spanwise averaged velocity magnitude, while the same for k y d = 2 , manifests wake-imprints from finer scale fluctuations.
From Equations (2) and (7), we can define the complex velocity magnitude mode from the POD analysis as | | u | | = | u ^ | 2 + | v ^ | 2 + | w ^ | 2 and | u ^ i | = [ R ( u ^ i ) 2 + I ( u ^ i ) 2 ] 1 / 2 , i = 1 , 2 , 3 . .. Additionally, the phase of the complex POD mode can also be defined as ψ u i = arctan ( I ( u ^ i ) / R ( u ^ i ) ) .
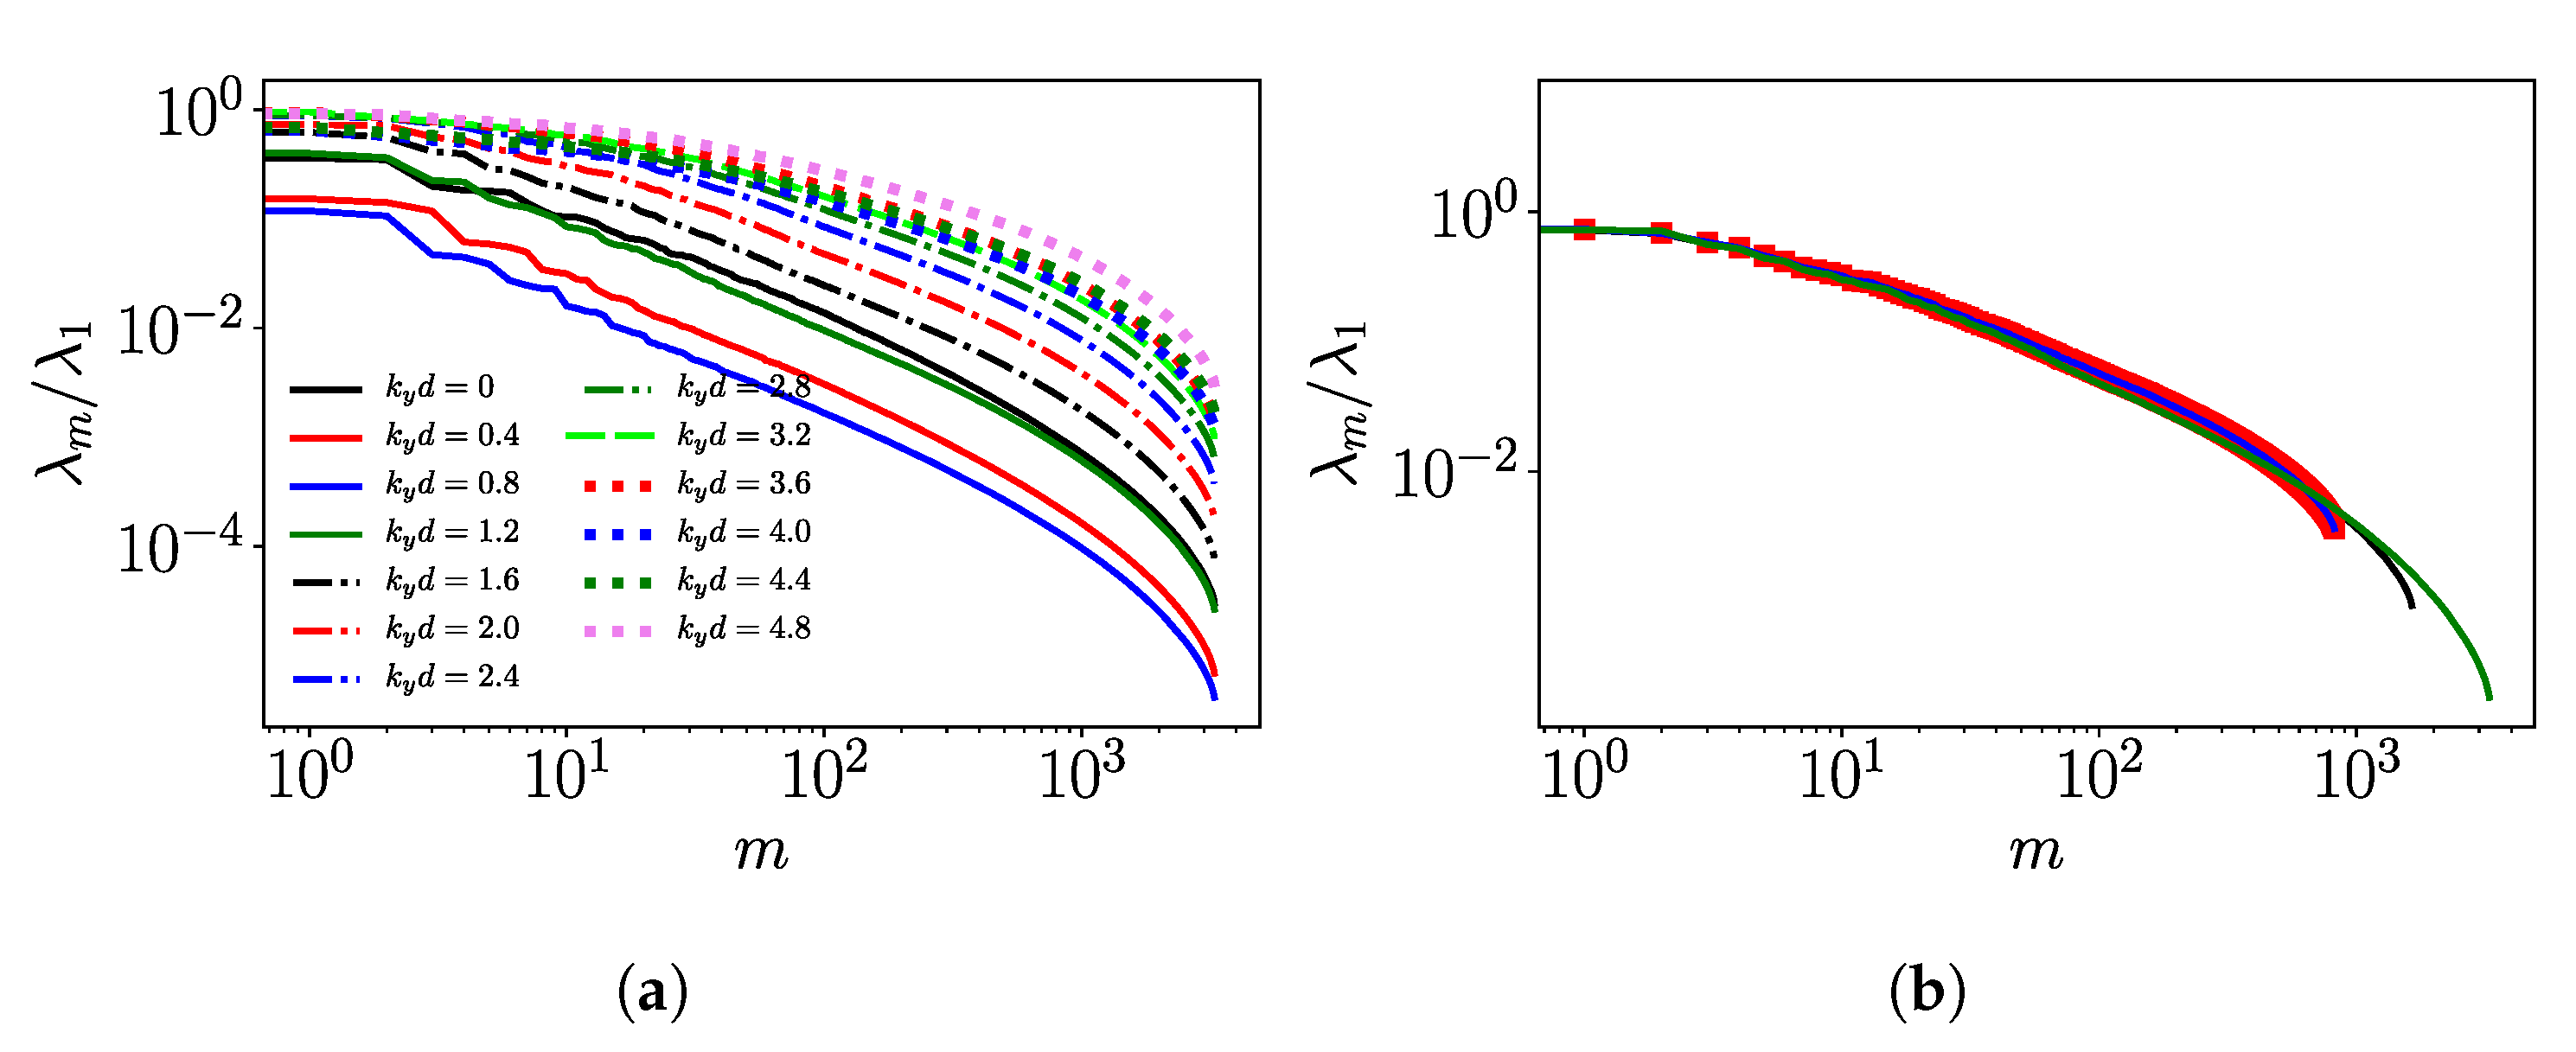
Figure 11a illustrates the eigenspectra of the 2D complex field snapshots (spanwise Fourier transformed velocity) documented at different wave numbers. Expectedly, we observed that the eigenspectra had a slower decay with modes as we moved to higher wavenumbers or smaller spanwise length scales (laterally thin structures). This manifested by the spectra getting flatter for higher wavenumbers. This indicated that for turbulent structures which were laterally thin (higher k y ), the energy content did not vary significantly based on the POD ranks and approached towards a uniform distribution of eigenspectra at k y (isotropization of small scales). Figure 11b shows the convergence of the Fourier-POD modes for a representative wavenumber of k y d = 2 . While similar results can be obtained for other wavenumbers, it is striking to note that the FPOD eigenspectra converged much better than the 3D POD eigenspectra at all modes. Since the number of snapshots and the spacing between the snapshots are the same for the 3D POD and 2D Fourier-POD analysis, the only way this was possible was when most of the uncertainty manifested at the larger length scales are contained in the Fourier energy spectra as is evident in Figure 9. It is worth noting that the Fourier-modes are analytical descriptors of the POD modes with periodic boundary conditions [55]. Consequently, a FPOD type of decomposition for a wind farm with spanwise periodic boundary conditions, by construction, picked up the correct spanwise modes without running into convergence issues. The 3D POD modes were supposed to converge to the FPOD modes asymptotically with the increase in the number of snapshots.
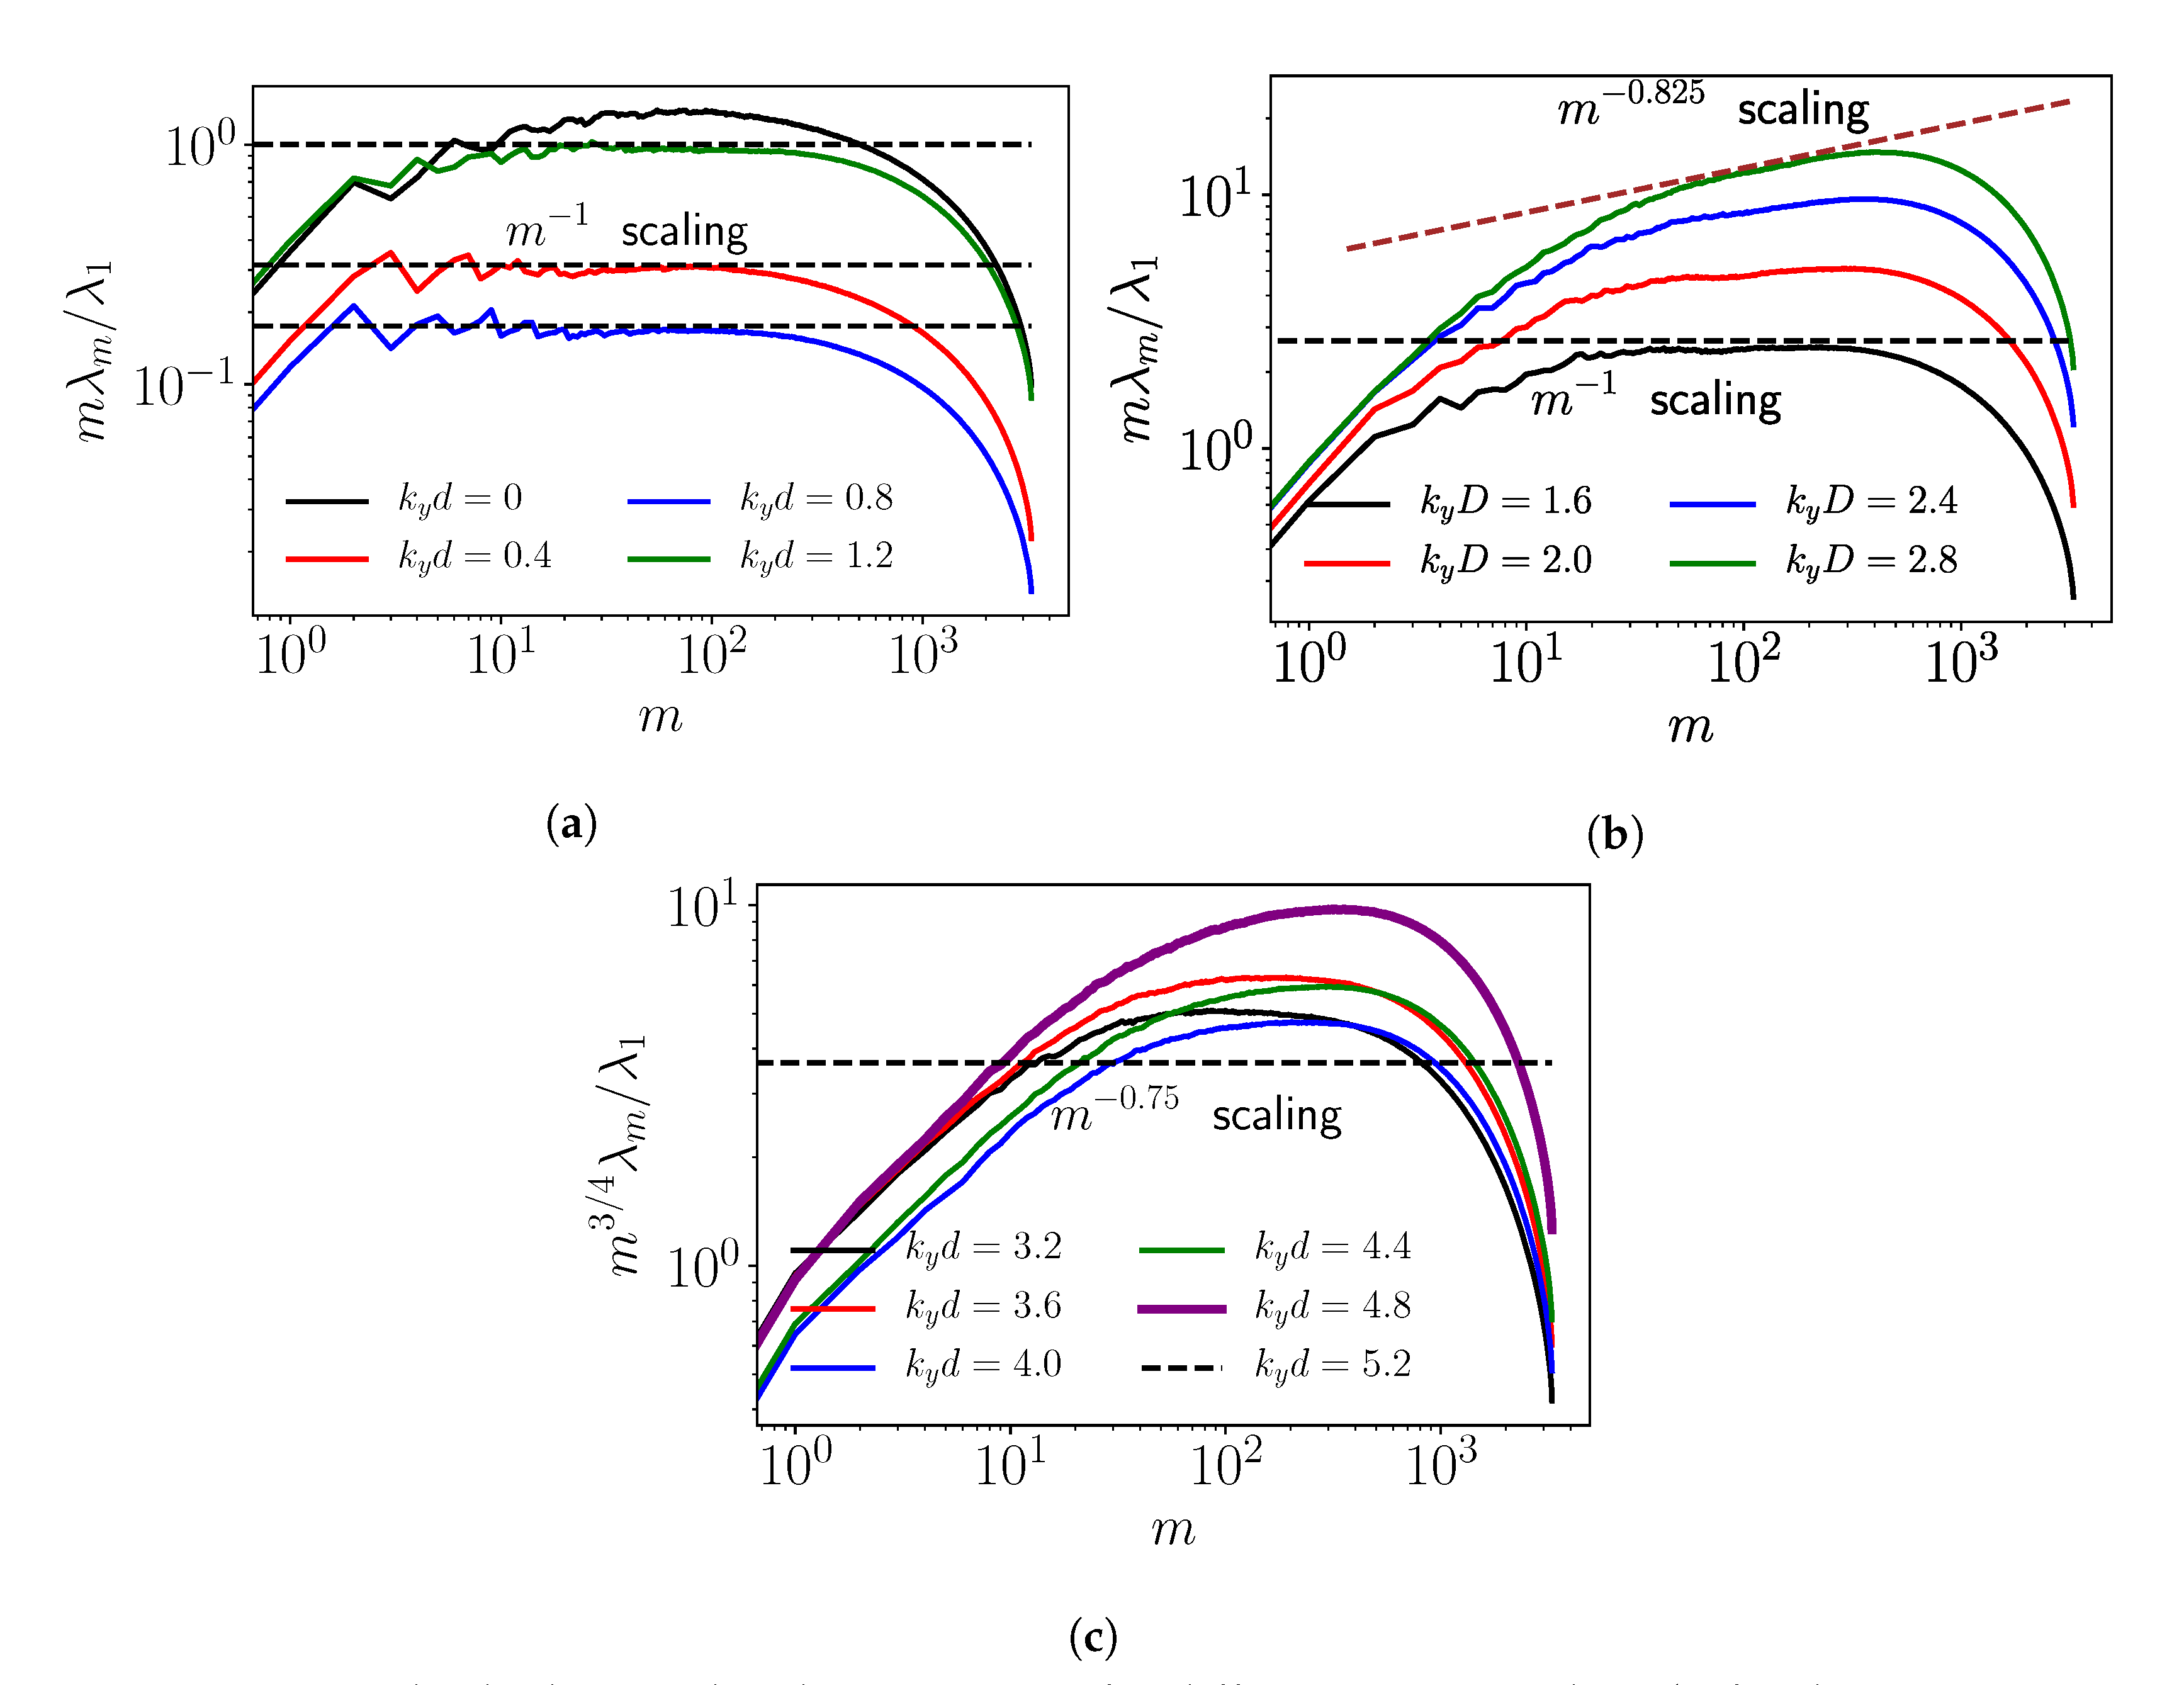
In Figure 12a–c, we illustrate the behaviour of the FPOD eigenspectra for lower and higher wavenumbers. What is striking, is that we could capture a m 1 scaling law for modes spanning a decade from m = 10–100 for wavenumbers k y d < 2.0 . For the number of snapshots considered, we observed a scaling law of m 0.8 in the 3D POD eigenspectra. Interestingly, we also observed this scaling of FPOD eigenspectra at 25 % of the total number of snapshots (∼ 1600 snapshots) used in eigen-decomposition, where we were only able to capture m 0.5 scaling for the 3D POD eigenspectra [16]. This was one of our most crucial observations in the whole analysis. We observed that the scaling exponent gradually decayed as we consider the eigenspectra at higher wavenumbers indicating a flatter spectral tail as was discussed above (more isotropization of structures). The results have two implications; (i) The m 1 ( m 0.9 [15].) scaling is not an “artifact of the lack of convergence” and is observed in laterally wide turbulent structures for FPOD modes m > 10 . Interestingly, similar scaling laws ( m 1.2 ) were also noted by Hamilton and coworkers [26] for 2D POD of wind turbine arrays at different streamwise locations. (ii) For FPOD eigenspectra, as the turbulent eddies become thinner, the scaling exponents become larger and tend closer to zero (for higher wavenumbers). Note, in 3D POD we were not able to capture scaling laws of m 1 or m 0.9 , owing to the lack of enough number of snapshots to cover several decorrelation times of the larger scales of interest (higher uncertainties in the larger coherent scales). In the FPOD analysis, we were not only able to decouple the length scales in the spanwise (Fourier) and streamwise(POD) direction, but were also able to decouple the uncertainties—with the Fourier energy spectra carrying most of the uncertainty. Consequently we were able to capture the scaling laws of the FPOD modes (less uncertainty due to better convergence) accurately. This analysis shows that while FPOD expectedly cannot essentially improve the POD results, they have the potential to provide crucial insights to the lack of convergence in the 3D POD eigenspectra and hence their scaling laws.
In Figure 13, Figure 14, Figure 15 and Figure 16, we illustrate the Fourier-POD eigenmodes for wavenumbers k y d = 0 , 0.4 , 0.8 , 1.2 . Interestingly, for all modes m = 0 , k y , we saw homogeneous/quasi-homogeneous streaks in the streamwise direction which were evidently the footprints of the “roll-cells” modulated by wake turbulence. Apart from the “roll cells”, modes m > 0 , k y 0.8 also displayed large scale inclined structures ( k y d = 0.8 , m = 2–5, k y = 1.2 , m = 2–5) which are essentially manifestations of “attached eddies” [6,59]. The FPOD’s manifest that the attached eddies form at some threshold spanwise wavenumbers which could not be identified in 3D POD modes. These structures also display similarity to the modes computed from the 3D POD eigen decomposition. Additional to the “roll-cells” and “attached eddy” foot-prints, we observe another type of mode, which are reminiscent of wave like features ( k y d = 0.4 , m 4 , k y d = 0.8–1.2, m = 6 ). The feature is most conspicuous for k y = 0.4 , m = 4 . Such modes might be manifestation of wave modulation of large turbulent structures at the particular wavenumber k y = 4 , but further studies are needed to speculate the hypothesis. Interestingly, we also observe that as k y d increases (laterally thin structures) the streamwise size of the inclined structures/attached eddies remain approximately the same for a fixed mode number and the streamwise length scale progressively decreases with increasing mode size. This manifests disintegration/cascading of larger eddies to their smaller counterpart.
Figure 17 illustrate the phase of the complex streamwise FPOD modes for mode m 4 . The streamwise FPOD modes are dominant compared to their lateral and vertical counterparts. It is interesting to observe that the mode phase ψ changes sign at the edge/boundaries of the large scale eddies and hence is expectedly a great method to visualize the edges of the turbulent structures.

4.3. Reconstruction of 3D Modes from Fourier-POD

In this final section we deal with the reconstruction of the three-dimensional modes obtained by performing inverse Fourier transform of the complex Fourier-POD 2D modes. The three dimensional reconstruction of the modes, φ ˜ j ( x , y , z ) can be obtained as
φ ˜ j ( x , y , z ) = 1 2 π k m a x k m a x φ ^ j ( x , k y , z ) e i k y y d y .
Note mathematically, φ ˜ φ (3D POD) as will be established later from the structure of the correlation matrix.
The correlation matrix for FPOD can be written as
C m n = ( u ( x , k y , z , t m ) , u ( x , k y , z , t n ) ) = Ω u ( x , k y , z , t m ) u * ( x , k y , z , t n ) d V = ( k m a x k m a x u ^ j ( x , k y , z , t m ) e i k y d k , k m a x k m a x u ^ j * ( x , k y , z , t n ) e i k y d k )
Note for the inner-product in the physical space ( Ω ( ) ( ) * d V ), the complex conjugate (denoted by * ) of the real velocity snapshot is the velocity snapshot itself. For brevity of analysis, we use the symbol k instead of k y for spanwise wavenumbers in subsequent derivations.
C m n = ( k m a x k m a x Ω u ^ j ( x , k y , z , t m ) u ^ j * ( x , k y , z , t n ) e i ( k k ) y d k d k d V ) = k m a x k m a x [ Ω u ^ j ( x , k y , z , t m ) u ^ j * ( x , k y , z , t n ) e i ( k k ) y d V ] d k d k
Since Ω d V = 0 L x 0 L y 0 L z d x d y d z and Ω u ^ j * ( x , k , z , t m ) u ^ j ( x , k , z , t n ) d x d y = C ˜ ^ m n ( k , k ) , we have a relation between C m n and C ^ m n as follows.
C m n = 0 L y k m a x k m a x C ˜ ^ m n ( k , k ) e i ( k k ) y d k d k d y
Realizing C ^ m n ( k ) = C ˜ ^ m n ( k , k = k ) , with the assumption that the temporal correlation of the snapshots are the strongest when the wavenumbers k = k . Equation (14) can be simplified as
C m n ( k ) k m a x k m a x C ^ m n ( k ) e i Δ k L y 1 ) / i Δ k d k d k
Note, the integration does not have a closed form. However, the function in the integrand e i Δ k L y 1 ) / i Δ k is bounded between 0 ( k m a x and finite complex constant L y [ 1 + i ] . Thus, we can comment that C ^ m n ( k ) is bounded if C m n is bounded as well. Additionally, since the ( x , z ) spatial structure of C m n and C ^ m n are the same (from Equation (13)), the eigenvalue scaling laws for the FPOD modes are similar to its 3D counterpart indicating that the scaling laws are a manifestation of the streamwise dominance of the large scale eddies. We present the reconstruction of the 3D POD modes by inverse Fourier transform (IFFT) of the FPOD modes as illustrated in Equation (11). Figure 18 represents the reconstructed mode by IFFT of FPOD modes, m = 0 , m = 1 for k y d = 0.8 ( k y = 2 ). Figure 19 illustrates similar such reconstruction, but for k y = 1.6 ( k y = 4 ). Finally, Figure 20 illustrates the reconstructed modes by performing IFFT of m = 1 , for a set of wavenumbers k y d = 0–1.2 ( k y = 0–4) and k y d = 0–1.6 ( k y = 0–5). From a more quantitative perspective, the reconstructed 3D POD modes from the FPOD that are illustrated in this paper, can be given as
φ ˜ j ( x , y , z ) = 1 2 π k m a x k m a x φ ^ j ( x , k y , z ) W ( k y ) e i k y y d k y
Here, W ( k y ) is a weight function of wavenumbers which act as a filter to the Fourier transform. For Figure 18 and Figure 19, W ( k y ) = 1 for k y = ± 2 and k y = ± 4 , respectively, while W ( k y ) = 0 for all other wavenumbers. For Figure 20, W ( k y ) = 1 B k y B ( B = 3 , for Figure 20a, B = 4 , for Figure 20b) and W ( k y ) = 0 for all other wavenumbers. In other words, while Figure 18 and Figure 19 illustrate single spanwise modes, Figure 20 represents summation of the first several most dominant spanwise modes for a particular m. The reconstruction methodology is motivated by the fact that the first two dominant modes (highest contributors of kinetic energy) have two-pairs of counter-rotating roll-cells or four vortical structures corresponding to an “apparent wavenumber” of 2 [15]. The partial reconstructions (via IFFT), shown in Figure 20, further illustrate the importance of the 3–4 pairs ( k y = 3 , 4 ) of counter-rotating roll-cells in the dominant mode shapes contributing to the reconstruction, despite having a dominant Fourier mode k y = 2 identified as the most energetic POD mode. Note, also that the partial reconstructions give rise to variable size and shape of the modes as opposed to reconstructions by IFFT involving a single wave number or modes obtained from the 3D POD decomposition. This can be probably attributed to the exponential premultiplier term e i Δ k L y 1 ) / i Δ k referred in Equation (15) that alter the y variation of the FPOD correlation matrix as opposed to the 3D-POD correlation matrix. While examining the m = 0 and m = 1 mode composition for k y d = 0.8 and k y d = 1.6 that correspond to the most dominant 3D POD modes (Figure 18 and Figure 19), an interesting fact can be observed. It can be seen that the modes m = 0 illustrate the global mechanisms of momentum transfer via ejections and sweeps (updrafts and downdrafts) across the entire boundary layer depth, i.e., the global interactions between the inner and outer layer, as 3D POD modes capture as well. However, m = 1 modes illustrate a “bi-layer” structure, corresponding to a momentum transfer between the wind turbine wake region and the inner/outer layer respectively. These modes, which characterize the important energetic mechanisms in wind-farm/ABL interactions, are not picked up by the 3D POD decomposition, while they are by FPOD. The analysis involving the 3D-POD, 2D Fourier-POD and the reconstruction of the 3D modes from FPOD reveals that, while one-to-one mapping of the 3D POD modes and the reconstructed 3D modes by the mode ranks, m, is difficult at this stage, it shows the importance of counter-rotating roll-cell structures involving ejections and sweeps in wind farms and the atmospheric boundary layers in general.

5. Conclusions

In the current manuscript we have analysed the dynamics of large turbulent structures in a heterogeneous finite-sized wind canopy using three-dimensional proper orthogonal decomposition. Large counter-rotating roll-cell structures as well as inclined wall-attached structures have been identified in this analysis. The current analysis further reveals that substantial number of snapshots are required to obtain the convergence of the scaling trends of the POD eigenspectra, or in particular, the m 0.9 law. In a heterogeneous wind-farm, where artificial snapshots cannot be created exploiting the domain homogeneity (shifting in periodic wind farms) [15], the eigenspectra does not converge well beyond mode m > 10 . The lack of convergence is attributed to the uncertainty (higher decorrelation times) in the large scale structures which are still present even in high-order POD modes m > 10 (cf., e.g., Figure 3). Consequently, the scaling trend is slightly deviated to m 0.8 . This led us to adapt a novel Fourier-POD methodology (FPOD), to gain further insights on the convergence of eigenspectra as well as the dynamics of large scale modes. FPOD essentially performs the POD eigendecomposition of the laterally Fourier-tranformed two dimensional complex velocity snapshots at each wavenumber as opposed to the three dimensional physical velocity for the 3D POD. The Fourier-POD analysis helps us gain valuable insights on the convergence of the eigenspectra by decoupling the length scales in the spanwise and streamwise direction. In particular it shows that the laterally wider structures are responsible for the m 0.9 / m 1 scaling laws, while the spanwise thinner structures manifest m β where β < 0.9 . Additionally, we show excellent convergence of the Fourier-POD eigenspectra, indicating that the uncertainty of the larger turbulent scales are mostly contained in the Fourier energy spectra, rather than the FPOD modes. Finally, we look into the reconstruction of the 3D modal structures by performing inverse FFT operations on the 2D FPOD modes. From the mathematical analysis of the functional form of the correlation matrix, we provide deep insights about the similarities in the eigenspectra scaling and the modal shapes of the FPOD and 3D-POD. Eventually, our study reconstructs 3D POD modes from the 2D FPOD modes, which further provides guidance towards the understanding of the modal structure in wind farms. From the fundamental perspective, we have seen that the roll-cells are phenomenologically rudimentary structures contributing to the global sweeps and ejections. While [15] have predicted the contribution of such structures towards the kinetic energy entertainment in infinite wind farms, our studies corroborate such structures to be rather a fundamental property of rough ABL flows [17] and are modulated by the wind turbines at rotor scales. Finally, even though our study was performed in the context of a finite-sized wind turbine array, it introduces a novel framework of Fourier-POD modal analysis, which can be useful for analysis of turbulent flows in other flow domains and configurations, as long as they possess a periodic direction. Future work could include development of reduced-order dynamic models based on either 3D-POD or FPOD decomposition and adapting them to a prediction of flow and power generation in wind farms. Additionally, machine learning techniques [63] could potentially be utilized to generalize the ROMs to varying wind conditions.

Author Contributions

Conceptualization, T.C. and Y.T.P.; methodology, validation, investigation, visualization T.C.; writing—original draft preparation, T.C.; writing—review and editing, Y.T.P.; funding acquisition, Y.T.P. All authors have read and agreed to the published version of the manuscript.

Funding

The authors T. Chatterjee and Y. T. Peet would like to acknowledge the support of the grants, NSF-CBET 1335868, NSF-CBET 1707075 and the compute hours from XSEDE research allocations TG-ENG140005, TG-ENG150019 for their present work. This work was completed during TC’s previous association with Arizona State University as a graduate student.

Acknowledgments

The 3D POD analysis has been carried out using open-source spectral element code Nek5000, while the Fourier-POD methodology has been carried out using open-source parallel python code MODRED. The authors would also like to thank Philip Sakievich, Sandia National Laboratories, for providing efficient VTK wrapper and routines for efficient handling of data structures in MODRED.

Conflicts of Interest

The authors declare no conflict of interest.

Nomenclature

dTurbine rotor diameter
δ k l Kronecker delta
z h u b Turbine hub-height
HAtmospheric boundary layer thickness
φ 3D - POD mode
N t Number of snapshots used for POD
Λ 3D - POD diagonal eigenvalue matrix
λ m 3D - POD eigenvalue corresponding to m t h mode
λ η , r e s Resolved length scale in the wind farm LES in η direction
u j Velocity in the j t h direction
u j Velocity fluctuations in the j t h direction
u ^ j Fourier-transform of velocity fluctuations in the j t h direction
P r Projection operation on a variable in a reduced order space
P f , r Projection operation on a spanwise Fourier-transformed variable in a reduced order space
C m n m , n index of correlation matrix in 3D - POD
C ^ m n m , n index of correlation matrix in Fourier - POD
Σ Summation
| | . | | L 2 norm
x m i n , x m a x lower, upper limit of the streamwise size of the domain
y m i n , y m a x lower, upper limit of the spanwise size of the domain
z m i n , z m a x lower, upper limit of the vertical size of the domain
k y Spanwise wavenumber
T e flow through time
L x Domain size in x direction
L z Domain size in z direction
L y Domain size in y direction
U Freestream velocity at the top of the ABL
U h u b Velocity at the hub-height
fTemporal frequency
E u i Energy spectra of the fluctuating velocity u i
T a v g Extent of averaging time span, = 600 T e
R 3 3D real space
L 2 ( R 3 ) Space of square-integrable functions defined in 3D real space
Ω Topological manifold in which the N-S equations are solved
T time averaging operator
k m a x Maximum wavenumber used in the Fourier-reconstruction
( , ) Inner product
W ( k y ) Wavenumber dependent weight functions acting as filters to fourier transforms
φ j 3D j t h POD mode vector from velocity snapshot
φ ^ j 2D j t h Fourier-POD mode vector from Fourier-transformed velocity snapshot
φ ˜ j Reconstructed 3D POD mode vector from 2D j t h Fourier-POD mode
( ) u , v , w Superscripts used in POD modes denoting streamwise, spanwise and wall-normal direction
ψ u i Phase of the complex 2D Fourier-POD mode for streamwise component u i
R ( u ^ i ) Real component of the Fourier transform of velocity fluctuations, u i
I ( u ^ i ) Imaginary component of the Fourier transform of velocity fluctuations, u i
σ u streamwise root mean square of velocity fluctuations
Λ u integral length scale
Λ h u b u integral length scale at hub-height
R e c Reynolds number based on free-stream velocity and chord length
C T Thrust coefficient in wind turbine rotor
R e τ Reynolds number based on friction velocity

References

  1. Fang, J.; Porté-Agel, F. Large-eddy simulation of very-large-scale motions in the neutrally stratified atmospheric boundary layer. Bound. Layer Meteorol. 2015, 155, 397–416. [Google Scholar] [CrossRef] [Green Version]
  2. Calaf, M.; Meneveau, C.; Meyers, J. Large Eddy Simulation Study of Fully Developed Wind-Turbine Array Boundary Layers. Phys. Fluids 2010, 22, 015110. [Google Scholar] [CrossRef] [Green Version]
  3. Chamorro, L.P.; Lee, S.J.; Olsen, D.; Miliren, C.; Marr, J.; Arndt, R.; Sotiropoulos, F. Turbulence effects on a full-scale 2.5MW horizontal-axis wind turbine under neutrally stratified conditions. Wind Energy 2015, 18, 339–349. [Google Scholar] [CrossRef]
  4. Önder, A.; Meyers, J. On the interaction of very-large-scale motions in a neutral atmospheric boundary layer with a row of wind turbines. J. Fluid. Mech. 2018, 841, 1040–1072. [Google Scholar] [CrossRef]
  5. Chatterjee, T.; Peet, Y.T. Contribution of Large Scale Coherence to wind turbine power: A large eddy simulation study in periodic wind farms. Phys. Rev. Fluids 2018, 3, 034601. [Google Scholar] [CrossRef]
  6. Balakumar, B.J.; Adrian, R.J. Large and very-large-scale motions in channel and boundary-layer flows. Philos. Trans. R. Soc. 2007, 365, 665–681. [Google Scholar] [CrossRef]
  7. Chamorro, L.P.; Porté-Agel, F. Turbulent Flow Inside and Above a Wind Farm: A Wind-Tunnel Study. Energies 2011, 4, 1916–1936. [Google Scholar] [CrossRef]
  8. Etling, D.; Brown, R. Roll vortices in planetary boundary layer: A review. Bound. Layer Meteorol. 1993, 65, 215–248. [Google Scholar] [CrossRef]
  9. Young, G.S.; Kristovich, D.A.R.; Hjelmfelt, M.R.; Foster, R.C. Rolls, Streets, waves and more: A review of quasi-two-dimensional structures in the atmospheric boundary layer. Bull. Am. Meteorol. Soc. 2002, 83, 997–1001. [Google Scholar]
  10. Chauhan, K.; Hutchins, N.; Monty, J.; Marusic, I. Structure inclination angles in convective atmospheric surface layer. Bound. Layer Meteorol. 2013, 147, 41–50. [Google Scholar] [CrossRef]
  11. Hutchins, N.; Chauhan, K.; Monty, J.; Klewicki, J. Towards reconciling the large-scale structure of turbulent boundary layers in the atmosphere and the laboratory. Bound. Layer Meteorol. 2012, 145, 273–306. [Google Scholar] [CrossRef]
  12. Kelley, N.D.; Jonkman, B.J.; Scott, G.N.; Bialasiewicz, J.T.; Redmond, L.S. The Impact of Coherent Turbulence on Wind Turbine AeroElastic Response and Its Simulation; NREL/CP-500-38074; National Renewable Energy Lab.(NREL): Golden, CO, USA, 2005. [Google Scholar]
  13. Chamorro, L.; Hong, J.; Gangodagamage, C. On the scale-to-scale coupling between a full- scale wind turbine and turbulence. J. Turbul. 2015, 16, 617–632. [Google Scholar] [CrossRef]
  14. Cortina, G.; Sharma, V.; Calaf, M. Wind farm density and harvested power in very large wind farms: A low order model. Phys. Rev. Fluids 2017, 2, 074601. [Google Scholar] [CrossRef]
  15. VerHulst, C.; Meneveau, C. Large eddy simulation study of the kinetic energy entrainment by energetic turbulent flow structures in large wind farms. Phys. Fluids 2014, 8, 025113. [Google Scholar] [CrossRef]
  16. Peet, Y.T.; Chatterjee, T. The contribution of large scale structures in the power generation of finite scale wind farms using large eddy simulation. In Proceedings of the 10th International Symposium on Turbulence and Shear Flow Phenomena (TSFP10), Chicago, IL, USA, 6–9 July 2017. [Google Scholar]
  17. Zhang, M.; Stevens, R.J.A.M. Characterizing the Coherent Structures Within and Above Large Wind Farms. Bound. Layer Meteorol. 2019. [Google Scholar] [CrossRef] [Green Version]
  18. Stevens, R.J.; Gayme, D.F.; Meneveau, C. Effects of turbine spacing on the power output of extended wind-farms. Wind Energy 2016, 19, 359–370. [Google Scholar] [CrossRef] [Green Version]
  19. Orell, A.; Preziuso, D.; Foster, N.; Morris, S.; Homer, J. 2018 Distributed Wind Market Report; Pacific Northwest National Laboratory operated by Battele; Office of Energy Efficiency and Renewable Energy (EERE), U.S. Department of Energy: Washington, DC, USA, 2018.
  20. Sirovich, L. Turbulence and dynamics of coherent structures. Part I: Coherent structures. Q. J. Appl. Math. 1987, XLV, 561–571. [Google Scholar] [CrossRef] [Green Version]
  21. Park, H.; Sirovich, L. Turbulent thermal convection in a finite domain: Part II. Numerical results. Phys. Fluids A Fluid Dyn. 1990, 2, 1659–1668. [Google Scholar] [CrossRef]
  22. Bastankhah, M.; Porté-Agel, F. Wind tunnel study of the wind turbine interaction with a boundary-layer flow: Upwind region, turbine performance, and wake region. Phys. Fluids 2017, 29, 065105. [Google Scholar] [CrossRef]
  23. Towne, A.; Schmidt, O.T.; Colonius, T. Spectral proper orthogonal decomposition and its relationship to dynamic mode decomposition and resolvent analysis. J. Fluid Mech. 2018, 847, 821–867. [Google Scholar] [CrossRef] [Green Version]
  24. Schmid, P.J. Dynamic mode decomposition of numerical and experimental data. J. Fluid Mech. 2010, 656, 5–28. [Google Scholar] [CrossRef] [Green Version]
  25. Hamilton, N.; Tutkun, M.; Cal, R.B. Low-order representations of the canonical wind turbine array boundary layer via double proper orthogonal decomposition. Phys. Fluids 2016, 28, 025103. [Google Scholar] [CrossRef] [Green Version]
  26. Hamilton, N.; Tutkun, M.; Cal, R.B. Wind turbine boundary layer arrays for Cartesian and staggered configurations: Part II, low-dimensional representations via the proper orthogonal decomposition. Wind Energy 2015, 18, 297–315. [Google Scholar] [CrossRef]
  27. Glegg, S.; Devenport, W. Proper Orthogonal Decomposition Of Turbulent Flows For Aeroacoustic And Hydroacoustic Applications. J. Sound Vib. 2001, 239, 767–784. [Google Scholar] [CrossRef]
  28. Sakievich, P. Identification, Decomposition and Analysis of Dynamic Large-Scale Structures in Turbulent Rayleigh-Bénard Convection. Ph.D. Thesis, Arizona State University, Tempe, AZ, USA, 2017. [Google Scholar]
  29. Pandey, S.; Schumacher, J. Reservoir computing model of two-dimensional turbulent convection. arXiv 2020, arXiv:2001.10280. [Google Scholar]
  30. Chatterjee, T.; Peet, Y. Large Eddy Simulation of a 3 × 3 wind turbine array using Actuator Line model with spectral elements. In Proceedings of the 34th Wind Energy Symposium, San Diego, CA, USA, 4–8 January 2016. AIAA paper 2016–1988. [Google Scholar]
  31. Chatterjee, T.; Cherukuru, N.W.; Peet, Y.; Calhoun, R.J. Incorporating realistic geophysical effects of mean wind from LIDAR measurements in Large Eddy Simulation of Wind Turbine Arrays. J. Phys. Conf. Ser. 2018, 1037, 072056. [Google Scholar] [CrossRef]
  32. Fischer, P.F.; Lottes, J.W.; Kerkemeier, S.G. Nek5000: An Open Source CFD Solver. 2008. Available online: http://nek5000.mcs.anl.gov (accessed on 29 March 2020).
  33. Deville, M.O.; Fischer, P.F.; Mund, E.H. High-Order Methods for Incompressible Fluid Flow; Cambridge University Press: Cambridge, UK, 2002. [Google Scholar]
  34. Chatterjee, T.; Peet, Y. Incorporating realistic geophysical effects of mean wind from LIDAR measurements in Large Eddy Simulation of Wind Turbine Arrays. In Proceedings of the 35th Wind Energy Symposium, Grapevine, TX, USA, 9–13 January 2017. AIAA paper 2017-1165. [Google Scholar]
  35. McTavish, S.; Rodrigue, S.; Feszty, D.; Nitzsche, F. An investigation of in-field blockage effects in closely spaced lateral wind farm configurations. Wind Energy 2015, 18, 1989–2011. [Google Scholar] [CrossRef]
  36. Mason, P.J.; Thompson, D.J. Stochastic backscatter in large-eddy simulations of boundary layers. J. Fluid. Mech. 1992, 242, 51–78. [Google Scholar] [CrossRef]
  37. Porté-Agel, F.; Meneveau, C.; Parlange, M.B. A scale-dependent dynamics model for large eddy simulation: Application to a neutral atmospheric boundary layer. J. Fluid. Mech. 2000, 415, 261–284. [Google Scholar] [CrossRef] [Green Version]
  38. Bou-Zeid, E.; Meneveau, C.; Parlange, M. A scale-dependent Lagrangian dynamic model for large eddy simulation of complex turbulent flows. Phys. Fluids 2005, 415, 025125. [Google Scholar] [CrossRef] [Green Version]
  39. Hayat, I.; Chatterjee, T.; Liu, H.; Peet, Y.T.; Chamorro, L.P. Exploring wind farms with alternating two- and three-bladed wind turbines. Renew. Energy 2019, 138, 764–774. [Google Scholar] [CrossRef]
  40. Hutchins, N.; Nickels, T.B.; Marusic, I.; Chong, M.S. Hot-wire spatial resolution issues in wall-bounded turbulence. J. Fluid. Mech. 2009, 635, 103–136. [Google Scholar] [CrossRef] [Green Version]
  41. Lettau, H. A re-examination of the Leipzig wind profile considering some relations between wind and turbulence in the frictional layer. Tellus 1950, 2, 125–129. [Google Scholar] [CrossRef] [Green Version]
  42. Sillero, J.A.; Jiménez, J.; Moser, R. Two-point statistics for turbulent boundary layers and channels at Reynolds numbers up to δ+ 2000. Phys. Fluids 2014, 26, 105109. [Google Scholar] [CrossRef] [Green Version]
  43. Chatterjee, T.; Peet, Y.T. Effect of artificial length scales in large eddy simulation of a neutral atmospheric boundary layer flow: A simple solution to log-layer mismatch. Phys. Fluids 2017, 29, 075175. [Google Scholar] [CrossRef]
  44. Troldborg, N. Actuator Line Modeling of Wind Turbine Wakes. Ph.D. Thesis, Technical University of Denmark, Lyngby, Denmark, 2008. [Google Scholar]
  45. Chatterjee, T.; Peet, Y. Actuator Line Wind Turbine Simulations in Atmospheric Turbulent Flows using Spectral Element Method. In Proceedings of the 33rd Wind Energy Symposium, Kissimmmee, FL, USA, 5–9 January 2015. AIAA paper 2015-0727. [Google Scholar]
  46. Chatterjee, T.; Peet, Y.T. Exploring the benefits of vertically staggered wind farms: Understanding the power generation mechanisms of turbines operating at different scales. Wind Energy 2019, 22, 283–301. [Google Scholar] [CrossRef]
  47. Meyers, J.; Meneveau, C. Flow visualization using momentum and energy transport tubes and applications to turbulent flow in wind farms. J. Fluid. Mech. 2013, 715, 335–358. [Google Scholar] [CrossRef] [Green Version]
  48. Allaerts, D.; Meyers, J. Effect of inversion-layer height and Coriolis forces on developing wind-farm boundary layers. In Proceedings of the 34th Wind Energy Symposium, San Diego, CA, USA, 4–8 January 2016. AIAA Paper 2016-1989. [Google Scholar]
  49. Allaerts, D.; Meyers, J. Boundary-layer development and gravity waves in conventionally neutral wind farms. J. Fluid Mech. 2017, 814. [Google Scholar] [CrossRef] [Green Version]
  50. Cava, D.; Katul, G.G.; Scrimieri, A.; Poggi, D.; Cescatti, A.; Giostra, U. Buoyancy and The Sensible Heat Flux Budget Within Dense Canopies. Bound. Layer Meteorol. 2011, 118, 217–240. [Google Scholar] [CrossRef]
  51. Banerjee, T.; De Roo, F.; Mauder, M. Connecting the Failure of K Theory inside and above Vegetation Canopies and Ejection–Sweep Cycles by a Large-Eddy Simulation. J. Appl. Meteorol. Climatol. 2017, 56, 3119–3131. [Google Scholar] [CrossRef]
  52. Wu, S.; Christensen, K.T.; Pantano, C. Modelling smooth- and transitionally rough-wall turbulent channel flow by leveraging inner–outer interactions and principal component analysis. J. Fluid Mech. 2019, 863, 407–453. [Google Scholar] [CrossRef]
  53. Peet, Y.; Fischer, P.; Conzelmann, G.; Kotamarthi, V. Actuator line aerodynamics model with spectral elements. In Proceedings of the 51st Aerospace Sciences Meeting, Grapevine, TX, USA, 7–10 January 2013. AIAA Paper 2013-1210. [Google Scholar]
  54. Holmes, P.; Lumley, J.H.; Berkooz, C.; Rowley, C.W. Turbulence, Coherent Structures, Dynamical Systems and Symmetry, 2nd ed.; Cambridge University Press: Cambridge, UK, 2012. [Google Scholar]
  55. Berkooz, G.; Holmes, P.; Lumley, J.L. The Proper Orthogonal Decomposition in the Analysis of Turbulent Flows. Annu. Rev. Fluid Mech. 1993, 25, 539–575. [Google Scholar] [CrossRef]
  56. Brandt Belson, J.T.; Rowley, C. 2019. Available online: https://modred.readthedocs.io/en/stable/intro.html (accessed on 29 March 2020).
  57. Mathis, R.; Monty, J.P.; Hutchins, N.; Marusic, I. Comparison of large-scale amplitude modulation in turbulent boundary layers, pipes, and channel flows. Phys. Fluids 2009, 21, 111703. [Google Scholar] [CrossRef] [Green Version]
  58. Ren, H.; Laima, S.; Li, H. Numerical study of amplitude modulation in the atmospheric boundary layer at very high Reynolds number. AIP Adv. 2019, 9, 105112. [Google Scholar] [CrossRef]
  59. Perry, A.E.; Henbest, S.; Chong, M.S. Theoretical and Experimental studies of wall turbulence. J. Fluid. Mech. 1986, 165, 163–199. [Google Scholar] [CrossRef] [Green Version]
  60. Adrian, R.J. Hairpin vortex organization in wall turbulence. Phys. Fluids 2007, 19, 041301. [Google Scholar] [CrossRef] [Green Version]
  61. Tung, K.K.; Orlando, W.W. The k−3 and the k−5/3 Energy Spectrum of Atmospheric Turbulence: Quasigeostrophic Two-Level model simulation. J. Atmos. Sci. 2003, 60, 824–835. [Google Scholar] [CrossRef] [Green Version]
  62. Kraichnan, R.H. Inertial ranges of two-dimensional turbulence. Phys. Fluids 1967, 10, 1417–1423. [Google Scholar] [CrossRef] [Green Version]
  63. Brunton, S.L.; Noack, B.R.; Koumoutsakos, P. Machine learning for fluid mechanics. Ann. Rev. Fluid Mech. 2020, 52, 477–508. [Google Scholar] [CrossRef] [Green Version]
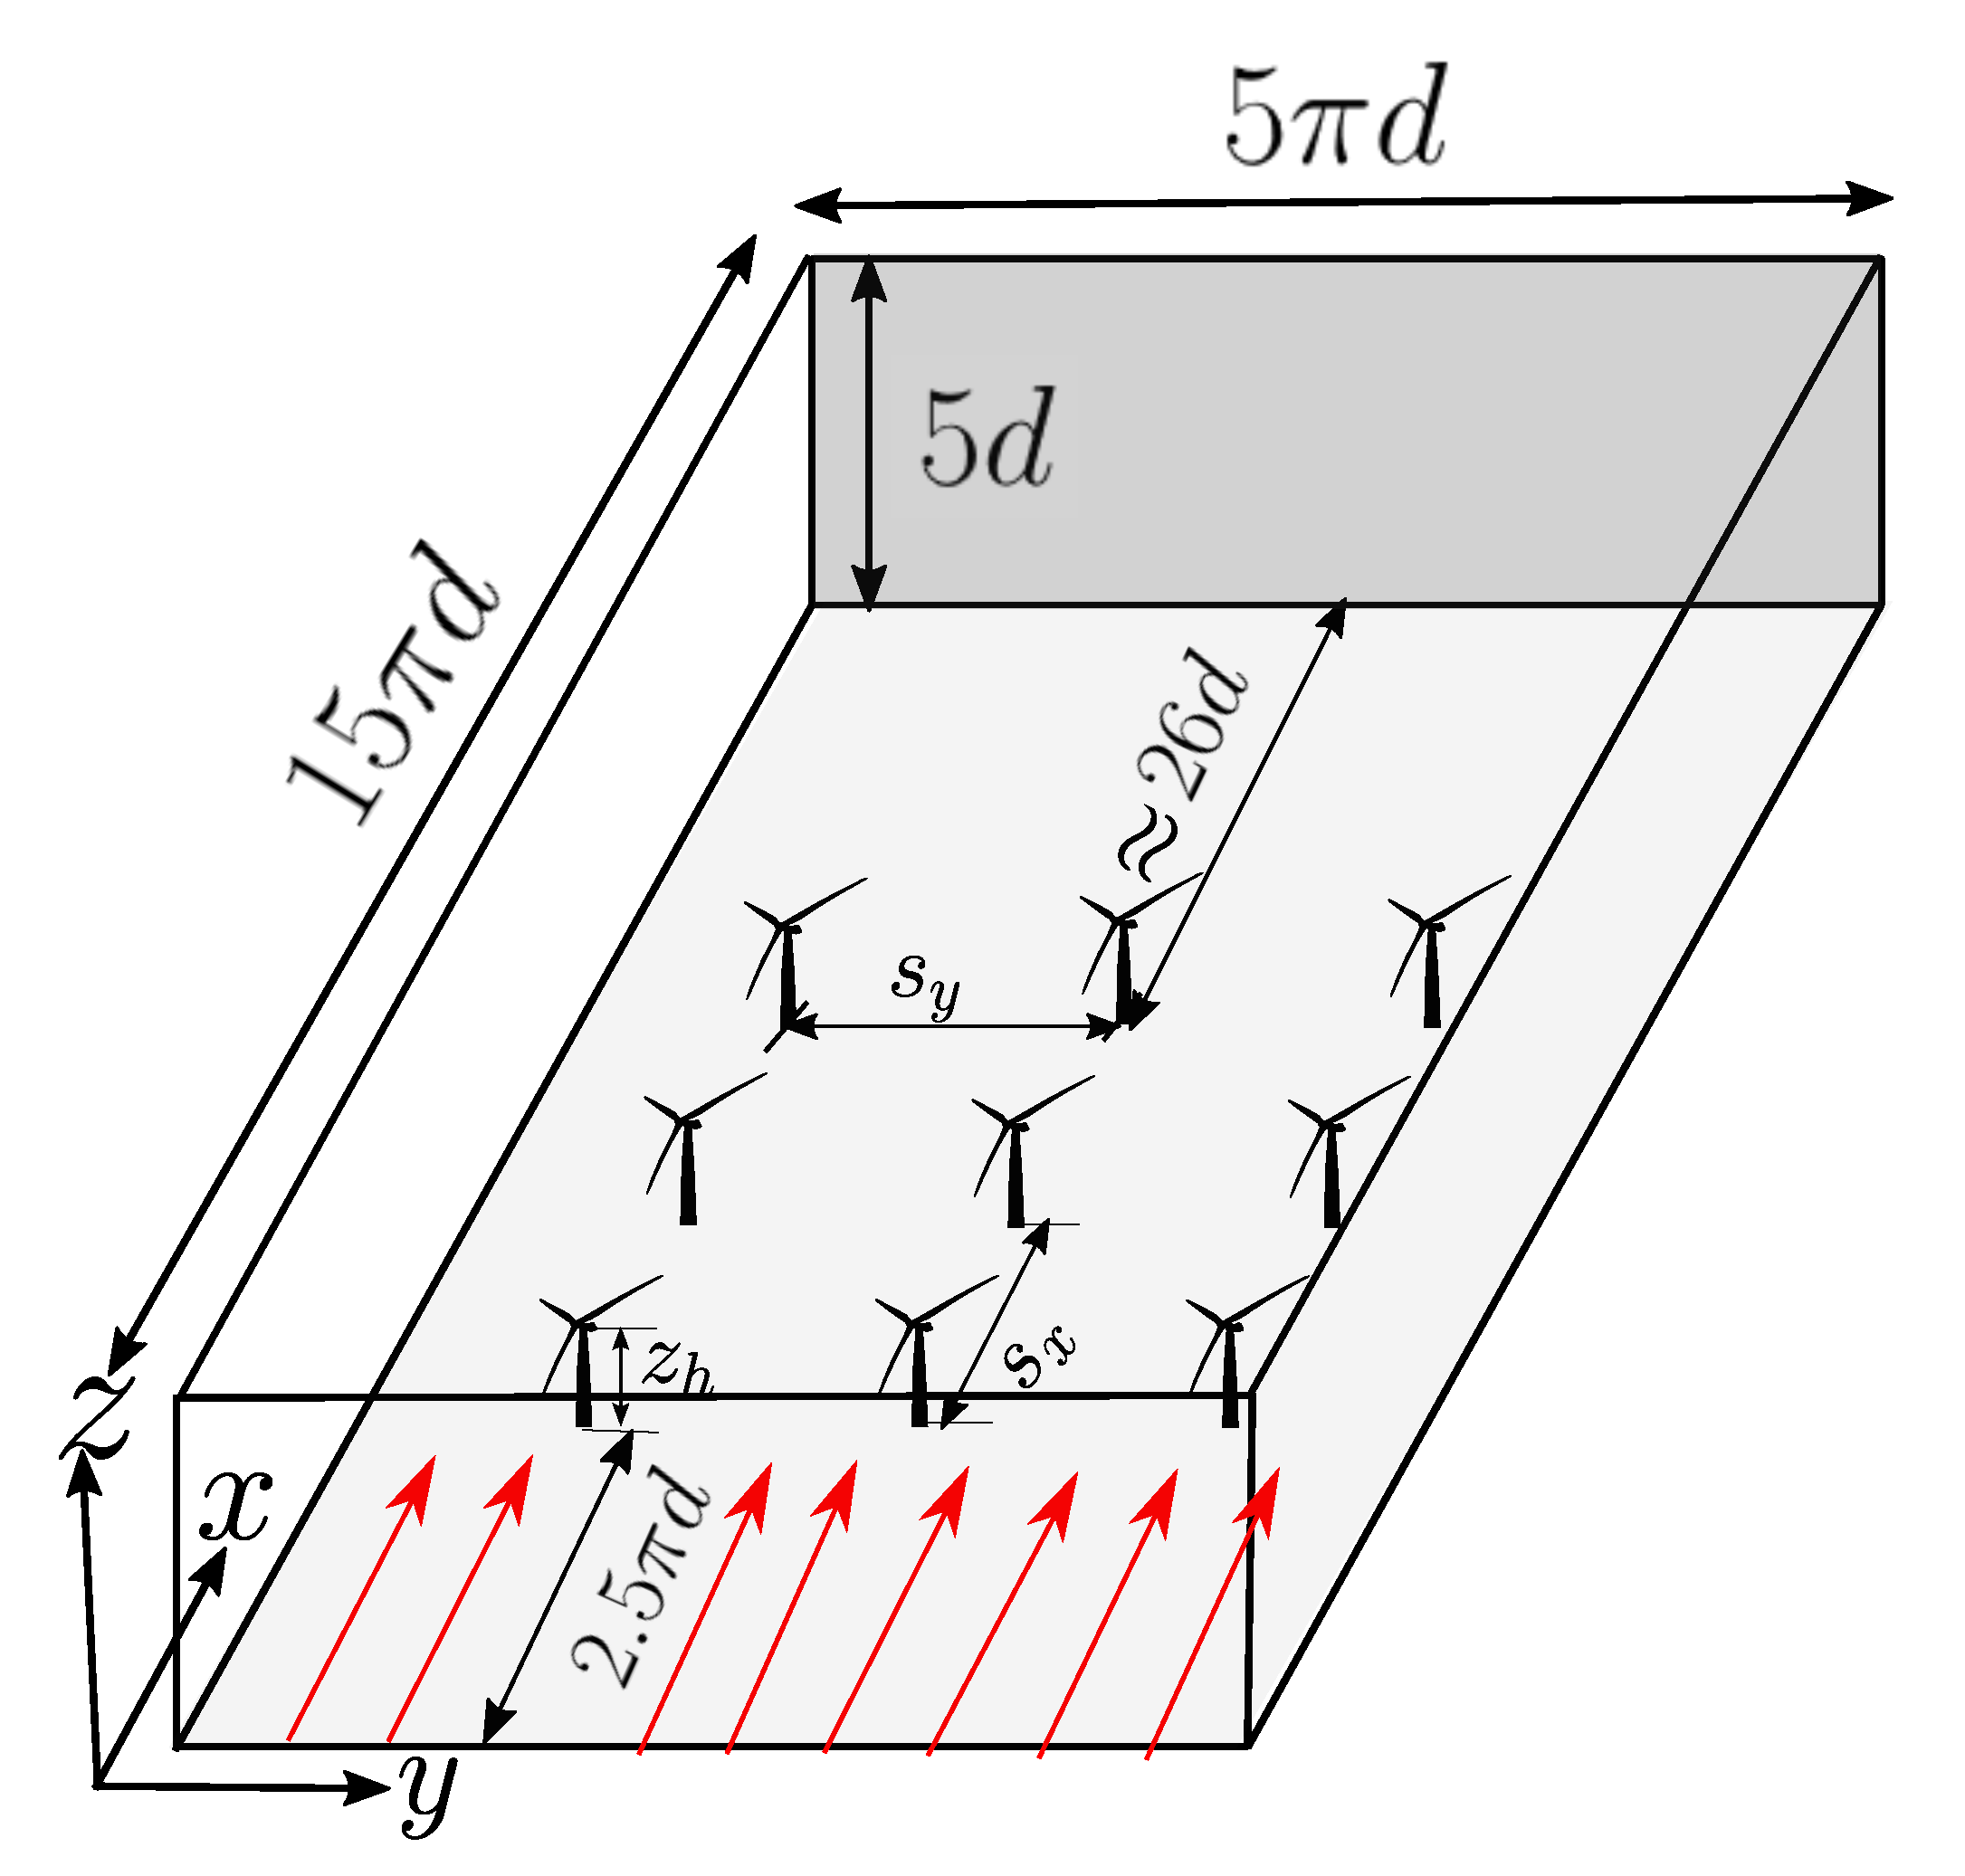
Figure 1. Schematic of the 3 × 3 wind turbine array. Inter-turbine distance, s x = 7 d , s y = 3 d .
Energies 13 01660 g001
Figure 2. Flow characteristics and validation with experiments of a simulated neutral atmospheric boundary layer (ABL) profile ( R e τ 5 × 10 8 ) using wall-modeled large eddy simulation (LES). (a) Normalized streamwise mean velocity, U / U h u b , (b) turbulence intensity, σ u / U h u b and (c) Normalized integral length scale Λ u / Λ h u b u . The horizontal lines represent turbine hub-height location. Expt-Hayat et al. 2019 [39], ( R e τ 9.3 × 10 3 ); HExpt, wind tunnel experiment from Hutchins et al. (2009) [40] ( R e τ 1.9 × 10 4 ), Channel-Channel flow DNS by Sillerro et al. (2014) [42] ( R e τ 2 × 10 3 ) and LWP-Leipzig wind profile, Lettau (1950) [41].
Energies 13 01660 g002
Figure 3. (a) Eigenvalue spectrum normalized by the first eigenvalue (highest energy) for different wind turbine layouts. Lines: Blue—periodic wind farm (asymptotically infinite) with 8 × 6 array, 20 π d × 10 π d × 10 d [5], Magenta—current finite sized wind farm ( 3 × 3 array, 3 π H × π H × H ). Black circle—periodic wind farm ( 4 × 6 array, 10 π d × 10 π d × 10 d ), LES simulation by Verhulst et al. [15]. Red triangle—periodic wind farm ( 16 × 12 array, 40 π d × 20 π d × 10 d ), LES simulation by Zhang et al. [17]. Blue square—developing wind farm ( 12 × 12 array, 40 π d × 20 π d × 10 d ) [17]. H is the boundary layer thickness. (b) Spectral convergence of the eignevalue spectrum λ m / λ 1 for the current finite sized wind farm. Snapshot separation, black— 4 T e / 5 , red— 3 T e / 5 , blue— 2 T e / 5 and magenta— T e / 5 .
Energies 13 01660 g003
Figure 4. y z plane of the most energetic normalized proper orthogonal decomposition (POD) mode for the periodic wind farm case ( 8 × 6 array) [5] for the mode m = 0 . Red-blue contours indicate the normalized streamwise velocity modes, φ k u λ k / U , overlayed with in-plane spanwise and vertical modes, φ m v λ m / U , φ m w λ m / U as vectors. Green circles—turbine locations.
Energies 13 01660 g004
Figure 5. Normalized POD mode for (a) m = 0 , (b) m = 1 , (c) m = 2 , (d) m = 3 , (e) m = 4 , (f) m = 5 , (g) m = 6 , (h) m = 7 for finite-sized wind turbine array. Red-blue contours indicate the normalized streamwise velocity modes, φ k u λ k / U overlayed with in-plane spanwise and vertical modes, φ m v λ m / U , φ m w λ m / U as vectors. Yellow circles– turbine locations.
Energies 13 01660 g005
Figure 6. 3D normalized POD mode, m = 0 (a) Isosurface levels of streamwise POD mode for φ m u λ m / U (b) Streamtubes of vector streamwise POD mode for φ m u , v , w λ m / U .
Energies 13 01660 g006
Figure 7. Normalized POD mode for (a) m = 0 , (b) m = 1 , (c) m = 2 , (d) m = 3 , (e) m = 4 , (f) m = 5 , (g) m = 6 , (h) m = 7 , (i) m = 8 , (j) m = 9 . Red-blue contours indicate the normalized velocity magnitude modes, | φ m u λ m / U | . Thick black vertical lines–turbine locations.
Energies 13 01660 g007
Figure 8. (a,b) Projection coefficient of 3D POD modes, a m ( t ) vs. time normalized by flow-through time, T e = 15 π d / U . (c) Power spectral density of the projection coefficients vs. normalized frequency, f T e .
Energies 13 01660 g008
Figure 9. u (solid), w (dashed) energy spectra and their variability (± twice the standard deviation; transparent blue and red). Energy spectra computed in spanwise wavenumber space, averaged temporally and in the streamwise, wall normal direction.
Energies 13 01660 g009
Figure 10. Snapshots of Fourier-transformed velocity magnitude, u for spanwise wavenumbers, (a) k y d = 0 and (b) k y d = 2.0 . Thick black vertical lines - turbine locations.
Energies 13 01660 g010
Figure 11. (a) Normalized eigenspectra λ m / λ 1 for different wavenumbers k y for the Fourier-POD modes. (b) Convergence of the normalized eigenspectra λ m / λ 1 for wavenumber k y d = 2 . Different snapshot spacing, T e / 5 —green, 2 T e / 5 —black, 4 T e / 5 —blue, 4 T e / 5 (not considering the reflected data)—red square.
Energies 13 01660 g011
Figure 12. Premultiplied normalized eigenspectra for different wavenumbers k y for the Fourier-POD modes. (a) m λ m / λ 1 , for k y d = 0 , 0.4 , 0.8 , 1.2 . (b) m λ m / λ 1 , for k y d = 1.6 , 2 , 2.4 , 2.8 (c) m 3 / 4 λ m / λ 1 , for k y d = 3.2 , 3.6 , 4.0 , 4.4 , 4.8 , 5.2 .
Energies 13 01660 g012
Figure 13. Normalized Fourier-POD mode for wave-number (POD of spanwise averaged snapshot data), k y d = 0 . (a) m = 0 , (b) m = 1 , (c) m = 2 , (d) m = 3 , (e) m = 4 , (f) m = 5 , (g) m = 6 , (h) m = 7 , (i) m = 8 . Red-blue contours indicate the normalized velocity magnitude modes, | φ k u λ k / U | . Thick yellow vertical lines–turbine locations.
Energies 13 01660 g013
Figure 14. Normalized Fourier-POD mode for wave-number, k y d = 0.4 . (a) m = 0 , (b) m = 1 , (c) m = 2 , (d) m = 3 , (e) m = 4 , (f) m = 5 , (g) m = 6 , (h) m = 7 , (i) m = 8 . Red-blue contours indicate the normalized velocity magnitude modes, | φ k u λ k / U | . Thick yellow vertical lines–turbine locations.
Energies 13 01660 g014
Figure 15. Normalized Fourier-POD mode for wave-number, k y d = 0.8 . (a) m = 0 , (b) m = 1 , (c) m = 2 , (d) m = 3 , (e) m = 4 , (f) m = 5 , (g) m = 6 , (h) m = 7 , (i) m = 8 . Red-blue contours indicate the normalized velocity magnitude modes, | φ k u λ k / U | . Thick yellow vertical lines–turbine locations.
Energies 13 01660 g015
Figure 16. Normalized Fourier-POD mode for wave-number, k y d = 1.2 . (a) m = 0 , (b) m = 1 , (c) m = 2 , (d) m = 3 , (e) m = 4 , (f) m = 5 , (g) m = 6 , (h) m = 7 , (i) m = 8 . Red-blue contours indicate the normalized velocity magnitude modes, | φ k u λ k / U | . Thick yellow vertical lines–turbine locations.
Energies 13 01660 g016
Figure 17. Phase of streamwise Fourier-POD mode for wave-number k y d = 0.4 . (a) m = 1 , (b) m = 2 , (c) m = 3 , (d) m = 4 . Red-blue contours indicate the phase of the streamwise modes, ψ = tan ( I ( φ k u ) R ( φ k u ) ) . Thick yellow vertical lines–turbine locations.
Energies 13 01660 g017
Figure 18. Reconstructed 3D POD modes from 2D Fourier-POD modes at y z plane, x = 7.85 d , (a) m = 0 , inverse FFT k y d = 0.8 , (b) m = 1 , inverse FFT, k y d = 0.8 . Contours— ϕ ˜ u , in-plane vectors— ϕ ˜ v , ϕ ˜ w Thick yellow circles—turbine locations.
Energies 13 01660 g018
Figure 19. Reconstructed 3D POD modes from 2D Fourier-POD modes at y z plane, x = 7.85 d , (a) m = 0 , inverse FFT k y d = 1.6 , (b) m = 1 , inverse FFT, k y d = 1.6 . Contours— ϕ ˜ u , in-plane vectors— ϕ ˜ v , ϕ ˜ w . Thick yellow circles—turbine locations.
Energies 13 01660 g019
Figure 20. Reconstructed 3D POD modes from 2D Fourier-POD modes at y z plane, x = 7.85 d , (a) m = 0 , inverse FFT k y d = 0 1.2 , (b) m = 0 , inverse FFT, k y d = 0 1.6 . Contours— ϕ ˜ u , in-plane vectors— ϕ ˜ v , ϕ ˜ w . Thick yellow circles–turbine locations.
Energies 13 01660 g020
Table 1. Details of the computational grids for the precursor ABL and the wind turbine array domain. N η e is the number of spectral elements in the η direction. Eight Gauss-Lobatto-Legendre (GLL) nodes (Legendre polynomial order 7) have been used per element per Cartesian direction.
CaseGeometryInter-Turbine Distance N x e × N y e × N z e Grid Points
Neutral ABL 10 π d × 5 π d × 5 d 30 × 20 × 24 5.06 × 10 6
WT Array 15 π d × 5 π d × 5 d 7 d × 3 d 48 × 32 × 24 1.281 × 10 7
Table 2. Maximum, minimum and average wavelengths captured, for the ABL and the wind turbine array domain. d is the turbine rotor diameter.
Neutral ABL WT Array
Direction λ η , res   max λ η , res   min λ ¯ η , res λ η , res   max λ η , res   min λ ¯ η , res
x0.2992d0.2992d0.2992d0.3366d0.0944d0.2804d
y 0.2240 d 0.2240 d 0.2240 d 0.3316d0.0358d0.1402d
z 0.0596 d 0.0596 d 0.0596 d 0.0942d0.0476d0.0596d
Table 3. Roll features in POD computation of the periodic wind farms, d = 0.1 H . Roll-size denotes spanwise extent from center to center of roll vortices (zero crossing of streamwise modes). Roll density is number of roll pairs/ L y . Roll-height—height of the center of roll-vortices above ground.
Geometry ( L x × L y × L z )Inter-Turbine Distance, s x × s z Roll SizeRoll DensityRoll Height
20 π d × 10 π d × 10 d [5] 7.85 d × 5.24 d 8 d 0.06 / d 4 d
10 π d × 10 π d × 10 d [15] 7.85 d × 5.24 d ∼15.7d 0.03 / d 6 d
40 π d × 20 π d × 10 d [17] 7.85 d × 5.24 d 5.23 d 10.47 d 0.0477 / d 5 d