Article

Aerodynamic Investigation of Datum and Slotted Blade Profiles under Different Mach Number Conditions

1
National Key Laboratory of Science and Technology on Aero-Engine Aero-Thermodynamics, School of Energy and Power Engineering, Beihang University, Beijing 100191, China
2
Collaborative Innovation Center of Advanced Aero-Engine, Beihang University, Beijing 100191, China
*
Author to whom correspondence should be addressed.
Energies 2020, 13(7), 1673; https://doi.org/10.3390/en13071673
Submission received: 18 February 2020 / Revised: 18 March 2020 / Accepted: 20 March 2020 / Published: 3 April 2020

Abstract

:
Mach number effects on loss and loading are evaluated in both the datum and slotted compressor profiles under a wide range of incidences based on two-dimensional (2D) computational fluid dynamic (CFD) simulations. First, total pressure loss and loading abilities are compared. Then, three kinds of deficit thickness are defined and evaluated, and a correlation is made between the loading and the momentum deficit thickness at the profile trailing edge. Finally, the nondimensionalized destruction of mean mechanical energy and dissipation function are employed to analyze the loss mechanism. The slotted profile broadens the low loss range towards the positive incidence range. The slotted profile allows a higher diffusion factor (DF) than the datum profile. It is hard to distinguish failure simply based on the DF values, whereas the Zweifel loading coefficient connects well with the low momentum deficit in the profile trailing edge. The peak of the V-shaped distributions in the Ψ - θ d e f plot could better suggest the design condition and determine the correct operating range despite the occurrence of bulk separation. The slotted profile gains the ability of the boundary layer flow near the suction surface to resist the adverse pressure gradient, hence, a reduced shear thickness and a uniformed downstream flow field is obtained.

Graphical Abstract

1. Introduction

Air transport will contribute 1.5 billion tonnes of CO2 emissions annually by 2025 [1]. Hence, it is critical to study aerodynamics with the view to creating more energy-efficient aero-engine. However, the development of more energy-efficient aero-engine requires less cost, lighter weight, and fewer emissions. As the key component of aero-engine, the compressor system play a vital role to the performance. A nominal 1% drop in compressor efficiency (if first stage) would result in about three percent increase in the specific fuel consumption (SFC), due to the changes in both pressure ratio and efficiency [2]. For the development of higher loading, higher efficiency compressors, improving the thrust-to-weight ratio is a permanent pursuit. Usually, increasing the total pressure ratio per stage of compressors is required, resulting in high blade loading. The loss may significantly increase with higher loading.
Designs for high loading are considerably complex but of significant importance. During recent decades, many attempts have been made to obtain high loading for compressors. Wennerstrom [3] made an earlier survey on the approaches taken to achieve a high loading design in axial-flow compressors up to the 1970s. To increase diffusion limits, efforts were associated with some form of boundary layer control. Generally passive approaches were favoured such as vortex generators [4], slots [5,6,7] and tandem blading (another version of a slot) [8]. Active schemes were also considered such as suction and blowing [9,10]. Passive flow control could be thought as altering the aerodynamic performance through wall contouring. In the current study, the effect of slots on aerodynamic performance of blade profile is evaluated. Although slots have been widely and successfully applied to aircraft, their application to turbomachinery has been much less successful. As summarized by Wennerstrom [3], slots might be expected to have some positive benefit only at lower aspect ratios and lower Mach numbers; slots at mid-span could show relative effectiveness and slots near the end walls demonstrated ineffectiveness, which was mainly attributed to their inability to reduce the large secondary flows in the wall regions. Since then, many efforts for flow control were carried out to improve performance in highly loaded compressors using various methods, such as boundary layer aspiration [11,12,13], plasma [14,15], fluidic actuators [16], synthetic and continuous jets [17], vortex generator jets [18,19], Coanda jet flaps [20], whole span slot [21], leading-edge tubercles [22], endwall fence [23], vortex generator [24], blended blades with endwall contouring [25], and streamwise grooves [26]. However, these methods have not been widely used due to requirements of additional devices or limitations of operating range. Furthermore, most studies were conducted on low-speed cascades due to flow complexity and high experimental costs.
Recently, a novel control scheme using blade end slots was proposed in our previous studies. The results show that this is an effective way to suppress corner separation and improve compressor performance [27,28,29,30,31]. The proposed concept of blade end slots is different from previous slots studies. The jet flow angle for the outflow of the slot is constrained to be as small as possible in reference to the main flow so that it could suppress the separation mainly by reenergizing the low momentum fluid in the corner region by significantly reducing the mixing loss of the slot jet flow and the main passage flows. Numerical investigations on the blade end slot in a low-speed prescribed velocity distribution (PVD) cascade revealed a progressive perspective [27]. Experimental investigations using the blade end slot in a low-speed NACA65-009 cascade also demonstrated its effectiveness [28]. Numerical investigations using imitated blade end slot models in a high-speed NACA65-K48 cascade further verified the potential for the blade end slot in suppressing the corner separation together with solidity reduction [32]. Then, experimental investigations using a double-slot scheme at the blade end were conducted in a highly loaded compressor blade under design Mach number conditions (Ma = 0.59) [29]; the blade end slots were found to effectively reduce the total pressure loss and broaden the effective operating range by suppressing the occurrence of open corner separation [30]. Furthermore, comparisons were made to evaluate the effect of blading with blade end slots and full-span slots, and the results showed that the full-span slots effectively reduce the loss under positive incidence angles, whereas the blade end slots effectively reduced loss over a wide incidence range that even covered some negative incidence angles [31]. The same strategy using blade end slots has been used in a GE in-house High Speed Research Compressor (HSRC) which models the last three stages of a modern axial compressor, for both aircraft engine (high-pressure compressor) and heavy-duty gas turbine for power generation. In addition, the results show that it was sufficient to have a more than 6% improvement of the stall margin with a negligible efficiency penalty [33]. The substantial improvement in performance by the blade end slots inspires us to seek deeper insight of the loss mechanism and its connection to the compressor loading for both the datum and slotted profiles, particularly with the variation of inlet Mach number.
Denton [34] demonstrated that the profile loss, endwall loss, and leakage loss are the main losses in axial compressors, with profile loss accounting for approximately one third of losses in compressors. Complex vortical flows also exist in high loading compressors, and the induced high loss is particularly difficult to quantify [35,36]. The geometric variations are also responsible for the performance. Goodhand at al. [37] investigated the sensitivity of compressor 2D incidence range to geometric variations, and proposed that separation occurred when the flow decelerations imposed by the geometric variations were higher than the local flow acceleration over the design intent blade. Besides the geometric variation, the inlet Mach number significantly affects the compressor performance. The effective operating range is reduced with an increase in Mach number. Hence, analyses of high loading blade profiles with a variation of Mach number play an important role in modern compressor design.
The objective of this paper is to evaluate the effects of Mach number on the loss effect and loading capacities for the datum and slotted blade profiles and explore the underlying loss mechanism. Because the profile loss refers to the loss generated in the blade boundary layer that is located relatively far away from the endwall region, the profile loss could be evaluated in a two-dimensional (2D) way. Performance for the datum profile and the slotted profile with double slots are elaborately compared based on experimentally validated numerical simulations. Firstly, the Mach number effects on the performance and the deficit thickness are evaluated. Then, associations are made for the deficit thickness to the loss and loading capacities. Sources of loss and the physical mechanisms responsible are explored.

2. Configurations and Computational Method
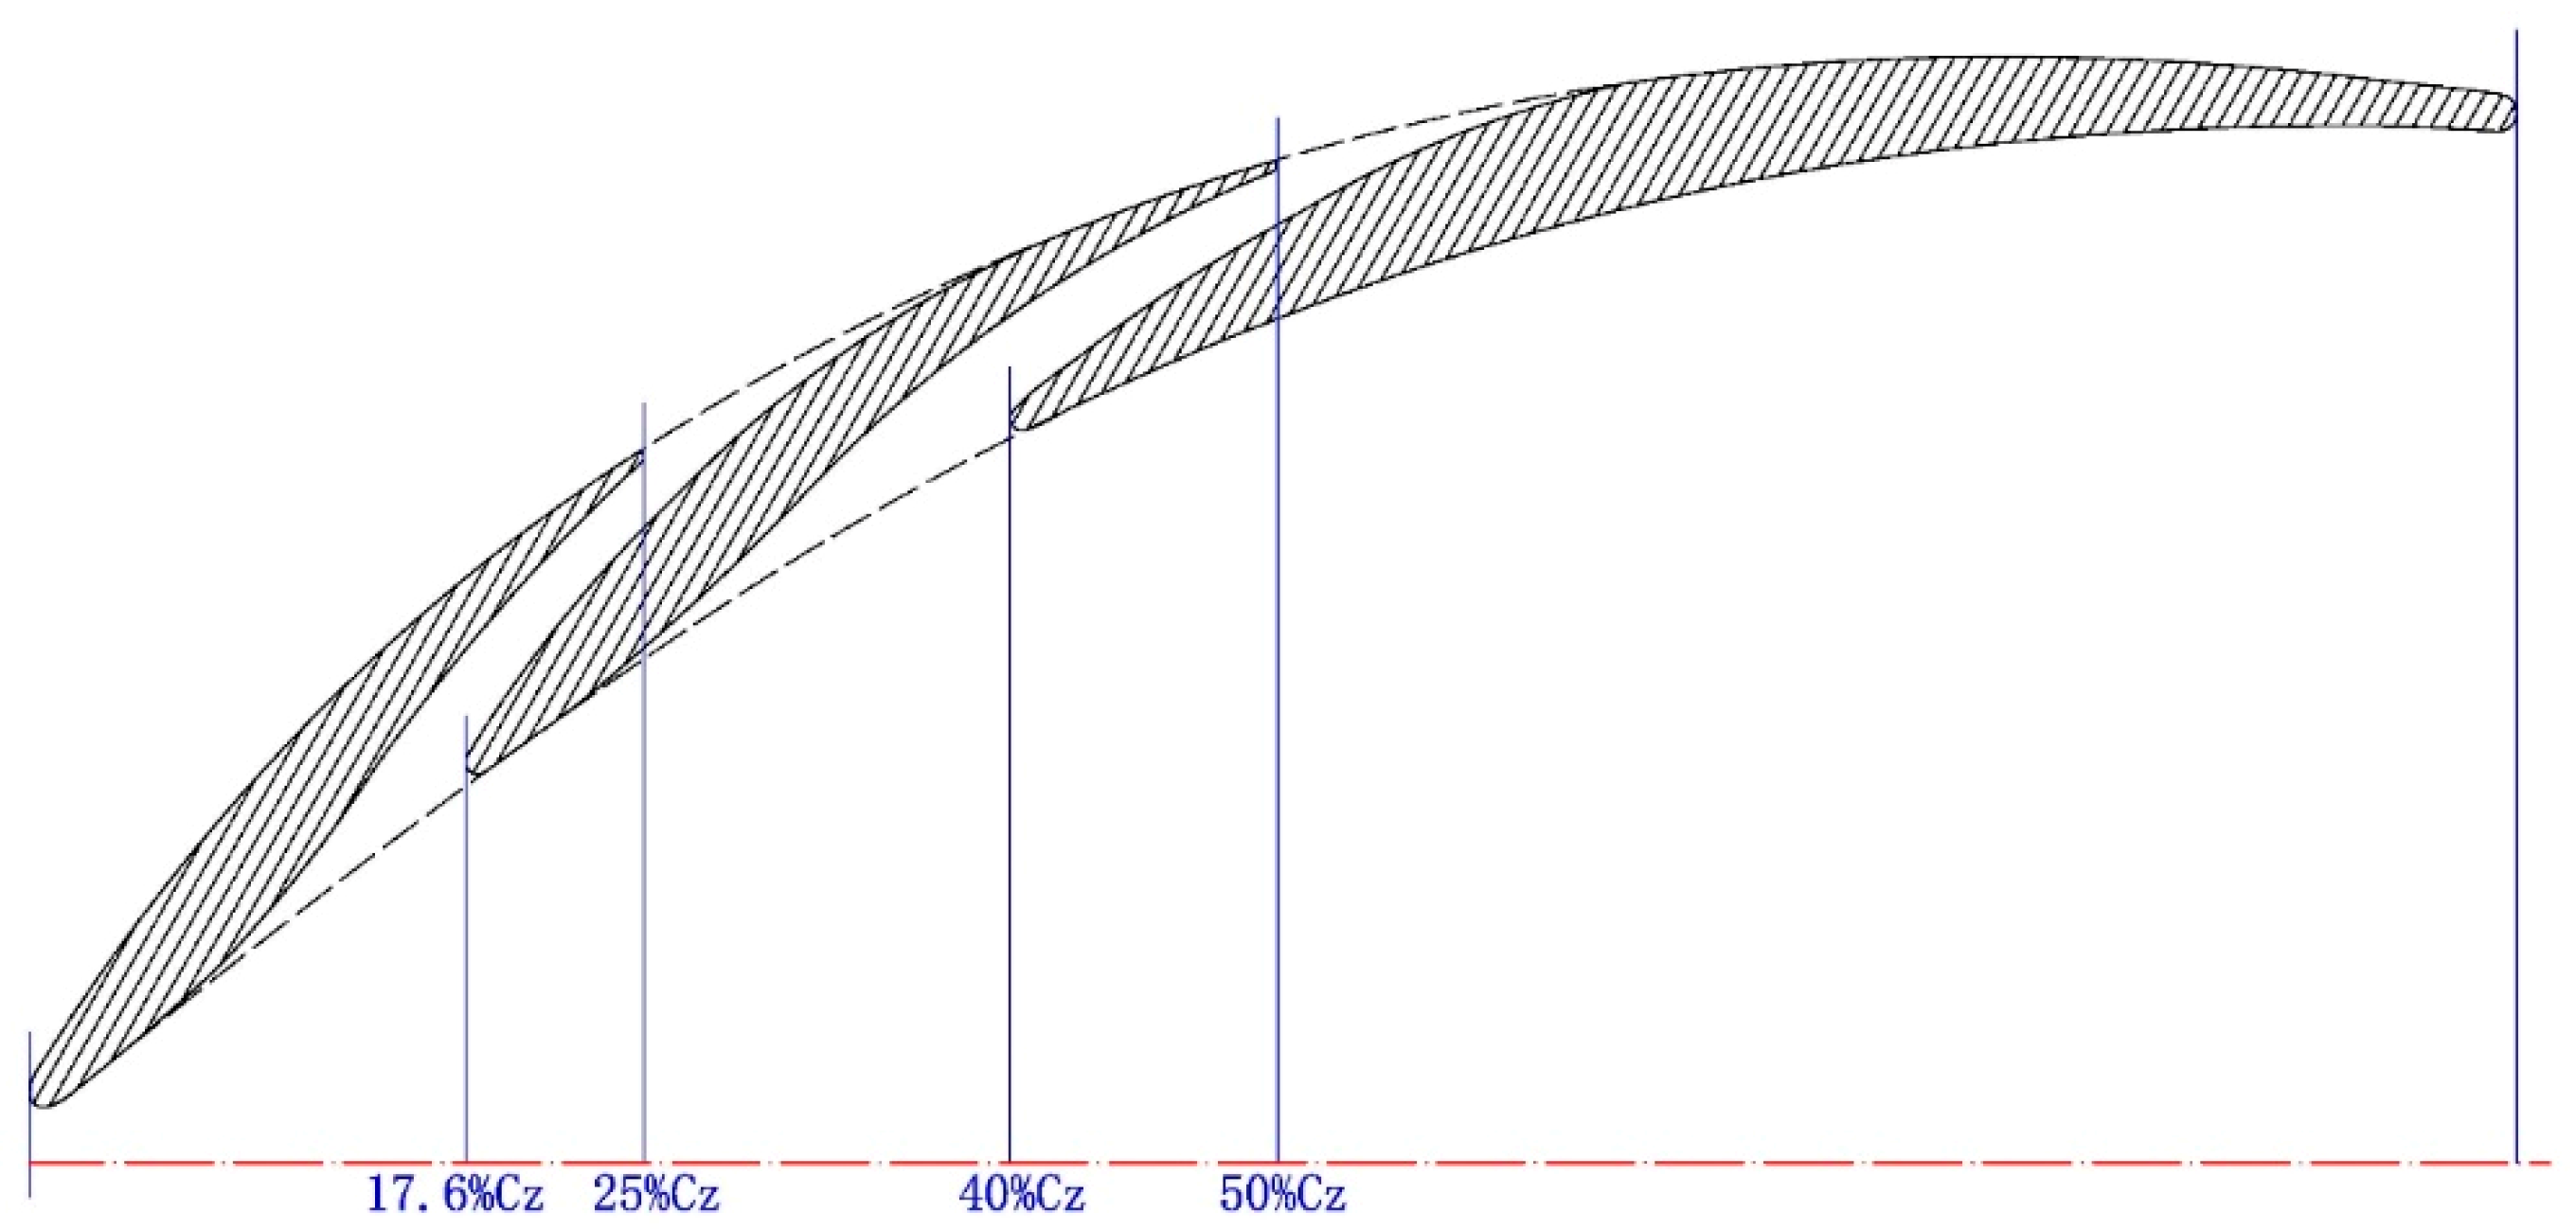
2.1. Blade Profile

Numerical investigations are conducted on the mid-height section of a highly loaded stator in a modern compressor. In our previous research, a linear compressor cascade using the same blade profile has been numerically and experimentally studied on corner separation control for both the datum blade and the blade with blade end slots [29,30,31]. Table 1 lists the geometrical parameters of the datum profile. The high turning that approaches 53 degrees is representative of the high loading design.
The objective of the previous studies aimed to validate the effect of the blade end slots to suppress the three-dimensional (3D) corner separation [29,30]. The subsequent work compared the 3D blading with blade end slots and full-span slots [31], the purpose of which also lay on the control of the corner separation flow. The current research aims at investigating the Mach number effects on the 2D profile properties; thus, the performance for both datum and slotted profiles corresponding to the previous study are evaluated. The slotted profile is cut off from the slotted part of the end-slotted blade that was experimentally tested previously [29,30]. Figure 1 illustrates the geometry for the cross section of the end-slotted blade. The dashed line depicts the datum blade, and the regions covered with section line represent the slotted profile. More details for the slotting design are available in reference [30]. The design philosophy of the slot is quite different from the prior works. The outlet of the slot is placed prior to the separation (considering the endwall flow). The slot is designed to be contracted with its throat located approaching the slot outlet. Small ratios of the slot throat width to the slot exit curvature that promote the Coanda effect are chosen to enhance the attachment of the flow at the slot exit region. Additionally, the employment of befitting axial overlap is also favoured for better guiding of the slot-out-jet. Although the slotted profile is designed for the blade end region, it is still worth evaluating its profile loss and determining the underlying mechanisms.

2.2. Computational Details

Steady CFD simulations are conducted using Fluent software, which has been experimentally validated in our previous studies [31,38]. The baseline blade investigated is cut off from a middle stage stator of the compressor rear stage, the design Mach number of which is 0.5884. To investigate Mach number effects, Mach numbers of 0.4, 0.5, 0.5884, 0.7 and 0.8, with a wide incidence range covering −10° to 8°, are considered.
The SST turbulence model is known as a relatively robust and accurate two-equation eddy-viscosity turbulence model to predict aeronautical flows [39]. To investigate the 3D corner separation in a linear cascade with this same blade profile, the SST model has been modified using helicity to account for energy backscatter in our previous study [38]. Validations shows that the modified SST-Helicity model could significantly improve predicting accuracy for the core separation region [31,38], and it also demonstrated that the model could predict 2D flow (such as mid-span section) well. The SST-Helicity model degenerate into SST model when predicting the 2D flow, thus the SST model is used in the current research to predict the 2D flow field of both datum and slotted profile.
In the simulation, single blade passage is employed due to the periodicity, and the translational periodic boundary condition is used in the pitchwise direction. The variation in Mach number is achieved by automatching the target mass flow rate; thus, 3 % c in span height is chosen with the translational periodic boundary condition used in the spanwise to make the span height infinite. The structured multi-block O4H grid is used for both datum and slotted profiles, and modifications are only made in the O-mesh region to make the simulation more comparative. Three individual O-mesh blocks are inserted into the original O-mesh zone for the three aerofoil elements in the slotted part. The distribution of the 2D grid section remains the same as for the investigation in reference [31]. The final grid counts is approximately 197 thousand for the datum profile, and 298 thousand for the slotted profile. For the grid of the slotted profile, refinements are made in both the slotted region and the region downstream of the slot outlet.
The finite volume technique is used, and both convective and diffusive fluxes, are discretized by the second-order upwind scheme. The turbulence intensity is specified to be the same as the experiments with a value of 2%. An ideal gas is assumed, and the molecular viscosity is calculated based on Sutherland’s viscosity law.

3. Mach Number Effects on Performance and Deficit Thickness

3.1. Mach Number Effects on Total Pressure Loss and Loading

3.1.1. Total Pressure Loss

There are many approaches to estimate loss for turbomachinery flow. The total pressure loss coefficient is the most commonly used one. It is defined as
Y p = p 0 , 1 p 0 p 0 , 1 p 1
where the subscript 0 represents the stagnation pressure, and the subscript 1 stands for the inlet value of the computational domain.
To depict the effects of Mach number on loss, Figure 2 contours the mass-averaged total pressure loss coefficient at the position 60 % c length downstream of the profile trailing edge. Regions in blue depict that relatively low loss is obtained by the corresponding operating conditions. Regions in red indicate the high-risk operating conditions that should be avoided in the routine design. Figure 2a reflects that the relatively low loss range is wide under low Mach number conditions for the datum profile. With an increase of Mach number the range for the blue regions is reduced sharply. The high-loss region (filled in red) occupies a small negative incidence under Mach numbers above 0.7. With an increase in Mach number, the total pressure loss coefficient increases more rapidly under negative incidence angles compared to that under positive incidence angles. Compared with Figure 2a, Figure 2b reflects that the employment of slots alters the low loss operating range. Clearly, the relatively low loss range is broadened in all of the Mach number conditions tested, and the low loss region moves towards the positive incidence range. Low loss under positive incidence conditions contributes to achieving better aerodynamic performance. The lowest loss is obtained ranging from the incidence angle of 0° and 2°, covering Mach numbers of 0.5 to 0.7. Contrary to the datum profile, the increased Mach number makes the total pressure loss coefficient increase more progressively in negative incidence angles than in positive incidence angles for the slotted profile. The high-risk region (filled in red) nearly remains, whereas the white region (with a moderate level of loss) is significantly reduced, particularly under positive incidence angle conditions.

3.1.2. Loading Abilities

The de Haller number and local diffusion factor ( D l o c ) are the common diffusion parameters used in the compressor routine design. To obtain the de Haller number, the blade inlet and outlet velocities are required, and the D l o c demands the velocity distribution of the blade suction surface. Although both the de Haller number and D l o c measures the pressure rise ability, they fail in adequately exposing the aerodynamic difficulties of achieving it. Lieblein [40] developed the most commonly used measurement for loading, termed diffusion factor (DF), in 1953, by evaluating the adverse pressure gradient experienced by the blade suction surface boundary layer. The DF is correlated with D l o c , and straightforwardly associated with velocity triangles and solidity. All these loading parameters read as
d e   H a l l e r = V 2 V 1
D l o c = V S S , m a x V T E V S S , m a x
D F = 1 V 2 V 1 + Δ V θ 2 σ V 1
V 1 and V 2 are the average velocities into and out of a blade row, Δ V θ is the change in whirl velocity in the row, and σ is the solidity of the profile row.
All these parameters depict the diffusion achieved by the aerofoil. However, aerodynamic failure could arise under high DF conditions. D l o c more directly reflects the real working capacity of the blade, although one drawback for resolving D l o c is that the velocity on the wall is zero under the no-slip wall boundary conditions with the viscosity considered. The static pressure distribution can be employed as a replacement, whereas, the ‘suction peak’ may disappear under large positive incidence angles. Thus, another quantity, the Zweifel loading coefficient, is employed to evaluate the real loading that the blade experienced. The Zweifel loading coefficient is defined as
Ψ = 0 1 ( p p s p s s ) d ( z / c z ) p 01 p 1
p p s stands for the pressure along the profile pressure surface, and p s s stands for the pressure along the profile suction surface. p 01 is the total pressure into the blade row, and p 1 is the static pressure into the blade row.
Here, the DF is employed to evaluate the diffusion capacity of the configuration, and the Zweifel loading coefficient is used to measure the real loading that suffered by the profile. Figure 3 compares the DF and Zweifel loading coefficient for the datum and slotted profiles varying with incidence angles under different Mach number conditions. The high-risk operating conditions are excluded. Theoretically, the loading that was experienced by the profile is directly associated with the diffusion capacity; hence, a linear relationship is presumed between the DF and Zweifel loading coefficient. However, there appears to be a unimodal behaviour between DF and Zweifel loading coefficient under the same Mach number conditions. The Zweifel loading coefficient peaks are obtained at the incidence angle of –4° for the datum profile when the Mach number is less than 0.7; and it improves to −1.69° for the slotted profile. The slotted profile obtains extensively higher diffusion abilities than the datum profile when the DF is over 0.5, and the ‘aerodynamic failure’ occurs relatively late for the slotted profile. At extremely high positive incidences, the ‘aerodynamic failure’ under different Mach number conditions shows a tendency to converge.
Obviously, the slotted profile could achieve higher DF than the datum profile when the same Zweifel loading is experienced in the tested operating conditions with the exception of small negative incidence angles under Mach numbers of 0.7. The Zweifel loading coefficient falls steeply for the datum profile (shown in full lines) under positive incidence angles, whereas it reduces gradually for the slotted profile (shown in dashed lines). The highest DF obtained in the extremely high incidence angle is concentrated in the region about 0.65 for the datum profile, and it improves to the range of 0.7 to 0.75 for the slotted profile. The slotted profile acts more effectively under the Mach number of 0.4, 0.5 and 0.5884. When the Mach number increases to 0.7, the loading abilities are reduced for both datum and slotted profiles. The slotted profile shows worse DF or Zweifel loading coefficient than the datum profile in the incidence range below −6° under Mach numbers of 0.7, whereas it dramatically reverses in the incidence range above −1.69°. There exists a loading limit for the slotted profile under Mach numbers of 0.7. When the DF for the slotted profile is over 0.75, it does not increase any longer with the further increase of incidence angles. Under Mach numbers of 0.8, a similar loading limit appears for the slotted profile, but it improves to DF = 0.8. The drop of Zweifel loading coefficient under positive incidence angles limits the increasing rate of DF, and the reduction occurs more gradually for the slotted profile. In general, the slotted profile enables a higher DF to be obtained when experiencing the same blade loading.

3.2. Evolution of Deficit Thickness

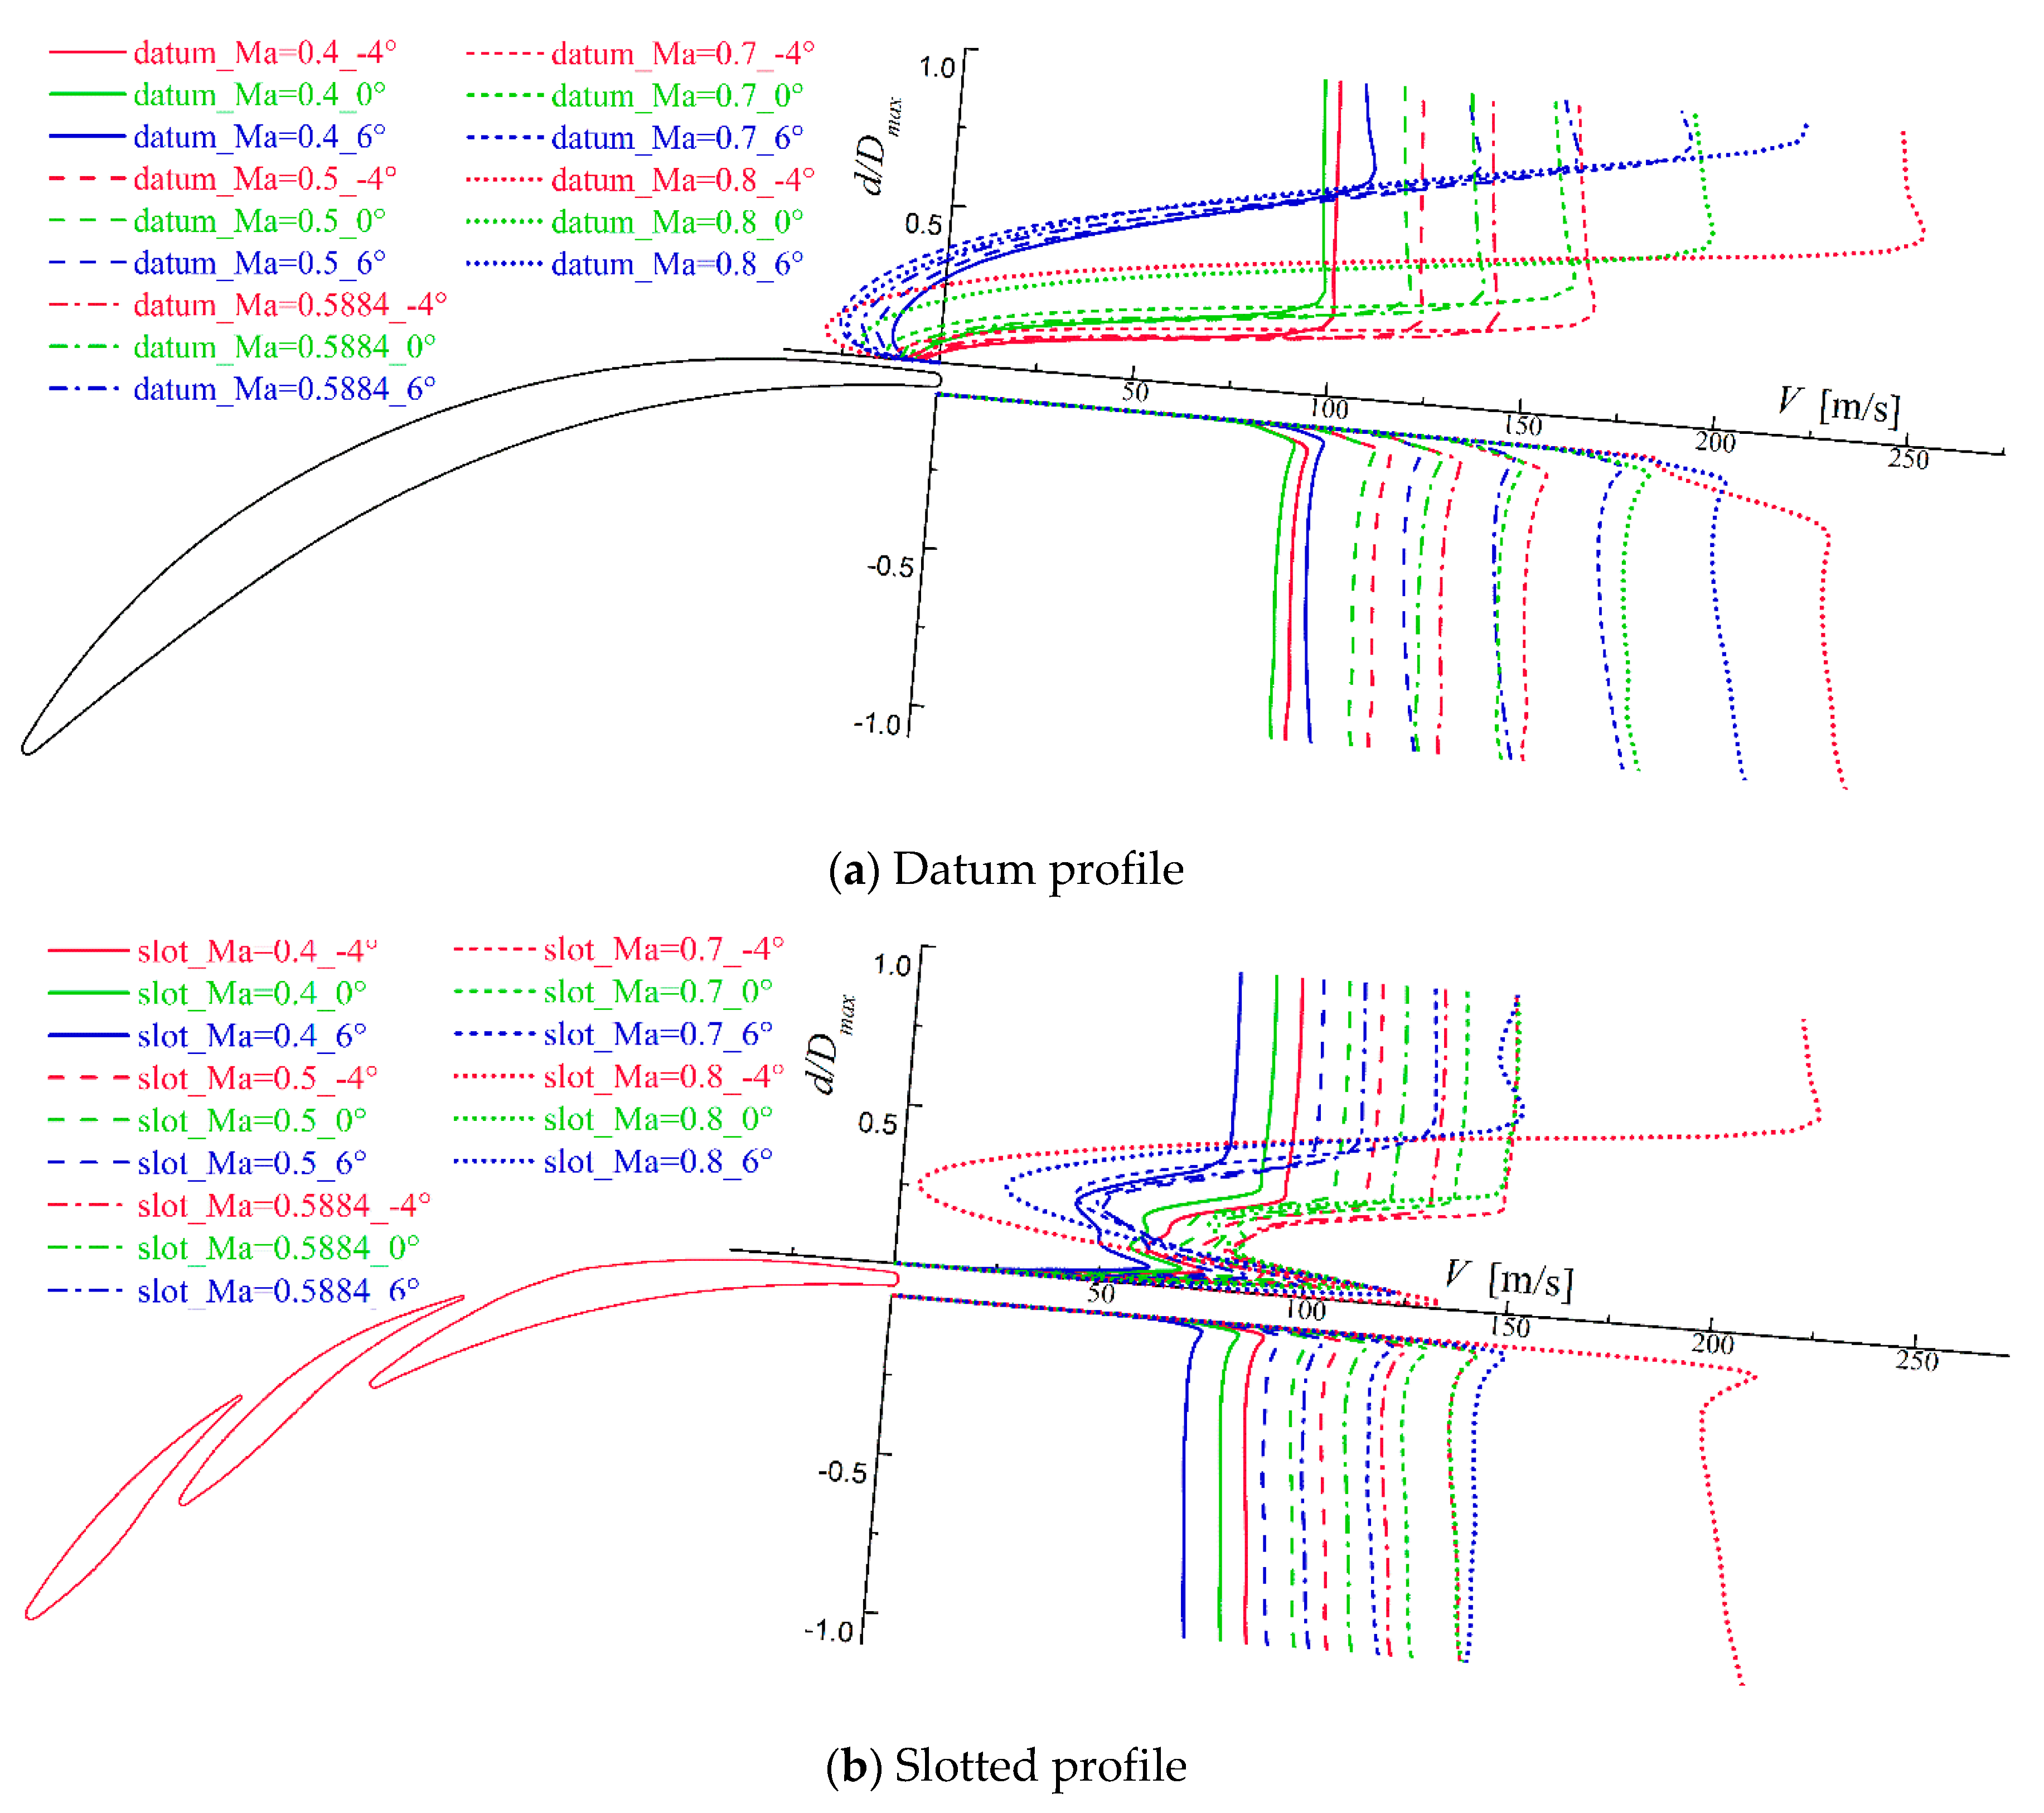
3.2.1. Velocity Distribution at the Trailing Edge

In real turbomachinery flows, the limited space as well as the extremely strong shear, high adverse pressure gradient, and unsteadiness, make it difficult to generate a pure boundary layer as the plate flows. Because separation is a key characteristics of compressor flow, the flow mechanism for a compressor blade is far more complex than the conclusions drawn by the plate boundary layer flow investigations.
Figure 4 plots the velocity distribution at the profile trailing edge varying with Mach number at some typical incidence angles. The velocity along the line perpendicular to the profile trailing edge is extracted. Figure 4a provides the datum results and Figure 4b gives the slotted results. Velocity distribution on the suction side (SS) is more sensitive to the variation of incidences and incoming flow Mach number. In contrast, the velocity distribution on the pressure side (PS) nearly remains the same shape despite the velocity magnitude for the main flow.
Seen from Figure 4a, a C-shape velocity distribution is obtained for the datum profile on the SS with the appearance of negative velocity magnitude near the wall bound. For the flow near the wall bound of the profile, a friction force is experienced by the effect of wall shear, whereas the main flow provides the driving force to the flow near the wall bound on the other side. The combination of the driving force from the main flow and the friction force from wall shear makes the boundary layer accumulated more thickly in the downstream development. For the plate, the velocity within the boundary layer is always positive, and the reverse flow cannot occur. In contrast, the existence of the curve makes the boundary layer properties of the blade profile far more complex than the plate flow. The diffusion tunnel determined by the blade profile generates a differential pressure force opposite to the main flow. The wall friction force and the differential pressure force lead to the flow near the wall to decelerate. When the velocity of the boundary layer fluid reduces to near zero, the wall friction force reduces, whereas the differential pressure force remains. The adverse pressure gradient makes the flow near the wall reverse. The reversed flow meets with the downstream flow, then moves away from the boundary wall, leading to the lift off of the boundary layer flow. Thus, the reverse flow at the trailing edge results in negative velocity distribution on the SS. The incidence angle of −4º is extracted as the typical negative incidence. At this angle, a small reverse flow region appears under incoming Mach numbers of 0.4, 0.5, 0.5884, and 0.7, whereas bulk separation occurs when the incoming flow Mach number increases to 0.8. With an increase of incidence angles, the flow trends to more easily separate. The boundary bound of the separated region thickens at the incidence angle of 0°, and the reverse flow region enlarges for the Mach number of 0.8. At the incidence angle of 6°, bulk reverse flow occurs for the datum profile under all Mach numbers tested.
As reflected by Figure 4b, the slotted profile alters the velocity distribution at the trailing edge and produces a more uniform exit flow field. Compared to Figure 4a, the proportion of the main flow region is significantly enlarged by the slotted profile, with lower main flow velocities obtained under relatively larger incidence angles. The slotted profile splits the total turning into multi-part, and the rear elements possess a refreshed boundary layer. This layer contributes to diminishing the accumulated thick boundary layer, and the newly developed boundary layer possesses better ability to resist the adverse pressure gradient. The flow that goes into the slot inlet can be regarded as being similar to the incoming flow, and the slot outlets share approximate static pressure with the local fluid outside the slot outlet region. Thus, the slot-out-jet is self-adaptive. The velocity of the jet is approaching or slightly larger than the local main flow velocity in the blade tunnel near the slot outlet. Additionally, the mass flow rate of the jet flow is also automatically determined by the pressure differential. Because the fluid within the slots suffers less loss than the local fluid in the blade passage near the slot outlet, the self-adaptive jet has a higher momentum than the local low momentum fluid. Figure 4b reflects that the slot-out-jet shares a similar velocity magnitude with the main flow. These self-adaptive jet could reenergize the local low momentum flow, gaining its abilities to resist the adverse pressure gradient, and bringing it downstream, subsequently preventing the accumulation of the low momentum fluid at the blade aft. Compared with the datum profile, the pitchwise extent of the low momentum fluid is extensively reduced. The C-shaped velocity distribution lifts off from the wall due to the jet, and the reverse flow is avoided. The employment of the slots impairs the wall friction that acted on the low momentum boundary flow downstream of the slot outlet and acts as a down flow traction. This traction goes against the differential pressure force in the SS, thus delaying the occurrence of separation.
Additionally, due to the fact that the jet out of the slot is self-adaptive, exaggerative mixing loss would be avoided in comparison to the traditional active jet with fixed mass flow rate.

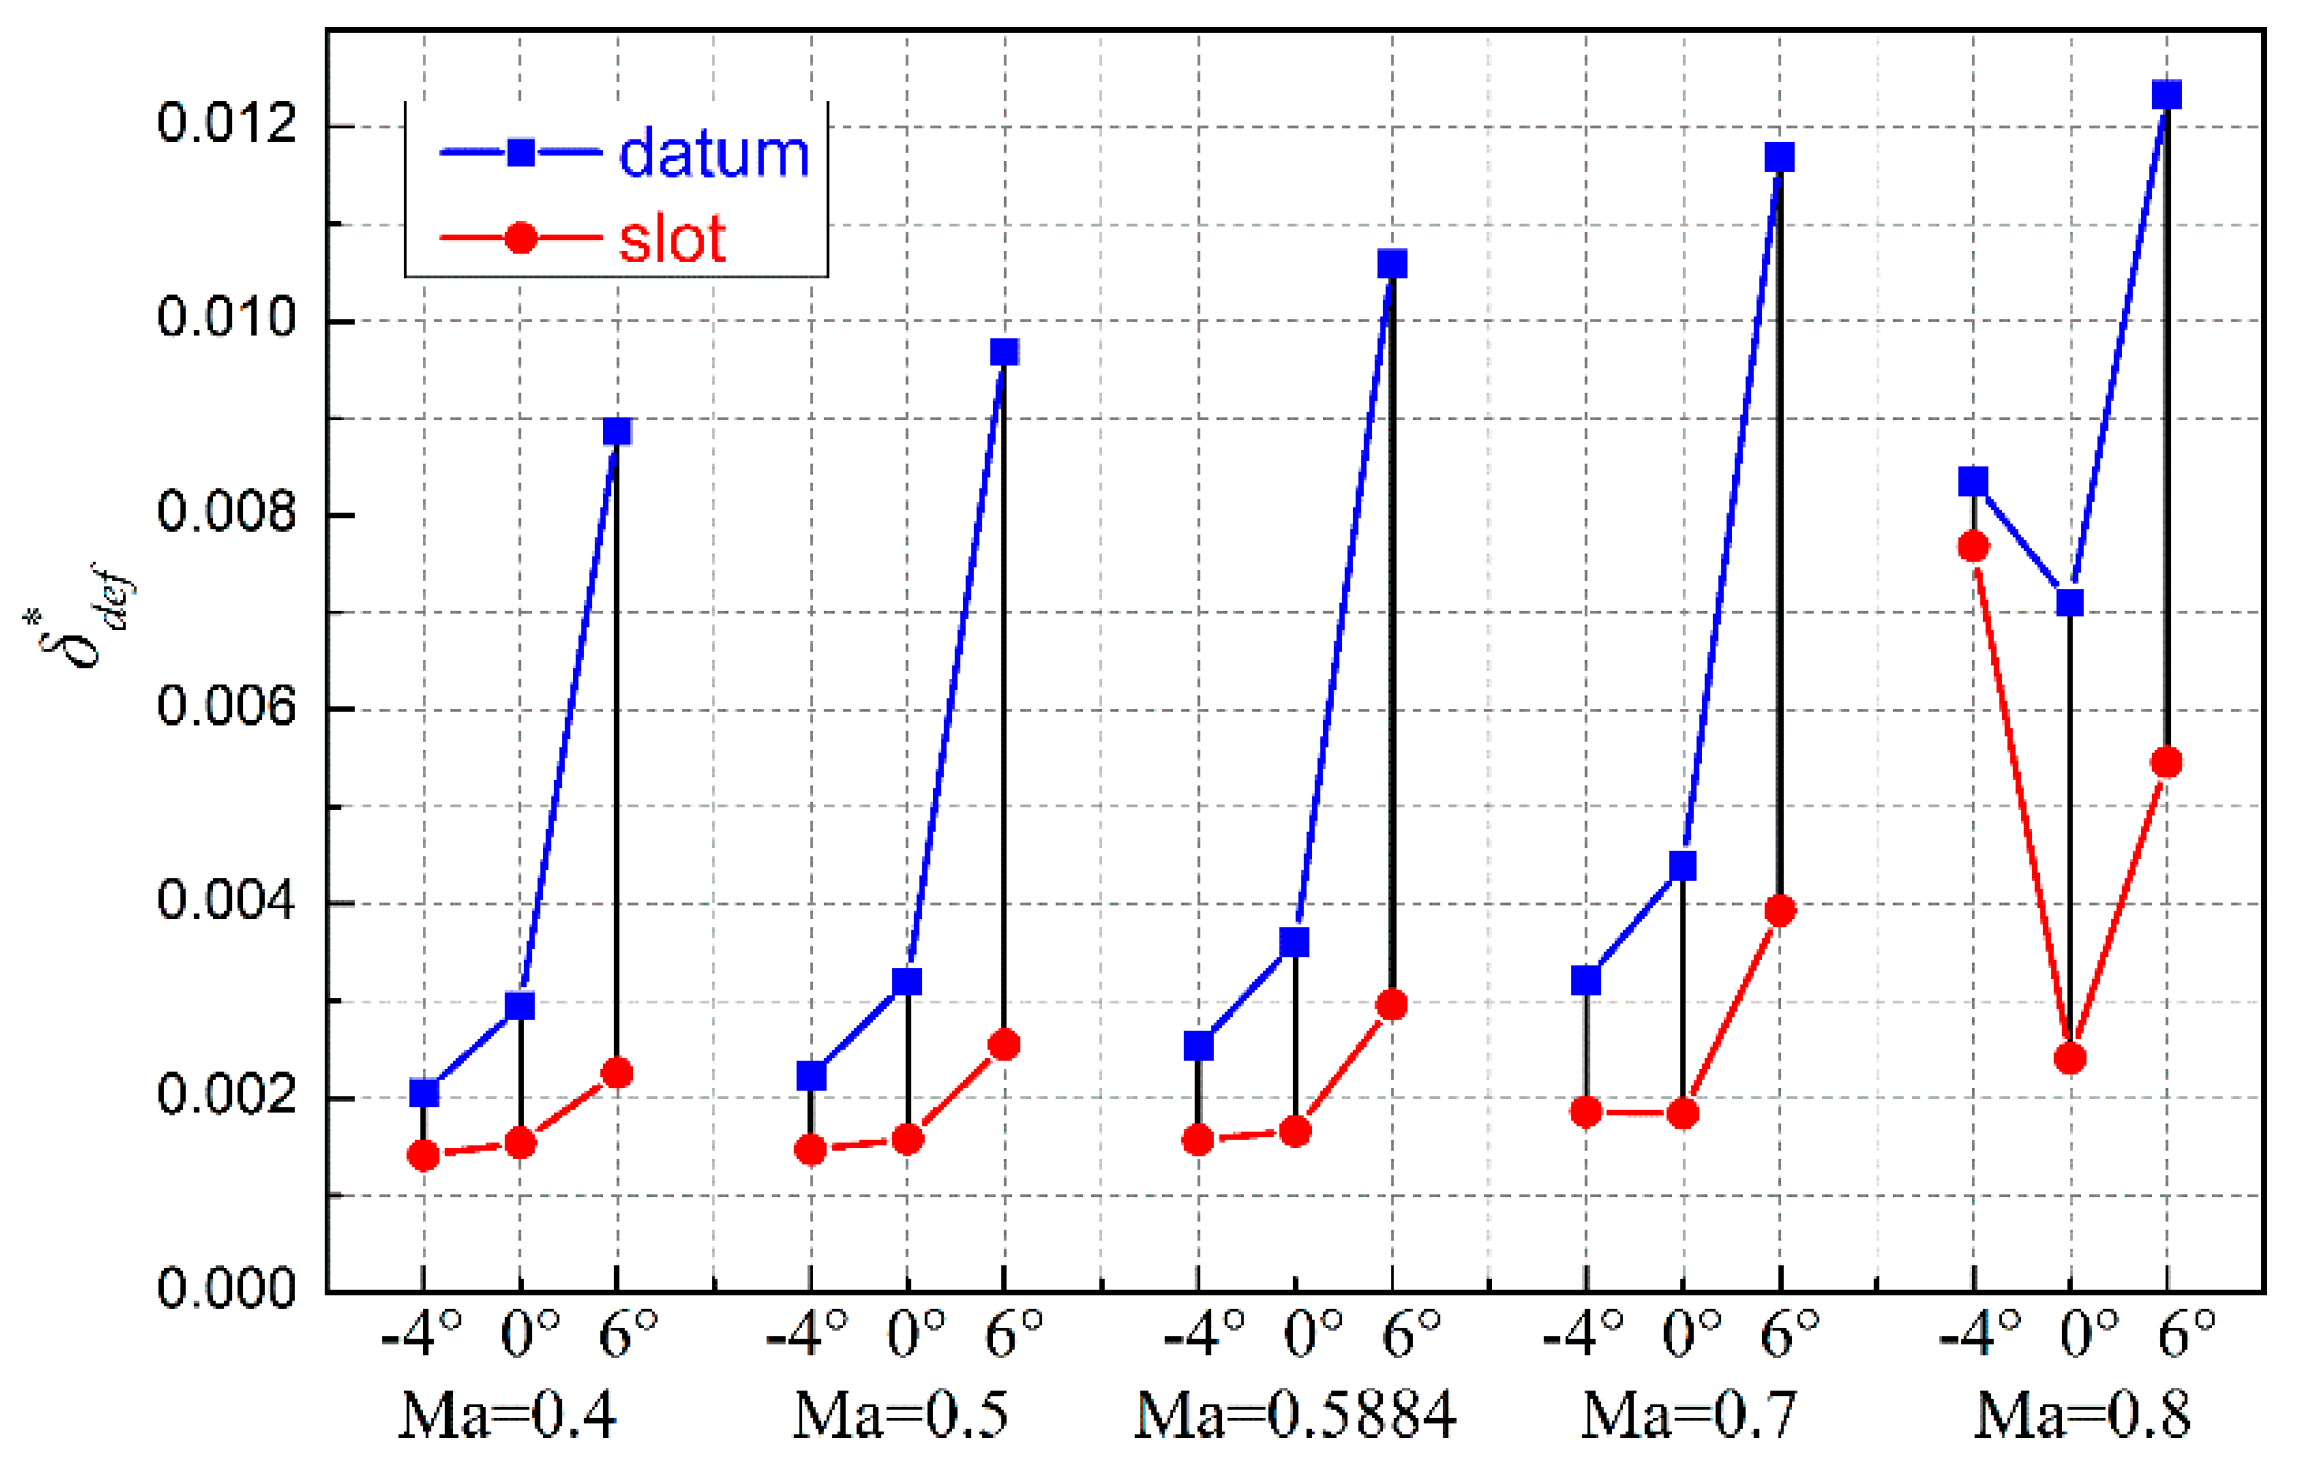
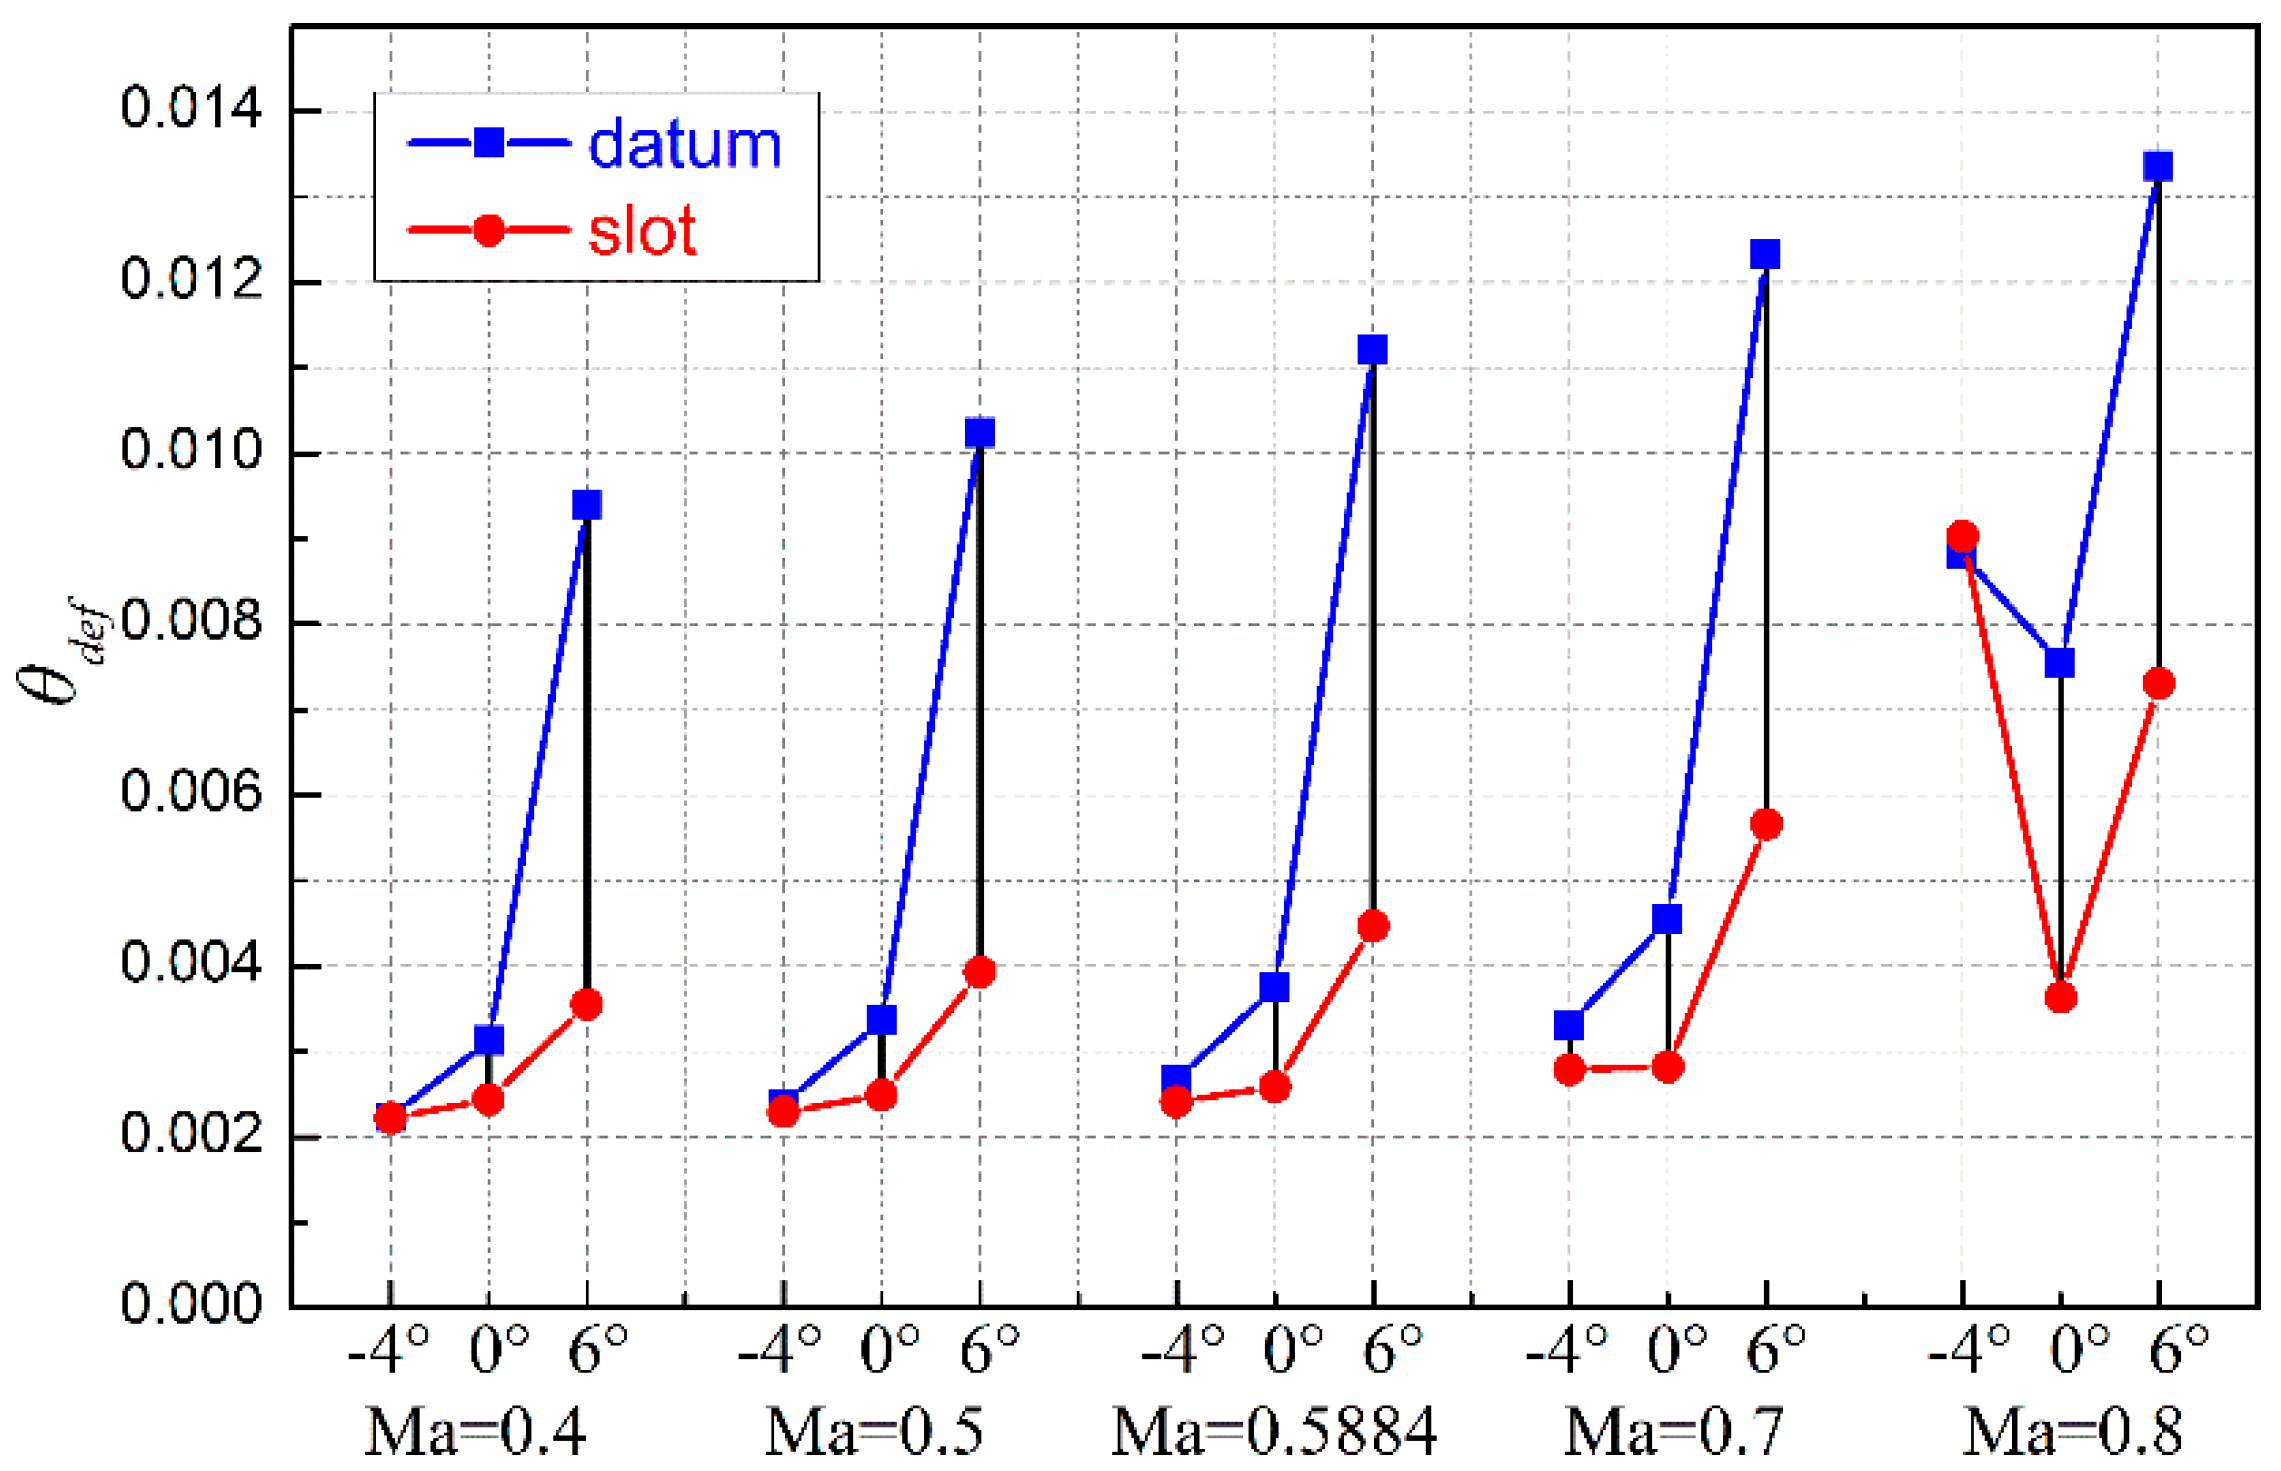
3.2.2. Deficit Thickness at the Trailing Edge

There are three kinds of quantitative estimations for the plate boundary layer flow, namely the boundary layer thickness, the boundary layer displacement thickness, and the boundary layer momentum thickness. The boundary layer thickness is obtained as the boundary that shares 0.99 times the velocity as the main flow. The boundary layer displacement thickness is defined in terms of volumetric flow rate, and the boundary layer momentum thickness is defined in terms of momentum flux. All these thickness concepts are defined for a thin boundary layer on a plate without curvature. There is no occurrence of reverse flow within or near the boundary layer. For the curved surface, such as the profile investigated in this study, the boundary layer structures are more complex, and the definition of three kinds of boundary layer thickness is no longer suitable for a separated boundary layer with reverse flow under an adverse pressure gradient. To quantify the separation effect within the blade tunnel, three kinds of deficit thickness are defined referencing to the boundary layer thickness for a plate. Similarly, the displacement thickness, δ d e f * , is used to evaluate the effect of separation on blockage. This parameter is also used by Gbadebo [41] to estimate the separation extent of the 3D corner separation in a linear compressor cascade. Analogically, the momentum deficit thickness, θ d e f , and the kinetic energy deficit thickness, δ d e f , are defined, to estimate the separation effect on momentum and kinetic energy, as well as their uniformity. These three kinds of deficit thickness within the blade tunnel take the following form:
δ d e f * = 0 t ( 1 ρ ( y ) v ( y ) ρ f s V f s ) d y
θ d e f = 0 t ( 1 ρ ( y ) | v ( y ) | v ( y ) ρ f s V f s 2 ) d y
δ d e f = 0 t ( 1 ρ ( y ) | v ( y ) | v 2 ( y ) ρ f s V f s 3 ) d y
The curvature and adverse pressure gradient effect makes it difficult to determine the main flow. The velocity distribution at the trailing edge (shown in Figure 4) reflects that the flow is maintained unseparated in the middle region of the blade tunnel. Thus, the velocity in the middle region of the blade tunnel is chosen as the free stream and represented by the subscript f s . The resolution of three kinds of deficit thickness is based on the free stream velocity magnitude obtained along the pitchwise. Considering that the separation in the PS is thin, the blockage and loss is mainly caused by the deficit in the SS. The deficit in the SS are resolved in the profile trailing edge, with y standing for the distance from the wall. The lower deficit thickness represents less deficit and more uniform distribution.
Figure 5 compares the displacement thickness at the profile trailing edge. Figure 5 shows that below a Mach number of 0.7 (including 0.7), the displacement thickness for the datum profile is low under a negative incidence angle of −4°. The displacement thickness increases with the incidence, and rises dramatically at an incidence angle of 6°, indicating the occurrence of bulk separation. At each incidence angle, the displacement thickness increases with Mach number. Under a Mach number of 0.8, the blockage at the negative incidence angle of −4° is also increased. Compared with datum profile, the slotted profile effectively decreases the blockage under all the conditions listed. The blockage in the SS is extensively reduced, particularly under a positive incidence angle of 6°.
As shown in Figure 6, the momentum deficit thickness shares a similar variation trend to the displacement thickness. At an incidence angle of −4°, the momentum deficit thickness nearly remains for the slotted profile in comparison to the datum profile. With an increase in incidence angle, the slotted profile results in much lower momentum deficit thickness, depicting that the momentum deficit caused by the separation in SS is effectively reduced by the slotted profile, and the flow uniformity in the SS is enhanced.
Figure 7 reflects that the slotted profile slightly increases the kinetic energy deficit thickness at a negative incidence angle of −4° below a Mach number of 0.7. The positive effect of the slot is shown at 0° and 6° incidence angles. The improvement of slotted profile on kinetic deficit thickness at positive incidence angle is much better than the deterioration under negative incidence angle.
Traditionally, it is difficult for a passive flow control method to achieve general applicability in a wide operating range. Most of the time, one optimized scheme functions well under a certain operating condition, whereas it deteriorates under another operating conditions. Contrary to the majority of passive flow control schemes, the proposed slotting scheme has been demonstrated to be self-adaptive regardless of the variation in Mach number and incidence angle. It suppresses the separation and improves the performance at positive incidence, and does not deteriorate much in negative incidence.

4. Effects of Deficit Thickness on Loading

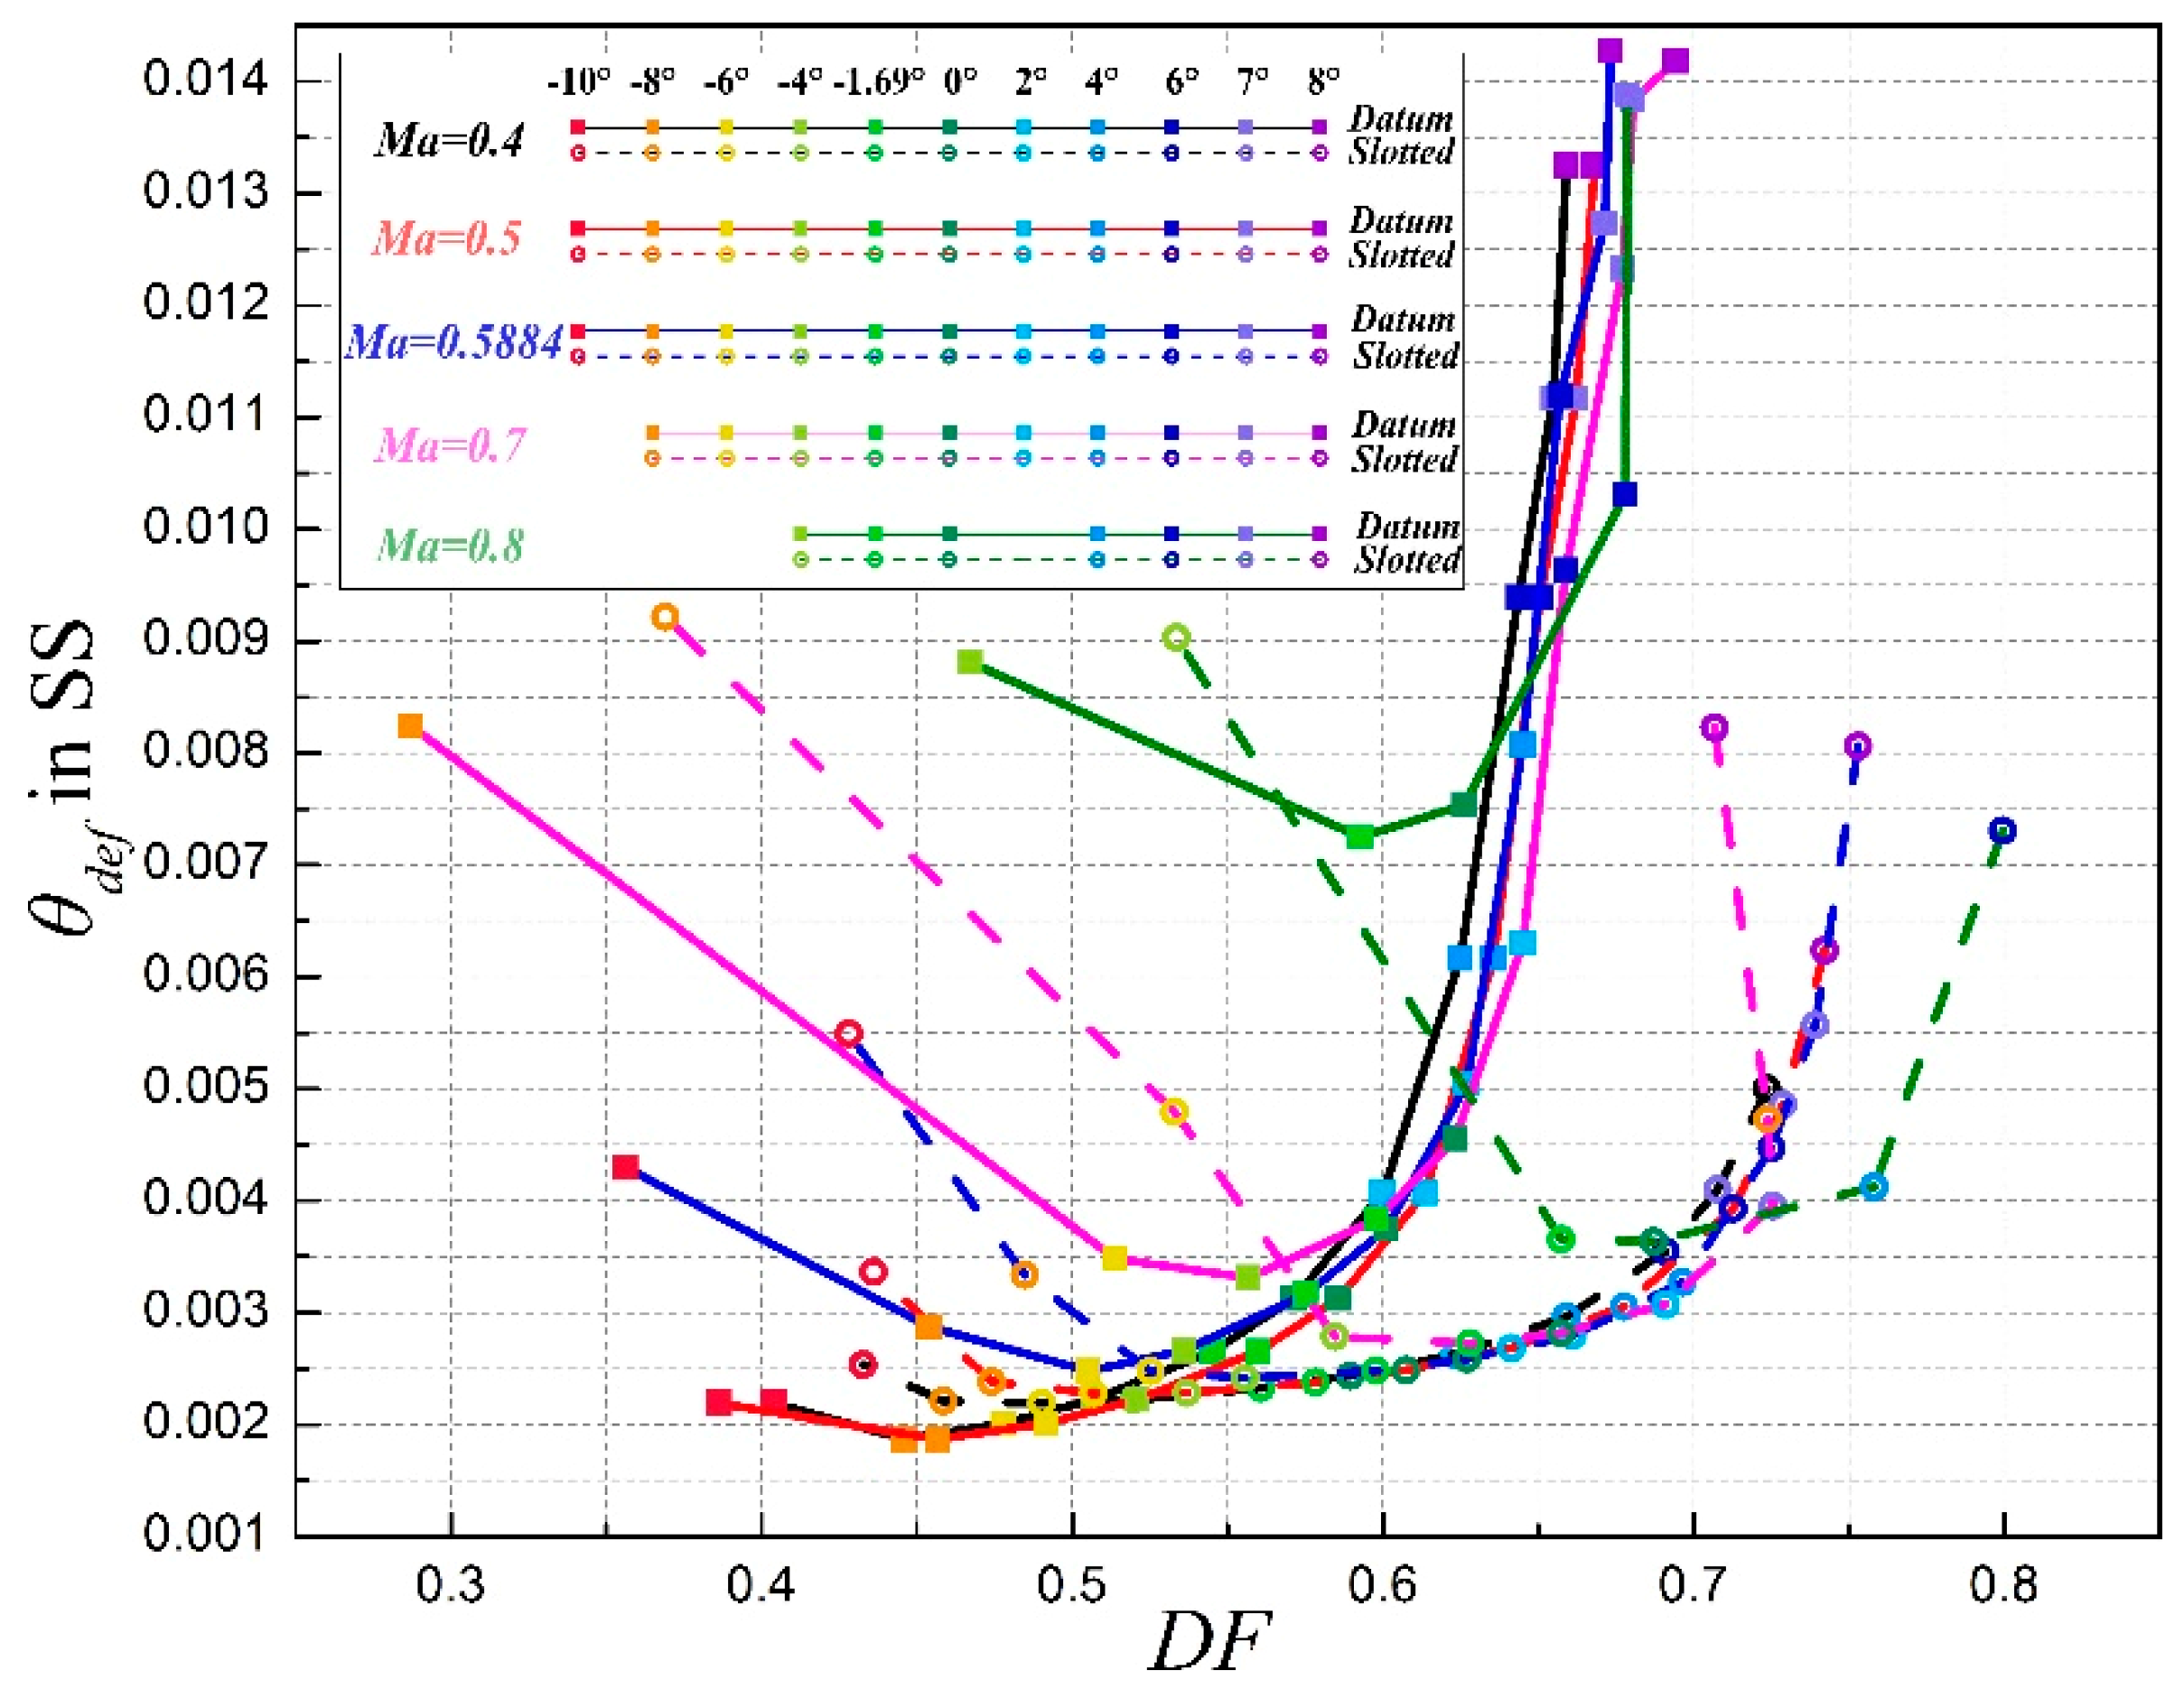
4.1. DF Varying with Momentum Deficit Thickness

Lieblein [40] demonstrated an almost unique correlation between profile loss and local diffusion through a measurement of the adverse pressure gradient applied to the suction surface boundary layer, known as the diffusion factor (DF). Over nearly seven decades, DF has been widely used in guiding the design of compressors. It is based on the principle that the profile losses are uniquely correlated with the local diffusion ability. In the current research, one question arises regarding whether the classical DF is still valid for modern high loading profiles with variation of Mach number. Another question is how the slotted profile impacts the trend of DF. To illustrate these points, the momentum deficit thickness in SS of the profile trailing edge varying with DF is depicted in Figure 8.
Figure 8 reflects that for the datum profile, the momentum deficit thickness increases with incidence angle except for the extremely small negative incidence angles of −10° and −8°. Above the DF value of 0.6, a sharp increase in momentum deficit thickness appears for the datum profile, and the DF keeps increasing slowly regardless of the bulk increase in momentum deficit. The variation of momentum deficit thickness to the DF under different Mach number conditions collapses onto an almost unique curve above the DF value of 0.6 for the datum profile. The DF fails to indicate the rapid increase in momentum deficit. For the slotted profile, the critical DF value, above which the sharp increase in momentum deficit occurs, moves from 0.6 to 0.7. Similar to the datum profile, the DF keeps rising slowly with the sharp increase in momentum deficit thickness. However, it is difficult to distinguish failure simply based on the DF value for a given geometry.
As a simplified empirical parameter, the DF is derived based on the boundary layer theory. However, the classical boundary layer theory is established for the plate boundary layer without streamwise pressure gradient. The separation in the SS near the trailing edge of the curved profile caused by the adverse pressure gradient within the compressors makes the flow complicated. Additionally, the derivation of DF is also based on the assumption that the distribution of the SS velocity must occur for the maximum velocity peak near the leading edge to the trailing edge velocity. However, the maximum velocity peak may disappear under large positive incidence angles. All of these factors make the DF only suitable for the flow around a profile without separation and under small incidence angles. When large reverse flow occurs under a positive incidence angle, the diffusion ability drops, whereas the slowly increased DF could not forecast the aerodynamic failure. It should be noted that the implementation of DF is not arbitrary for all conditions, and the higher DF value does not indicate a higher diffusion ability.
Comprehensively, the DF fails to adequately pick up the variation in momentum deficit of the profile as was its original intention with increasing incidence angle under high loadings. Thus, the large DF is not equal to the high loading that could be achieved. However, before the sharp increase of loss, the DF value could be considered in evaluating the loading, even for the slotted profile.

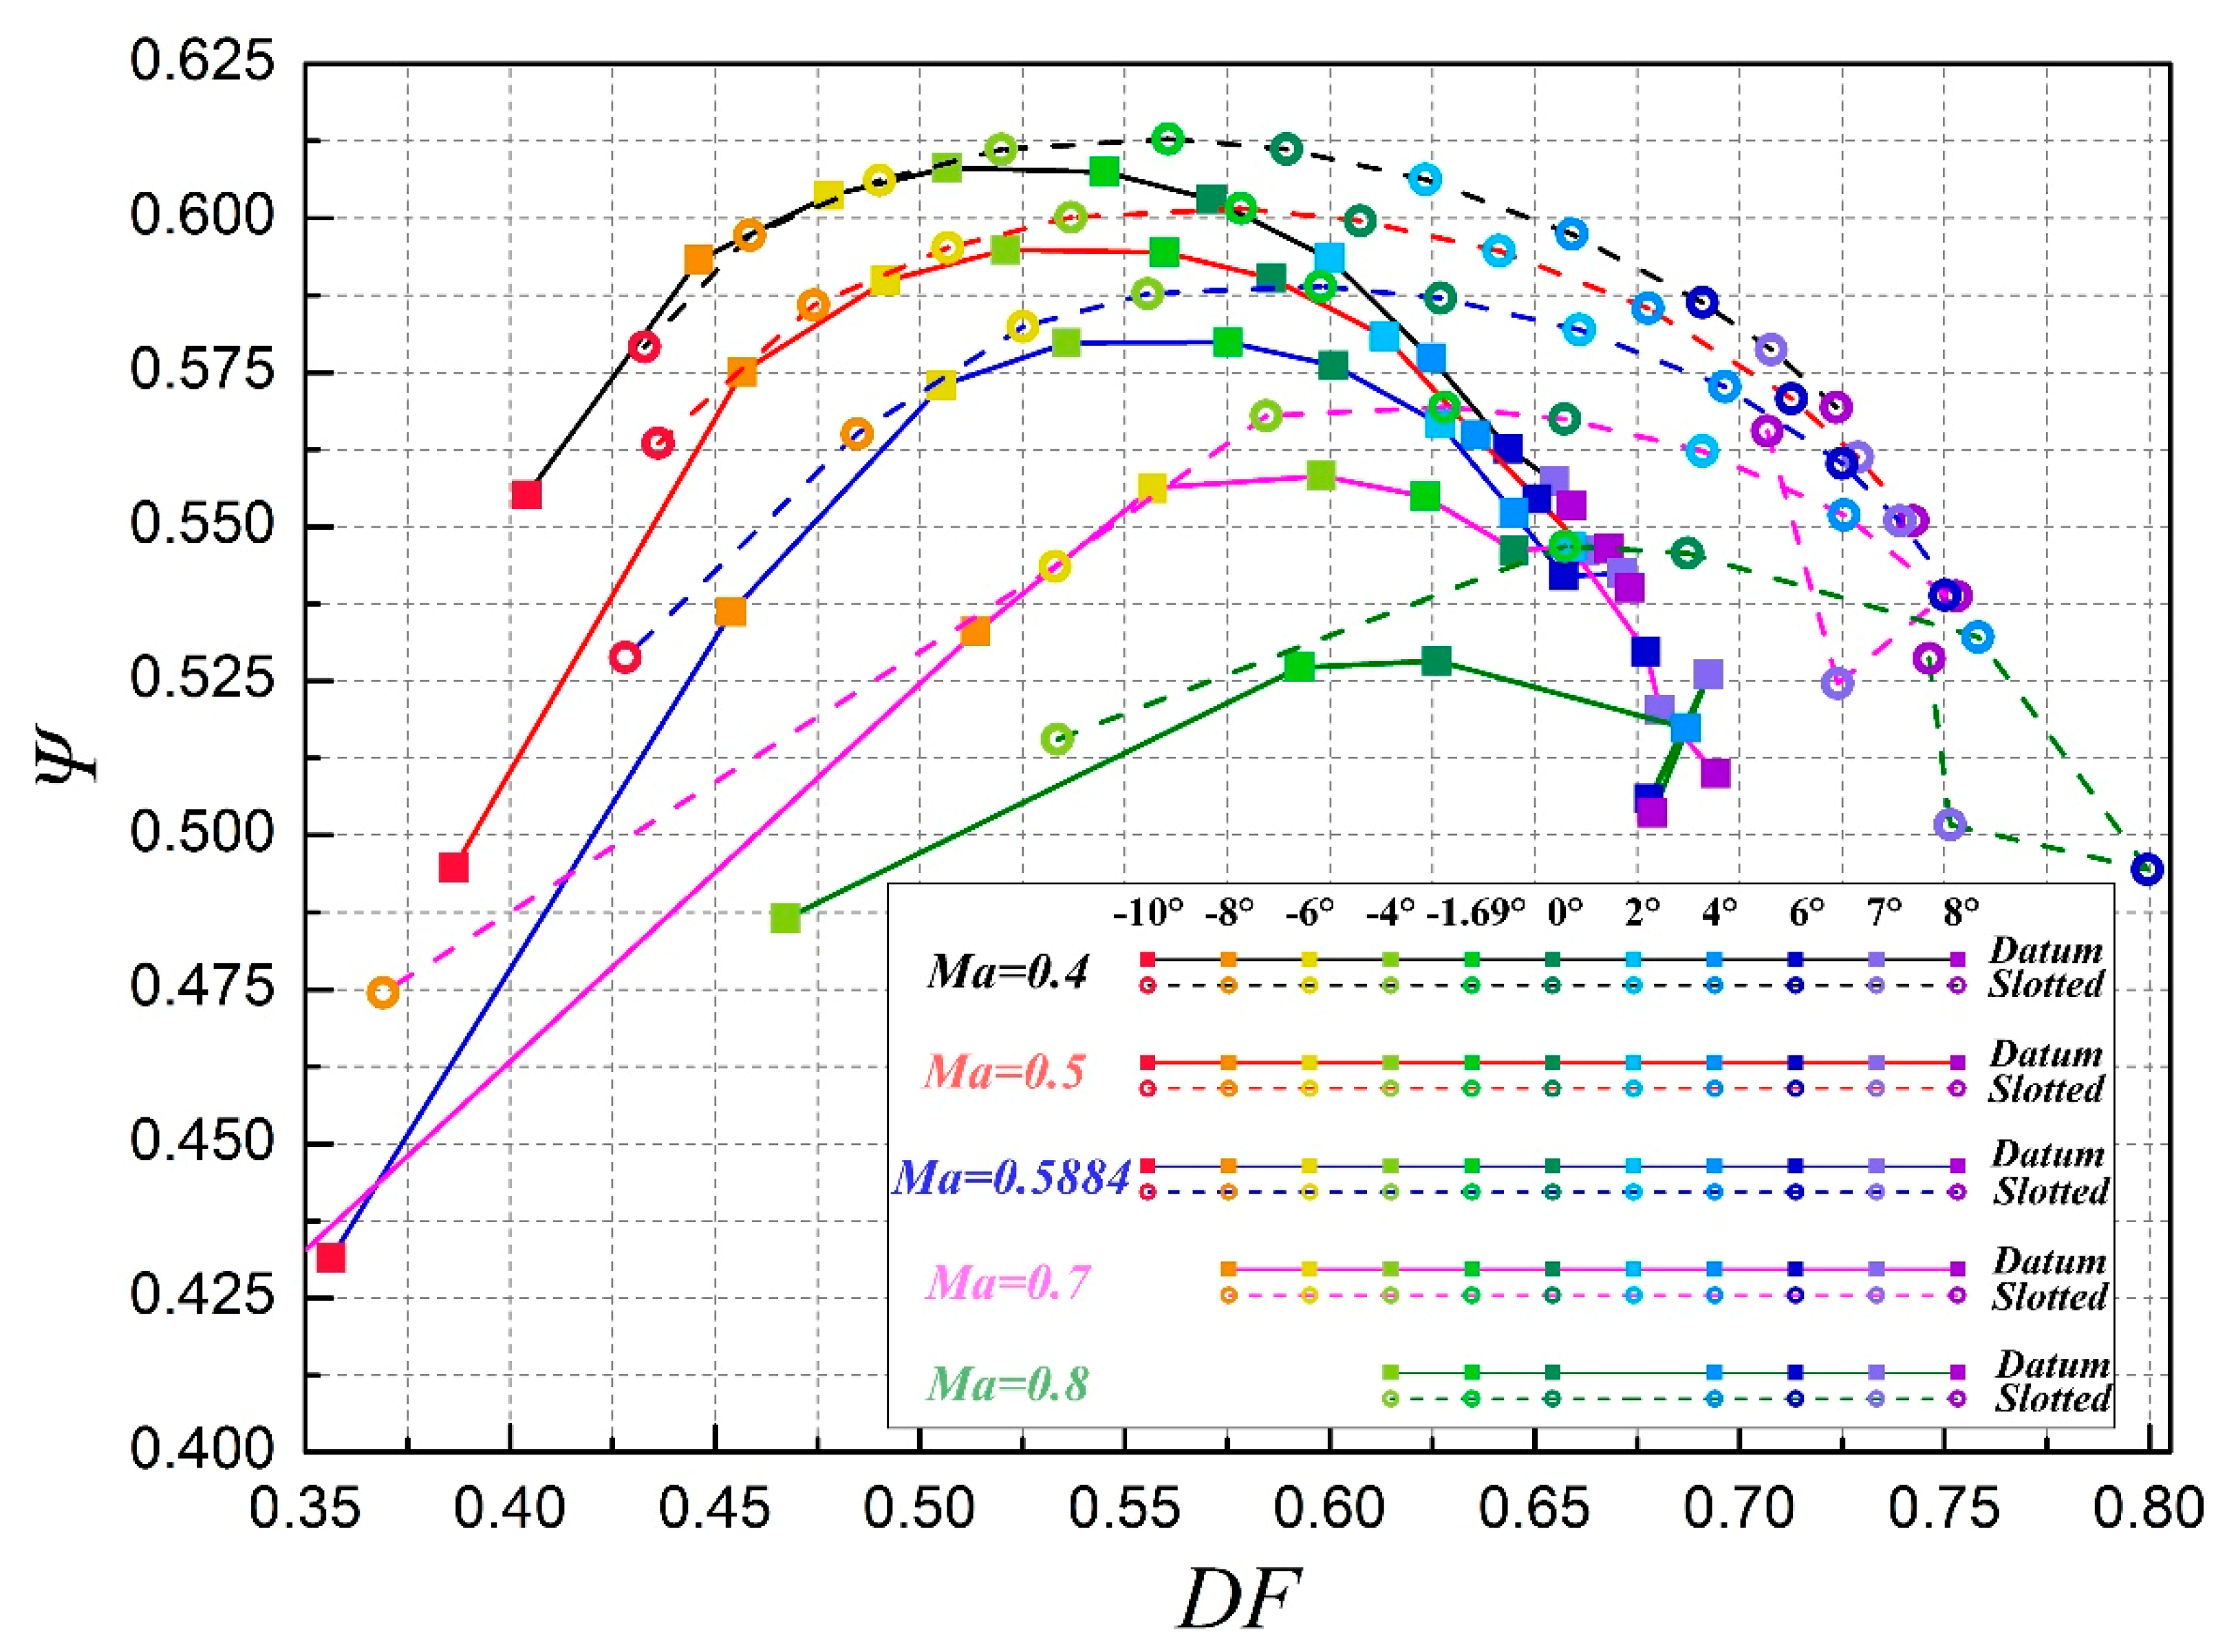
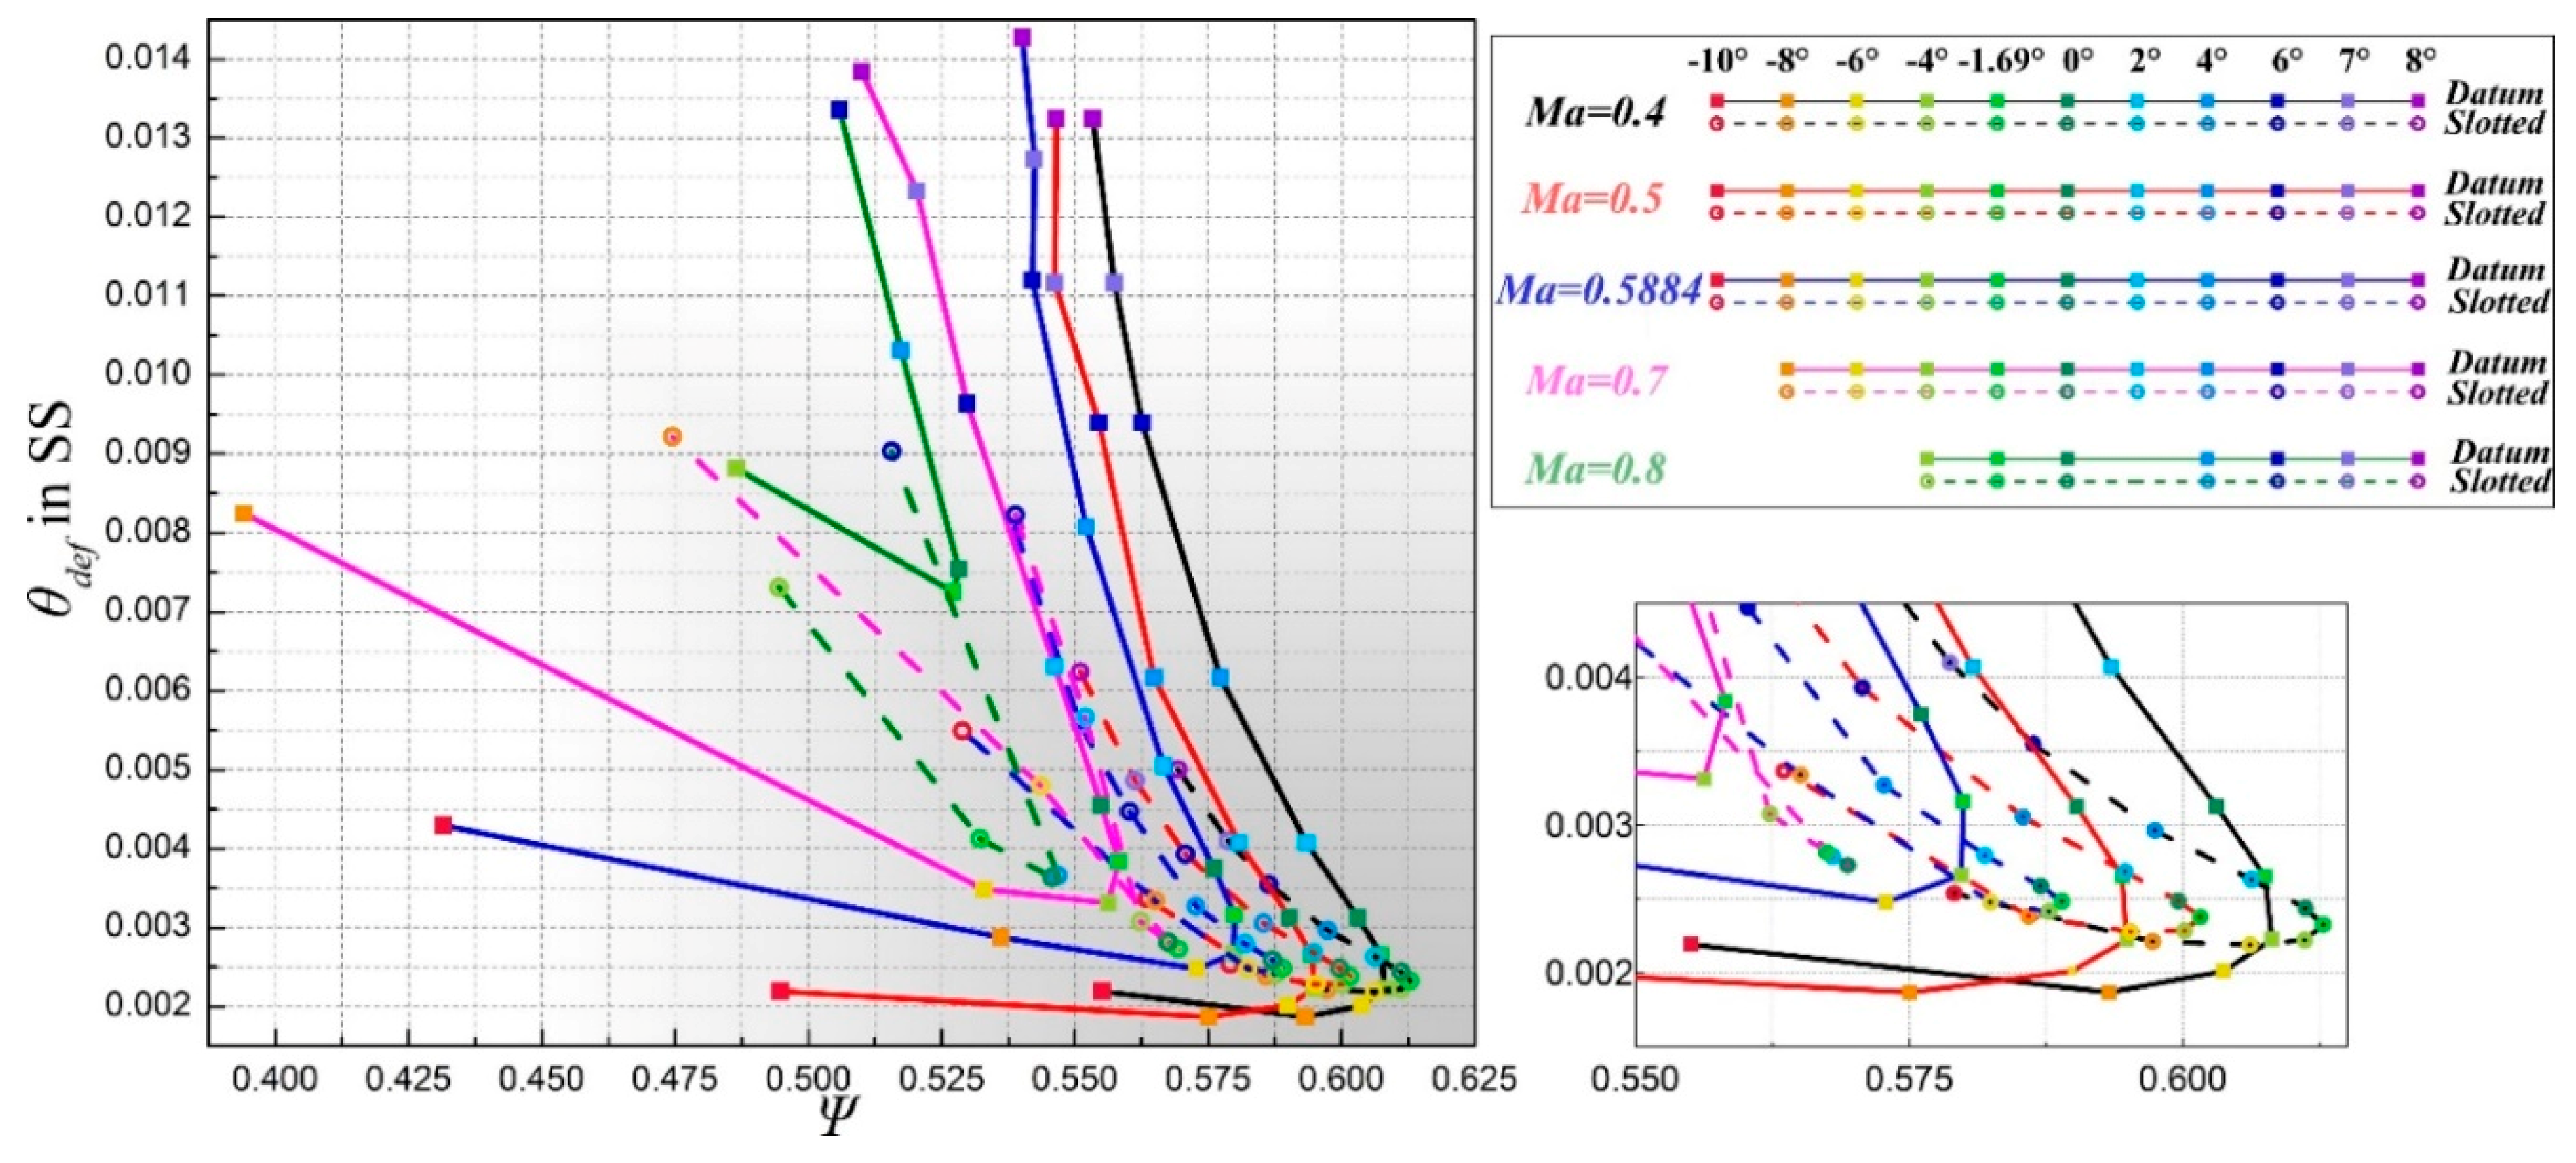
4.2. Zweifel Loading Coefficient Varying with Momentum Deficit Thickness

Because the DF fails to show a better correlation with the momentum deficit, another loading parameter, the Zweifel loading coefficient, is used to correct the loss to loading. Figure 9 depicts the momentum deficit thickness in SS of the profile trailing edge varying with the Zweifel loading coefficient. To improve clarity, the region that is concentrated with the majority of points is amplified.
Seen from Figure 9, a V-shaped distribution is obtained under each Mach number condition. The opening extent of the V-shape for the datum profile is larger than the slotted profile under the same Mach number conditions. A large Zweifel loading coefficient connects well with the low momentum deficit in the profile trailing edge. With an increase of Mach number, the peak of the V-shape moves towards a thicker momentum deficit thickness and lower Zweifel loading both for datum and slotted profiles. Under different Mach number conditions, the branches of the V-shape are nearly parallel to each other, indicating that the increasing rate of the momentum deficit in the SS to the Zweifel loading coefficient of the datum profile is undisturbed by the variation in Mach number.
The largest Zweifel loading coefficient does not meet with the lowest momentum deficit thickness, and the peak of the V-shape indicates the operating condition between the lowest momentum deficit and the largest Zweifel loading. Although the drop in Zweifel loading lags behind the increase in momentum deficit, it could correctly forecast the aerodynamic failure in diffusion ability caused by the high momentum deficit. Comprehensively, the peak of the V-shape could better suggest the design condition, under which the profile could achieve better performance both in loss and loading ability. A region that is near the V-shape peak could be chosen to extract the correct operating range. The light grey in the background of Figure 9 contours the region with high performance—the darker the colour, the better the performance. Thus, the Ψ - θ d e f plot could assist in finding the design point and determine the preferred operating range for a particular profile. This plot is not influenced by the incidence range and the occurrence of bulk separation under positive incidence angles. The recommended design incidence angle (refer to the peak) for the slotted profile is larger than the datum profile, and the effective operating range suggested by the plot is extensively broadened for the slotted profile. It accords well with the total pressure loss contours shown in Figure 2. Hence, this judgement is suitable for slotted profile.

5. The Underlying Loss Mechanism

The viscous shear stress dominates in the energy transform and transport process. Equation (9) describes changes in kinetic energy per unit mass for a fluid particle [42]. It depicts the averaged turbulence motion.
d d t ( 1 2 u i u i ) = x j ( p ρ u j + 2 ν u i S i j u i u j ¯ u i ) 2 ν S i j S i j + u i u j ¯ S i j
The first term on the left-hand side is the transport of k , where k represents the mean kinetic energy, and it takes k = 1 2 u i 2 . The first term, ( p ρ u j ) / x j , on the right-hand side expresses the work on the fluid per unit of mass by pressure during unit time, and the second term, ( 2 ν u i S i j ) / x j , represents the transport of mechanical energy to the fluid motion by the viscous force of the averaged flow. 2 ν S i j S i j is the viscous dissipation for the averaged flow. Another two terms that includes the fluctuation reflect the influence of fluctuation to the averaged flow. The term ( u i u j ¯ u i ) / x j represents the transport of mechanical energy by Reynolds stress, and the term u i u j ¯ S i j is the production of the mean kinetic energy.
The last two terms exhibit the destruction of mechanical energy due to turbulent shear work and the shear work by the mean strain. There are two kinds of force that resists the deformation in fluid motion. One of them is the molecular viscosity, and the other is the Reynolds force caused by turbulence fluctuation. The work done on the viscous force that resists the deformation transforms the mechanical energy into kinetic energy for thermal motion of the molecule. Thus, it is regarded as a dissipation term, and it contributes to the energy transformation between mechanical and internal energies. The work done on the Reynolds stress that resists the mean flow deformation transforms the mean flow mechanical energy into kinetic energy for turbulence fluctuation. Namely it is the production of k . Hence, the nondimensionalized destruction of mean mechanical energy for the Reynolds-averaged flow takes the following form:
c d = 1 U e 3 ( u i u j ¯ S i j + 2 ν S i j S i j )
For the flow resolved by Reynolds-averaged Navier-Stokes (RANS) methods with SST turbulence model, the destruction of the mean mechanical energy that is modelled could be reduced as:
c d = 1 U e 3 ν t S 2 + ϕ d
where U e is the characteristic velocity of the flowfield. Here U e is converted by the incoming flow Mach number and temperature conditions. ν t is the turbulence kinetic viscosity, and ν is the molecular kinetic viscosity. The second term of the c d also terms as dissipation function, ϕ d . Hence, the nondimensionalized dissipation function is defined as:
ϕ d = 1 U e 3 ν 2 ( u i x j + u j x i ) 2
The shear work done by the molecular viscosity irreversibly dissipates the mechanical energy of the fluid motion as heat. The dissipation term remains positive, and it acts as a source term rather than a transport term. Additionally, this term is closely associated with entropy production. Here, both the nondimensionalized destruction coefficient and the nondimensionalized dissipation function are employed to analyze the control mechanism.

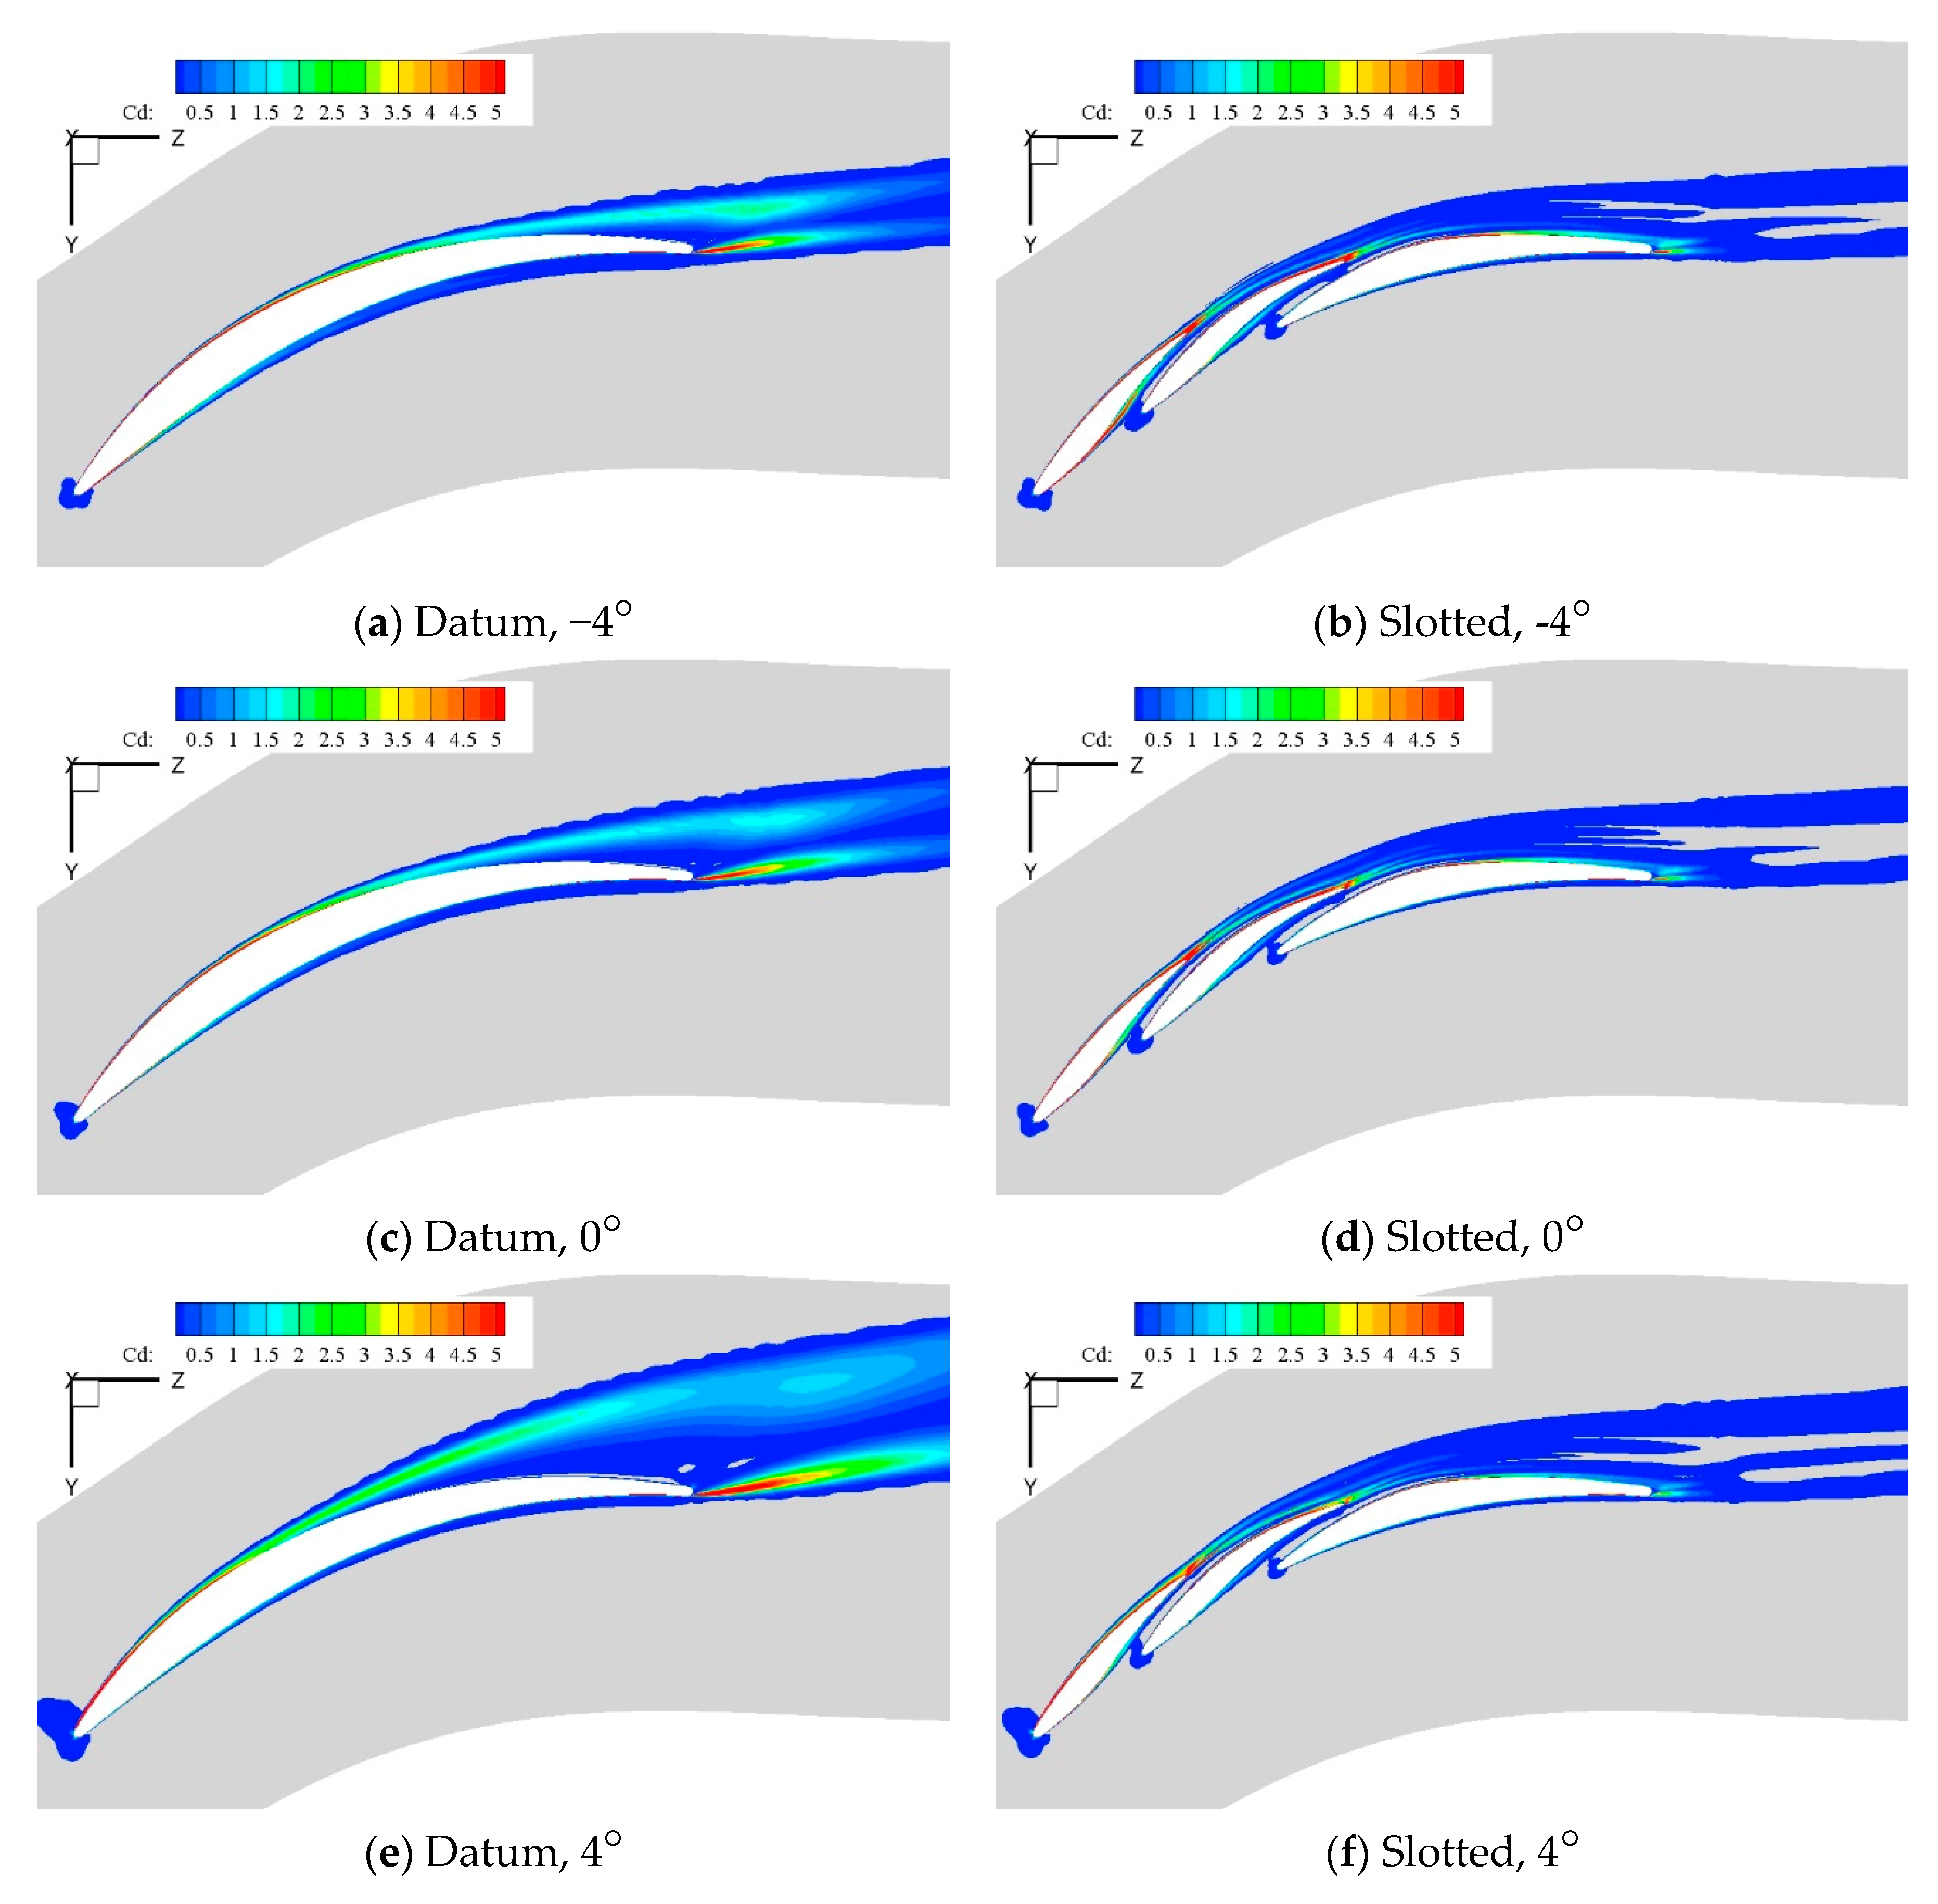
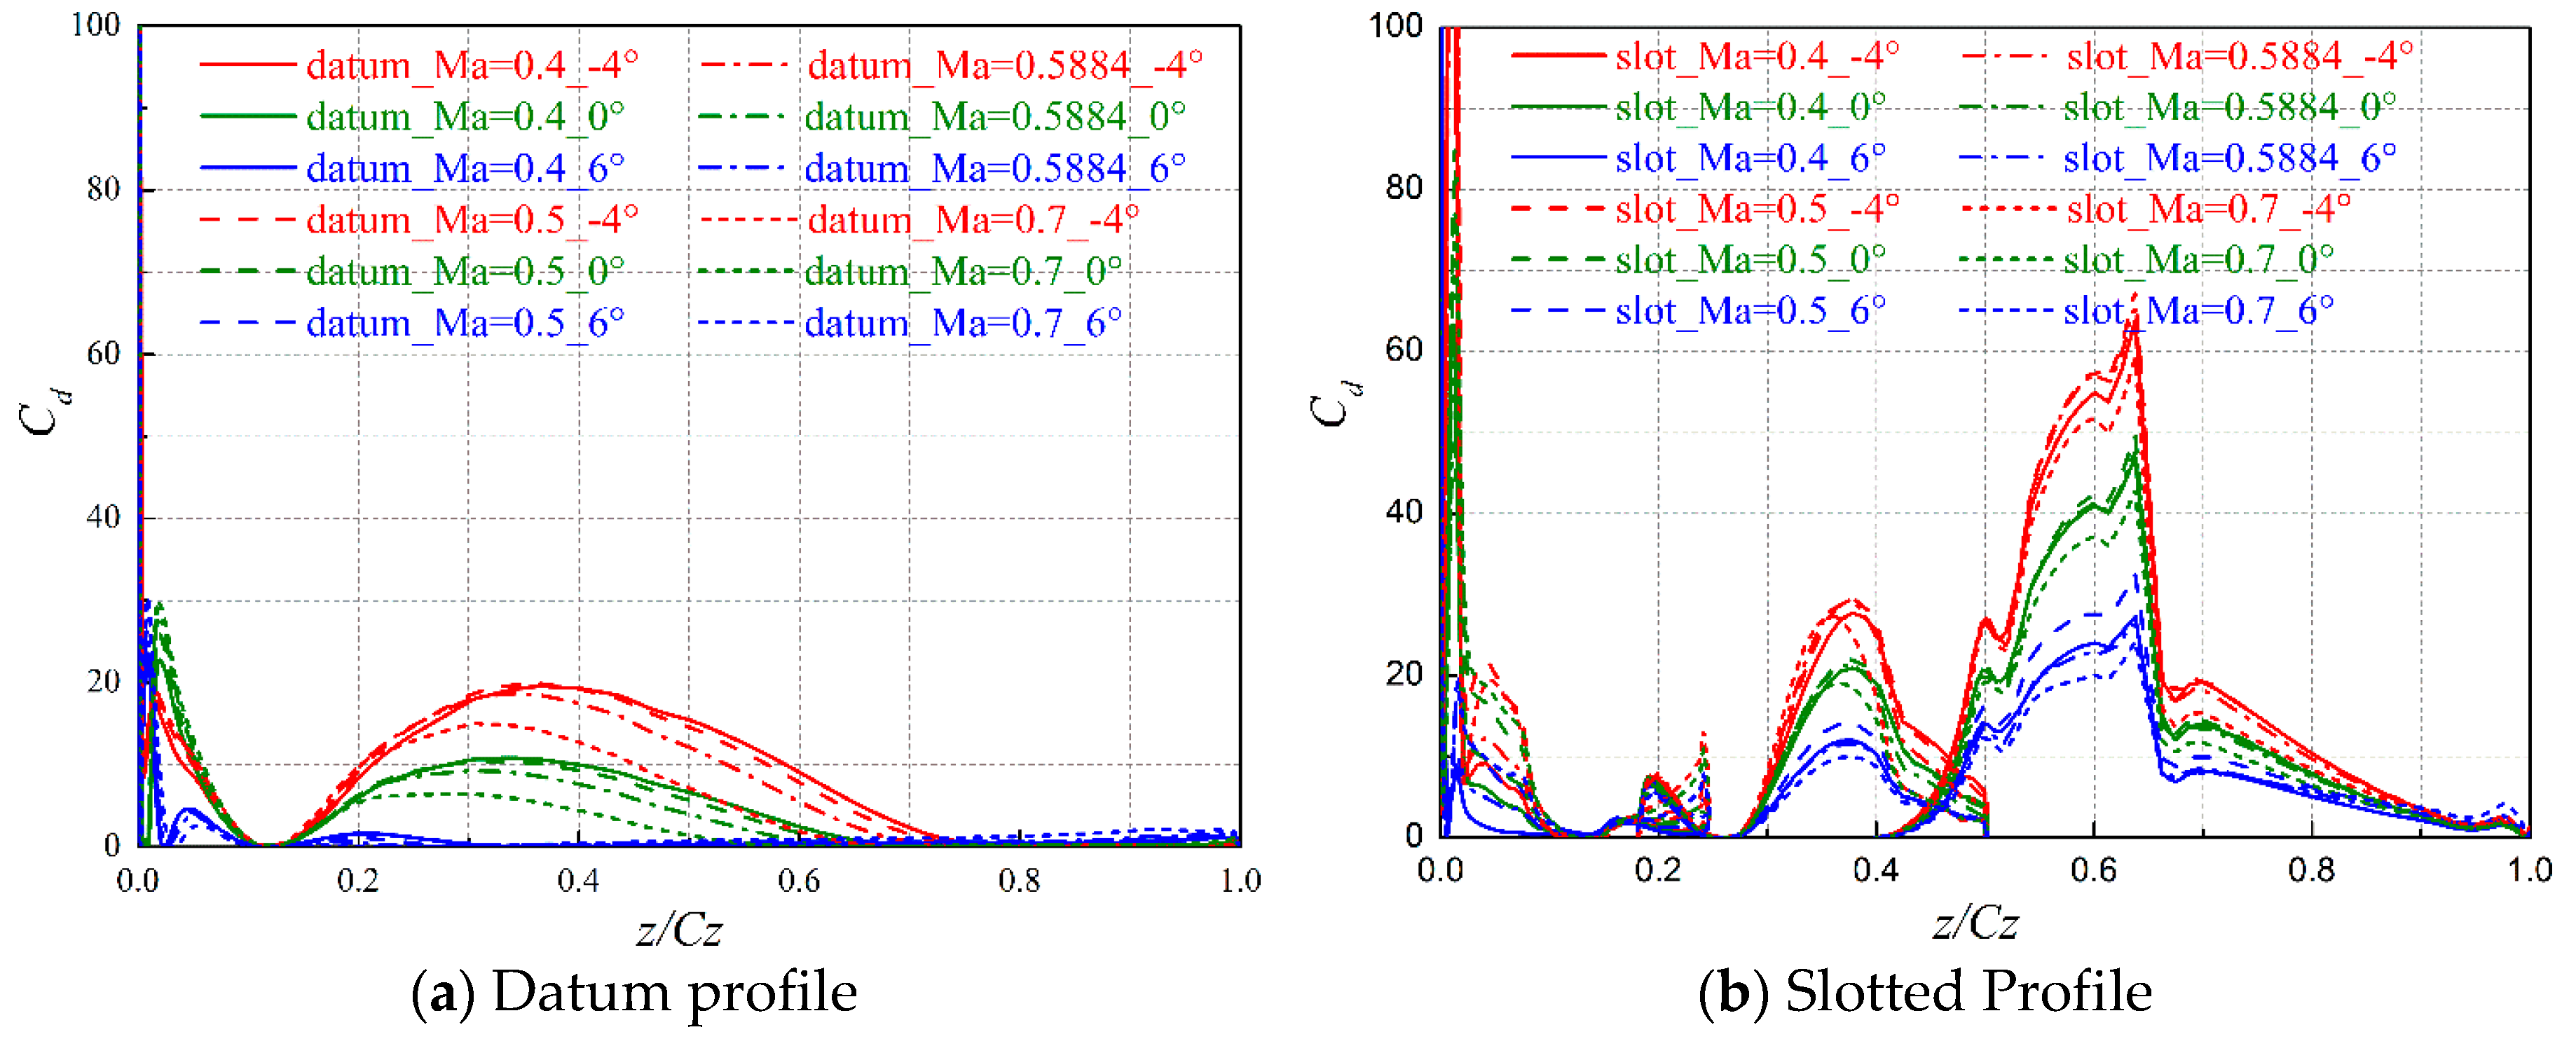
5.1. Destruction Coefficient

Figure 10 exhibits the distribution of nondimensionalized destruction coefficient under the Mach number of 0.5884. The incidence angle of −4°, 0° and 6° are chosen as the typical operating incidences. The destruction caused by both datum and slotted profiles are compared. The region with a nondimensionalized destruction coefficient lower than 0.005 is blanked.
High destruction exists where the shear strain dominates. The attached boundary layer in the SS has high destruction coefficient. For the datum profile, the high destruction coefficient region covers a certain axial chord length in the suction surface, then the high destruction bound lifts off from the suction surface, whereas the high destruction coefficient region nearly remains attached in the suction surface for the slotted profile. Thus, the relatively high destruction region is reduced by the slotted profile, particularly when premature lift off of high destruction bound occurs for the datum profile. A high destruction region appears for the datum profile behind the profile trailing edge, whereas it is diminished for the slotted profile.
To quantitatively extract the lift off location, and evaluate the Mach number effects on destruction coefficient near the wall, the nondimensionalized destruction coefficient distribution along the profile suction surface is compared in Figure 11.
The nondimensionalized destruction coefficient distribution along the profile suction surface is closely associated with the boundary layer development in the profile SS. Figure 11a shows that a valley appears at approximately a 12% axial chord length for the datum profile regardless of the variation in Mach number. This observation indicates the transformation of a favourable pressure gradient to an adverse pressure gradient. The occurrence of a destruction coefficient that approaches zero and then remains in the suction surface for the datum profile; indicates the lift off of the high destruction bound. The location of the initial lift off point is remarkably influenced by incidence angles. The increasing incidence angle promotes the premature lift off of the high destruction bound. Besides, with an increase of Mach number, the initial lift off point moves upstream along the suction surface. The premature lift off makes it easy to form bulkier reverse flow region in the profile SS, because the high destruction coefficient bound comes into the main flow region earlier. A peak exists for the suction surface distribution of destruction coefficient downstream of the valley value. Either the increased incidence angle or the increased Mach number contributes to the decreased destruction coefficient peak value. However, the boundary layer with a lower destruction coefficient has a weaker ability to resist the adverse pressure gradient. Thus, the separation occurs more easily for the datum profile under larger incidence angles or larger Mach number conditions.
Figure 11b reflects that the destruction coefficient valley appears slightly downward for the slotted profile in the first element of the profile. Then, the destruction coefficient increases until the end of the first profile element. Another destruction coefficient valley is generated in the second profile element at the exit of the front slot, and a destruction coefficient peak is also generated in the second profile element. These destruction coefficient peaks have larger destruction coefficient values than the peak values for the datum profile under the same operating conditions, indicating that the jet from the slot outlet enhances the attachment of boundary layer flow along the suction surface of the second profile element. The valley does not appear in the last profile element due to the strong adverse pressure gradient, whereas two higher peak values are obtained in the last profile element. One peak is located at the exit of the rear slot, and the other peak appears where a balance is obtained between the slot-out-jet and the local main flow. The attached flow in the suction side of the last profile element is enhanced more effective; thus, the slotted profile gains the ability of the boundary layer flow near the suction surface to resist the adverse pressure gradient, and the lift off of the high destruction coefficient bound is eliminated.

5.2. Dissipation Function

The logarithm of the nondimensionalized dissipation function is shown in Figure 12. High dissipation indicates a strong shear region. For the datum profile, the high shear bound that lifted off from the suction surface processes a high magnitude of dissipation, and the wake also processes a high dissipation value. The slotted profile suppresses the lift off of the high shear bound, and also results in a reduced shear thickness. Hence, a more uniformed downstream flow field is obtained by the slotted profile.
To evaluate the influence of the dissipation function, the pitchwise distribution of a nondimensionalized dissipation function in 20 % c downstream of the profile trailing edge is compared for the datum and slotted profiles. It should be noted that the scale for the vertical coordinate is different.
The dissipation in the PS is small for both datum and slotted profiles. As shown in Figure 13a, two dissipation peaks appears for the datum profile in the SS. The higher peak exposes the dissipation caused by the wake, and the other peak is due to the high destruction bound, namely the shear between the separated flow on the aft of the profile SS and the main flow generates high dissipation. The increase in incidence angle facilitates a wider range of high dissipation range. With an increase of Mach number, peak values of dissipation reduce, and the high dissipation range over the pitchwise direction is enlarged. Because the dissipation finally dissipates as heat, it more effectively suppresses high dissipation, thus reducing the loss. Figure 13b reflects that nearly two thirds of dissipation extent is reduced by the slotted profile. Apparently, a narrow wake is obtained with lower loss. The high dissipation peak in the SS for the slotted profile is increased to three in accordance to two for the datum profile. Referring to the dissipation contours shown in Figure 12, the high dissipation peak in the detached line is caused by the wake of each profile element. Due to the injection of the slot-out-jet, wakes from the front and second profile elements do not lift off and follow well with the profile suction surface. Dissipation for the wake of the front and second profile element is lower than for the high destruction bound of the datum profile. This is due to the mitigation of a local adverse pressure gradient by the slot-out-jet. Additionally, the slot-out-jet driven by the pressure difference is self-adaptive; thus, high mixing loss is avoided in the jet area. The dissipation in the pressure surface near the trailing edge is impaired by the slotted profile; hence, the dissipation formed in the profile trailing edge is reduced. Under an incidence angle of −4°, a small extent of separation occurs for the datum profile; thus, the entire relatively high dissipation range for the slotted profile is slightly wider than the datum profile, but the dissipation magnitude for the slotted profile is smaller. Under an incidence angle of 0°, both the high dissipation range and the dissipation magnitude are reduced through the implementation of slots. The high dissipation range increases to nearly half of the pitch wide for the datum profile under the incidence angle of 6°, whereas it is reduced to no more than a quarter pitch wide for the slotted profile, and the peak value is also halved.

6. Conclusions

The Mach number effects on loss and loading are evaluated both for the datum and slotted profiles under a wide incidence range, and the underlying loss mechanism is explored based on experimentally validated CFD simulations. Conclusions are drawn as follows:
  • The mass-averaged total pressure loss contours showed that the low loss range for the datum profile reduced sharply with increasing Mach number. The employment of slots alters the low loss operating range towards a positive incidence range and broadens the low loss range in all Mach number conditions tested.
  • The DF and Zweifel loading coefficient are compared in evaluating the loading. The reduced Zweifel loading coefficient limits the increase rate of DF, and the slotted profile allows a higher DF to be obtained than the datum profile when the same blade loading is suffered.
  • Three kinds of deficit thickness are defined and evaluated for the flow in the profile trailing edge. All the deficit thicknesses in the SS are much higher than that in the PS. The slotted profile contributes to diminishing the accumulated thick boundary layer at the profile trailing edge. As a kind of passive flow control method, it suppresses the separation and improves the performance at positive incidence, and does not deteriorate much in negative incidence.
  • The correction of loading to the momentum deficit thickness demonstrates that it is difficult to distinguish failure simply based on the DF values for a given geometry, particularly under high loadings. The Zweifel loading coefficient connects well with the low momentum deficit in the profile trailing edge. V-shaped distributions appear for each Mach number condition in the Ψ - θ d e f plot. Although the drop in Zweifel loading lags behind the increase in momentum deficit, the peak of the V-shape could better suggest the design condition, under which the profile could achieve better performance both in loss and loading ability, and a region near the V-shape peak could better indicate the correct operating range. Additionally, this judgement is not limited by the incidence range and the occurrence of bulk separation under positive incidences.
  • The nondimensionalized destruction of mean mechanical energy and dissipation function are employed to analyze the loss mechanism. Either the increased incidence angle or the increased Mach number results in decreased coefficient peak values for the datum profile in the suction surface. Because as a majority part of the destruction of mean mechanical energy, the Reynolds stress that resists the mean flow deformation transforms the mean flow kinetic energy into kinetic energy for turbulence fluctuation, the boundary layer with a lower destruction coefficient has less ability to resist the adverse pressure gradient; thus, the separation occurs more easily for the datum profile under larger incidence or high Mach number conditions. The slotted profile gains the ability of the boundary layer flow near the suction surface to resist the adverse pressure gradient, and the lift off of the high destruction coefficient bound is eliminated. A reduced shear thickness and a uniformed downstream flow field is obtained by the slotted profile.

Author Contributions

Y.T. conducted the simulations and did the analysis. Y.L. put forward the main idea and supervised the research work. Y.T. and Y.L. drafted the manuscript, discussed the results and reviewed the manuscript. All authors have read and agreed to the published version of the manuscript.

Funding

This work is supported by the National Natural Science Foundation of China (No. 51676007, No. 51976006, No. 51420105008, No. 51790513), and is also supported by the Aeronautical Science Foundation of China (2018ZB51013).

Acknowledgments

We express our appreciation to the late Lipeng Lu, whose contribution to this work was of great significance.

Conflicts of Interest

The authors declare no conflict of interest.

Nomenclature

c chord (m)
c d nondimensionalized destruction of mean mechanical energy (-)
d distance from the wall (m)
D l o c local diffusion factor (-)
k mean kinetic energy (m2/s2)
p pressure (Pa)
S i j strain rate (s−1)
t time (s)
u velocity (m/s)
u i u j ¯ Reynolds stress (kg/m∙s2)
U e characteristic velocity (m/s)
V velocity (m/s)
Y p total pressure loss (-)
Greek symbols
ρ Density (kg/m3)
Ψ Zweifel loading coefficient (-)
δ d e f * displacement thickness (-)
θ d e f momentum deficit thickness (-)
δ d e f kinetic energy deficit thickness (-)
ν molecular kinetic viscosity (m2/s)
ν t turbulence kinetic viscosity (m2/s)
ϕ d nondimensionalized dissipation function (-)
Subscripts
0 stagnation value
1 inlet value
f s free stream
Acronyms
2Dtwo-dimensional
3Dthree-dimensional
AVDRaxial velocity density ratio
CFDcomputational fluid dynamic
DFdiffusion factor
PSpressure side
SSsuction side

References

  1. Slotnick, J.P.; Khodadoust, A.; Alonso, J.J.; Darmofal, D.L.; Gropp, W.D.; Lurie, E.A.; Mavriplis, D.J.; Venkatakrishnan, V. Enabling the environmentally clean air transportation of the future: A vision of computational fluid dynamics in 2030. Philos. Trans. R. Soc. A Math. Phys. Eng. Sci. 2014, 372, 20130317. [Google Scholar] [CrossRef]
  2. Lakshminarasimha, A.N.; Boyce, M.P.; Meher-Homji, C.B. Modeling and analysis of gas turbine performance deterioration. J. Eng. Gas Turbines Power 1994, 116, 46–52. [Google Scholar] [CrossRef]
  3. Wennerstrom, A.J. Highly loaded axial flow compressors: History and current developments. ASME J. Turbomach. 1990, 112, 567–578. [Google Scholar] [CrossRef]
  4. Brent, J.A. Single Stage Experimental Evaluation of Compressor Blading with Slots and Vortex Generators, Part III—Data and Performance for Stage 4; NASA CR-72741; NASA Lewis Research Center: Cleveland, OH, USA, 1970.
  5. Rockenbach, R.W. Single Stage Experimental Evaluation of Slotted Rotor and Stator Blading, Part IX—Final Report; NASA CR-54553; NASA Lewis Research Center: Cleveland, OH, USA, 1968.
  6. Rockenbach, R.W.; Brent, J.A.; Jones, B.A. Single Stage Experimental Evaluation of Compressor Blading with Slots and Vortex Generators, Part I—Analysis and Design of Stages 4 And 5; NASA CR-72626; NASA Lewis Research Center: Cleveland, OH, USA, 1970.
  7. Wennerstrom, A.J. Some experiments with a supersonic axial compressor stage. ASME J. Turbomach. 1987, 109, 388–397. [Google Scholar] [CrossRef]
  8. Brent, J.A.; Clemmons, D.R. Single-Stage Experimental Evaluation of Tandem-Airfoil Rotor and Stator Blading for Compressors, Part VIII—Final Report; NASA CR-134713; NASA Lewis Research Center: Cleveland, OH, USA, 1974.
  9. Koch, C.C.; Smith, L.H. Experimental Evaluation of Outer Case Blowing or Bleeding of Single Stage Axial Flow Compressors, Part III—Performance of Blowing Insert Configuration No. 1; NASA CR-54589; NASA Lewis Research Center: Cleveland, OH, USA, 1968.
  10. Koch, C.C.; Smith, L.H. Experimental Evaluation of Outer Case Blowing or Bleeding of Single Stage Axial Flow Compressor, Part IV—Performance of Bleed Insert Configuration No. 3; NASA CR-54590; NASA Lewis Research Center: Cleveland, OH, USA, 1968.
  11. Gbadebo, S.A.; Cumpsty, N.A.; Hynes, T.P. Control of three-dimensional separation in axial compressor by tailored boundary layer suction. ASME J. Turbomach. 2008, 130, 011004. [Google Scholar] [CrossRef]
  12. Liu, Y.W.; Sun, J.J.; Lu, L.P. Corner separation control by boundary layer suction applied to a highly loaded axial compressor cascade. Energies 2014, 7, 7994–8007. [Google Scholar] [CrossRef]
  13. Cao, Z.Y.; Liu, B.; Zhang, T. Control of separations in a highly loaded diffusion cascade by tailored boundary layer suction. Proc. Inst. Mech. Eng. Part C J. Mech. Eng. Sci. 2014, 228, 1363–1374. [Google Scholar] [CrossRef]
  14. Li, Y.H.; Wu, Y.; Zhou, M. Control of the corner separation in a compressor cascade by steady and unsteady plasma aerodynamic actuation. Exp. Fluid 2010, 48, 1015–1023. [Google Scholar] [CrossRef]
  15. Akcayoz, E.; Vo, H.D.; Mahallati, A. Controlling corner stall separation with plasma actuators in a compressor cascade. ASME J. Turbomach. 2016, 138, 081008. [Google Scholar] [CrossRef]
  16. Staats, M.; Nitsche, W. Active control of the corner separation on a highly loaded compressor cascade with periodic nonsteady boundary conditions by means of fluidic actuators. ASME J. Turbomach. 2016, 138, 031004. [Google Scholar] [CrossRef]
  17. De Giorgi, M.G.; De Luca, C.G.; Ficarella, A.; Marra, F. Comparison between synthetic jets and continuous jets for active flow control: Application on a NACA0015 and a compressor stator cascade. Aerosp. Sci. Technol. 2015, 43, 256–280. [Google Scholar] [CrossRef]
  18. Evans, S.; Hodson, H.; Hynes, T. Flow control in a compressor cascade at high incidence. J. Propuls. Power 2010, 26, 828–836. [Google Scholar] [CrossRef]
  19. Chen, C.; Chen, F.; Yu, J.Y. Experimental investigation of endwall VGJs in a compressor cascade. Appl. Therm. Eng. 2018, 145, 386–395. [Google Scholar] [CrossRef]
  20. Du, J.; Li, Y.W.; Li, Z.H.; Li, J.C.; Wang, Z.N.; Zhang, H.W. Performance enhancement of industrial high loaded gas compressor using Coanda jet flap. Energy 2019, 172, 618–629. [Google Scholar] [CrossRef]
  21. Hu, J.G.; Wang, R.G.; Li, R.K.; Wu, P.G. Effects of slot jet and its improved approach in a high-load compressor cascade. Exp. Fluids 2017, 58, 155. [Google Scholar] [CrossRef]
  22. Keerthi, M.C.; Rajeshwaran, M.S.; Kushari, A. Effect of leading-edge tubercles on compressor cascade performance. AIAA J. 2016, 54, 912–923. [Google Scholar] [CrossRef]
  23. Zhong, J.J.; Han, J.A.; Liu, Y.M.; Tian, F. Numerical Simulation of Endwall Fence on the Secondary Flow in Compressor Cascade. In Proceedings of the ASME Turbo Expo 2008: Power for Land, Sea, and Air, Berlin, Germany, 9–13 June 2008. [Google Scholar]
  24. Hergt, A.; Meyer, R.; Engel, K. Effects of vortex generator application in the performance of a compressor cascade. ASME J. Turbomach. 2012, 135, 021026. [Google Scholar] [CrossRef]
  25. Yi, W.L.; Ji, L.C. Experimental investigation in the performance of compressor cascade using blended-blade-end-wall contouring technology. Proc. Inst. Mech. Eng. Part G J. Aerosp. Eng. 2017, 232, 2833–2844. [Google Scholar] [CrossRef]
  26. Yi, W.L.; Ji, L.C. Control and Entropy Analysis of Corner Flow Separation in a Compressor Cascade Using Streamwise Grooves. Entropy 2019, 21, 928. [Google Scholar] [CrossRef] [Green Version]
  27. Liu, Y.W.; Sun, J.J.; Tang, Y.M.; Lu, L.P. Effect of slot at blade root on compressor cascade performance under different aerodynamic parameters. Appl. Sci. 2016, 6, 421. [Google Scholar] [CrossRef]
  28. Sun, J.J.; Liu, Y.W.; Lu, L.P.; Ottavy, X. Control of corner separation by optimized slot configuration in a linear compressor cascade. Compres. Blower Fan Technol. 2016, 6, 9–18. [Google Scholar]
  29. Tang, Y.M.; Liu, Y.W.; Lu, L.P.; Lu, H.W.; Wang, M. Experimental Investigation of Flow Control Using Blade End Slots in a Highly Loaded Compressor Cascade. In Proceedings of the International Symposium on Transport Phenomena and Dynamics of Rotating Machinery, Maui, HI, USA, 16–21 December 2017. [Google Scholar]
  30. Tang, Y.M.; Liu, Y.W.; Lu, L.P.; Lu, H.W.; Wang, M. Passive Separation Control with Blade-End Slots in a Highly Loaded Compressor Cascade. AIAA J. 2020, 58, 85–97. [Google Scholar] [CrossRef]
  31. Tang, Y.M.; Liu, Y.W.; Lu, L.P. Evaluation of compressor blading with blade end slots and full-span slots in a highly loaded compressor cascade. ASME J. Turbomach. 2019, 141, 121002. [Google Scholar] [CrossRef]
  32. Tang, Y.M.; Liu, Y.W.; Lu, L.P. Solidity effect on corner separation and its control in a high-speed low aspect ratio compressor cascade. Int. J. Mech. Sci. 2018, 142, 304–321. [Google Scholar] [CrossRef]
  33. Yoon, S.; Ajay, R.; Chaluvadi, V.; Michelassi, V.; Mallina, R. A Passive Flow Control to Mitigate the Corner Separation in an Axial Compressor by a Slotted Rotor Blade. In Proceedings of the ASME Turbo Expo, Phoenix, AZ, USA, 17–21 June 2019. GT2019-90754. [Google Scholar]
  34. Denton, J.D. Loss mechanisms in turbomachines. ASME J. Turbomach. 1993, 115, 621–656. [Google Scholar] [CrossRef]
  35. Liu, Y.W.; Yan, H.; Lu, L.P.; Li, Q.S. Investigation of vortical structures and turbulence characteristics in corner separation in a linear compressor cascade using DDES. ASME J. Fluids Eng. 2017, 139, 021107. [Google Scholar] [CrossRef]
  36. Kan, X.X.; Wang, S.T.; Yang, L.; Zhong, J.J. Vortex dynamic mechanism of curved blade affecting flow loss in compressor cascade during corner stall process. Aerosp. Sci. Technol. 2018, 85, 443–452. [Google Scholar] [CrossRef]
  37. Goodhand, M.N.; Miller, R.J.; Lung, H.W. The impact of geometric variation on compressor two-dimensional incidence range. ASME J. Turbomach. 2015, 137, 021007. [Google Scholar] [CrossRef]
  38. Liu, Y.W.; Tang, Y.M.; Tucker, P.G.; Scillitoe, A.D. Modification of shear stress transport turbulence model using helicity for predicting corner separation flow in a linear compressor cascade. ASME J. Turbomach. 2020, 142, 021004. [Google Scholar] [CrossRef]
  39. Menter, F.R.; Kuntz, M.; Langtry, R. Ten years of industrial experience with the SST turbulence model. Turbul. Heat Mass Transf. 2003, 4, 625–632. [Google Scholar]
  40. Lieblein, S.; Schwenk, F.C.; Broderick, R.L. Diffusion Factor for Estimating Losses and Limiting Blade Loadings in Axial-Flow-Compressor Blade Elements; Lewis Flight Propulsion Laboratory: Cleveland, OH, USA, 1953.
  41. Gbadebo, S.A.; Cumpsty, N.A.; Hynes, T.P. Three-dimensional separations in axial compressors. ASME J. Turbomach. 2005, 127, 331–339. [Google Scholar] [CrossRef]
  42. Wheeler, A.P.S.; Dichens, A.M.J.; Miller, R.J. The effect of nonequilibrium boundary layers on compressor performance. J. Turbomach. 2018, 140, 101003. [Google Scholar] [CrossRef] [Green Version]
Figure 1. Geometry of datum and slotted profile.
Energies 13 01673 g001
Figure 2. Contours of total pressure loss coefficient varying with Mach number under different incidence angles.
Energies 13 01673 g002
Figure 3. Variation of DF and Zweifel loading coefficient for datum and slotted profiles.
Energies 13 01673 g003
Figure 4. Velocity distribution at the trailing edge under different Mach number conditions.
Energies 13 01673 g004
Figure 5. Displacement thickness at profile trailing edge.
Energies 13 01673 g005
Figure 6. Momentum deficit thickness at profile trailing edge.
Energies 13 01673 g006
Figure 7. Kinetic energy deficit thickness at profile trailing edge.
Energies 13 01673 g007
Figure 8. Momentum deficit thickness in SS of the profile trailing edge varies with DF.
Energies 13 01673 g008
Figure 9. Momentum deficit thickness in SS of the profile trailing edge varies with Zweifel loading coefficient.
Energies 13 01673 g009
Figure 10. Distribution of nondimensionalized destruction coefficient under Ma = 0.5884 conditions.
Energies 13 01673 g010
Figure 11. Nondimensionalized destruction coefficient distribution along profile suction surface.
Energies 13 01673 g011
Figure 12. Distribution of logarithmic nondimensionalized dissipation function under Ma = 0.5884 conditions.
Energies 13 01673 g012
Figure 13. Distribution of nondimensionalized dissipation function along pitchwise direction in 20 % c downstream of the profile trailing edge.
Energies 13 01673 g013
Table 1. Geometrical parameters of datum profile.
ParameterValueParameterValue
Chord/c (m)0.055Inlet Mental Angle (°)41.91
Solidity1.52Outlet Mental Angle (°)94.85
Chamber Angle (°)52.94Stagger Angle (°)21.7

