Article

Establishing Boundary Conditions Considering Influence Factors of the Room Equipped with a Ceiling Radiant Cooling Panel

1
Division of Architecture, College of Engineering, Sun Moon University, Chungnam 31460, Korea
2
Department of Architecture and Architectural Engineering, College of Engineering, Seoul National University, Seoul 08826, Korea
3
Goo-Sang Joe, Energy Platform Business Unit, Korea Telecom, Seoul 03155, Korea
4
School of Architecture, Kumoh National Institute of Technology, Gyeongbuk 39177, Korea
*
Author to whom correspondence should be addressed.
Energies 2020, 13(7), 1684; https://doi.org/10.3390/en13071684
Submission received: 31 January 2020 / Revised: 19 March 2020 / Accepted: 26 March 2020 / Published: 3 April 2020
(This article belongs to the Section G: Energy and Buildings)

Abstract

:
The objective of this study is to establish boundary conditions to evaluate the cooling capacity of the Cooling Radiant Ceiling Panel (CRCP) considering the environment of a room equipped with the CRCP. The current study investigated the boundary conditions and derivation techniques from previous studies. Based on the results of the analysis, a heat transfer model was derived for a room fitted with CRCP. In addition, the heat transfer model was used to derive the factors affecting the cooling capacity of the CRCP and each factor was simulated and verified through this model. The effects of these factors on the capacity of the CRCP was established by using various boundary conditions. To verify the validity of the simulation model, the experimental results were compared with the cooling capacity for a specific case. As a result, it was established that even for the same panel, there was a variance in the cooling capacity of the CRCP based on the boundary conditions and that the influence of the surface exposed to the outdoors had more implications. Consequently, this study presents the influence factors to be considered when designing CRCP.

1. Introduction

Cooling Radiant Ceiling Panel (CRCP) is a system that uses cold water to reduce the thermal load and is installed on the ceiling of buildings [1]. CRCP can be applied not only to homes but also to spaces with large ceiling areas such as classrooms [2]. In order to eliminate the thermal load efficiently, it is crucial to estimate the cooling capacity of the CRCP [3]. For accurate evaluation, it is necessary to evaluate the cooling capacity on the boundary condition when the panels are installed in the actual building (Figure 1).
In the actual building space, the CRCP uses radiation and convection heat transfer to cool the air. Therefore, it is necessary to implement the environment in which the panel can radiate and transfer convective heat as much as in the actual building space.
To evaluate the amount of heat transfer in the actual building space, the air and surface temperature should be set at the same temperature as the actual building during the evaluation (Figure 2). However, the techniques used to evaluate the cooling capacity of the panel estimates the amount of heat that a panel removes from a thermal load generated by a cooling load simulator fitted in the test room [4]. In this case, the surface temperature and the air temperature are kept constant, in order to remove only the thermal load generated by a cooling load simulator. The same surface temperature is not applied since the variations due to the influencing factors in the surrounding environment are unknown. The aim of this study is to clarify the relationship between the influencing factors and the surface temperature, and to establish the same boundary conditions in order to evaluate the cooling capacity of the CRCP. It is expected that the actual amount of cooling capacity of the CRCP could be measured in the boundary conditions when the CRCP is installed in the actual building space for the cooling system design.

2. Preliminary Study

2.1. Types of CRCP

The cooling radiant ceiling panel consists of pipes that circulate cold water to the panel in order to remove the thermal load generated in the room and maintain the room in a thermally comfortable state. In order to derive the boundary condition for evaluating the cooling capacity of CRCP, it is necessary to describe the concept of the CRCP and the cooling capacity. In this study, the type of ceiling panel is defined to be evaluated based on the distinction by the American Society of Heating, Refrigerating and Air-Conditioning Engineers (ASHRAE) and Representatives of European Heating and Ventilation Associations (REHVA) [4,5,6]. In both ASHRAE and REHVA, CRCPs are defined as devices that radiate heat using piping suspended at regular spaces from the ceiling (Table 1). The CRCP consists of insulation, piping, and a heat sink.

2.2. Current Evaluation Method of the Cooling Capacity of the CRCP

In the Lawrence Berkeley National Laboratory (LBNL) study, the amount of heat transferred from the CRCP surface to the room wall surface and the room air is referred to as the cooling power of the CRCP. In this case, the amount of cooling of the CRCP is the amount of convection and radiation heat exchange due to the difference in the surface temperature and the air temperature in the installation area of the CRCP.
Table 2 presents the formula used in calculating the cooling capacity of the CRCP based on the LBNL study and ASHRAE [7,8]. In both studies, the cooling capacity is divided into a convection component and a radiation component, which is a function of the temperature of each surface. The cooling capacity of the CRCP could be obtained by combining the convection and radiation components.
Table 3 presents the previous studies focused on evaluating the cooling capacity of CRCP. According to Kochendorfer’s study, the problem is that the amount of cooling in the same panel may vary due to irregular surroundings, while the amount of cooling capacity may vary depending on the non-uniform environment [9]. Notably, previous studies have highlighted that the boundary condition could be changed by the envelope. The effect of the envelope is that the indoor boundary condition of the surface exposed to the outside air may be changed based on the thermal load generated by the envelope space where the CRCP is installed. This means that the amount of cooling of the CRCP can be changed [10]. In order to solve this problem, it is necessary to establish the non-uniform boundary condition at the environment of the actual building.

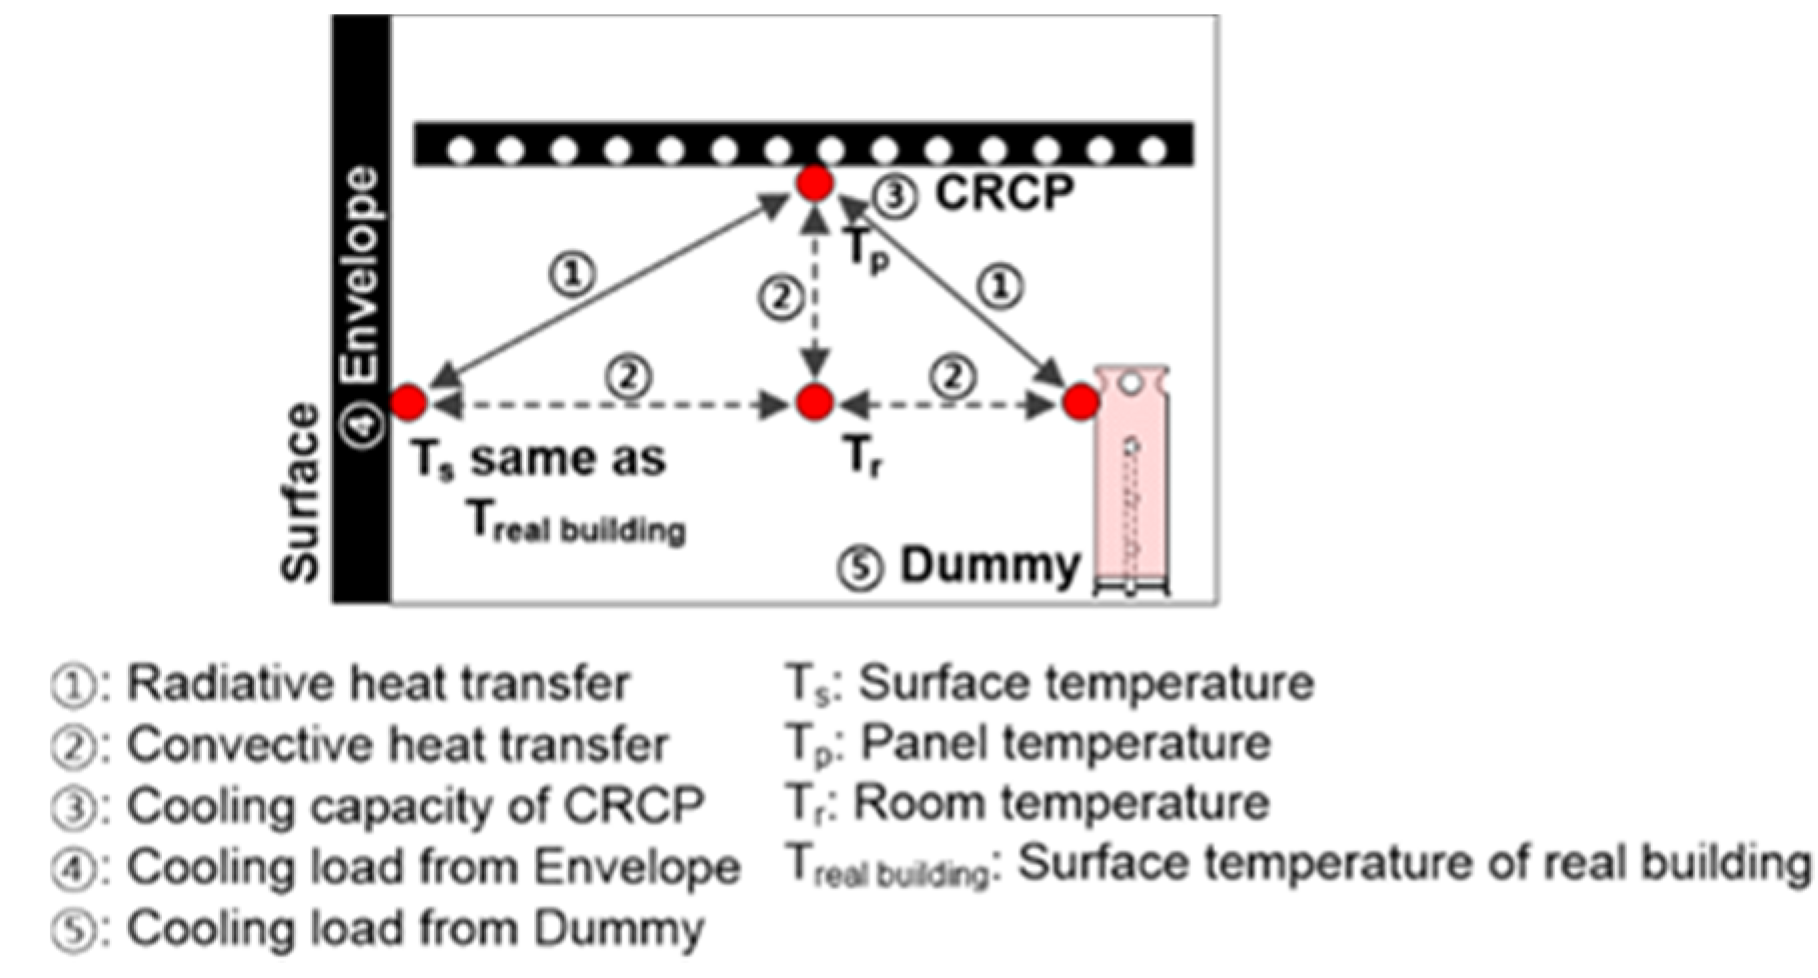
2.3. Concept for Establishing Boundary Condition

The amount of cooling capacity may vary depending on the analysis of the plenum and the room. The concept for establishing the boundary condition in this study can be summarized through the analysis of the plenum and the analysis of room. Thus far, it is still unclear how the surface temperature caused by the boundary conditions affects the convection and radiative heat transfer in the room fitted with CRCP. In addition, the effect of the boundary condition influencing factors on the cooling capacity of CRCP has not been clarified. Thus, it is necessary to study the relationship between the cooling capacity and the influencing factors on the wall, ceiling, and floor surface temperature in the analysis of the plenum and room.

3. Environment of Room Equipped with CRCP

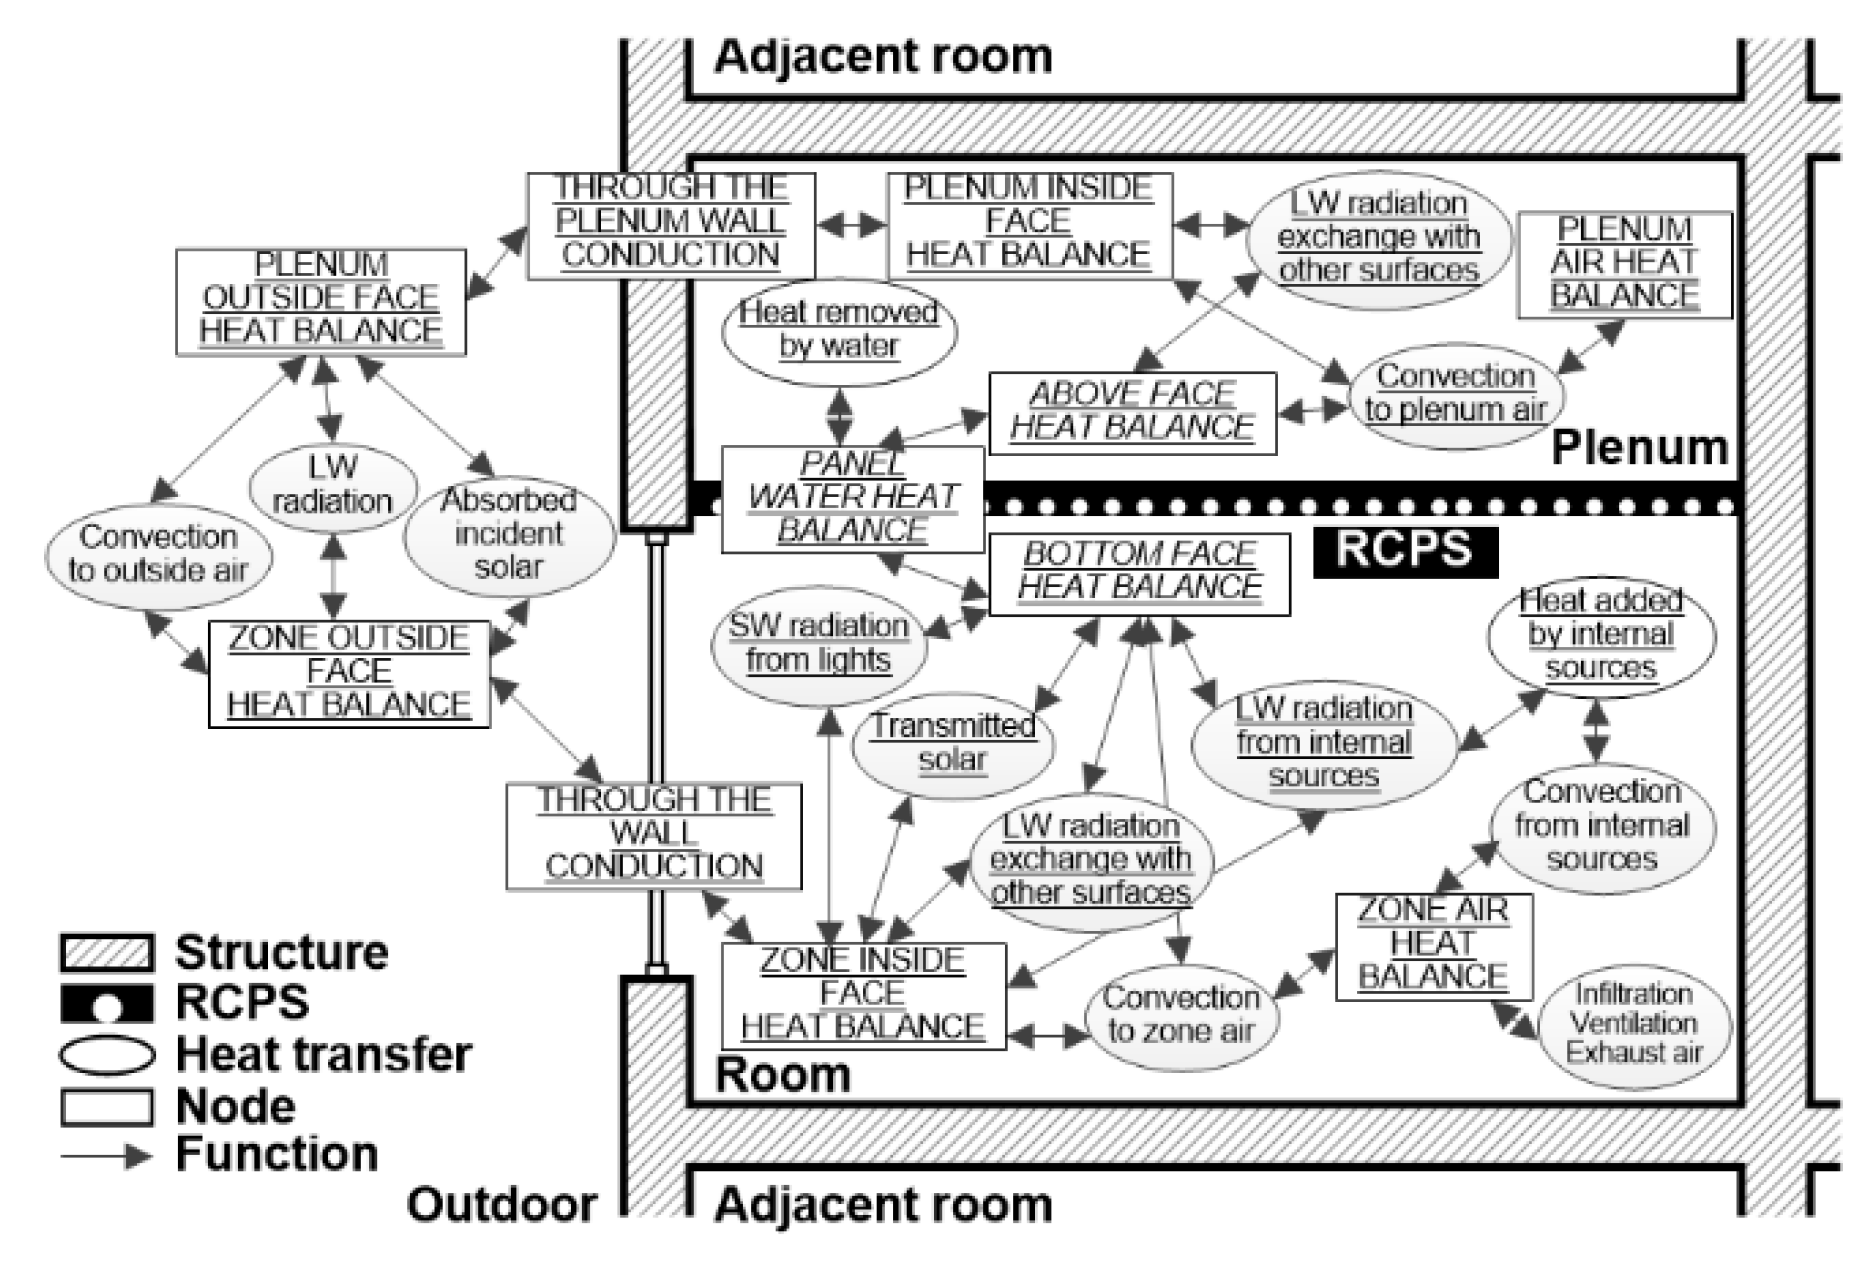
3.1. Heat Transfer Model of Room Equipped with CRCP

In order to establish the boundary condition for evaluating the cooling capacity of the CRCP, the influencing factors affecting the boundary conditions must be analyzed. In this study, the heat transfer process in the plenum and the room is analyzed by establishing the heat transfer model of the test room where the CRCP is installed based on the heat transfer model of ASHRAE (schematic of heat balance processes in zone) to figure out the influencing factors [15]. The heat transfer model in the space with the CRCP based on the ASHRAE model, consists of three parts: a plenum, a ceiling with a panel, and a room. In the actual building, the heat transfer occurs as shown in Figure 3. In the test room, convective heat transfer occurs between the room air and the bottom face of the ceiling, while radiative heat transfer occurs between the zone inside face and the bottom face of the ceiling. Finally, Figure 4 shows the simplified heat transfer model of the test room equipped with the CRCP.

3.2. Influencing Factors of Cooling Capacity

From the heat transfer model of a test room with CRCP, the influencing factors in the space are identified. Depending on the characteristics of these factors in the heat transfer model, the boundary condition influencing factors could be categorized into three groups: Group 1 Site and Building, Group 2 Wall Composition, and Group 3 Internal Heat Gain. By analyzing the factors belonging to each group and removing the redundant factors and simplifying them, the factors in each group can be set as in Table 4:
Group 1 includes the sol-air temperature and the number of surfaces exposed to outdoor air. Considering the situation of the test room in which the sun cannot be accessed, the outside temperature was a substantial source of the sol-air temperature and the temperature increased with the increase in the amount of heat introduced into the room through the walls. The number of faces exposed to the outdoors is a factor that can influence the temperature difference between the outside environment and the test room. Group 2 consists of the material and composition of the wall, the heat transmission coefficient, and the surface heat absorption rate [15]. The material and composition of the wall can be determined by the structure of the wall, the build of the material, and the presence of either outdoor or indoor insulation. The surface heat absorption rate is a coefficient associated with radiative heat transfer, and can be used to determine how the interior surface finishing of the wall affects the boundary conditions. Group 3 consists of a boundary condition influencing factor associated with the amount and the components of internal heat gain [15,16,17,18].

3.3. Values and Ranges of Influencing Factors

The values and ranges of these factors affect every heat transfer process and are derived as shown in Table 5 based on previous research and international standard analysis [3,4,7]. The sol-air temperature of Group 1 is the ambient temperature of the building located at 36 degrees north latitude. The wall heat transmission coefficient of 2.02 W/m2K is the minimum design requirement for the wall heat transfer rate and 0.15 W/m2K is the insulation standard for passive houses. Table 5 is the reference for setting the values, ranges, and values of each factor.
The Group 2 wall material is assumed to vary, whereas the rate of heat transfer is the same (e.g., concrete wall, insulation wall). In addition, the composition of the wall varies from the inside to the outside based on the construction method. By setting the heat transmission coefficient of all the walls to 2.02 W/m2K as in Table 6, only the influence of the boundary condition due to the wall structure, which is dependent on the material of the wall and the composition of the insulation, can be evaluated.
If the material and composition of the wall are the same, the boundary condition of the wall can vary as a result of the change in the thermal conductivity based on the wall thickness. Table 7 shows that the thermal conductivity of the wall utilized for this study varies from 2.02 to 0.15 W/m2K by intervals of 0.07.

4. Evaluation of Boundary Condition of the CRCP Equipped Room

4.1. Concept of the Boundary Condition Derivation Model

In order to derive the boundary condition based on the influence factor changes, the CRCP installed space was modeled via simulation. Table 8 shows that the boundary condition derivation model is implemented in six steps. In step 1, the simulated input variables were derived from the influencing factor and the range of values or values of each factor. In step 2, the room fitted with CRCP and the adjacent room were modeled as in Figure 5, such that it is possible to set the desired influence factors in the space to be analyzed. In step 3, a CRCP and an air conditioning system were modeled in the main room and the adjacent room to derive the thermal load. Specifically, the air conditioning system was operated while the CRCP remained off, and the thermal load removed by the air conditioning system was estimated. The cooling capacity of the CRCP necessary to maintain the set temperature can be estimated. In steps 4 and 5, the process of finding the correct supply water temperature to satisfy the set room temperature, was reiterated by simulation using a fixed flow rate. In step 6, the boundary condition of the test room where the CRCP is installed was finally derived when the CRCP was in operation.

4.2. Simulation Model for Evaluating Boundary Condition

The simulation model for evaluating boundary conditions was implemented with the aim of obtaining the boundary condition when the CRCP is in operation under the various influencing factors. EnergyPlus V8-1-0 and LabVIEW were used for simulation. EnergyPlus is suited for radiation and convection heat transfer on the surface, since a heat balance-based solution is possible [19]. The boundary condition based on the varying factors can be used as the output data. In addition, the iterative calculation processes to find the supply water mentioned in step 5 of Section 4.1 were performed by linking LabVIEW and EnergyPlus. The size of the space is 4.0 m (width) × 4.0 m (depth) × 3.0 m (height), as shown in Figure 5. The CRCP and air conditioning system are installed in each zone. In this study, the CRCP was modeled using a self-developed product. Figure 6 shows the system flow chart of the CRCP installed in the test room.

4.3. Simulation Results

4.3.1. Boundary Conditions on Wall Composition

  • Material and composition of wall
Table 9 shows the changes in surface temperature that were obtained in the analysis to determine the effect of the wall thickness and layer composition on the boundary conditions.
The walls with the same heat transmission coefficient transmit the same amount of heat regardless of the wall composition. Therefore, in the steady-state under the same sol-air temperature, the wall internal surface temperatures having the same heat transmission coefficients have the same surface temperature.
However, in the unsteady-state where the sol-air temperature changes in the daytime, the indoor surface temperature of the surface exposed to the outside air also changes due to the heat storage. Figure 7 shows that the surface temperature of the lightweight wall is similar to the profile of the sol-air temperature, unlike in heavy wall. Since the outside insulated wall is influenced more by the heat storage, the change in the surface temperature of the indoor surface is smaller than that of the inside insulated wall.
  • Heat transmission coefficient of wall
Table 10 shows the evaluation of the surface temperature of the wall with the same material properties composed of a single material. The change in the heat transmission coefficient was made by changing the thickness of the insulation from 0.017 to 0.3168 mm.
The surface temperature of the wall exposed to the outside air is decreased from 31.9 to 26.1 °C when the heat transmission coefficient of the wall changes from 2.02 to 0.15 W/m2K when the sol-air temperature is 60 °C (Figure 8). This tendency is as a result of heat transmission coefficient being the determinant factor in the surface temperature of the wall in steady state conditions. When the sol-air temperature is 30 °C the ambient temperature is not affected by the outside air, regardless of the heat transmission coefficient. Figure 9 shows that for the wall that is not exposed to the outside air, with exception of the front wall, the sol-air temperature has almost no influence.
  • Surface heat absorption rate of wall
Table 11 and Figure 10 show that the wall with high heat absorption rate on the surface exposed to the outside air has a large surface temperature change according to the change of the sol-air temperature.
The higher the surface absorption rate of the wall, the more the boundary conditions are affected by the outside air. When the sol-air temperature is less than 30 °C there is hardly any influence by the outside air, regardless of the surface heat absorption rate of the wall. However, as the ambient temperature increases, the influence of the surface heat absorption rate also increases.

4.3.2. Boundary Conditions on Site and Building

  • Sol-air temperature
In the wall with the same thermal conductivity, the inner surface temperature of the exposed surface is higher, since the sol-air temperature is higher (Table 12). As the sol-air temperature rises from 30 to 60 °C in the wall with 2.02 W/m2K, the indoor surface temperature of the exposed surface also rises from 25.7 to 31.9 °C Conversely, when the heat transmission coefficient of the wall is as low as the level of the passive house, the sol-air temperature has little effect on the surface temperature (Figure 11).
  • Number of surfaces exposed to outdoor air
The larger the number of exposed surfaces to the outside environment under the same sol-air temperature, the greater the increase in surface temperature. However, the temperature changes of each surface are very small (approximately less than 1 °C). The surface temperature increases linearly with the ambient temperature, regardless of the number of surfaces exposed to the outside environment.

4.3.3. Boundary Conditions on Internal Heat Gain

In order to understand the effect of internal heat gain on the boundary condition, the evaluation cases are presented as in Table 13, Table 14 and Table 15, and the surface temperature and the temperature change trend in each case were derived.
  • Amount of internal heat gain
As the internal heat gain increases, there is a corresponding surface temperature change (Figure 12). In particular, when the internal heat gain is 411 W, the surface temperature change is 1.8 °C as the radiation component of the internal heat gain changes from 0 to 1. However, when the internal heat gain is as small as 59 W, the surface temperature change due to the radiation component is within a maximum of 0.5. When the radiative component of the internal heat gain is between 0.6 and 0.7, it shows a constant surface temperature, regardless of the internal heat gain.
If there is no surface exposed to the outdoor environment, then the surface temperature will differ only by the effect of internal heat gain. In the case that the radiation component of internal heat gain is 1, the surface temperature tends to increase with increasing internal heat generation. Alternatively, when the radiation component of the internal heat is less or equal to 0.6, the amount of internal heat and the surface temperature tend to be inversely proportional to each other. The surface temperature difference according to the radiative component of the internal heat was maximum at 3.2 °C which is more than that of the outdoor exposed surface. This is because the amounts of long wave absorption and re-radiation of the surface due to the internal heat gain is increased.
  • Component of internal heat gain
The surface temperature based on the change in radiation and convection component through various amounts of internal heat gain of between 59 and 411 W was obtained. When the radiation component of the internal heat generation was 1, the surface temperature increased with the size of the internal heat generation. On the other hand, when the radiation component of the internal heat generation was 0, the magnitude was inversely proportional to the surface temperature of the internal heat generation. Figure 13 presents the surface temperature derivation results based on the size of internal heat generation.
In this case, since the change in surface temperature due to significant outdoor temperature can be excluded, it is possible to more accurately determine whether the change in the surface temperature estimated above is as a result of internal heat generation. In the case where there is no surface exposed to the outside environment, the amount of the internal heating increases, as shown in Figure 14. This tendency was least when the radiative component of the internal heat gain was 0.8.

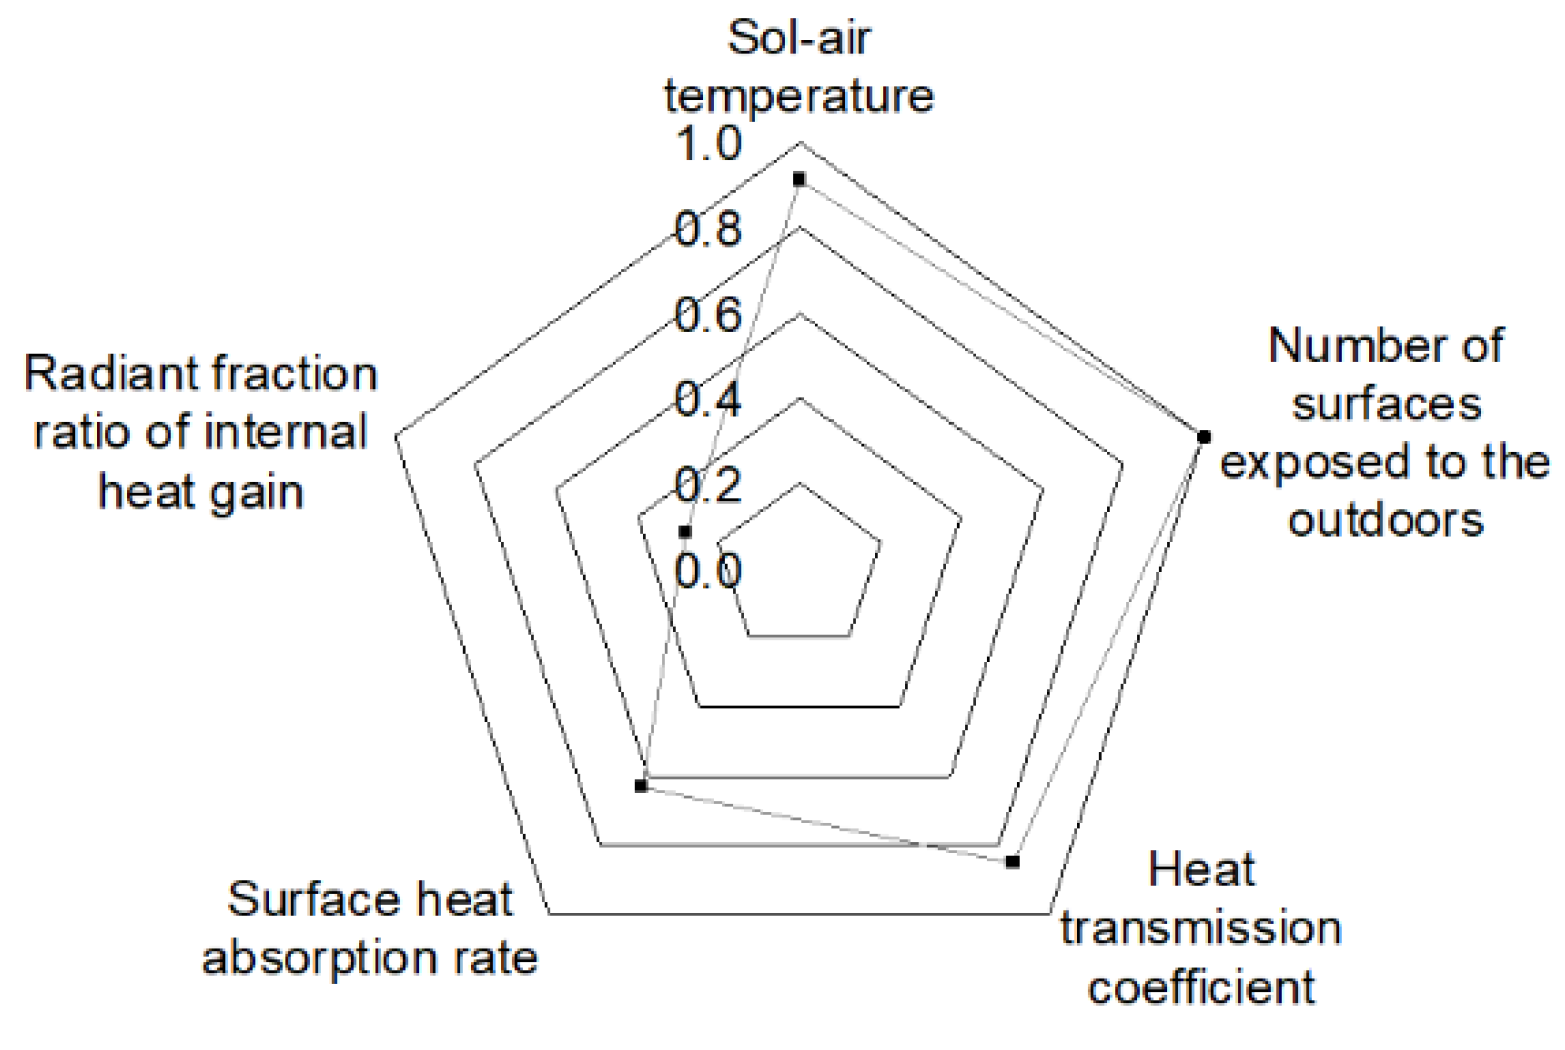
4.4. Impact Analysis of Factors

When evaluating the cooling capacity, the boundary conditions have different values and ranges for each influencing factor. Therefore, the impact of influencing factors on the boundary condition should be simulated. The effect of the boundary condition influencing factors on the indoor surface temperature is derived when the scale of the factors is equally set. Figure 15 shows that the values of influence factors belonging to Groups 1–3 are normalized from 0 to 1. When the value of each influence factor changes from 0 to 1, the change in surface temperature is also normalized from 0 to 1.
Figure 16 shows that the factors that have the greatest influence on the boundary condition of the CRCP installed space is the number of the surfaces exposed to the outdoor environment. When the number of surfaces exposed to the outside air rises from 0 to 2, there is significant increase in the surface temperature. Thus, the factor ‘number of surfaces exposed to the outdoors’ is assigned (1.0) as the reference of impact. Subsequently, the influences are significant in the following order: ‘sol-air temperature’ (impact 0.91), ‘heat transmission coefficient’ (impact 0.85), ‘surface heat absorption rate’ (impact 0.63), and ‘component of internal heat gain’ (impact 0.28). Since the influence of the surface temperature on the factors related to the site and building belonging to Group 1 is high, when evaluating the cooling capacity of the CRCP, the surface temperature should be set based on the adjacent space and the outside air temperature. The influencing factors, which are in Group 2, are less influential compared to Group 1. The internal heat gain factors of Group 3 have relatively little effects on the surface temperature. In a room with more than one surface exposed to the outside air, the thermal load caused by the external load is dominant, compared to the other factors.

5. Cooling Capacity According to Boundary Condition

5.1. Evaluation of Cooling Capacity According to Boundary Condition

In order to verify the boundary condition and the influences of the cooling capacity evaluation derived from this study, the cooling capacity of the panel was estimated using various boundary conditions. The simulation of the cooling capacity evaluation is based on the boundary condition of the panel modeled using the EnergyPlus simulation highlighted in Section 4.1. For the calculation of the cooling capacity, the evaluation case consisted of at least three different boundary conditions in the simulation model. The cases consist of the top two factors with the most influence. Finally, the cooling capacity of the panel could be calculated at each boundary condition. Table 16 shows the configuration of the simulation case.

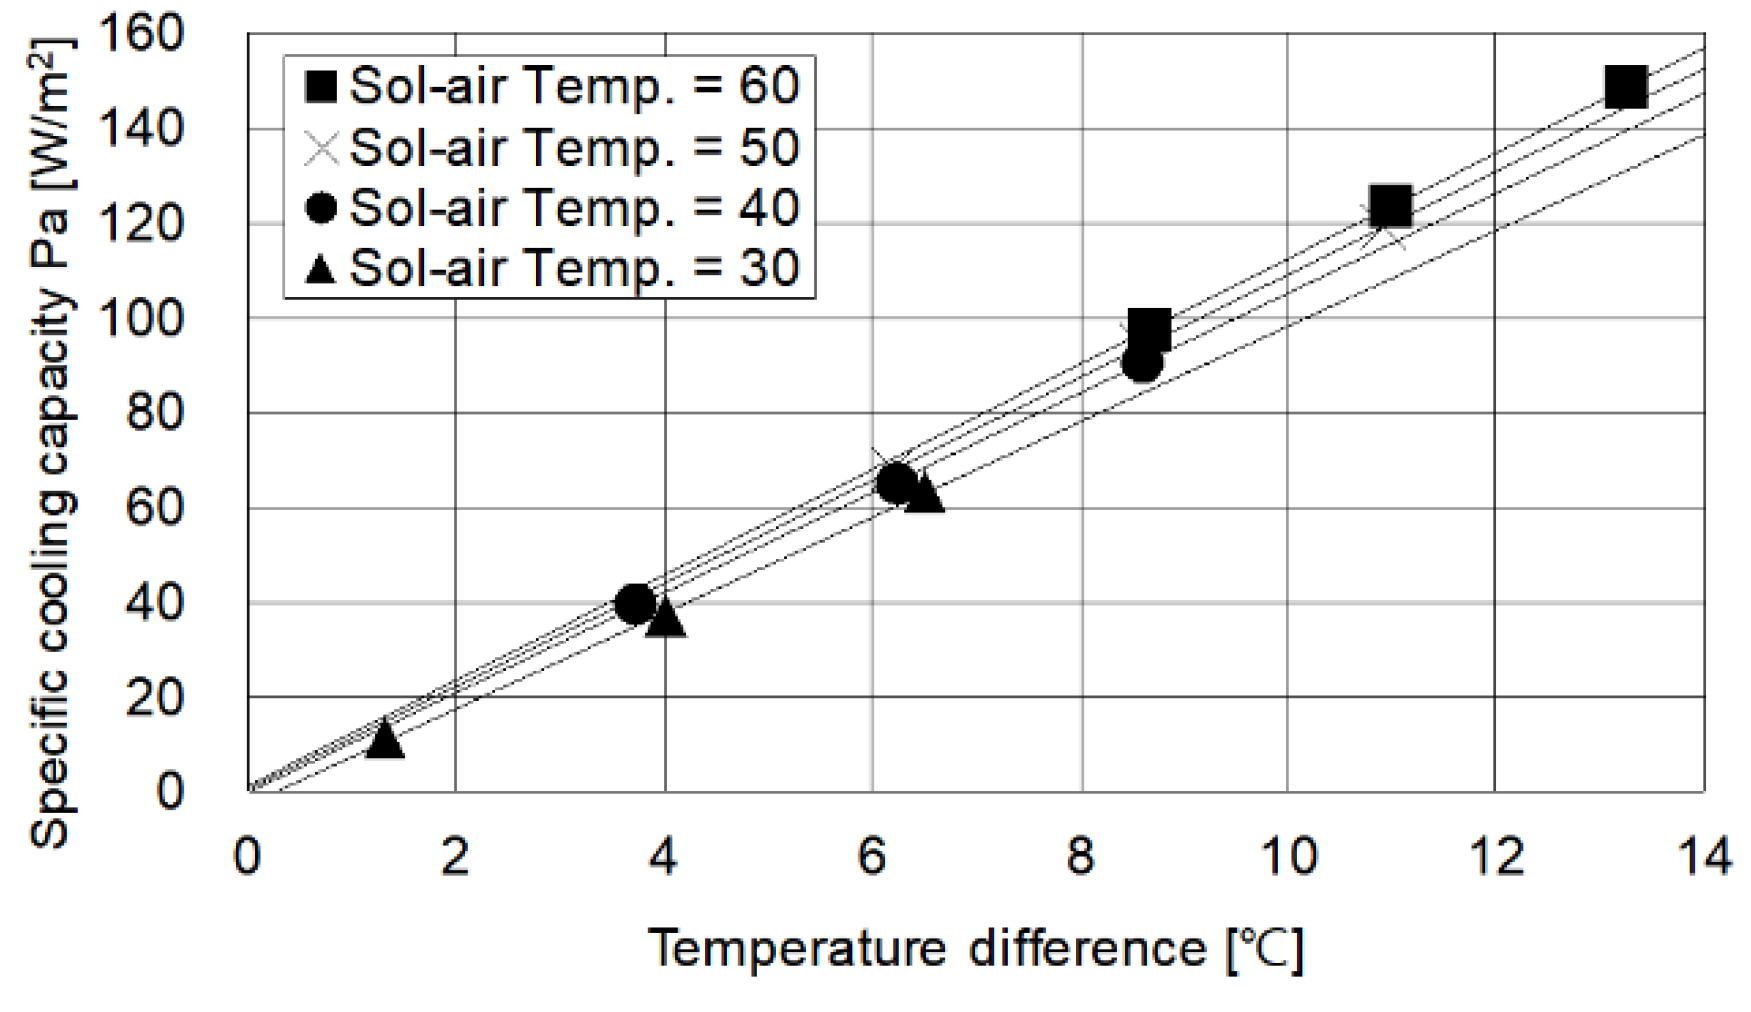
5.2. Evaluation Results of Cooling Capacity

When the sol-air temperature increases from 30 to 60 °C the nominal cooling capacity of the panel increases from 10.75 W/m2 to between 79.37 and 90.12 W/m2 (Figure 17). This tendency is more pronounced when the sol-air temperature is higher. When the number of exposed surfaces increases from 0 to 2, the nominal cooling capacity of the panel increases from 76.77 to 95.32 W/m2. As a result, the nominal cooling capacity of the panel is highly evaluated with the same CRCPs (Figure 18). When the number of exposed surfaces is three or more, the supply water temperature of the CRCP becomes excessively low, and the supply water-return temperature difference becomes larger than the design standard. In this case, it is impossible to eliminate all the thermal loads generated in the room by the panel only, and a secondary system is required.

5.3. Verification Experiment of Boundary Condition Derivation Model

In order to verify the simulation, the boundary condition for cooling capacity analysis was experimentally implemented using the same method, and the results were compared with the simulation results (Figure 19) [20,21,22,23]. Table 17 shows that the verified boundary conditions in the experiment includes the flow rate, supply water temperature, the wall surface temperature, and the internal heat gain [24,25].
Figure 20 shows that the cooling capacity of the CRCP is 100.1–153.0 W/m2 at a constant flow rate of 0.153 kg/s and a supply water temperature of 11–17 °C Table 18 shows that the nominal cooling capacity of CRCP is 93.2 W/m2. As a result of the experiment, the difference in cooling amount from the simulation model is approximately 3.08 W/m2. In the simulation, the cooling capacity of the CRCP may vary based on the modeling technique, in addition to the detail of adhesion between various members and joints constituting the panel [26]. The cooling capacity estimated in the simulation and experiment has an agreement of 96.7%. As a result of the experiment, the validity of the simulation model was verified.

6. Conclusions

In this study, the boundary condition for the evacuation of cooling capacity of the CRCP according to various boundary condition influencing factors was derived. According to the results of this study, it can be seen that the cooling capacity of the CRCP varies depending on the boundary conditions. In particular, when the space in which the CRCP is installed is exposed to a large area of outside air, and when the outdoor temperature is high, the nominal cooling capacity of the panel could be overestimated. The reason is that excessive radiation and convective heat transfer between the test room and the CRCP may occur. Particular attention should be paid to the calculation of the cooling capacity, especially when installing the ceiling radiant cooling panels adjacent to the walls exposed to the outside air. In addition, the same results are obtained even when the surface heat absorption rate and thermal conductivity of the wall are high. The results of this study, in which the cooling capacity of the CRCPs can be estimated in various boundary conditions, are expected to be a significant design basis for applying the panels. In the future, the airflow analysis of the space with CRCPs using CFD will be carried out according to the boundary conditions derived from this study [27].

Author Contributions

Conceptualization, S.-R.R. and M.-S.Y.; Data curation, G.-S.J.; Investigation, S.-H.P. and S.-R.R.; Methodology, S.-H.P.; Project administration, K.-W.K.; Software, S.-H.P. and D.-W.K.; Supervision, M.-S.Y. and K.-W.K.; Validation, S.-H.P. and G.-S.J.; Visualization, D.-W.K.; Writing—original draft, S.-H.P.; Writing—review and editing, S.-R.R. All authors have read and agreed to the published version of the manuscript.

Funding

This research was funded by the Korea Institute of Energy Technology Evaluation and Planning (KETEP) and the Ministry of Trade, Industry and Energy (MOTIE) of the Republic of Korea, grant number 20189220100060. The APC was funded by 20189220100060.

Acknowledgments

This work was supported by the Korea Institute of Energy Technology Evaluation and Planning (KETEP) and the Ministry of Trade, Industry and Energy (MOTIE) of the Republic of Korea.

Conflicts of Interest

The authors declare no conflict of interest.

References

  1. Imanari, T.; Omori, T.; Bogaki, K. Thermal comfort and energy consumption of the radiant ceiling panel system. Comparison with the conventional all-air system. Energy Build. 1999, 30, 167–175. [Google Scholar] [CrossRef]
  2. Antonopoulos, K.A.; Vrachopoulos, M.; Tzivanidis, C. Experimental evaluation of energy savings in air-conditioning using metal ceiling panels. Appl. Therm. Eng. 1998, 18, 1129–1138. [Google Scholar] [CrossRef]
  3. Fonseca, N. Experimental study of thermal condition in a room with hydronic cooling radiant surfaces. Int. J. Refrig. 2011, 34, 686–695. [Google Scholar] [CrossRef]
  4. ANSI/ASHRAE. Standard 138-2009, Method of Testing for Rating Ceiling Panels for Sensible Heating and Cooling; American National Standards Institute/American Society of Heating, Refrigerating and Air-Conditioning Engineers: Atlanta, GA, USA, 2009. [Google Scholar]
  5. Comité Européen de Normalisation (CEN). Water Based Surface Embedded Heating and Cooling Systems—Part 2: Floor Heating: Prove Methods for the Determination of the Thermal Output Using Calculation and Test Methods; Standard EN 1264-2; Comité Européen de Normalisation: Brussels, Belgium, 2012. [Google Scholar]
  6. Babiak, J.; Olesen, B.W.; Petras, D. Low Temperature Heating and High Temperature Cooling: REHVA Guidebook No. 7; Federation of European Heating, Ventilation and Air Conditioning Associations: Brussels, Belgium, 2007. [Google Scholar]
  7. ASHRAE. 2016 ASHRAE Handbook -HVAC Systems and Equipment, Ch.6 Radiant Heating and Cooling; American Society of Heating, Refrigerating and Air-Conditioning Engineers: Atlanta, GA, USA, 2016. [Google Scholar]
  8. LBNL. Development of a Simulation Tool to Evaluate the Performance of Radiant Cooling Ceilings; CIEE Report; LBNL: Berkeley, CA, USA, 1995; p. 138. [Google Scholar]
  9. Kochendorfer, C. Standardized testing of cooling panels and their use in system planning. Ashrae Trans. Symp. 1996, 102, 651–658. [Google Scholar]
  10. Fonseca, N.; Cuevas, C.; Lemort, V. Radiant ceiling systems coupled to its environment part 1: Experimental analysis. Appl. Therm. Eng. 2010, 30, 2187–2195. [Google Scholar] [CrossRef]
  11. De Carli, M.; Scarpa, M.; Tomasi, R.; Zarrella, A. A numerical model for the thermal balance of rooms equipped with radiant systems. Build. Environ. 2012, 57, 126–144. [Google Scholar] [CrossRef]
  12. Tian, Z.; Yin, X.; Ding, Y.; Zhang, C. Research on the actual cooling performance of ceiling radiant panel. Energy Build. 2012, 47, 636–642. [Google Scholar] [CrossRef]
  13. Comité Européen de Normalisation (CEN). Ventilation for Buildings–Chilled Ceilings–Testing and Rating Offers a Testing Method for Chilled Ceilings; British Standard EN14240:2004; Comité Européen de Normalisation: Brussels, Belgium, 2004. [Google Scholar]
  14. Nordic. Ceiling Cooling Systems: Cooling Capacity (NT VVS 078); Nordic: Oslo, Norway, 2001. [Google Scholar]
  15. ASHRAE. 2013 Handbook -Fundamentals, Ch. 18 Nonresidential Cooling and Heating Load Calculations; American Society of Heating, Refrigerating and Air-Conditioning Engineers: Atlanta, GA, USA, 2013. [Google Scholar]
  16. Mills, A.F. Basic Heat & Mass Transfer; Prentice Hall: Saddle River, NJ, USA, 1999. [Google Scholar]
  17. Chantrasrisalai, C.; Fisher, D.E. Lighting Heat Gain Distribution in Buildings (RP-1282); ASHRAE Research Project, Final Report; ASHRAE: Atlanta, GA, USA, 2006. [Google Scholar]
  18. Winkins, C.; Hosni, M.H. Heat gain from office equipment. Ashrae J. 2000, 42, 33–44. [Google Scholar]
  19. LBNL. ENERGYPLUS Input Output Reference. LBNL 2013, 11, 1–3. [Google Scholar]
  20. Ryu, S.R.; Rhee, K.N.; Yeo, M.S.; Kim, K.W. Strategies for flow rate balancing in radiant floor heating systems. Build. Res. Inf. 2008, 36, 625–637. [Google Scholar] [CrossRef]
  21. Jeong, J.W.; Mumma, S.A. Ceiling radiant cooling panel capacity enhanced by mixed convection in mechanically ventilated spaces. Appl. Therm. Eng. 2003, 23, 2293–2306. [Google Scholar] [CrossRef]
  22. Jeong, J.W.; Mumma, S.A. Simplified cooling capacity estimation model for top insulated metal ceiling radiant cooling panels. Appl. Therm. Eng. 2004, 24, 2055–2072. [Google Scholar] [CrossRef]
  23. Park, S.H.; Kim, D.W.; Yeo, M.S.; Kim, K.W. An Experiment for Estimating the Cooling Capacity of the Radiant Ceiling Panel System. J. Archit. Inst. Korea Plan. Des. 2014, 30, 267–276. [Google Scholar] [CrossRef]
  24. Kim, T.Y.; Kato, S.; Murakami, S.; Rho, J.W. Study on indoor thermal environmental of office space controlled by cooling panel system using field measurement and the numerical simulation. Build. Environ. 2005, 40, 301–310. [Google Scholar] [CrossRef]
  25. Lim, J.H.; Jo, J.H.; Kim, Y.Y.; Yeo, M.S.; Kim, K.W. Application of the control methods for radiant floor cooling system in residential buildings. Build. Environ. 2006, 41, 60–73. [Google Scholar] [CrossRef]
  26. Miriel, J.; Serres, L.; Trombe, A. Radiant ceiling panel heating-cooling systems: Experimental and simulated study of the performances, thermal comfort and energy consumptions. Appl. Therm. Eng. 2002, 22, 1861–1873. [Google Scholar] [CrossRef]
  27. Shin, M.S.; Rhee, K.N.; Park, S.H.; Yeo, M.S.; Kim, K.W. Enhancement of cooling capacity through open-type installation of cooling radiant ceiling panel systems. Build. Environ. 2019, 148, 417–432. [Google Scholar] [CrossRef]
Figure 1. Evaluation of the cooling capacity of the Cooling Radiant Ceiling Panel (CRCP): (a) cooling capacity of the CRCP; (b) over or underestimated cooling capacity.
Energies 13 01684 g001
Figure 2. Cooling capacity evaluation regarding boundary condition.
Energies 13 01684 g002
Figure 3. Heat transfer in a space equipped with CRCP.
Energies 13 01684 g003
Figure 4. Simplified heat transfer model of test room equipped with CRCP.
Energies 13 01684 g004
Figure 5. Modeling of room and CRCP.
Energies 13 01684 g005
Figure 6. Flow chart representing the system configuration of the simulation model.
Energies 13 01684 g006
Figure 7. Surface temperature for the material and composition of wall (Unsteady-state).
Energies 13 01684 g007
Figure 8. Sol-air temperature and surface temperature for the heat transmission coefficient of the wall.
Energies 13 01684 g008
Figure 9. Heat transmission coefficient and surface temperature for each wall (Case U_2.02, sol-air temp = 60 °C).
Energies 13 01684 g009
Figure 10. Sol-air temperature and surface temperature for the surface heat absorption rate of the wall.
Energies 13 01684 g010
Figure 11. Wall heat transmission coefficient and surface temperature for sol-air temperature.
Energies 13 01684 g011
Figure 12. Radiant fraction and surface temperature for internal heat gain.
Energies 13 01684 g012
Figure 13. Internal heat gain and surface temperature for radiant fraction (exposed to outdoor air).
Energies 13 01684 g013
Figure 14. Internal heat gain and surface temperature for radiant fraction (unexposed to outdoor air).
Energies 13 01684 g014
Figure 15. Scale of influencing factors.
Energies 13 01684 g015
Figure 16. Impact of factors on boundary condition.
Energies 13 01684 g016
Figure 17. Cooling capacity according to sol-air temperature.
Energies 13 01684 g017
Figure 18. Cooling capacity according to adjacent to outdoor air.
Energies 13 01684 g018
Figure 19. Experimental evaluation of the cooling capacity of the CRCP: (a) Cooling Radiant Ceiling Panel; (b) test cell wall distribution system; (c) CRCP joint and distribution system; (d) ceiling and floor distribution system; (e) indoor of test cell with wall temperature control; (f) heat source for CRCP and walls.
Energies 13 01684 g019
Figure 20. Test result for the cooling capacity of the CRCP.
Energies 13 01684 g020
Table 1. Type of Cooling Radiant Ceiling Panel.
ResearchSection TypeConceptual Diagram
ASHRAEA temperature-controlled surface is referred to as a radiant panel if 50% or more of the design heat transfer on the temperature-controlled surface takes place via thermal radiation [7]. Energies 13 01684 i001
REHVARadiant heating and cooling systems are panels with integrated pipes suspended under the ceiling [6].
This studyThe Cooling Radiant Ceiling Panel hangs on the ceiling and exchanges thermal radiation by radiant heat transfer.
Since the piping is biased in the room side direction, radiation occurs in a target space.
Energies 13 01684 i002
Table 2. Concept of cooling capacity of CRCP in the Lawrence Berkeley National Laboratory (LBNL) study and American Society of Heating, Refrigerating and Air-Conditioning Engineers (ASHRAE).
ContentsLBNL Study [8]ASHRAE [7]
ConceptHeat exchange among temperature-controlled (active) surfaces, room surfaces, and room air
Sum of convective and radiative heat transfer
Equation q c = h c ( t a i r t s u r f a c e )
q r = σ F a F e [ ( T r 100 ) 4 ( T p 100 ) 4 ]
q c = 2.42 | t p t a | 0.31 ( t p t a ) D e 0.08
q r = J p j = 1 n F p j J j
Symbol q : sum of convective and radiant heat transfer
q c : heat transfer by convection
q r : heat transfer by radiation
h c : convective coefficient
t a i r : room air temperature
t s u r f a c e : surface temperature
σ : Stefan–Boltzmann constant
F a : configuration factor
F e : emissivity factor
T r : mean radiant temperature (MRT) of unconditioned surface
T p : mean radiant temperature (MRT) of cooled surface
t p : effective temperature of temperature-controlled surface
t a : indoor space dry-bulb air temperature
D e : equivalent diameter of panel
J p : total radiosity leaving or reaching panel surface
F p j : radiation angle factor between panel surface and another surface in room
J j : radiosity from or to another surface in room
n : number of surfaces in room other than panels
Table 3. Previous studies on irregular surrounding conditions.
Author or OrganizationIssues
C. Kochendorfer [9]Evaluates the cooling capacity in an environment where there is no heat exchange with the outside
The amount of cooling capacity may vary, based on the surface temperature of the wall
N. Fonseca [3]
N. Fonseca et al. [10]
Estimates the cooling capacity of the panel based on the external load
M. De Carli et al. [11]The cooling capacity of the ceiling radiation panel is estimated using unsteady state analysis in consideration of the external load
Z. Tian et al. [12]The cooling capacity of the panel is calculated based on the window to the wall ratio considering the influence of the window-installed envelope
EN14240 [13]Since the material enclosing the CRCP could affect the cooling capacity of the panel, the adiabatic boundary condition is maintained to prevent the influence of the envelope
NT VVS 078 [14]Same as EN14240
Table 4. Group and influencing factors in each group.
GroupsInfluencing Factors
Group 1: Site and buildingSol-air temperature
Number of surfaces exposed to the outdoors
Group 2: Wall compositionMaterial and composition of wall
Heat transmission coefficient
Surface heat absorption rate
Group 3: Internal heat gainComponent of internal heat gain
Amount of internal heat gain
Table 5. Value of influencing factors.
GroupsFactorsUnitValue and Range
Group 1Sol-air temperature(°C)30
40
50
60
Number of surfaces exposed to the outdoors(-)1
2
3
4
Group 2Material and composition of wall(-)Lightweight
Heavyweight
Outside-insulation
Inside-insulation
Heat transmission coefficient(W/m2K)2.02
0.66
0.39
0.22
0.15
Surface heat absorption rate(-)0.1
0.6
0.9
Group 3Component of internal heat gain: Radiant Fraction(-)1.0
0.6
0.0
Amount of internal heat gain(W)59
235
411
Table 6. Material and composition of wall.
FactorsComposition (Outside to Inside)Specifications
ThicknessSpecific HeatConductivitySurface Heat Absorption RateHeat Transmission Coefficient
(m)(J/kgK)(W/mK)(-)(W/m2K)
Inside insulated wallConcrete 1000.1836.81.3110.12.02
Insulation 130.0132650.0490.1
Outside insulated wallInsulation 130.0132650.0490.12.02
Concrete 1000.1836.81.3110.1
Concrete wallConcrete 4500.45836.81.3110.12.02
Insulation wallInsulation 170.0172650.0490.12.02
Table 7. Heat transmission coefficient of wall.
FactorsComposition (Outside to Inside)Specifications
ThicknessSpecific HeatConductivitySurface Heat Absorption RateHeat Transmission Coefficient
(m)(J/kgK)(W/mK)(-)(W/m2K)
U_2.02Insulation 316.80.31682650.0490.12.02
U_0.66Insulation 216.80.21682650.0490.10.66
U_0.39Insulation 116.80.11682650.0490.10.39
U_0.22Insulation 66.80.06682650.0490.10.22
U_0.15Insulation 170.01682650.0490.10.15
Table 8. Modeling process to evaluate the boundary condition.
StepModeling Process
1Set simulation input variables
2Configure the main room and the adjacent room to set the desired influencing factors on the space
3Derive the thermal load to be eliminated to maintain the space to the set-point room temperature
4Determine the supply water temperature and water flow rate to eliminate the thermal load
5Calculate and reset the supply water temperature to maintain the set point room temperature
6Evaluate the boundary condition during the operation of the CRCP
Table 9. Cases for material and composition of wall.
CasesGroup 1Group 2Group 3
Sol-Air Temp.Number of Faces Exposed to Outdoor AirMaterial and CompositionThicknessHeat Transmission CoefficientSurface Heat Absorption RateRadiant FractionHeat Amount
(°C)(-)(-)(m)(W/m2K)(-)(-)(W)
In_Ins601Concrete 100 (Outside)0.12.020.10.6411
50
40Insulation 13 (Inside)0.013
30
Out_Ins601Insulation 13 (Outside)0.0132.020.10.6411
50
40Concrete 100 (Inside)0.1
30
Conc_Wall601Concrete 4500.452.020.10.6411
50
40
30
Ins_Wall601Insulation 170.0172.020.10.6411
50
40
30
Table 10. Cases for heat transmission coefficient of wall.
CasesGroup 1Group 2Group 3
Sol-Air Temp.Number of Faces Exposed to Outdoor AirMaterial and CompositionThicknessHeat Transmission CoefficientSurface Heat Absorption RateRadiant FractionHeat Amount
(°C)(-)(-)(m)(W/m2K)(-)(-)(W)
U_2.02601Insulation 170.0172.020.10.6411
50
40
30
U_0.66601Insulation 66.80.06680.660.10.6411
50
40
30
U_0.39601Insulation 116.80.11680.390.10.6411
50
40
30
U_0.22601Insulation 216.8 0.21680.220.10.6411
50
40
30
U_0.15601Insulation 316.90.31680.150.10.6411
50
40
30
Table 11. Cases for the surface heat absorption rate of the wall.
CasesGroup 1Group 2Group 3
Sol-Air Temp.Number of Faces Exposed to Outdoor AirMaterial and CompositionThickness Heat Transmission CoefficientSurface Heat Absorption RateRadiant FractionHeat Amount
(°C)(-)(-)(m)(W/m2K)(-)(-)(W)
Abs._0.1601Insulation 170.0172.020.10.6411
50
40
30
Abs._0.6601Insulation 17 0.0172.020.60.6411
50
40
30
Abs._0.9601Insulation 170.0172.020.90.6411
50
40
30
Table 12. Cases for sol-air temperature.
CasesGroup 1Group 2Group 3
Sol-Air Temp.Number of Faces Exposed to Outdoor AirMaterial and CompositionThicknessHeat Transmission CoefficientSurface Heat Absorption RateRadiant FractionHeat Amount
(°C)(-)(-)(m)(W/m2K)(-)(-)(W)
Sol_60601Insulation 170.0172.020.10.6411
235
59
Sol_50501Insulation 66.80.06680.660.10.6411
235
59
Sol_40401Insulation 116.80.11680.390.10.6411
235
59
Sol_30301Insulation 216.8 0.21680.220.10.6411
235
59
Table 13. Cases for amount of internal heat gain.
CasesGroup 1Group 2Group 3
Sol-Air Temp.Number of Faces Exposed to Outdoor AirMaterial and CompositionThicknessHeat Transmission CoefficientSurface Heat Absorption RateRadiant FractionHeat Amount
(°C)(-)(-)(m)(W/m2K)(-)(-)(W)
IHG._5960 1Insulation 170.0172.020.10.059
0.2
0.4
0.6
0.8
1.0
IHG._0.660 1Insulation 17 0.0172.020.10.0235
0.2
0.4
0.6
0.8
1.0
IHG._0.9601Insulation 170.0172.020.10.0411
0.2
0.4
0.6
0.8
1.0
Table 14. Cases for component of internal heat gain (exposed to outdoor air).
CasesGroup 1Group 2Group 3
Sol-Air Temp.Number of Faces Exposed to Outdoor AirMaterial and CompositionThicknessHeat Transmission CoefficientSurface Heat Absorption RateRadiant FractionHeat Amount
(°C)(-)(-)(m)(W/m2K)(-)(-)(W)
Rad._0.0601Insulation 170.0172.020.10.0411
235
59
Rad._0.2601Insulation 170.0172.020.10.2411
235
59
Rad._0.4601Insulation 170.0172.020.10.4411
235
59
Rad._0.6601Insulation 170.0172.020.10.6411
235
59
Rad._0.8601Insulation 170.0172.020.10.8411
235
59
Rad._1.0601Insulation 170.0172.020.11.0411
235
59
Table 15. Cases for component of internal heat gain (unexposed to outdoor air).
CasesGroup 1Group 2Group 3
Sol-air Temp.Number of Faces Exposed to Outdoor AirMaterial and CompositionThicknessHeat Transmission CoefficientSurface Heat Absorption RateRadiant FractionHeat Amount
(°C)(-)(-)(m)(W/m2K)(-)(-)(W)
Rad._0.0-0Insulation 170.0172.020.10.0411
235
59
Rad._0.2-0Insulation 170.0172.020.10.2411
235
59
Rad._0.4-0Insulation 170.0172.020.10.4411
235
59
Rad._0.6-0Insulation 170.0172.020.10.6411
235
59
Rad._0.8-0Insulation 170.0172.020.10.8411
235
59
Rad._1.0-0Insulation 170.0172.020.11.0411
235
59
Table 16. Cooling capacity according to site and building.
CasesGroup 1Group 2Group 3
Sol-Air Temp.Number of Faces Exposed to Outdoor AirMaterial and CompositionThick-nessHeat Transmission CoefficientSurface Heat Absorption RateRadi-ant Frac-tionHeat AmountNominal Cooling Capacity
(°C)(-)(-)(m)(W/m2K)(-)(-)(W)(W/m2)
Adj._0600Insulation 170.0172.020.10.641176.77
235
59
Adj._1601Insulation 170.0172.020.10.641190.12
235
59
Adj.2602Insulation 170.0172.020.10.641195.32
235
59
Sol_60601Insulation 170.0172.020.10.641190.12
235
59
Sol_50501Insulation 170.0172.020.10.641187.60
235
59
Sol_40401Insulation 170.0172.020.10.641183.95
235
59
Sol_30301Insulation 170.0172.020.10.641179.37
235
59
Table 17. Boundary condition for cooling capacity evaluation experiments.
Cases Cooling 1Cooling 2Cooling 3
Boundary conditionUnitResults
Water flow rate(kg/s)0.1530.1530.153
TemperatureInlet water(°C)11.414.016.7
Outlet water(°C)14.917.019.0
Globe air (height 1.1 m)(°C)27.026.826.5
Front wall surface(°C)32.532.632.6
Back wall surface(°C)25.425.425.5
Left wall surface(°C)25.425.425.5
Right wall surface(°C)25.425.425.5
Floor(°C)25.025.926.0
Ceiling(°C)24.025.526.0
Plenum air(°C)24.925.025.0
Internal heat gain(W)41123559
TemperatureTemp. rise(°C)3.562.962.34
Temp. difference(°C)13.8511.308.66
Cooling capacityNominal(W/m2)153.02127.23100.13
Total amount(W)1088905712
Table 18. Nominal cooling capacity of CRCP.
Panel NameNominal Cooling CapacityCharacteristic Coefficient kExponential Coefficient n
(W/m2)(-)(-)
CRCP93.2014.2530.903

