Thermal Effects of Natural Gas and Syngas Co-Firing System on Heat Treatment Process in the Preheating Furnace

 , ,
, , 
Abstract
:1. Introduction
2. Materials and Methods
2.1. Model Setup
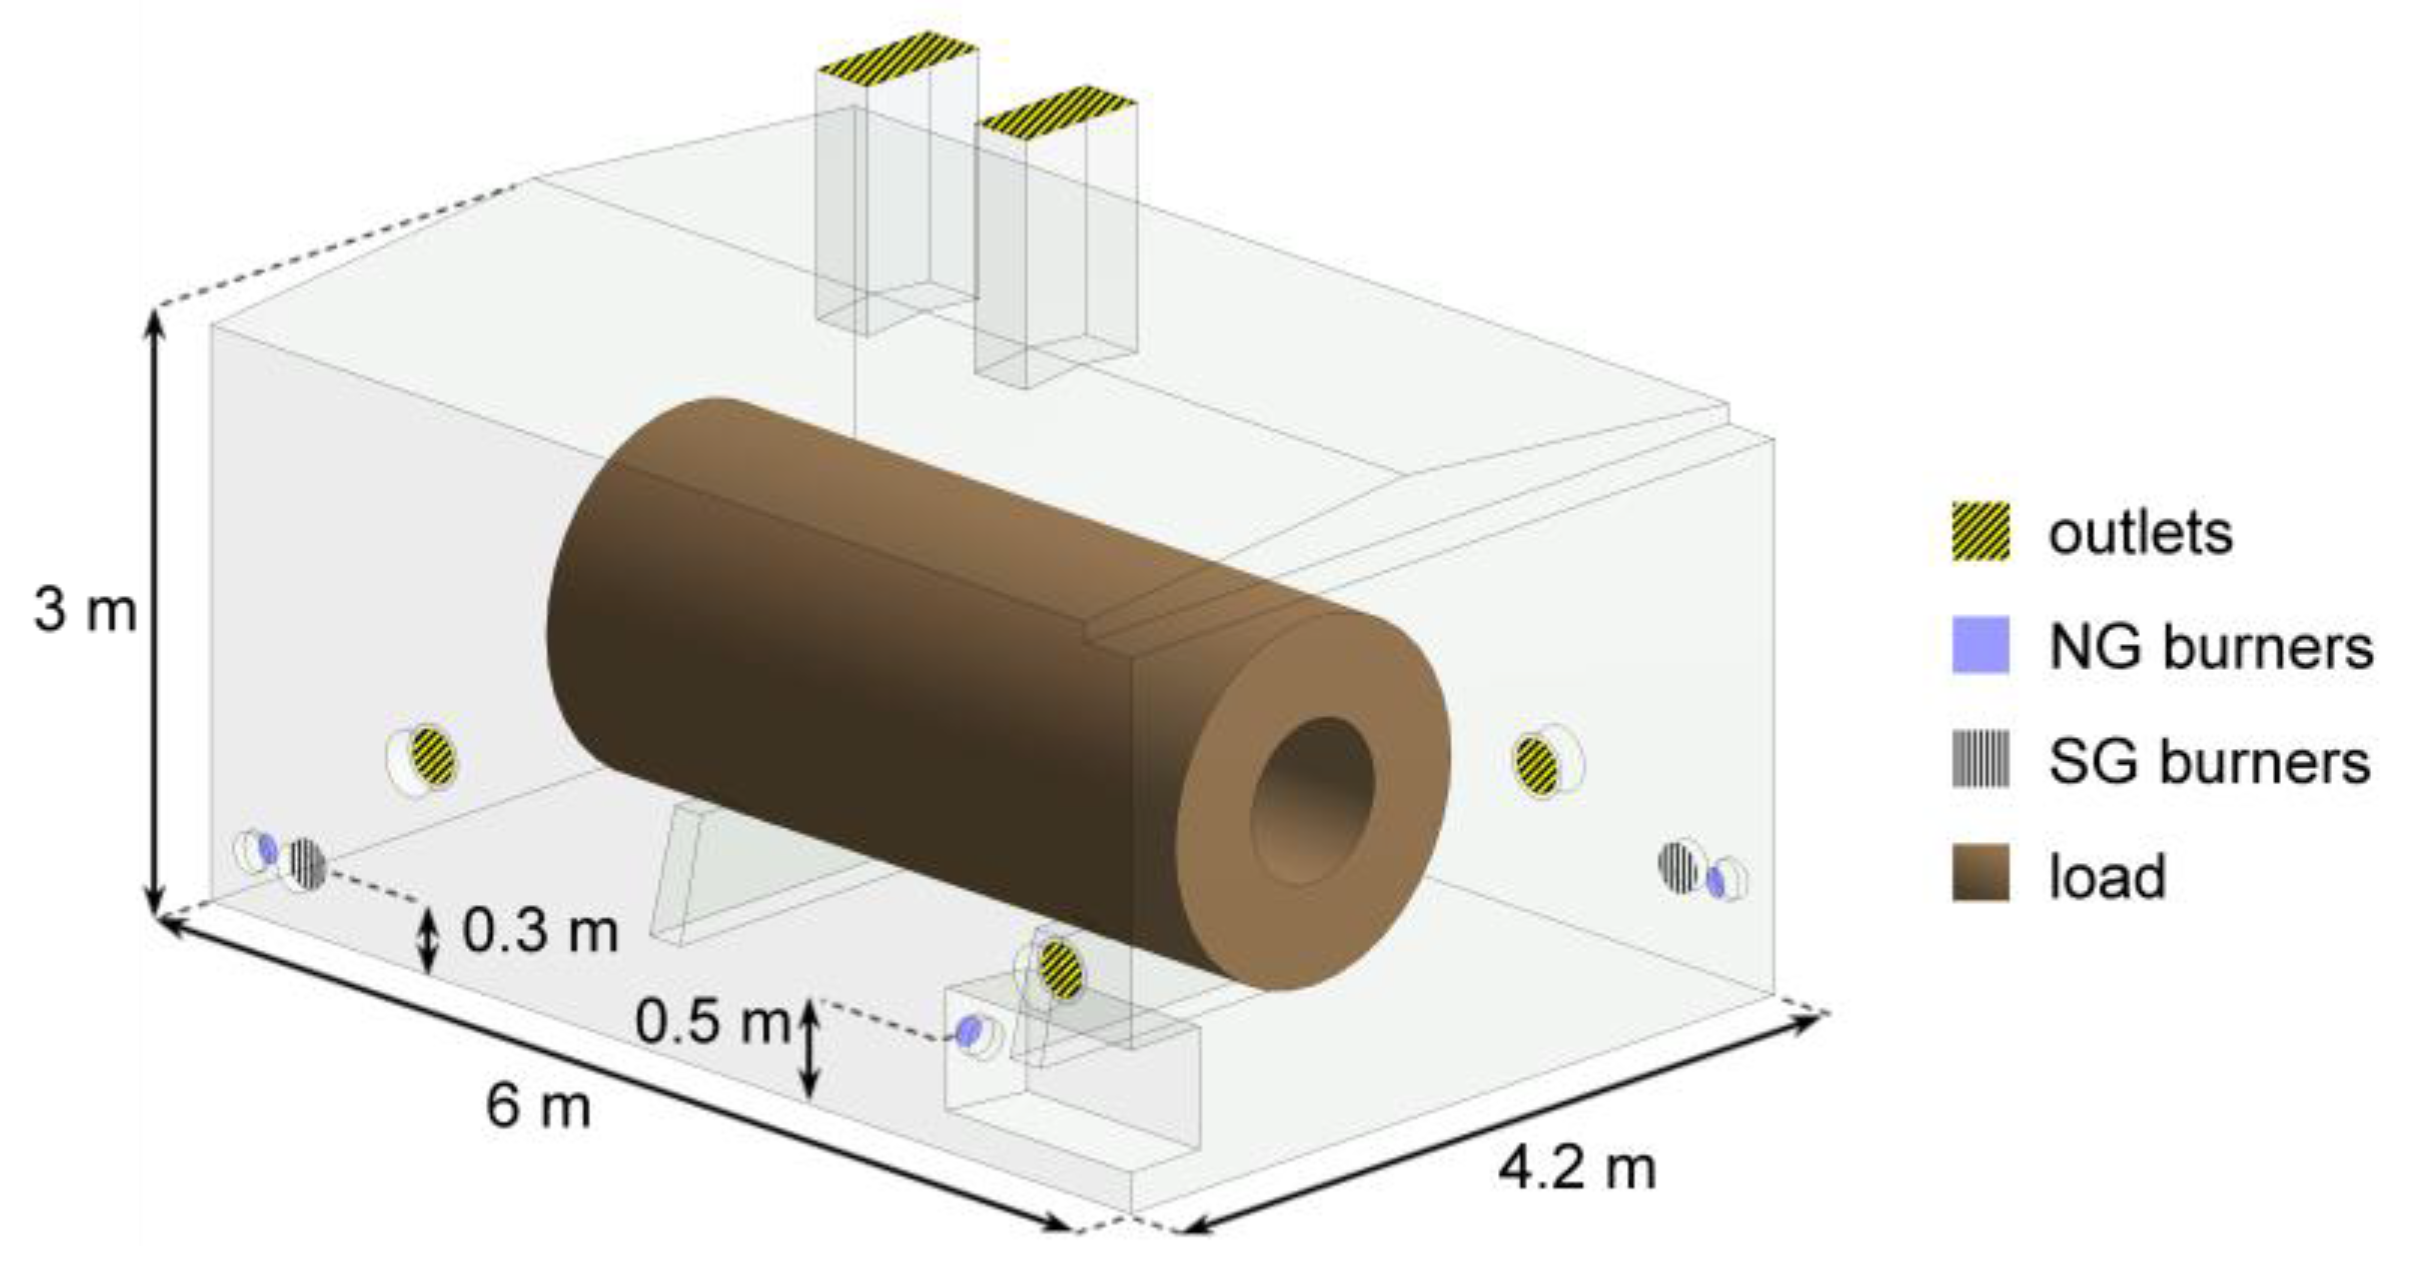
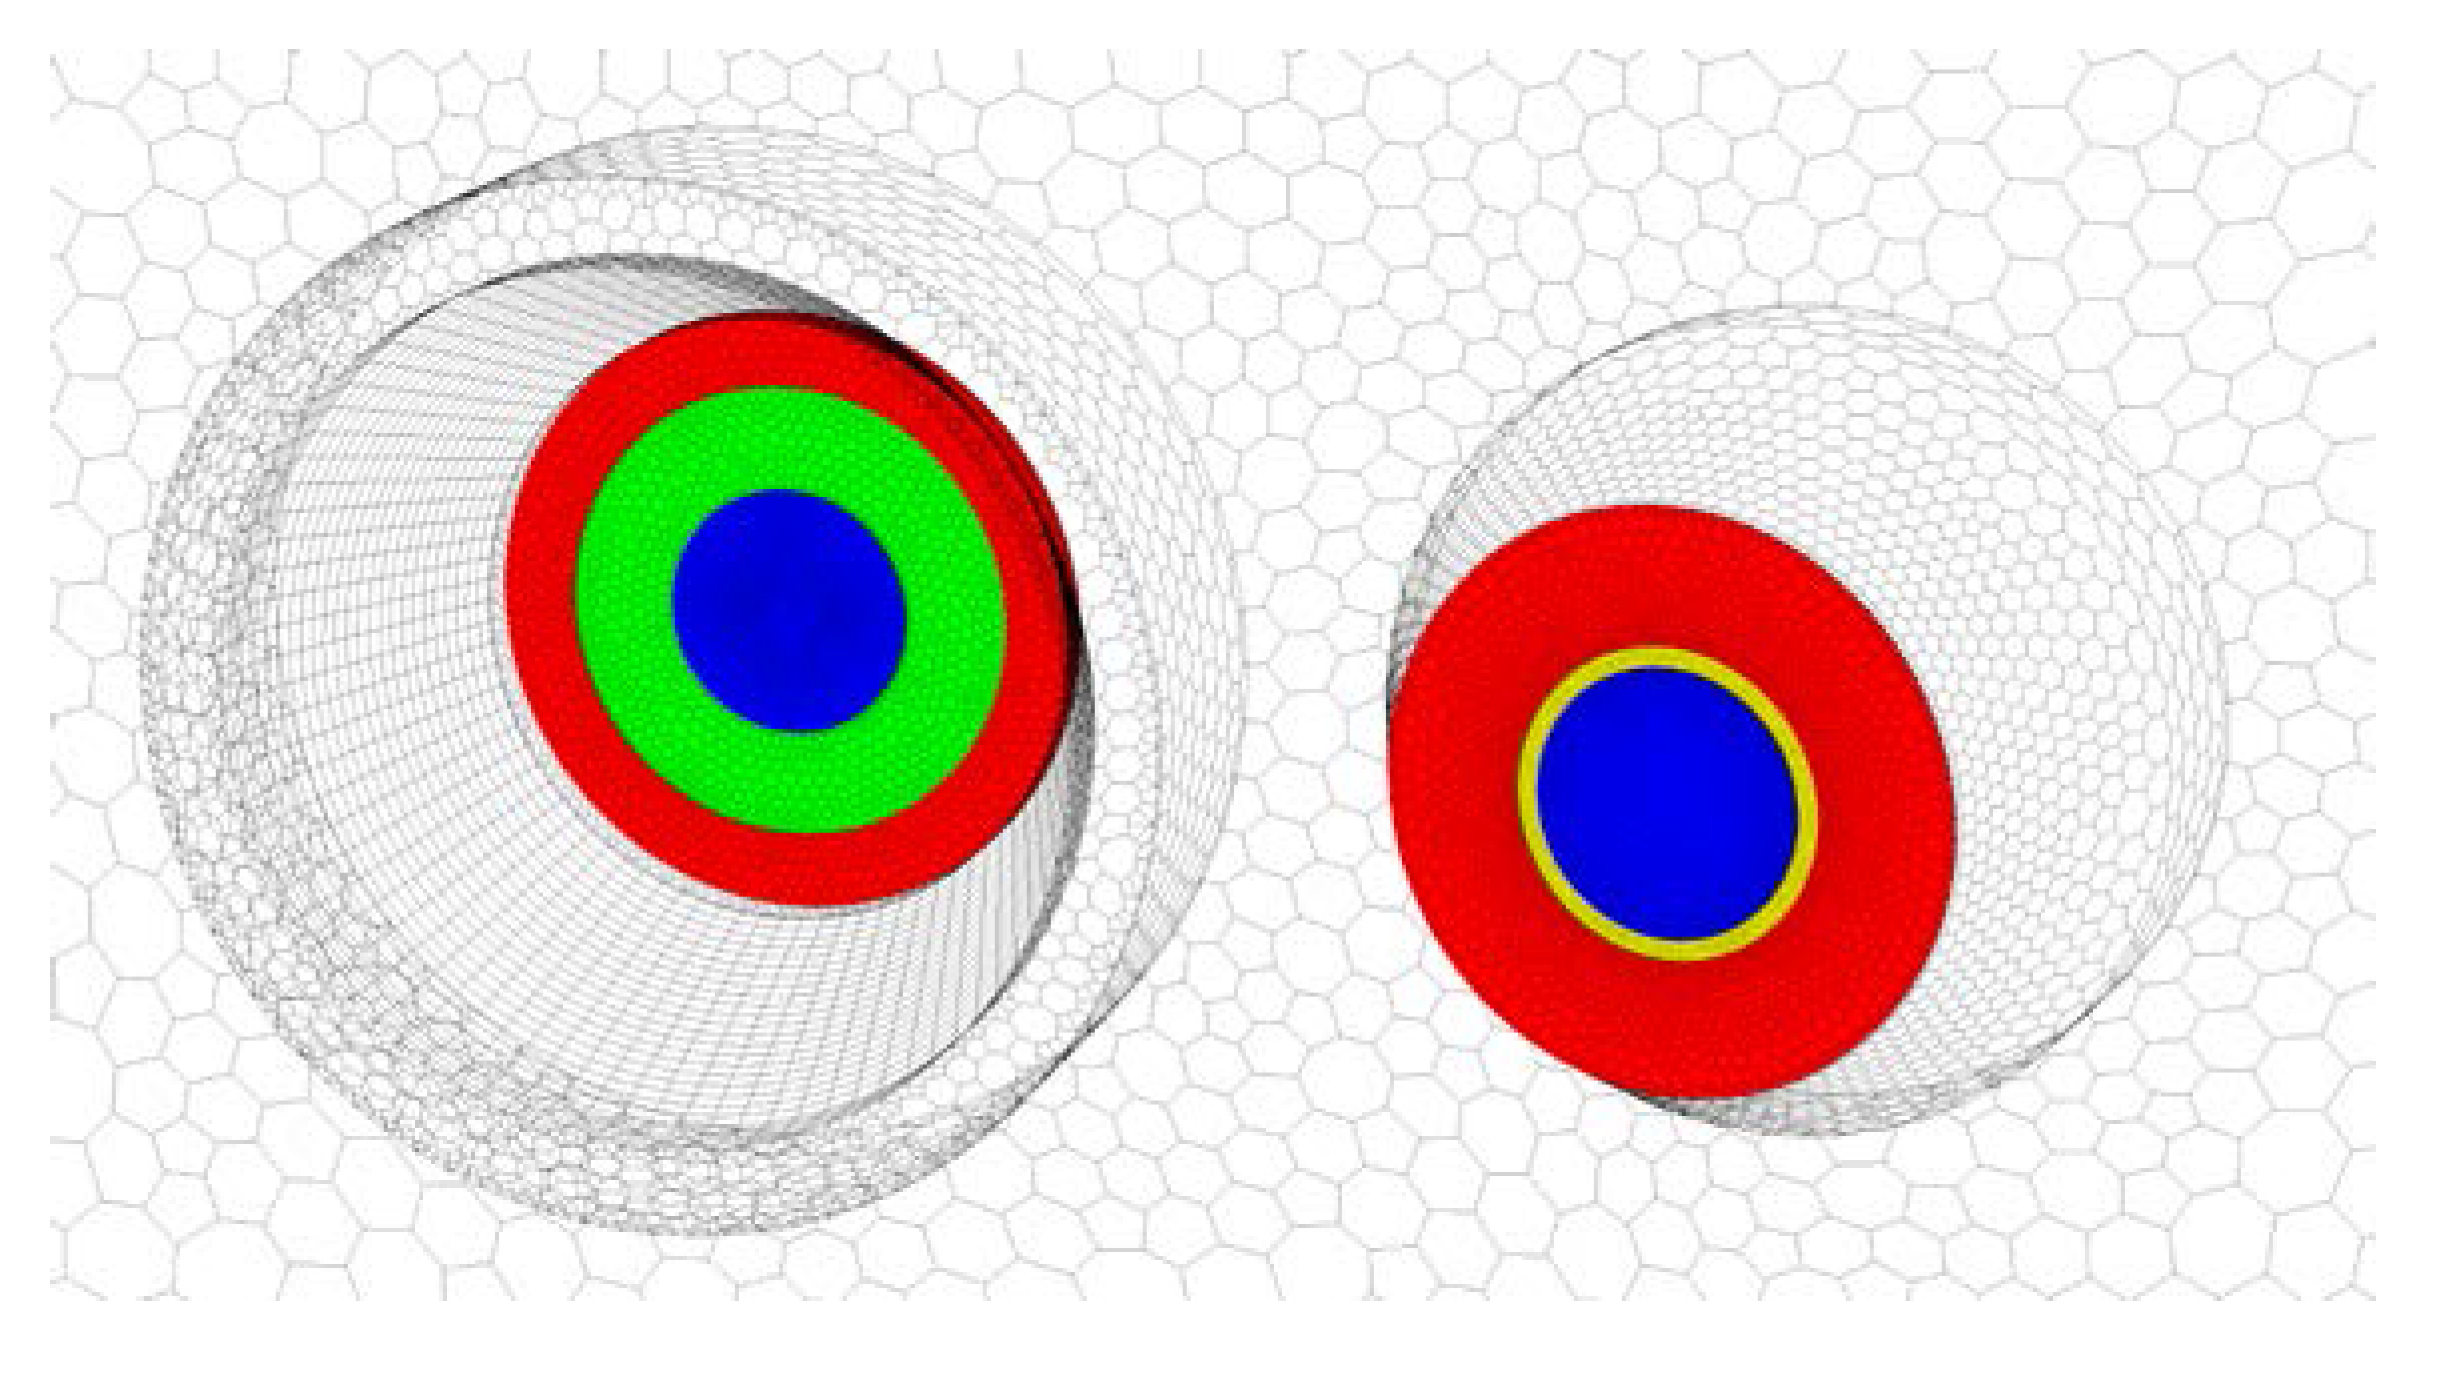
2.1.1. Furnace
2.1.2. Fuels
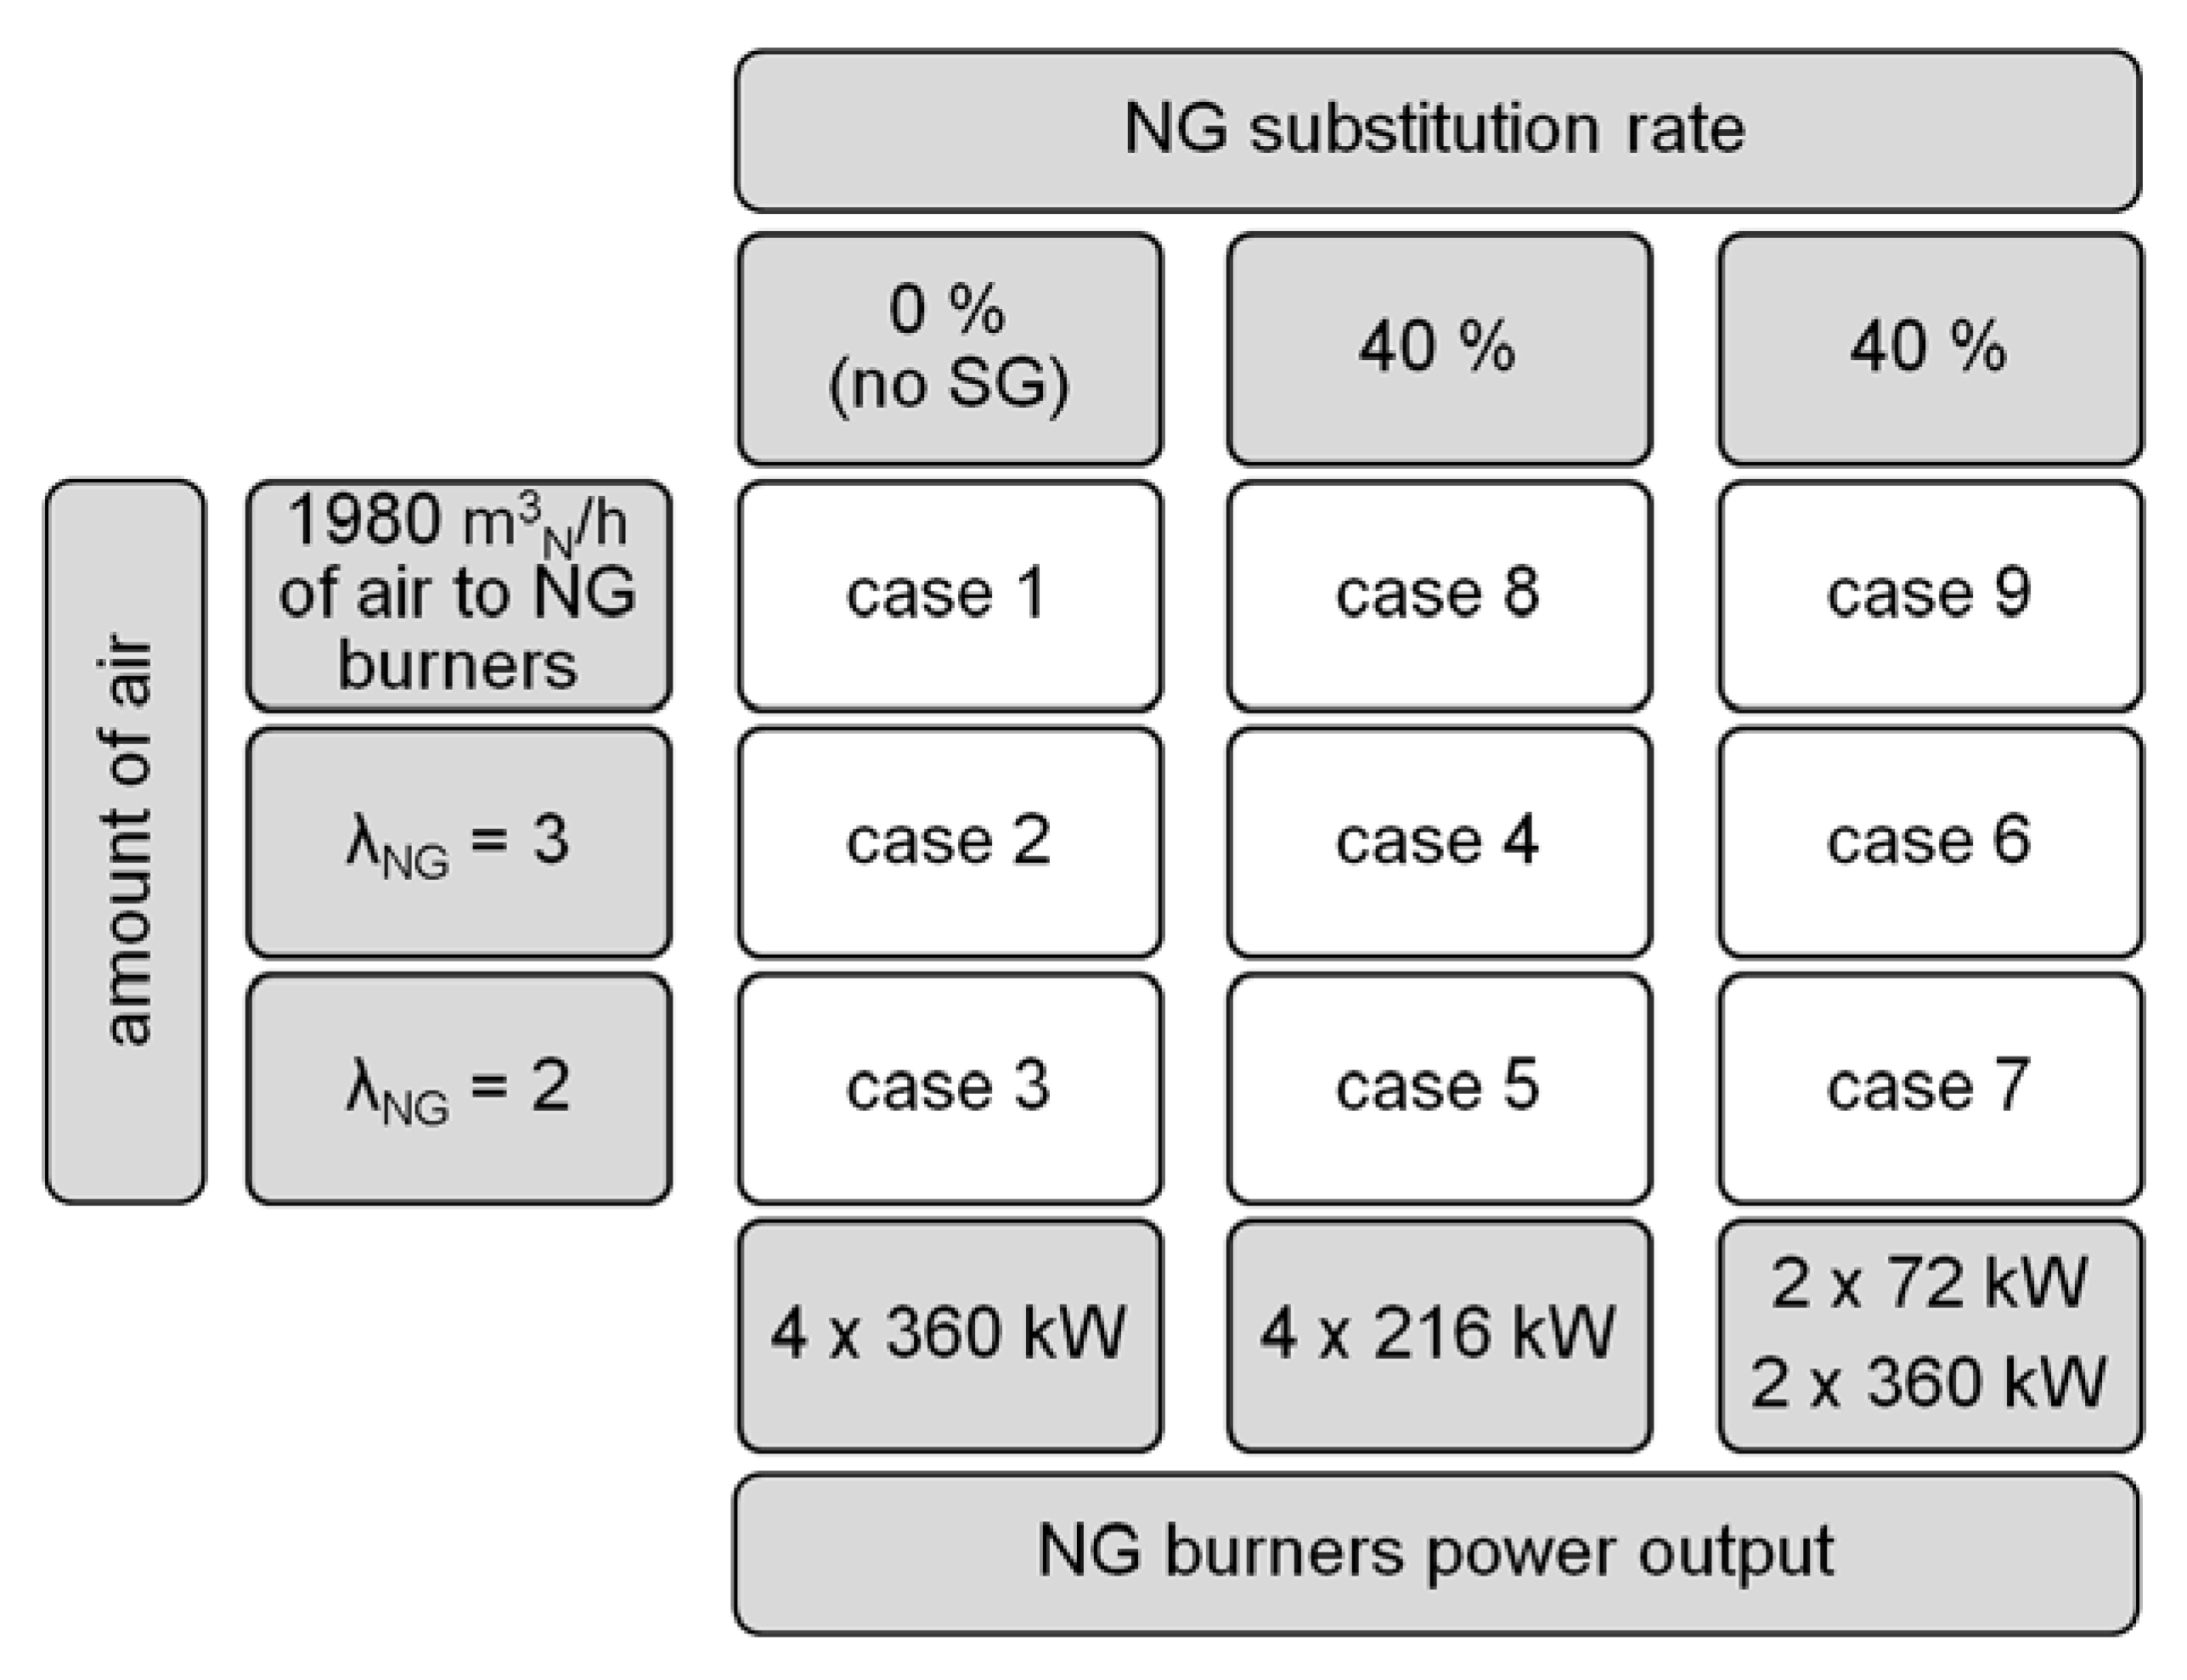
2.2. Operation Modes
- Mode of work (NG only or co-firing)—to value the impact of SG presence, e.g., two additional flames, on the heat treatment;
- Air–fuel equivalence ratio at natural gas burners λNG (2.0, 3.0, or resulting from feeding 1980 m3N/h (at normal conditions ca. 0.71 kg/s) of air to the natural gas burners, i.e., the amount supplied in the original BOSIO 1 furnace—to check the correlation between the amount of air fed to the furnace, the resulting change in gas motion, and the heat transfer;
- Power distribution among the corners of the furnace (even or uneven)—to determine the effect of balancing the power outcome of the NG-SG burner pair and the two NG burners without adjacent SG burner, accomplished by adjusting the power of NG burners so at every corner of the furnace 360 kW of heat is released.
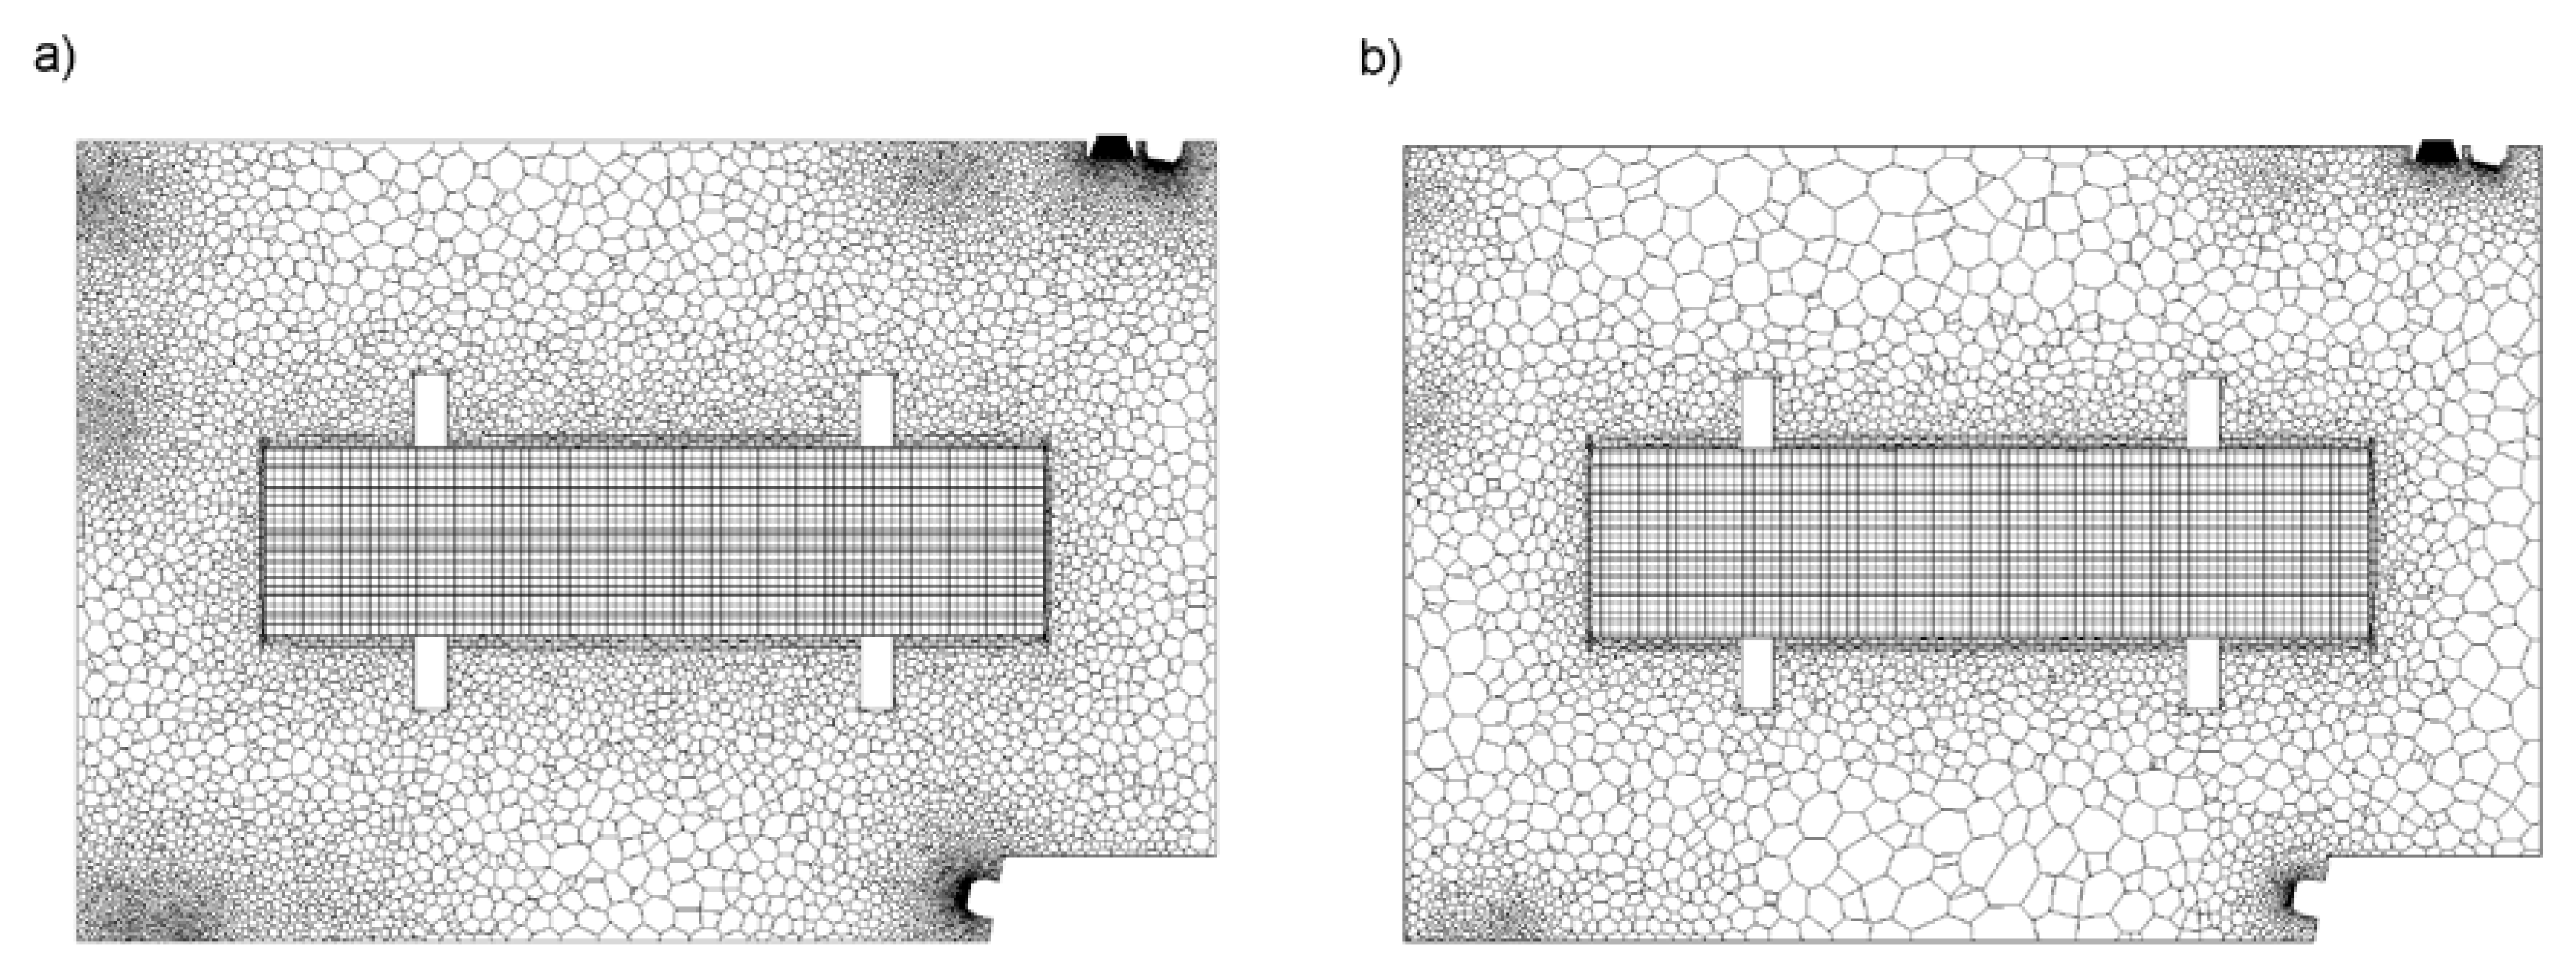
2.3. Calculation Method
2.4. Discretization Error
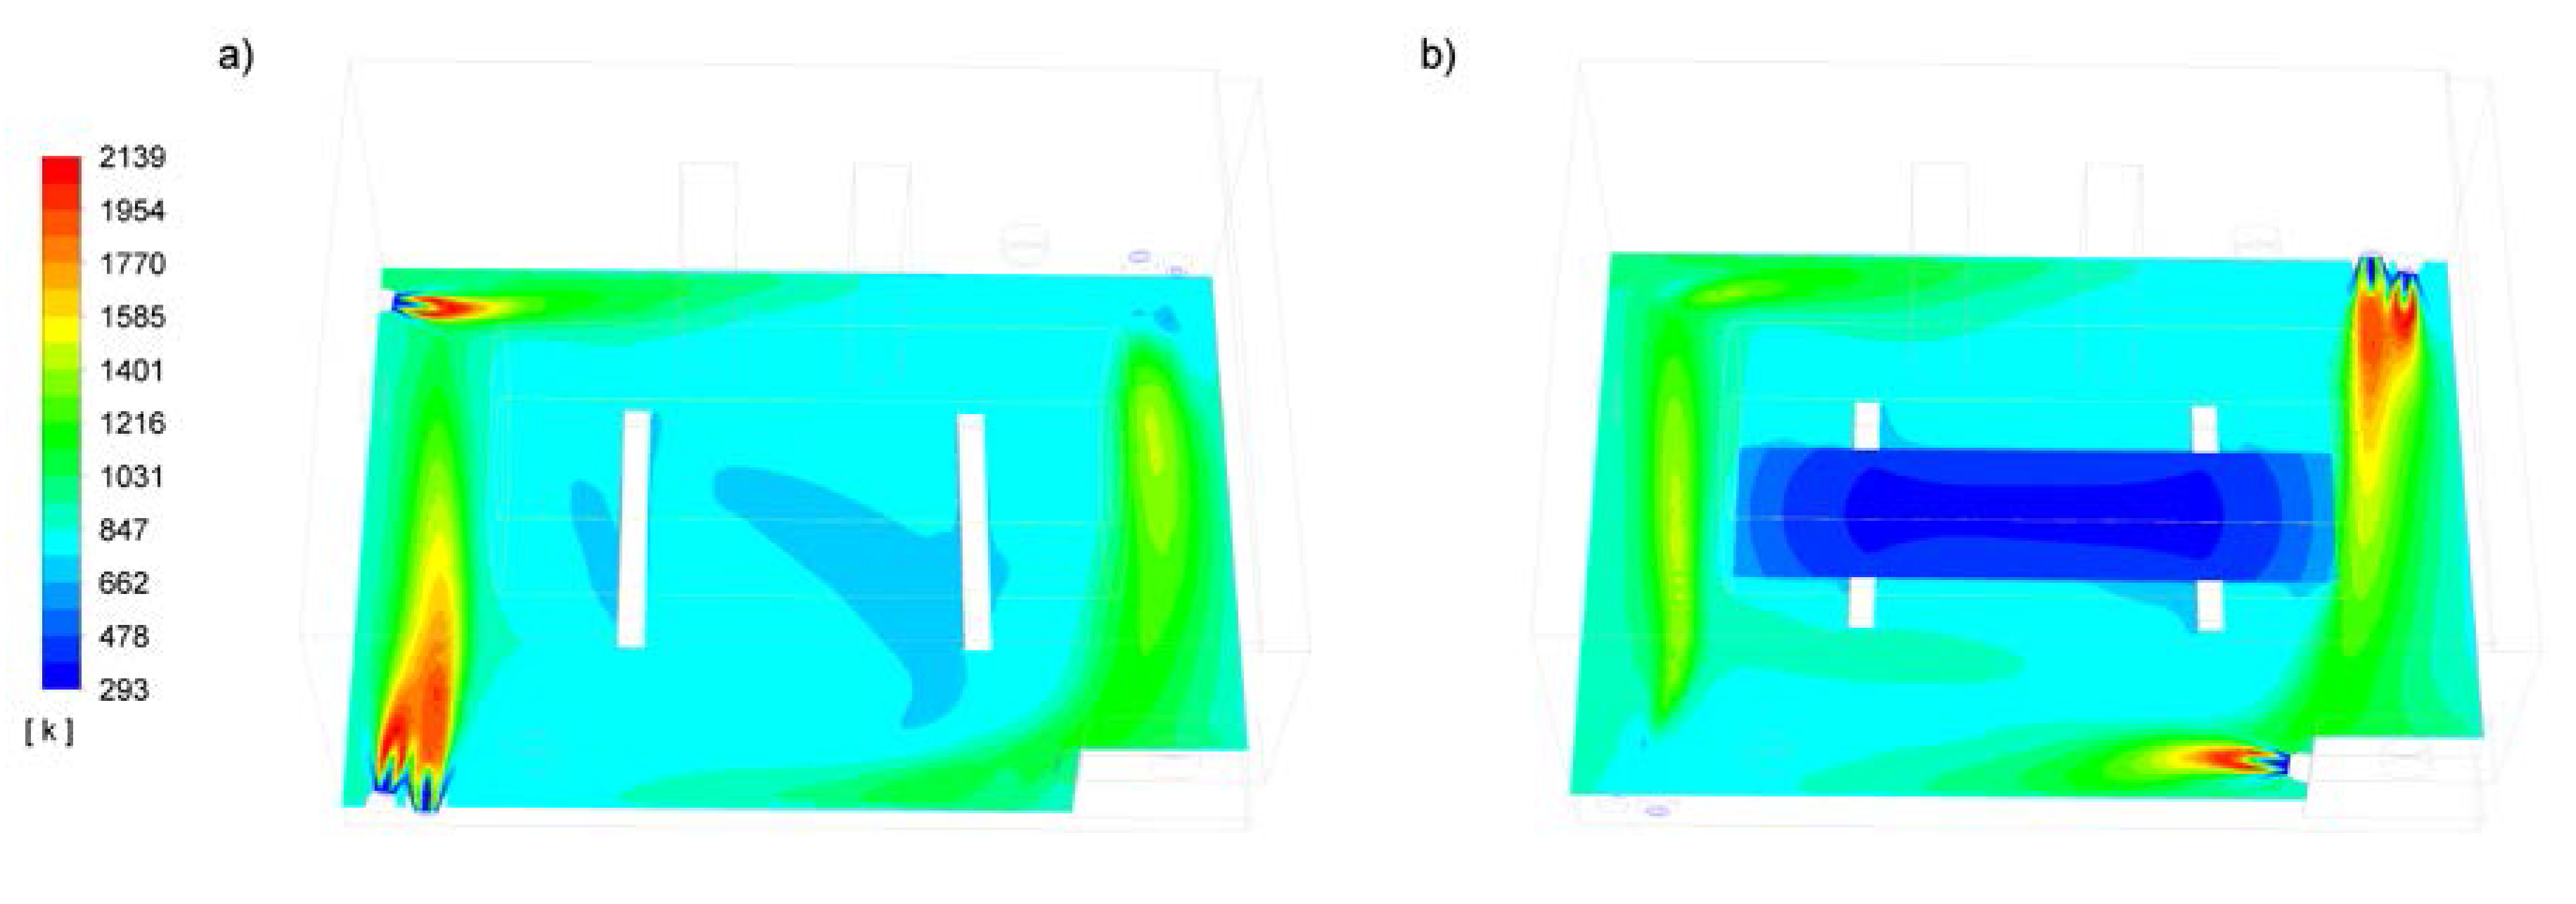
3. Results
4. Discussion
Author Contributions
Funding
Acknowledgments
Conflicts of Interest
Appendix A


References
- AGEB. Energy Consumption in Germany in 2018; Ziesing, H.-J., Ed.; AGEB Arbeitsgemeinschaft Energiebilanzen e.V: Berlin, Germany, 2019; Available online: https://ag-energiebilanzen.de/index.php?article_id=29&fileName=ageb_jahresbericht2018_20190503_engl.pdf (accessed on 29 February 2020).
- Berent, G.; Peryt, S.; Kacprowska, J.; Gilecki, R.; Boczek, R.; Żarek, E.; Brasse, J.; Stosio, M. Consuption of Fuels and Energy Carriers in 2018; Walkowska, K., Ed.; Główny Urząd Statystyczny: Warsaw, Poland, 2019. Available online: https://stat.gov.pl/obszary-tematyczne/srodowisko-energia/energia/zuzycie-paliw-i-nosnikow-energii-w-2018-roku,6,13.html (accessed on 29 February 2020).
- Yue, X.-L.; Gao, Q.-X. Contributions of natural systems and human activity to greenhouse gas emissions. Adv. Clim. Chang. Res. 2018, 9, 243–252. [Google Scholar] [CrossRef]
- Tello, P.; Weerdmeester, R. SPIRE Roadmap 2030; A.SPIRE Asbl: Brussels, Belgium, 2013. [Google Scholar]
- Pinera, V.C.; Riesgo, D.C.; Battaglia, V.; Fantuzzi, M.; Rocca, A.D.; Ageno, M.; Rensgard, A.; Wang, C.; Niska, J.; Ekman, T.; et al. High Efficiency Low NOX BFG Based Combustion Systems in Steel Reheating Furnaces (HELNOx-BFG); Publications Office of the European Union: Luxembourg, 2017. [Google Scholar] [CrossRef]
- Battaglia, V.; Malfa, E.; Zanusso, U.; Arribas Ramirez, J.J.; Ekman, T.; Adler, W.; Dapper, M.; Filippini, E.; Magni, F.; Niska, J.; et al. CO2 Reduction in Reheating Furnaces (CO2RED); Publications Office of the European Union: Luxembourg, 2011. [Google Scholar] [CrossRef]
- Caillat, S. Burners in the steel industry: Utilization of by-product combustion gases in reheating furnaces and annealing lines. Energy Procedia 2017, 120, 20–27. [Google Scholar] [CrossRef]
- Liu, H.; Saffaripour, M.; Mellin, P.; Grip, C.-E.; Yang, W.; Blasiak, W. A thermodynamic study of hot syngas impurities in steel reheating furnaces–Corrosion and interaction with oxide scales. Energy 2014, 77, 352–361. [Google Scholar] [CrossRef]
- Simell, P.; Stahlberg, P.; Solantausta, Y.; Hepola, J.; Kurkela, E. Gasification gas cleaning with nickel monolith catalyst. In Developments in Thermochemical Biomass Conversion; Bridgwater, A.V., Boocock, D.G.B., Eds.; Springer: Dordrecht, The Netherlands, 1997; pp. 1103–1116. [Google Scholar] [CrossRef]
- Nielsen, H.P.; Frandsen, F.J.; Dam-Johansen, K.; Baxter, L.L. The implications of chlorine-associated corrosion on the operation of biomass-fired boilers. Prog. Energy Combust. Sci. 2000, 26, 283–298. [Google Scholar] [CrossRef]
- Niska, J.; Grip, C.E.; Mellin, P. Investigating potential problems and solutions of renewable fuel use in steel reheating furnaces. In Proceedings of the Finnish-Swedish Flame Days 2013, Jyväskylä, Finland, 17–18 April 2013; Available online: http://kth.diva-portal.org/smash/get/diva2:681855/FULLTEXT01.pdf (accessed on 28 February 2020).
- European Commission. Commission Regulation (EU) No 601/2012 of 21 June 2012 on the monitoring and reporting of greenhouse gas emissions pursuant to Directive 2003/87/EC of the European Parliament and of the Council. Off. J. Eur. Union 2012, L181, 30–104. Available online: https://eur-lex.europa.eu/eli/reg/2012/601/oj (accessed on 29 February 2020).
- Fiaschi, D.; Carta, R. CO2 abatement by co-firing of natural gas and biomass-derived gas in a gas turbine. Energy 2007, 32, 549–567. [Google Scholar] [CrossRef]
- Kalisz, S.; Pronobis, M.; Baxter, D. Co-firing of biomass waste-derived syngas in coal power boiler. Energy 2008, 33, 1770–1778. [Google Scholar] [CrossRef]
- Whitty, K.J.; Zhang, H.; Eddings, E.G. Emissions from Syngas Combustion. Combust. Sci. Technol. 2008, 180, 1117–1136. [Google Scholar] [CrossRef]
- Fiehl, M.; Leicher, J.; Giese, A.; Görner, K.; Fleischmann, B.; Spielmann, S. Biogas as a co-firing fuel in thermal processing industries: Implementation in a glass melting furnace. Energy Procedia 2017, 120, 302–308. [Google Scholar] [CrossRef]
- Jóźwiak, P.; Hercog, J.; Kiedrzyńska, A.; Badyda, K. CFD analysis of natural gas substitution with syngas in the industrial furnaces. Energy 2019, 179, 593–602. [Google Scholar] [CrossRef]
- You, S.; Ok, Y.S.; Tsang, D.C.W.; Kwon, E.; Wang, C.-H. Towards practical application of gasification: A critical review from syngas and biochar perspectives. Crit. Rev. Environ. Sci. Technol. 2018, 48, 1165–1213. [Google Scholar] [CrossRef] [Green Version]
- Lieuwen, T.; McDonell, V.; Santavicca, D.; Sattelmayer, T. Burner development and operability issues associated with steady flowing syngas fired combustors. Combust. Sci. Technol. 2008, 180, 1169–1192. [Google Scholar] [CrossRef]
- Echi, S.; Bouabidi, A.; Driss, Z.; Abid, M.S. CFD simulation and optimization of industrial boiler. Energy 2019, 169, 105–114. [Google Scholar] [CrossRef]
- Silva, J.; Teixeira, J.; Teixeira, S.; Preziati, S.; Cassiano, J. CFD Modeling of Combustion in Biomass Furnace. Energy Procedia 2017, 120, 665–672. [Google Scholar] [CrossRef]
- Kassem, H.I.; Saqr, K.M.; Aly, H.S.; Sies, M.M.; Wahid, M.A. Implementation of the eddy dissipation model of turbulent non-premixed combustion in OpenFOAM. Int. Commun. Heat Mass Transf. 2011, 38, 363–367. [Google Scholar] [CrossRef]


| Component | Natural Gas (% vol.) | Syngas (% vol.) |
|---|---|---|
| O2 | 0 | 1 |
| CO2 | 0 | 12 |
| CO | 0 | 21 |
| CH4 | 98 | 3 |
| C2H6 | 2 | 0 |
| H2 | 0 | 14 |
| N2 | 0 | 49 |
| H2O | 0 | 0 |
© 2020 by the authors. Licensee MDPI, Basel, Switzerland. This article is an open access article distributed under the terms and conditions of the Creative Commons Attribution (CC BY) license (http://creativecommons.org/licenses/by/4.0/).
Share and Cite
Jóźwiak, P.; Hercog, J.; Kiedrzyńska, A.; Badyda, K.; Olevano, D. Thermal Effects of Natural Gas and Syngas Co-Firing System on Heat Treatment Process in the Preheating Furnace. Energies 2020, 13, 1698. https://doi.org/10.3390/en13071698
Jóźwiak P, Hercog J, Kiedrzyńska A, Badyda K, Olevano D. Thermal Effects of Natural Gas and Syngas Co-Firing System on Heat Treatment Process in the Preheating Furnace. Energies. 2020; 13(7):1698. https://doi.org/10.3390/en13071698
Chicago/Turabian StyleJóźwiak, Piotr, Jarosław Hercog, Aleksandra Kiedrzyńska, Krzysztof Badyda, and Daniela Olevano. 2020. "Thermal Effects of Natural Gas and Syngas Co-Firing System on Heat Treatment Process in the Preheating Furnace" Energies 13, no. 7: 1698. https://doi.org/10.3390/en13071698
APA StyleJóźwiak, P., Hercog, J., Kiedrzyńska, A., Badyda, K., & Olevano, D. (2020). Thermal Effects of Natural Gas and Syngas Co-Firing System on Heat Treatment Process in the Preheating Furnace. Energies, 13(7), 1698. https://doi.org/10.3390/en13071698