Abstract
The converter transformer is a key equipment in high voltage direct current (HVDC) transmission system. Its oil-paper insulation system in the valve winding and outlet bushing experiences AC, DC, AC/DC, and transient impulse voltages simultaneously. The oil contamination problem is more serious under DC electric field. Therefore, it is significant to investigate the characteristic of particles motion and accumulation under DC electric field. In this paper, first, the movement and accumulation behavior of fiber particles and copper particles in mineral oil and natural ester were recorded and simulated. Then, the influence of fiber and copper particles on the oil conductivity was analyzed. Finally, the DC breakdown strength of mineral oil and natural ester with different particles concentration was compared. Results show that the movement speed of copper particles was larger than that of fiber particles. Fiber impurities were easy to form bridges in mineral oil, while there was no impurity bridge in natural ester. The current density of mineral oil containing particles is larger than that of the natural ester at the same testing time. The DC 50% probability breakdown voltages of oil samples containing fiber and copper particles decreased linearly with the increase of particle concentration, and the decrease rate of DC 50% probability breakdown voltages of oil containing copper particles were faster than that of oil containing fiber particles. Compared to pure mineral oil, the DC breakdown voltages corresponding to 50% probability of contaminated mineral oil showed a decrease from 11.9% to 22.5% when the fiber particle concentration increased from 0.001% to 0.012%. The DC 50% probability breakdown voltages of contaminated mineral oil with copper particles decreased from 23.8% to 45.0% when the particle concentration increased from 0.1 g/L to 1.5g/L. However, the decline range of the figures for natural ester contaminated by fiber or copper particles showed a smaller drop.
1. Introduction
The main component of transformer internal insulation is oil-paper composite insulation system. At present in abroad and domestic, mineral oil and natural ester are two main kinds of insulating oil used in large power transformers. Mineral oil has good dielectric properties, excellent heat dissipation performance, low freezing point, and low viscosity. However, mineral oil has some disadvantages such as poor degradability, low flash point, and non-renewability. These are not satisfied with the requirements of green and environmentally friendly insulating oil [1,2,3,4,5]. Since 1990s, researchers have carried out a series researches on the application of natural ester to replace mineral oil. There are more than one million natural ester transformers in operation in the world, with voltage levels ranging from 10 kV to 420 k, and their capacities ranging from 6.25 MVA to 300 MVA [6]. Among all the transformers in operation, there are 25,000 large and medium-sized natural ester transformers [6,7].
The performance and property of insulating oil have a significant impact on the operation safety of the transformer. Almost one-third of the transformers’ damage is caused by insulation problems, among which particles pollution of insulating oil is a significant factor [8]. The existence of impurities in transformer oil is inevitable. The sources of particles mainly include three parts [9,10,11,12]: The first part is from impurities left over during the production, assembly, and transportation of transformers, the second part is from impurities mixed in the air, the third part is from impurities generated from the aging of the oil-paper insulation because of long-term operation, partial discharges. Impurities in the oil mainly include metal particles and non-metallic particles. Metal particles mainly include copper and iron particles, while non-metallic particles are mainly carbon particles and fiber particles [13,14]. Fiber impurities account for more than 90% of the non-metallic impurities [14,15,16]. During the operation of the transformer, some particles would move to the joint position of different components with the oil flow. Some particles are likely to gather in the area with a slow oil flow rate, thus forming a path between the connecting conductors, which brings a severe challenge for the stable operation of the transformer.
CIGRE Working Group 12.17 has analyzed the causes of failure on 22 faulty transformers and 40 faulty bushings (765 kV), it pointed out that for transformers 400 kV and above, the source of particles and their hazards must be cared [14]. In recent years, a lot of research has been carried out on the motion characteristics of impurities in oil and their impact on insulation performance. Mahmud S. et al. studied the bridging phenomena of fiber particles in mineral oil based on spherical electrodes and needle-plate electrodes under different DC and AC voltages. It was found that DC voltage was the main factor in bridge formation [17,18,19]. Li Yuan et al. analyzed the generation and development process of fiber bridges in mineral oil under DC voltage [20,21]. In [22,23], the millimeter metal particle’s movement behavior was studied using a theoretical model. In [24,25], the motion trajectory of a metal particle in flowing oil under AC voltage was studied. In [26,27], it was stated that the voltage form and particle concentration have important impacts on the motion characteristics of metal particles [26,27]. By studying the movement behavior of millimeter level copper particles in natural ester and mineral oil under AC voltage, Wang Zhongdong et al. found that the speed of copper particles in natural ester is slower than that of mineral oil. It is beneficial to reduce the effect of copper particles on the AC breakdown voltage of natural ester [28,29].
Within the converter transformers in high voltage direct current (HVDC) transmission system, the oil-paper insulation in the valve winding and outlet bushing experiences AC, DC, AC/DC and transient impulse voltages simultaneously. The oil contamination problem is more serious under DC electric field. To promote the natural ester application in DC condition, many new researches are needed. Compared with the research results related to mineral oil, the impact of impurities on the insulation performance of natural ester is still lacking. Also, there are few researches focusing on the differences in the bridging characteristics of metal and non-metal particles in natural ester, as well as the influence of impurities accumulation on the breakdown of natural ester. Studying the influence of impurities on the insulation performance of natural ester can provide strong technical support for better application of natural ester, thus guaranteeing the safe operation of natural ester transformers [30,31].
This paper investigated the particle motion characteristic in both mineral oil and natural ester, and compared the effect of particles on the conductivity and breakdown of oil under DC electric field. First, the movement and accumulation behavior of fiber particles and copper particles in mineral oil and natural ester were recorded and simulated. Then, the influence of fiber and copper particles on the oil conductivity was analyzed. Finally, the DC breakdown strength of mineral oil and natural ester with different particles concentration were compared.
2. Experiments
25# Mineral oil used in this experiment was purchased from Sichuan Chuanrun CO., Ltd. (Chongqing, China). The soybean-based natural ester was purchased from Henan Enpai CO., Ltd. (Zhengzhou, China). The oil samples were dried for 48 h in a vacuum box at 90 °C and 133 Pa. The main parameters of the insulating oil are shown in Table 1. There are two types of clean and dry particles: fiber particles and copper particles. Fiber particles were produced by rubbing a piece of new insulation pressboard (NARI Borui transformer factory, Chongqing, China) through metal files. Then different sizes of sieves were used to separate the particles. The fiber particles used for this experiment is 150–250 μm in average length. The spherical copper particles with an average diameter of 15 μm were purchased from Beijing Hongyu CO., Ltd. (Beijing, China).

Table 1.
Parameters of insulation oil.
The images of the fiber and copper particles were characterized by an optical microscope, as shown in Figure 1. The two types of particles and insulating oil were configured into experimental samples with different contamination levels as shown in Table 2. The particle concentration for fiber is expressed in mass percentage to the oil. The concentration of copper particles is expressed by the mass of particles contained in each liter of oil. The samples were fully immersed in a vacuum drying box for 48 h to make sure the particles are fully soaked in oil and the air bubbles are removed.
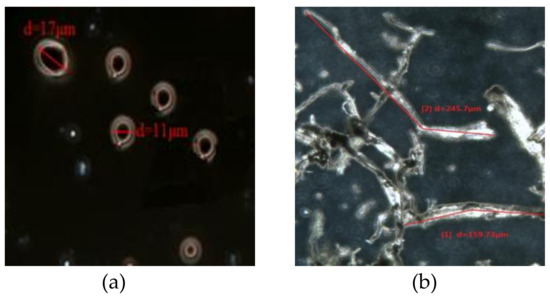
Figure 1.
The optical microscope images of the copper particles (a) and fiber particles (b).
Table 2.
Particles concentration of experimental samples.
The experimental setup is shown in Figure 2. A ceramic oil cup including a pair of plate-plate electrodes was used for the test. The electrode plate is 25 mm in diameter and 4 mm in thickness. A high-definition camera (Canon 500D) was placed above the test oil cup to record the particle motion images during the DC voltage applied process. The HCDJC-100kV/5kVA (Beijing Huace Testing Instruments CO., Ltd., Beijing, China) was utilized to provide high DC voltage.
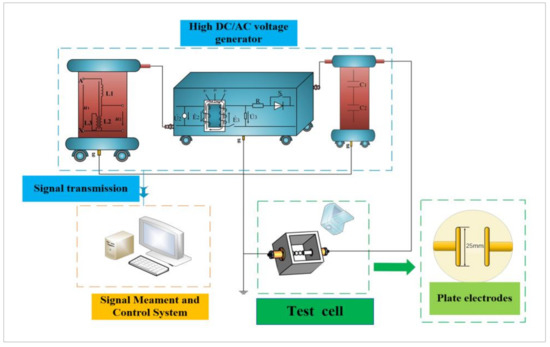
Figure 2.
The experimental setup for particles accumulation and DC breakdown test.
The electric field in oil gap in the convert transformers is usually in the range of 2–8 kV/mm. Some researchers chose the DC electric field of 0.2–20 kV/mm to study the characteristics of the particle accumulation [32,33]. In the conduction current density experiment, three independent samples of each kind of oil with different contamination levels were made and tested to ensure repeatability. The distance between the electrodes was kept at 7.5 mm, and the applied DC voltage was set at 11.25 kV. Previous experiment trials showed that a stable stage would emerge after the voltage was applied for 15 min [30,31]. So the voltage applied time was set 1500 s. The DC breakdown test was conducted according to standard IEC 60156. Eight independent samples of each kind of oil with different contamination levels were made, and the breakdown event was registered only once for every independent sample. During the test, the increasing rate of DC voltage was 1 kV/s. To ensure uniform particle distribution, oil samples were stirred thoroughly for 2 min by a glass stirrer before every test. All the tests were performed at room temperature.
3. Experimental Results and Analysis
3.1. Movement and Accumulation Characteristics of Particles in Mineral oil and Natural Ester
The accumulation behavior of fiber and copper particles in mineral oil and natural ester under DC voltage is shown in Figure 3. The left side of the figure is the negative electrode, and the right side is the positive electrode. Here, the fiber particles concentration is 0.009%, the copper particles concentration is 1 g/L. Figure 3a shows that fiber particles that tended to form fiber bridges in mineral oil, however, there is no fiber bridges in natural ester. In mineral oil, the fiber particles began to form bridges as soon as the DC voltage was applied. At the early stage (50 s), some of the bridges were silk-like and seemed weak. With increasing time, the number and thickness of fiber particle bridges continued to augment. This was followed by a stable stage at about 600 s, after that the fiber bridges did not change significantly, as shown in the pictures at 900 s and 1500 s. On the other hand, the situation varied a lot for the fiber particles in natural ester. With the voltage applied, the time increased, and the "beard" phenomenon appeared on the edge of both the electrodes. This adsorption phenomenon was much more obvious at the cathode rather than the anode from beginning to the end. This process would also end up with a stable stage.
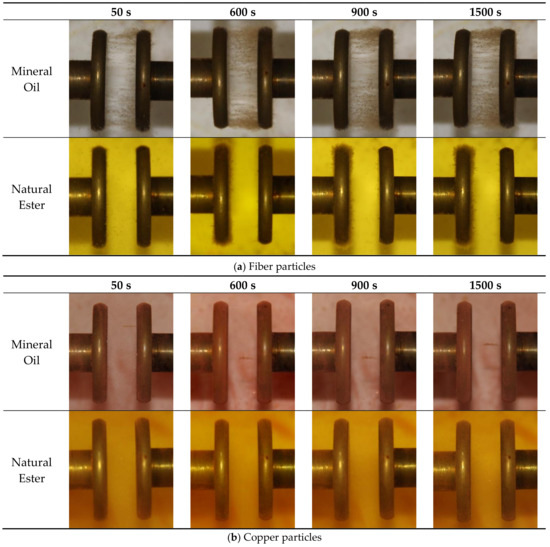
Figure 3.
Dynamic motion of (a) fiber particles and (b) copper particles in insulating oil under DC.
Figure 3b presents the motion characteristics for copper particles in mineral oil and natural ester, respectively. When the DC electric field was applied, there was one un-complete and weak silk-like bridge that started from the anode in mineral oil. The position of this bridge was changing during the voltage-on period, indicating that the bridge formed by copper particles was not stable. In natural ester, the trace of the copper particles was hardly found even if the DC electric field was applied for 25 min. Most of the particles sank to the bottom while the minority was adsorbed onto the electrode.
To better illustrate the motion characteristics of the particles in oil, the observed trajectories of the particles were drawn in Figure 4. The movements of these particles depended on the resultant force of dielectrophoretic force (FDEP), Coulomb force (Fe), viscous drag force (Fd), particle–particle interaction force (Fpi), gravity (G), and buoyancy force (Fb) according to the model in [34]. A neutral body placed in an electric field becomes polarized and is equivalent to an electric dipole with an excess of positive charge on one end and negative charge on the other. The forces acting on the two ends do not balance for non-uniform electric field resulting in the movement of the particles. This phenomenon is called dielectrophoresis first introduced by Pohl [35]. According to Newton’s law of motion, Equation (1) could be established as follows:
where mp is the particle mass and v is the motion velocity of the particle. In the following qualitative analysis, we ignored G and Fb in the y-axis since the y-axis is perpendicular to the electric flux lines.
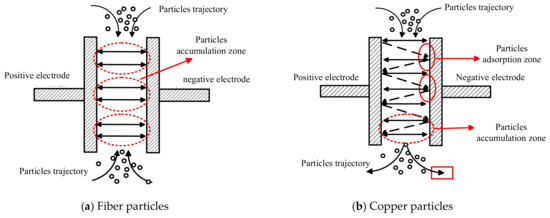
Figure 4.
Motion trajectory diagram of particles in insulating oil under DC uniform electrical field.
For the fiber particles, they start to become polarized as soon as the DC electric field is applied. The fibers then align themselves parallel to the field lines and are subject to dielectrophoresis force (DEP force). Given the condition that the fibers are considered to be prolate spheroids with the minor axis equal to the fiber sectional diameter D, and the major axis equal to the fiber length L. The DEP force on the fiber is shown as follows [36]:
where E is the electric field strength, ,, are the permittivity of vacuum, particle, and the oil respectively, and is the aspect ratio (L/D). The function is given by
It could be seen that dielectrophoresis force depends on the electric field, the volume of the particles, the complex permittivity of the particles, and the insulating oil. This force exerted on the fiber will draw the particle closer to the electrode. Particles are also subjected to the drag force from the viscosity of the oil during the motion. The drag force on a prolate spheroid is given by
where is the viscosity of the oil and v is the motion velocity of the particles.
In the initial stage, fibers move toward the electrodes and the particle motion velocity v is calculated by balancing DEP force with the drag force Fd. It can be assumed , thus , and the velocity is given by
Equation (7) is appropriate for >5. Once the fibers touch the electrode surface they acquire charges from the electrode. According to the theory described in [37], if a conducting particle is suspended in an insulating liquid and it is in direct contact with an electrode surface, the particle will become charged to the same polarity as the electrode. The attraction force of a particle to an electrode of opposite polarity and repulsion force from the same polarity electrode will cause the particle to move to the distant electrode. The amount of charge q will be acquired by a small metal ball of radius r touching the electrodes given by [38],
This theory could also be applied to the dielectric fiber particles. However, the acquired charge amount during the contact process will be reduced by several factors such as electrode material and particle shape. So the charge amount will be different for each fiber particle, and this could determine the motion characteristic of the fiber particles. Usually, a reduction factor is introduced which could be determined by measuring the velocity of the particle. When the particle is charged, the Coulomb force given by Equation (9) plays a part in the particle motion.
When the charge amount reaches a certain level and its repelling Coulomb force is greater than the DEP force and the drag force, the particle gets off the electrode surface and travels toward the distant electrode. When the particle reaches the opposite electrode, discharge and charge happen in turn followed by a similar cycle again. This could explain that some of the fibers travel back and forth between the electrodes in mineral oil as shown in Figure 4a. On the other hand, some other particles will be directly adhered to the electrodes and will not bounce if their acquired charge amounts are not big enough to make the Coulomb force greater than the sum of DEP force and drag force. The adhered particles become tips on the electrode surface and attract more particles with the opposite charge to adsorb. Also, inter-particle interaction forces like Van der Waals force play a part in leading pressboard particles to form chains between two electrodes when the particles are within short distances. These chains also align themselves parallel to the electric field lines as shown in Figure 3. Initially, the electric field strength is maximum at the electrode surface. Nevertheless, with more and more particles adsorbing to the electrode, the maximum field locates at the ends of these particle chains. Under this circumstance, the DEP force directly drives the particles to the chain ends to extend the chain length. Eventually, the fiber chains from both electrodes join up in the middle. Things become a little bit different in natural ester, since the drag force of the insulating oil on the particle is much greater because of the higher viscosity of the natural ester. As a result, the movement speed of the particle becomes much lower. In addition, the Coulomb force is needed to make the particle bounce increase, ending up with almost all the particles being adsorbed onto the electrodes. Therefore, the fiber bridges are difficult to form in natural ester.
As for the copper particles, the motion trajectories are shown in Figure 4b. The copper particles suspended in the area between the electrodes will quickly move toward the electrode and bounce between two electrodes after a collision with the electrode. This could also be explained by the force analysis. The DEP force exerted on a metal ball with radius r is given by [38]
where , are the conductivities of the metal particle and the insulating oil, respectively. The drag force is given by
where is the correction factor related to Reynolds number. Here the Reynolds number is assumed to be low enough to ensure the motion of the particle is in the Stokes-regime. In this case, the value of is 1. When the DC voltage is applied, the copper particles move to the electrodes in the velocity v yielded by equating Equation (10) and (11) under the drive of DEP force.
When the metal particles arrive at the electrode, the electrode gives the homo-charge to metal particles during the collision. The charge amount is given by Equation (8). In the experiments, it is observed that the copper particles are not likely to adsorb to the electrode but travel back and forth between electrodes compared to the fiber particle. This could be attributed to two reasons. One is that the drag force on the metal particle is small since the radius of the metal particle is much smaller than rod-like fibers and g is about 1.85 when is assumed to be 5. The other is that the acquired charge during the contact with electrodes for the dielectric particle will be less than conductive particles under the same radius regarding the reduction factor. At the same time, gravity in the y-axis is always playing its role in making the particle sink down. Therefore, it can be seen in Figure 4 that the motion trajectory of metal particles includes bouncing and sinking. It can also be seen in Figure 3 that only very few metal particles adsorb to the electrodes suggesting that the probability of forming complete metal bridges is very low. In the case of natural ester, the velocity in the x-axis is nearly invisible because of the large drag force resulting from much larger viscosity, and the velocity in the y-axis due to gravity is predominant. So almost all the particles sink down to the bottom of the tank.
3.2. Motion Trajectory Simulation of Particles in Mineral oil and Natural Ester
Assuming that insulating oil cannot be compressed, suspended fiber and copper particles in oil withstand gravity and buoyancy in the vertical direction. In this paper, according to the simulation method in [31,39,40], the motion trajectories of the fiber and copper particle between the electrodes under DC stress were simulated through AC/DC and particle tracking modules in COMSOL software. The pressboard samples used in the experiments had many different shapes and sizes. Some of them are rod-like, while some are not very rounded spherical shape with rough edges. For simplicity, spherical particle shape is chosen for this simulation since the particle trajectory module of COMSOL can only model spherical particles. This model has some limitations but it could provide a good understanding of the experimental observations. Both cellulose and copper particles were treated as spheres of the same diameter in this simulation. The purpose of doing this was to investigate the difference in movement velocity and motion tendency resulting from the change in oil property (e.g., viscosity, permittivity, and density) and particle property (e.g., permittivity and density). In this case, the diameter of both kinds of particle was set at 50 μm, and the reduction factor of charge transfer to the dielectric particles was chosen by trial and error method and it was selected to be 0.83. The parameters of the oil were set the same as Table 1. The dimensions of the electrode were set as 25 mm. The distance between electrodes was 7.5 mm, the applied DC voltage was 11.25 kV. The fiber particle concentration was 0.009% and the copper particle concentration was 1 g/L. The permittivity and volume resistivity of fiber are 4.4 and 2 × 10⁶ Ω·m. The permittivity and volume resistivity of copper are 105 and 2 × 10⁻⁸ Ω·m. The simulated trajectories of both particles in mineral oil and natural ester are shown in Figure 5 and Figure 6.
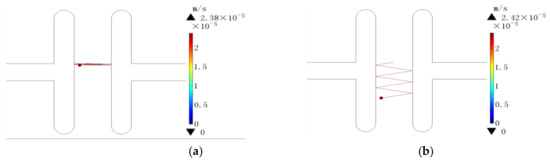
Figure 5.
Motion simulation of cellulose and copper particles in mineral oil under DC electric field. (a) Cellulose particles, (b) Copper particles.
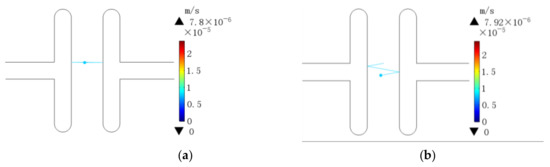
Figure 6.
Motion simulation of cellulose and copper particles in natural ester under DC electric field. (a) Cellulose particles, (b) Copper particles.
The simulation results showed that the velocity of the copper particle was larger than that of the fiber particle. The copper particle tended to bounce between electrodes and sank at the same time. The fiber particle just moved in the horizontal direction with a few numbers of collisions with the electrodes compared with the copper particles in the same simulation period. On the other hand, the dynamic process in natural ester varied a lot from that in mineral oil. The viscosity of natural ester is much larger than that of mineral oil, which means that the viscous drag force is much larger in natural ester. The natural ester can significantly reduce the movement speed of the impurity particles, and the number of collisions between the impurity particles and the electrode in a unit time. The simulation result is consistent with the observed phenomenon shown in Figure 3 and Figure 4.
3.3. The Influence of Particles on the Current Density of Mineral Oil and Natural Ester
The influence of impurities on the current density of insulating oil was investigated. The results of contaminated oil with 0.009% cellulose particle, contaminated oil with 1 g/L copper particle, and pure oil were chosen to put together for comparison. The current density curves depicted in Figure 7 were the average values of three independent tests. In the initial stage, the mean values of the current densities of the samples were given without error bars, which was to avoid clutter curves. In the stable stage, error bars were given. The saturation values with error bars for each sample were extracted for comparison as shown in Figure 8. Results showed that the saturation current density value in contaminated oil was larger than that in pure oil, indicating that impurity particles had a great influence on the conductivity property of the oil. The saturated current density in mineral oil containing fibre particles and copper particles were almost four times and nine times of that pure mineral oil, respectively. In addition, the saturated current density in natural ester containing fibre particles and copper particles were just 1.1 times and 2 times of that pure natural ester. Besides, the current density of the mineral oil with fibre particles or copper particles was larger than that of the natural ester with the same particle concentration. Figure 7 showed that the current density of natural ester was not sensitive to impurity contamination compared to mineral oil.
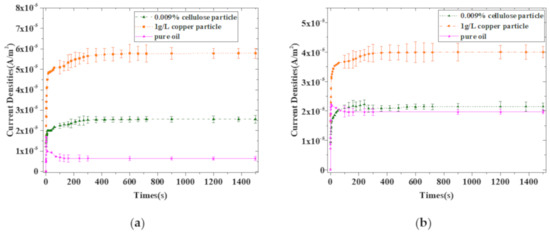
Figure 7.
Current density of oil containing particles under DC electric field (11.25 kV, 7.5 mm). (a) Mineral oil, (b) Natural ester.
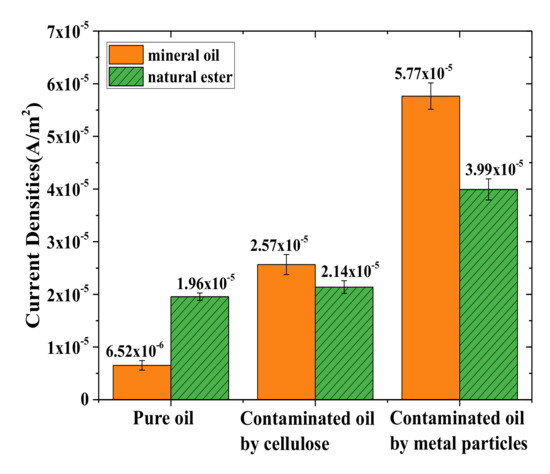
Figure 8.
Comparison of saturated current in insulation oil containing fiber and copper particles.
3.4. Influence of Particles on the DC Breakdown Voltage of Mineral Oil and Natural Ester
Weibull distribution is usually used for breakdown characteristic analysis. The two parameters Weibull cumulative distribution function for the population fraction below t is given by formula (13):
where α is the scale parameter and β is the shape parameter, t represents the breakdown voltage, and F(t) is the probability of failure at voltage t. The scale parameter α represents the voltage for which the corresponding breakdown probability is 63.2%. The shape parameter β is the measure of the spread of the failure voltages. The larger β is, the smaller is the range of breakdown voltages.
As for the estimation of distribution parameters, the empirical distribution function Fn(ti) proposed by Blom as shown in formula (14) was applied to all the test data, where Fn(ti) is the probability of failure, i represents the order of test samples, and n is the total number of test samples. Formula (6) could be converted into formula (15) by taking the logarithm, then the values of α and β could be estimated using the least square method.
Figure 9 and Figure 10 show the Weibull probability distribution plot of different oil samples containing different particles concentration under DC voltage. With an increase in the concentration of particles, the Weibull curve moves to the left side. The breakdown probability of samples reduced as the concentration of the particles increased. This phenomenon could be explained by Figure 3. More particles brought about more bridges and more accumulated particles between the electrodes, thus leading to more conducting paths. Conducting paths are detrimental to the breakdown strength of the oil insulation.
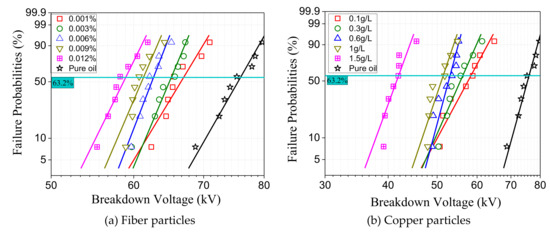
Figure 9.
Weibull distribution of breakdown voltage for contaminated mineral oil.
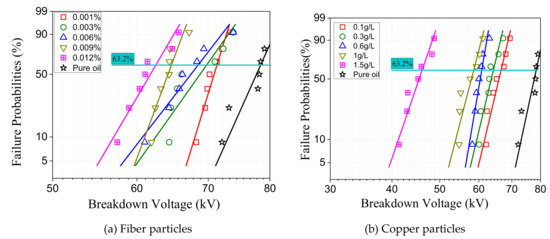
Figure 10.
Weibull distribution of breakdown voltage for contaminated natural ester.
The scale parameters α, shape parameters β of all the samples were extracted and are shown in Table 3 and Table 4. The scale parameters α could be used to evaluate the breakdown characteristic and it is named “characteristic DC breakdown voltage.” Moreover, the breakdown voltages corresponding to 50% and 5% probability failure of all the samples were read out from the Weibull plots and also presented in Table 3 and Table 4. Figures for 50% probability failure are analogous to the mean of the normal distribution and data for 5% probability failure is considered as one of the lowest breakdown probability. These quantities could help present more detailed information about Weibull distribution and provide better comparison. Results showed that the characteristic DC breakdown voltages of natural ester were always higher than that of the mineral oil under the same condition. This was in accordance with the changing of the current density of mineral oil and natural ester under particle contamination. From this perspective, the insulating performance of the natural ester is better in consideration of the particle contamination. Moreover, the noticeable difference between oil samples containing different particles should also be paid attention to. For both mineral oil and natural ester, the DC breakdown characteristic voltages of oil containing copper particles were always lower than that containing fiber particles. The same trends could also be observed in the figures for 50% and 5% probability failure. For one thing, the breakdown voltages for oil contaminated by cellulose particles were always higher than the figures for oil contaminated by metal particles. For another thing, the breakdown voltages for the natural ester were higher than the figures for mineral oil provided the same kind of contamination particles and the same contamination level. Specifically speaking, the characteristic DC breakdown voltage of contaminated mineral oil showed a decrease from 4.6% to 22.5% when the fiber particle concentration increased from 0.001% to 0.012% compared to pure mineral oil. The characteristic DC breakdown voltage of contaminated mineral oil with copper particles decreases from 22.7% to 44.6% when the copper particle concentration increased from 0.1 g/L to 1.5g/L. However, the decline range of the characteristic DC breakdown voltages for natural ester contaminated by cellulose particles and copper particles showed smaller drops. It was 6%–20.2% and 11.8%–41.1%, respectively. Conclusion could be drawn from the above comparison that metal particles were more harmful to the insulating oil than cellulose particles and that natural ester was superior to mineral oil in resistance to impurity particle pollution to some degree. It could be inferred that the higher viscosity of the natural ester is beneficial to the endurance for impurity contamination.
Table 3.
Weibull parameter of characteristic DC breakdown for contaminated mineral oil.
Table 4.
Weibull parameter of characteristic DC breakdown for contaminated natural ester.
To investigate the influence of different types of particles on the DC breakdown strength of the insulating oil, the relation between the DC breakdown voltages values for 50% probability and the particle concentration was established. The figures corresponding to 50% probability from the Weibull distribution function could be treated as analogous to the mean value of normal distribution because they are both medians. That is why we use 50% probability breakdown voltages to analyze. The figures are extracted from Table 3 and Table 4, and the fitting equation is shown as follows
where x is the particle concentration (percentiles for fiber particles and 102 g/L for copper particles), y is the DC breakdown voltage for 50% probability, A represents the decreasing rate of breakdown voltage with the increasing of particle concentration, and B is the fitting constant. The curves are depicted in Figure 11, and R2 is the goodness of fitting.
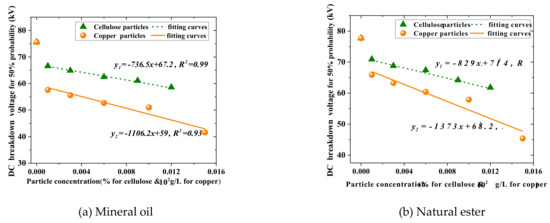
Figure 11.
Relation between DC 50% probability breakdown voltages of oil and contamination level.
The results showed that particles were detrimental to the breakdown strength of the insulating oil. For both insulating oils, the DC breakdown voltages corresponding to 50% probability showed a linear decrease with the increase of particles concentration. The DC breakdown voltages for 50% probability of oil containing copper particles were lower than the figures for the oil containing fiber particles. It was indicated that the hazard of metal particles to the insulating oil was more serious. Besides, the DC breakdown voltages for 50% probability of natural ester were always higher than those of the mineral oil under the same particle contamination, so the advantage of natural ester on contamination resistance was highlighted.
4. Conclusions
In this paper, experiments and simulations were carried out to compare the motion and accumulation characteristics of fiber and copper particles in mineral oil and natural ester under DC electric field. The DC breakdown voltages for both insulating oils with different particle concentrations were measured. The conclusions are as follows.
The motion and accumulation characteristics of fiber particles vary a lot from copper particles. Compared to mineral oil, the motion speed of particles was significantly lower in natural ester because of its higher viscosity. In mineral oil, copper particles had difficulty in forming stable bridges, while fiber particle bridges were dense and thick. In natural ester, the fiber and copper particles were mainly adsorbed by the electrode and would not form the bridge of impurity particles. The current density of natural ester contaminated with particles was lower than that of mineral oil with the same contamination particle type and contamination level.
The DC breakdown voltages for 50% probability showed a linear decrease with the increase of particle concentration. The DC 50% probability breakdown voltages of oil containing copper particles were lower than those of the oil containing fiber particles. However, the decline range of the DC 50% probability breakdown voltages for natural ester contaminated by fiber or copper particles showed a smaller drop compared to the mineral oil with the same contamination level. Natural ester is superior to mineral oil in resistance to impurity particle pollution.
Author Contributions
L.C. designed the experiments, did the motion characteristics experiments and breakdown voltage measurement; Y.J. improved the simulation method, analyzed the experiment data; M.D., Y.L., and W.Q. contributed the motion characteristics and breakdown experiments, as well as the discussion and wrote the paper. J.H. revised the paper. All authors have read and agreed to the published version of the manuscript.
Acknowledgments
The authors thank the State Grid Corporation Science and Technology Project (Research on Insulation Defect Analysis and Testing Technology of UHV Converter Transformer), Funds for Innovative Research Groups of China (51321063) for the financial support.
Conflicts of Interest
The authors declare no conflict of interest.
References
- Huang, D.L.; Li, J.; Zhang, J.; Zhang, X.M.; Liang, S.N.; Li, X.D. Metallic particle effect on the AC breakdown strengths of vegetable insulating oil. In Proceedings of the 2015 IEEE Electrical Insulation and Dielectric Phenomena, Ann Arbor, MI, USA, 18–21 October 2015; pp. 605–608. [Google Scholar]
- Liao, R.J.; Liang, S.W.; Yang, L.J.; Hao, J.; Li, J. Comparison of ageing results for transformer oil-paper insulation subjected to thermal ageing in mineral oil and ageing in retardant oil. IEEE Trans. Dielectr. Electr. Insul. 2012, 19, 225–232. [Google Scholar] [CrossRef]
- Sun, C.X.; Li, J.; Li, X.H.; Grzybowski, S. Electric Properties of Vegetable Oil-Based Dielectric Liquid and Lifetime Estimation of the Oil-Paper Insulation. In Proceedings of the 2015 IEEE Electrical Insulation and Dielectric Phenomena, Kansas City, MO, USA, 15–18 October 2006; pp. 680–683. [Google Scholar]
- Vasconcellos, V.; Sbravati, A.; Zanetta, L.C.; Rapp, K.; Lombini, L.; Nazzari, S.; Scatiggio, F.; Valant, A. Increased loadability of transformers using natural ester and cellulosic materials as high temperature insulation systems. IEEE Electr. Insul. Mag. 2018, 34, 8–17. [Google Scholar] [CrossRef]
- Cai, S.W.; Chen, C.; Li, H.; Shao, M.F.; Chen, J.B.; Yin, J.; Guo, H.H. Research on electrical properties of natural ester-paper insulation after accelerated thermal aging. In Proceedings of the 2017 1st International Conference on Electrical Materials and Power Equipment, Xian, China, 14–17 May 2017; pp. 397–401. [Google Scholar]
- China Electric Power Enterprise Association. Natural ester transformer technology [M]; China Electric Power Press: Beijing, China, 2018. [Google Scholar]
- IEEE Guide for Acceptance and Maintenance of Natural Ester Fluids in Transformers. IEEE Std C57.147TM-2018; IEEE: New York, NY, USA, 2018.
- Li, Z.; Ma, Q. Monitoring the particle pollution degree of 500 kV transformer’s insulation oil. Transformer 1999, 36, 31–34. [Google Scholar]
- Zhou, Y.; Hao, M.; Chen, G.; Wilson, G.; Jarman, P. Study of the charge dynamics in mineral oil under a non-homogeneous field. IEEE Trans. Dielectr. Electr. Insul. 2015, 22, 2473–2482. [Google Scholar] [CrossRef]
- Fahmi, D.; Negara, Y.; Asfani, A.; Hernanda, S.; Deliana, H.; Soebagio, C. Floating Metal Particle Motion Characteristics with Shape and Size Variation in the Oil Insulation Under DC Voltage. In Proceedings of the 2019 International Seminar on Intelligent Technology and Its Applications, Surabaya, Indonesia, 28–29 August 2019; pp. 259–264. [Google Scholar]
- Li, X.X.; Tang, J.; Ma, S.X.; Yao, Q. The impact of temperature on the partial discharge characteristics of moving charged metal particles in transformer oil. In Proceedings of the 2016 IEEE International Conference on High Voltage Engineering and Application, Chengdu, China, 19–22 September 2016; pp. 1–4. [Google Scholar]
- Li, Y.L.; Wang, Y.Y.; Zhang, J.; Wei, C.; Lu, Y.C. Carbon particle effect on the breakdown strength of insulating oil at AC and DC voltages. In Proceedings of the 2016 IEEE Electrical Insulation Conference, Montreal, QC, Canada, 19–22 June 2016; pp. 563–566. [Google Scholar]
- Chen, L.; Heng, W.U.; Li, Y.L.; Huang, L.F. Effect of Carbon Particles on Breakdown Strength of Insulating Oil Under AC/DC Composite Voltage. Insul. Mater. 2018, 51, 21–27. [Google Scholar]
- CIGRE. Effect of Particles on Transformer Dielectric Strength; WG 17/SC12; CIGRE: Paris, France, 2000. [Google Scholar]
- Lu, W.; Liu, Q. Effect of fiber particles on impulse breakdown in ester transformer liquids in uniform electric fields. IEEE Trans. Dielectr. Electr. Insul. 2015, 22, 2554–2564. [Google Scholar] [CrossRef]
- Zhao, T. Research of the Effect of Bubbles and Fiber Particles on Impulse Breakdown in Transformer Oil. Ph.D. Thesis, North China Electric Power University, Beijing, China, 2017. [Google Scholar]
- Mahmud, S.; Chen, G.; Golosnoy, I.O.; Wilson, G. Bridging in contaminated transformer oil under AC, DC and DC biased AC electric field. In Proceedings of the 2013 IEEE Electrical Insulation and Dielectric Phenomena, Shenzhen, China, 20–23 October 2013; pp. 943–946. [Google Scholar]
- Mahmud, S.; Chen, G.; Golosnoy, I.O.; Wilson, G.; Jarman, P. Experimental studies of influence of DC and AC electric fields on bridging in contaminated transformer oil. IEEE Trans. Dielectr. Electr. Insul. 2015, 22, 152–160. [Google Scholar] [CrossRef]
- Mahmud, S.; Chen, G.; Golosnoy, I.O.; Wilson, G.; Jarman, P. Bridging phenomenon in contaminated transformer oil. In Proceedings of the International Conference on Condition Monitoring and Diagnosis, Piscataway, NJ, USA, 23–27 September 2012; pp. 180–183. [Google Scholar]
- Li, J.; Zhang, Q.; Li, Y. Generation process of impurity bridges in oil-paper insulation under DC voltage. High Volt. Eng. 2016, 12, 211–218. [Google Scholar]
- Li, Y.; Zhang, Q.; Li, J.; Wang, T.; Dong, W.; Ni, H. Study on micro bridge impurities in oil-paper insulation at DC voltage: Their generation, growth and interaction with partial discharge. IEEE Trans. Dielectr. Electr. Insul. 2016, 23, 2213–2222. [Google Scholar] [CrossRef]
- Wang, S.; Shi, J.; Li, J. The effect of a macro-particle on the partial property of transformer oil. High Volt. Eng. 1994, 20, 26–29. [Google Scholar]
- Fu, S. The acquired charge of macro-particle and its effect on the partial discharge of transformer oil. High Volt. Eng. 2000, 26, 49–50. [Google Scholar]
- Tang, J.; Zhu, L.M.; Ma, S.X. Characteristics of suspended and mobile micro bubble partial discharge in insulation oil. High Volt. Eng. 2010, 36, 1341–1346. [Google Scholar]
- Ma, S.X.; Tang, J.; Zhang, M.J. Simulation study on distribution and influence factors of metal particles in transaction transformer. High Volt. Eng. 2015, 41, 3628–3634. [Google Scholar]
- Wang, Y.Y.; Li, Y.L.; Wei, C.; Zhang, J.; Li, X. Copper particle effect on the breakdown strength of insulating oil at combined AC and DC voltage. J. Electr. Eng. Technol. 2017, 12, 865–873. [Google Scholar] [CrossRef]
- Wang, Y.; Li, X. Motion characteristic of copper particle in insulating oil under AC and DC voltages. In Proceedings of the 19th IEEE International Conference on Dielectric Liquid, Manchester, UK, 25–29 June 2017; pp. 25–29. [Google Scholar]
- Wang, X.; Wang, Z.D.; Noakhes, J. Motion of conductive particles and the effect on AC breakdown strengths of esters. In Proceedings of the IEEE International Conference on Dielectric Liquids, Trondheim, Norway, 26–30 June 2011; pp. 1–4. [Google Scholar]
- Wang, X.; Wang, Z.D. Particle effect on breakdown voltage of mineral and ester based transformer oils. In Proceedings of the IEEE Conference on Electrical Insulation and Dielectric Phenomena, Quebec City, QC, Canada, 26–29 October 2008; p. 598. [Google Scholar]
- Hao, J.; Liao, R.; Dan, M.; Li, Y.; Li, J.; Liao, Q. Comparative study on the dynamic migration of the cellulose particles and its effect on the conductivity in natural ester and mineral oil under DC electric field. IET Gener. Transm. Distrib. 2017, 11, 2375–2383. [Google Scholar] [CrossRef]
- Dan, M.; Hao, J.; Liao, R.J.; Cheng, L.; Zhang, J.; Li, F. Accumulation behaviors of different particles and effects on the breakdown properties of mineral oil under DC voltage. Energies 2019, 12, 2301. [Google Scholar] [CrossRef]
- Muhamad, H.S.Z.; Hidayat, Z.; Aminudin, A. Investigation of bridging phenomenon in ester oils contaminated with fiber particles [J]. In Proceedings of the International Conference on Power, Energy and Communication Systems, Perlis, Malaysia, 24–25 August 2015; pp. 408–413. [Google Scholar]
- Mahmud, S.; Chen, G.; Golosnoy, I.O.; Wilson, G.; Jarman, P. Bridging in contaminated transformer oil under DC and AC electric field. In Proceedings of the Journal of Physics Conference Series, Reading, UK, 10–12 April 2013; p. 472. [Google Scholar]
- Molinari, G.; Viviani, A. Analytical evaluation of the electro-dielectrophoretic forces acting on spherical impurity particles in dielectric fluids. J. Electrost. 1978, 5, 343–354. [Google Scholar] [CrossRef]
- Pohl, H.A. The Motion and Precipitation of Suspensoids in Divergent Electric Fields. J. Appl. Phys. 1951, 22. [Google Scholar] [CrossRef]
- Peter, J.L.; Hsu, C.Y. Fiber Dielectrophoresis. Aerosol. Sci. Technol. 1989, 11, 206–212. [Google Scholar]
- Birlasekaran, S. The measurement of charge on single particles in transformer oil. IEEE Trans. Electr. Insul. 1991, 26, 1094–1103. [Google Scholar] [CrossRef]
- Mahmud, S. Influence of Contamination on the Electrical Performance of Power Transformer Oil. Ph.D. Thesis, University of Southampton, Southampton, UK, 2011. [Google Scholar]
- Naciri, N. Finite element analysis for power system component: Dust accumulation in transformer oil. Ph.D. Thesis, University of Southampton, Southampton, UK, 2011. [Google Scholar]
- Fu, S.; Wang, S.; Wang, J. Calculation of the motion trajectory of conductive particles in transformer oil. Mod. Electr. Power 1999, 16, 30–37. [Google Scholar]


© 2020 by the authors. Licensee MDPI, Basel, Switzerland. This article is an open access article distributed under the terms and conditions of the Creative Commons Attribution (CC BY) license (http://creativecommons.org/licenses/by/4.0/).