Article

Numerical Study of a Novel Concept for Manufacturing Savonius Turbines with Twisted Blades

Division of Electricity, Department of Electrical Engineering, Uppsala University, Box 534, 751 21 Uppsala, Sweden
*
Author to whom correspondence should be addressed.
Energies 2020, 13(8), 1874; https://doi.org/10.3390/en13081874
Submission received: 12 February 2020 / Revised: 2 April 2020 / Accepted: 4 April 2020 / Published: 12 April 2020
(This article belongs to the Section A3: Wind, Wave and Tidal Energy)

Abstract

:
This work presents a numerical study of the aerodynamic performance and the resulting flow field of two novel Savonius wind turbines with twisted blades. The novelty relies on the blade manufacturing process which is characterized by a ‘twisted cut’ through the central axis of a hollow cylinder (tube), followed by a partial twisted cut in the range of 90°. This approach does not require any expensive fabrication process such as blade molding and/or 3D prints, and, therefore, it can potentially mitigate the production costs. The main goal is to investigate the operational parameters and the overall performance of the presented devices, which are currently being operated in atmospheric conditions. For this purpose, three-dimensional simulations have been performed using the open-source CFD library OpenFOAM in order to solve the governing equations and for characterizing the main phenomena involved in the flow pattern. The Reynolds-averaged Navier–Stokes (RANS) approach together with the k ω SST model were employed to reproduce the flow turbulence effects. This model is validated using wind tunnel measurements of the power ( C P ) and torque ( C M ) coefficients from a straight blade Savonius turbine. Unsteady simulations of the two turbine prototypes were investigated at different tip speed ratio TSR ( λ ) by varying the rotational speed of the rotor while keeping constant the free stream (rated) velocity V . The results were compared against the Savonius turbine employed for validating the model. Aerodynamic loads and general wake structure were studied at the optimal operational conditions as well. For the same turbine configurations, the new blade geometry improved the performance by 20–25% (at its optimal TSR), compared to the conventional straight blade Savonius rotor, as well as the reducing torque fluctuation.

1. Introduction

Currently, there is a considerable interest in wind energy motivated by decreasing our dependence, as a society, on fossil fuels, and thereby reducing the greenhouse gases emissions. Although atmospheric wind is a free, non-polluting and inexhaustible energy source, the implementation of wind turbines into the community present several challenges such as the availability of undisturbed wind, profitability, noise production, etc. A modular (decentralized) design of renewable energy power plants, with more on-site electrical production systems, is desirable not only on developing areas, where a considerable sector of the population has no access to a conventional electricity service, but also in urbanized areas where a comfortable living space can be provided for future generations [1,2].
For the micro generation in urban environments, Vertical Axis Wind Turbines (VAWTs) represent an attractive alternative to the conventional Horizontal Axis Wind Turbines (HAWTs), since their performance is much less influenced by the urban wind conditions such as high variability, turbulence, and a low mean speed [3]. Additionally, the omni-directionality of VAWTs provides the chance to exploit wind with a robust and inexpensive control system and easy access for maintenance of the generator (close to the ground). These characteristics taken together with reduced noise level, good self-starting ability, and peak performance at low rotational velocities make the VAWT Savonius type an suitable for operating under the urban environment [4].
The conventional Savonius (S-shape) turbine, considered a drag machine, consists of two semi-circular buckets which is characterized by a lower aerodynamic performance compared to turbines such as Darrieus and propellers’ rotors. Even though the Savonius starting torque is high, it is not uniform along one revolution. Moreover, at certain azimuthal angles, the torque coefficient is negative; therefore, the turbine can not start by itself [5]. The three bladed Savonius with a phase of 120° can overcome this, but the configuration decreases the power coefficient [6,7]. Another option is to use the modified twisted blade version (with two blades), called the helical Savonius turbine. It has been widely used for electricity generation due to its high aerodynamic performance compared to the conventional Savonius turbine. This turbine is commonly used for powering streets lamps together with solar cells panels and small battery banks [8].
There are several well-known studies of the aerodynamic performance, and wake characteristics, of conventional twisted Savonius turbines. Lee et al. [9] claimed, among others, that the torque coefficients stabilized and remained constant for twist angles greater than 90°. Experimentally, Damak et al. [10] and Saha et al. [11] further revealed the potential that the twisted bladed rotor possesses as compared to the conventional Savonius turbine under specific conditions. The wake from the turbine with helical configuration, experimentally investigated by Aliferis et al. [12], was found to be asymmetrical and deflected to the side where the blade moves in the opposite direction to the incoming wind. Kumar and Saini [13] carried out a numerical analysis aiming to optimize the blade twist angle of a Savonius hydrokinetic turbine. They showed that with a twisted angle of 12.5° it was possible to achieve a maximum power coefficient at a TSR of λ = 0.9 for a given water velocity of 2 m/s. Additionally, another numerical analysis for optimizing the blade arc angle and blade shape factor was done [14], achieving a maximum power coefficient for a blade arc angle of 150° and blade shape factor of 0.5, which correspond to a TSR of λ = 0.9 at a water flow velocity of 2 m/s.
For conventional straight blade Savonius turbines, an alternative to mitigate the large torque variations with rotor angle is by stacking single stage rotors one above the other with an equal phase shift (commonly called multi-staging) [15]. Kamoji et al. [16] investigated the performance of single, two, and three stages Savonius rotors showing that, for the tested devices, both power and torque coefficients increase with the increase in the Reynold numbers. It was also revealed that two and three stages rotors showed the same performance, even after increasing both stage and rotor aspect ratios. The performance was decreased by increasing the number of stages while keeping the aspect ratio. The three stage rotor provided a lower torque coefficient variation. Saha et al. [17] investigate the effects of the number of stages in both turbines with straight and twisted blades. It was observed that the turbine performance increases with the increase from one to two stages, but decreases from two to three stages due to the increase of the rotor inertia. This study resulted in an optimal configuration with two stages, which is independent of the blade geometry.
The presented work introduces a novel manufacturing process of helical Savonius wind turbines with the focus of optimizing the design configuration of twisted blades and mitigating the production costs. The novelty consists of a “twisted cut” along the central axis of a tube, followed by a secondary partial twist within the range of 90°. With this method, there is no need of complex or expensive fabrication process such as blade molding and/or 3D printing; therefore, it can potentially reduce the production costs of the device. The aerodynamic performance and the main flow phenomena involving in the resulting wake structure of two turbine prototypes (already in operation) are studied. A preliminary study for validating the numerical model is carried out using the wind tunnel measurements of the power and torque coefficients of a conventional straight blade Savonius turbine.

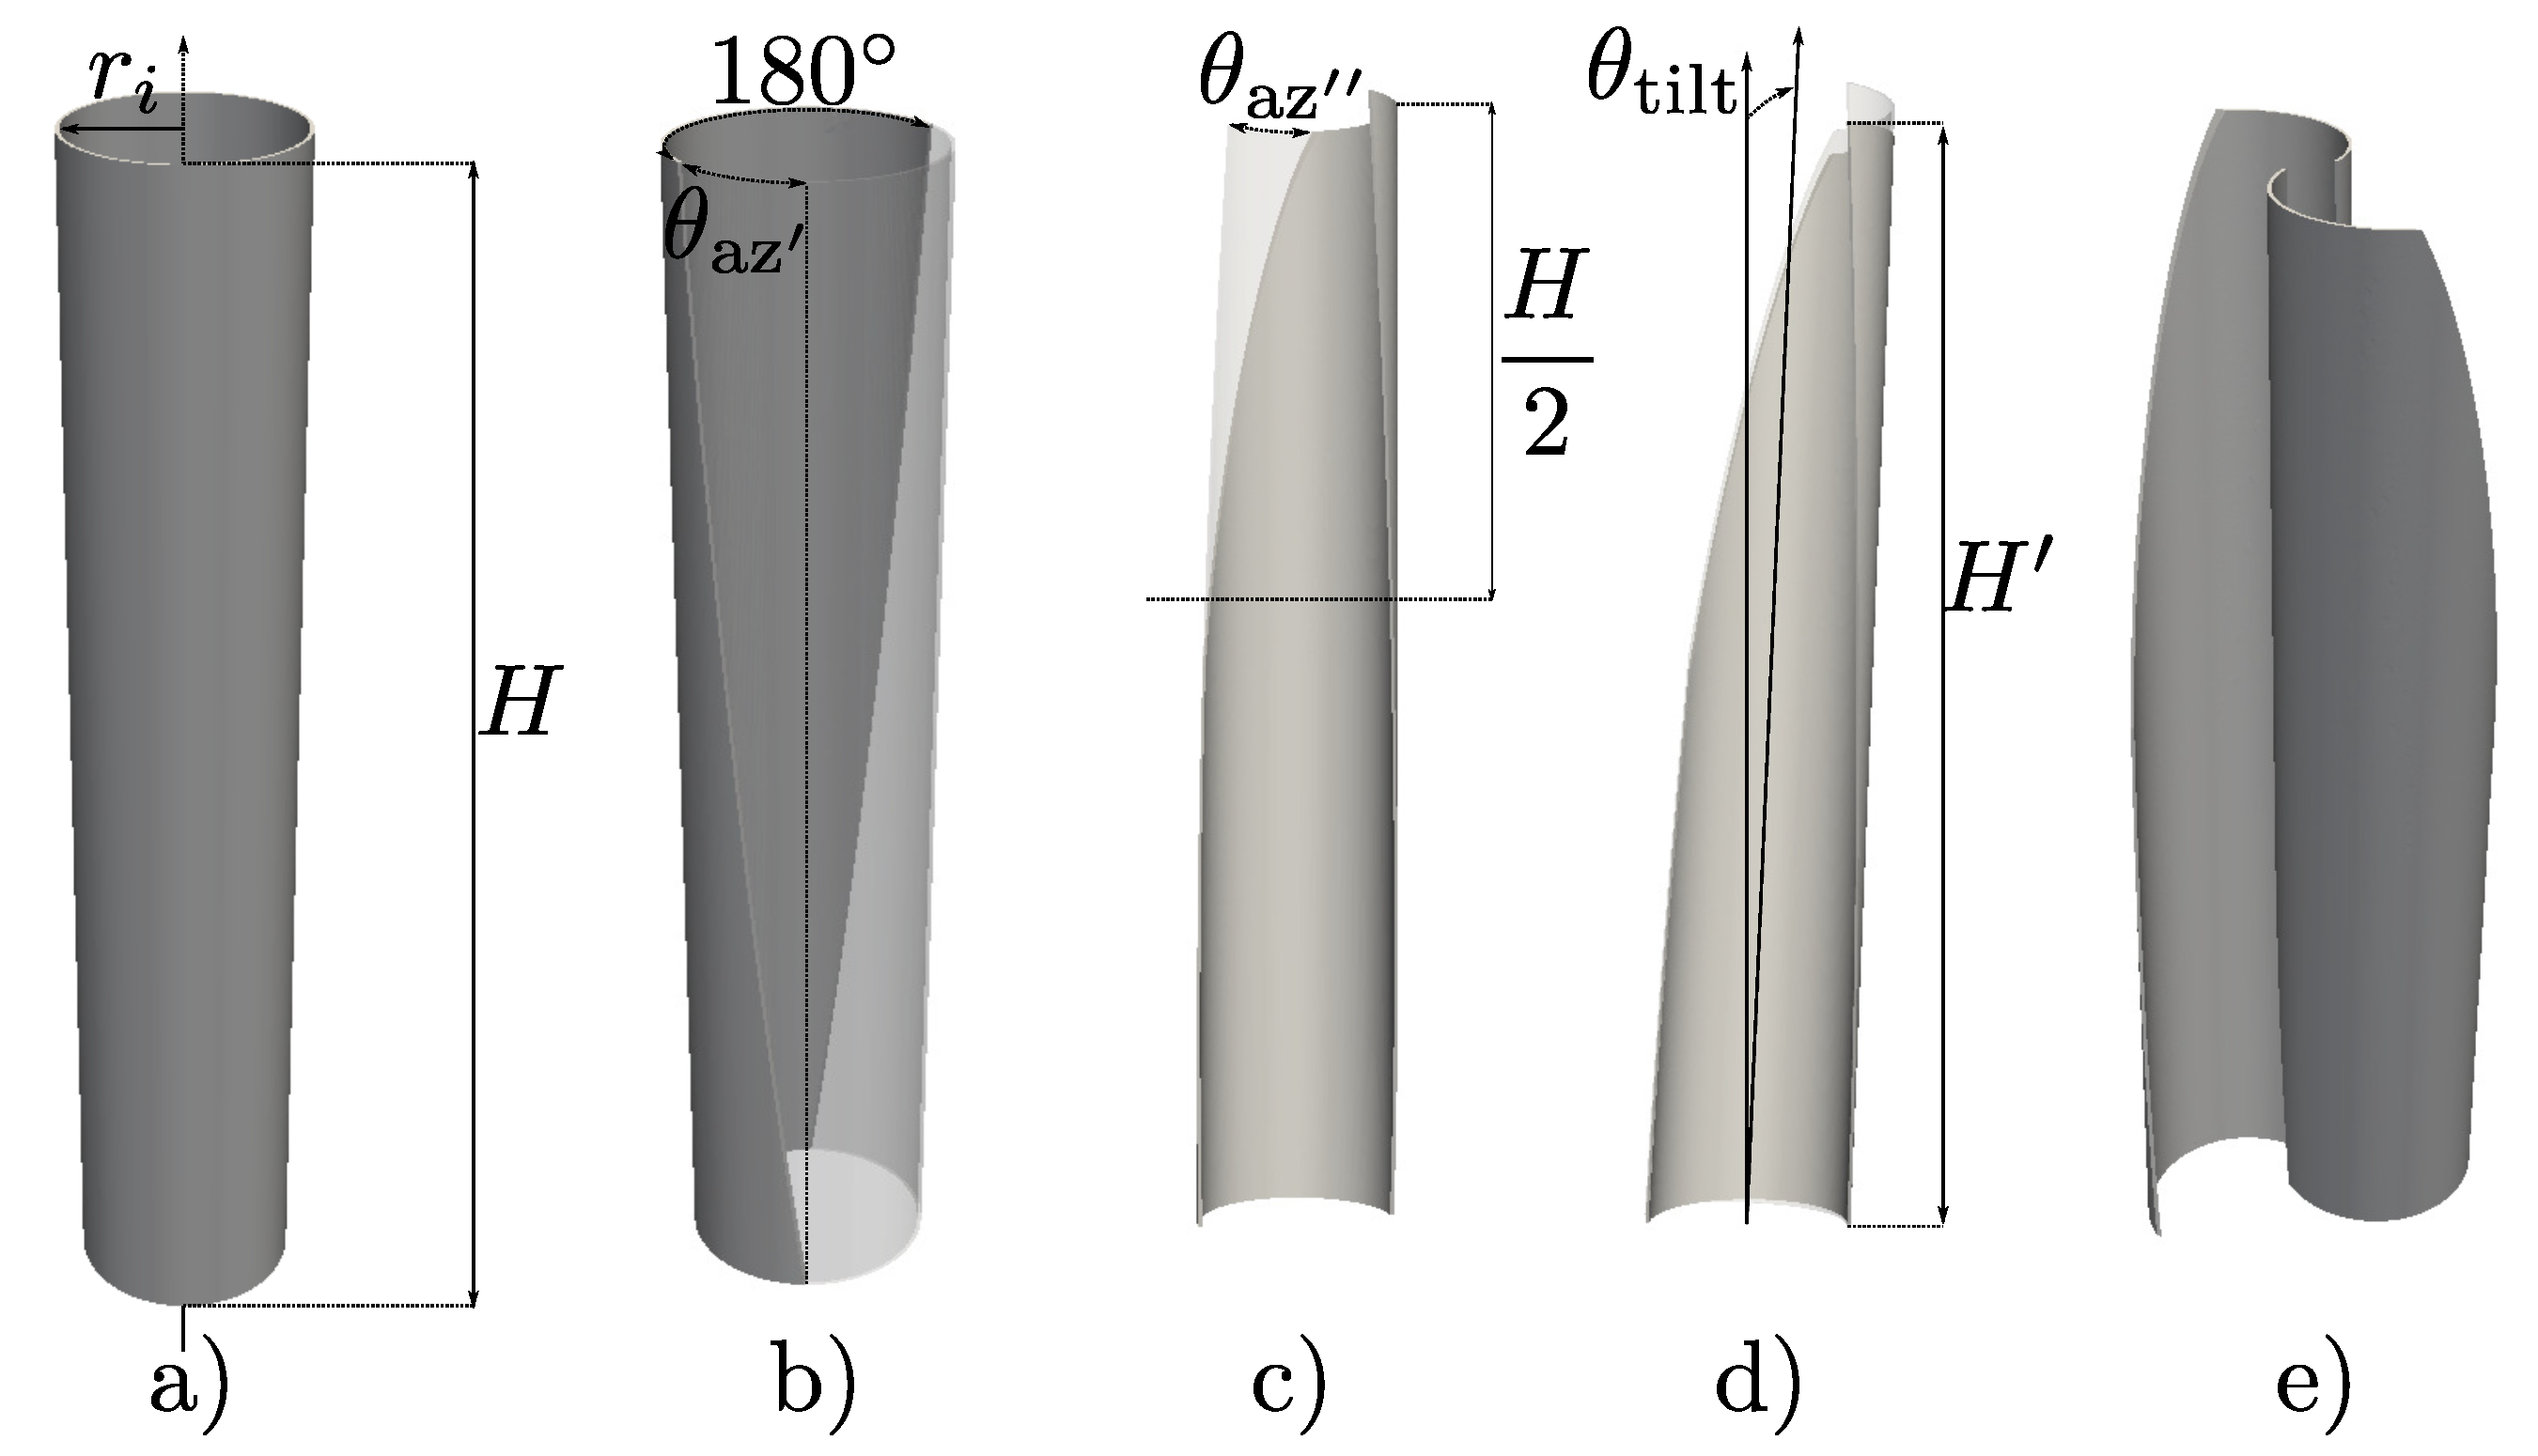
2. Description of the Novel Twisted Blades Manufacturing Concept

The traditional Savonius twisted blades turbine concept consists of a twist of two displaced half cylinder cross-sections in a horizontal plane, and vertically swept together with an azimuthal increase around the rotation axis. The presented manufacturing approach is based on a symmetric “twisted cut” along a hollow cylinder, resulting in two identical parts, followed by a secondary partial cut (in the range of 90°). These twisted cuts aim to reduce vibrations, noise, and torque fluctuations. Moreover, it allows the self-starting capability of the turbine, which is not always the case of the conventional Savonius straight blade rotor. A schematic of the blade manufacturing process for the SAVANT prototype (explained in the following sub-section) is shown in Figure 1:
Figure 2 depicts seven cross-sections (equally distant) along the rotation axis for the SAVANT prototype. It is observed that the resulting geometry can be compared to a traditional helical Savonius turbine with a twist angle of 90°.
On this work, two turbine prototypes in operation will be investigated: SAWINT and SAVANT. These turbines are shown in Figure 3.

2.1. SAWINT: Savonius Turbine for Micro-Grid Systems

The SAWINT is a SAvonius WINd Turbine aimed to be used for domestic applications together with solar panel installations. As the solar panels for buildings commonly have the rating around 250 W, the turbine was designed to give a rated power of 500 W at 12 m/s, which on annual basis would generate the same amount of energy as two to four panels, depending on local wind and solar conditions. The design closely matches that of SAVANT with an integrated Air-Gap Permanent Magnet Synchronous Generator (AGPMSG) with a larger diameter than the one from SAVANT, in order to accommodate the larger power and lower rotational speed. The turbine dimensions are 2 m in height and 1 m in diameter. It is characterized by θ az 60 , θ az 12 and θ tilt 10 .

2.2. SAVANT: Savonius Turbine for Energy Production in Extremely Cold Conditions

The SAVANT is a small SAVonius turbine for ANTarctic conditions, i.e., low temperature, katabatic winds, and demands on very low EM-noise emission to feed measuring equipment with charging power at a low average level (5–10 W depending on wind conditions). The system in the present configuration integrates the twisted Savonius turbine with a directly driven AGPMSG. The combination permanent magnet (PM) and air-gap winding were chosen to eliminate magnetization losses in rotor and magnetic losses in stator, while the turbine is idling or in low wind conditions, i.e., rotating in weak winds which barely supplies power to generate any current, as wind statistics for most sites indicated dominating weak wind conditions. The turbine dimensions are 0.6 m in height and 0.28 m in diameter. It is characterized by θ az 60 , θ az 60 and θ tilt 6 . This turbine has been employed for the neutrino research project ARIANNA [18].

3. Methodology

3.1. Numerical Model

For the examined cases, the Reynolds decomposition property is applied for the solution of the unsteady incompressible flow, with a reasonable computational cost. Considering the Reynolds decomposition, a flow variable is decomposed into the mean (time-averaged) component and fluctiating component, therefore the continuity equation is transformed to the continuity equation for the mean flow and the Navier–Stokes to the Reynolds Averaged Navier–Stokes (RANS) [19]. The two-equations based k- ω SST (Shear Stress Transport) is used for the solution of the Reynolds stresses included in the RANS equations. The k- ω SST model has been widely employed in other relevant works, since the effects of blades are accurately captured [20,21,22]. Various schemes are used to discretize each term of the incompressible Navier Stokes equations, which are listed in Table 1.
The Computational Fluid Dynamics (CFD) toolbox for the turbulence model simulations is OpenFOAM (version 4.1), and the simulations were performed using the pimpleFoam solver, which is a transient solver for incompressible flow of Newtonian fluid by using the PIMPLE algorithm to solve the nonlinear governing Navier–Stokes equations and the additional equations from the turbulence approach. This algorithm is a combination of the Semi-Implicit Method for Pressure Linked Equations (SIMPLE) with the Pressure-Implicit Split Operator (PISO) algorithms. The combined algorithm is controlled by both inner and outer iterations, by implementing the pressure-correction with the SIMPLE and PISO approaches, respectively [23]. The PIMPLE algorithm provides good stability for large time steps where the maximum Courant number (Co) may frequently be above 1 or when the nature of the solution is inherently unstable. For all the studied cases, an adjustable time step has been considered such that the Courant number is always kept below 1 ( Co 1 ). All the obtained results correspond to the averaged values for at least four turbine revolutions after the simulations achieved the convergence, which happens once all residuals magnitude values are lower than 1 × 10 2 for each time step (usually takes five revolutions). At that moment, no less than 5000 time steps are solved per one rotor revolution.

3.2. Simulation Parameters: Validation Case

The test case chosen for validating and evaluating the performance of the implemented numerical model is based on the results of the torque and power provided by Sandia laboratories in [7]. The considered experimental activity implemented by Blackwell et al. in a low-speed wind tunnel test, using a conventional Savonius rotor with two blades which has a diameter D t of 0.9024 m and a height H of 1 m (see Figure 4). In Table 2 together with Figure 4, relevant specifications of the mentioned turbine are shown. The results are presented in the form of power and torque coefficients ( C P and C M , respectively) as a function of the tip speed ratio TSR ( λ ).
The boundary conditions are defined as follows; at the inlet, the free stream velocity has a constant uniform value of V free stream = 7 m/s and zero pressure gradient are considered. In order to test different TSRs, the rotational speed Ω is varied. At the outlet, the pressure is matched with the atmospheric pressure level (fixed to zero), while a zero gradient is considered for the velocity. For the turbine, the moving wall (with no-slip condition) and zero gradient conditions are applied for the velocity and pressure, respectively. The considered domain consists in a 20 × 6.1 × 4.6 m3 test section. The cross section of the considered domain has the same dimensions as the wind tunnel employed for the experimental activity on [7]. A Cartesian coordinate system has been employed, placing the center of the studied turbine at the origin, such that the x-axis is pointing positive in the downwind direction. This turbine employed for validating the model and comparison with the twisted turbines is further denoted as SAVONIUS-H1.
At the inlet, the variables turbulent kinetic energy k and specific dissipation rate ω , which are fundamental for the turbulence model. The turbulent intensity is equal to 1.4% as referred to in [7]. ω is defined as
ω = C μ 2 k 1 / 2 l
where C μ = 0.09 , and l is equal to 0.07 times the hydraulic diameter of the wind tunnel.
Since the turbine rotor covers a considerable portion of the wind tunnel cross-section, the wind is accelerated due to the blockage effect. Therefore, the free stream velocity has been corrected by using the blockage factor ϵ , as done for the experimental activity seen in the study performed by Blackwell. The correlation of Pope and Harper is applicable on this case [24], and is described as
V = V free stream 1 + ϵ
with
ϵ = D T H 4 A WT
where A WT is the cross-section area of the wind tunnel.

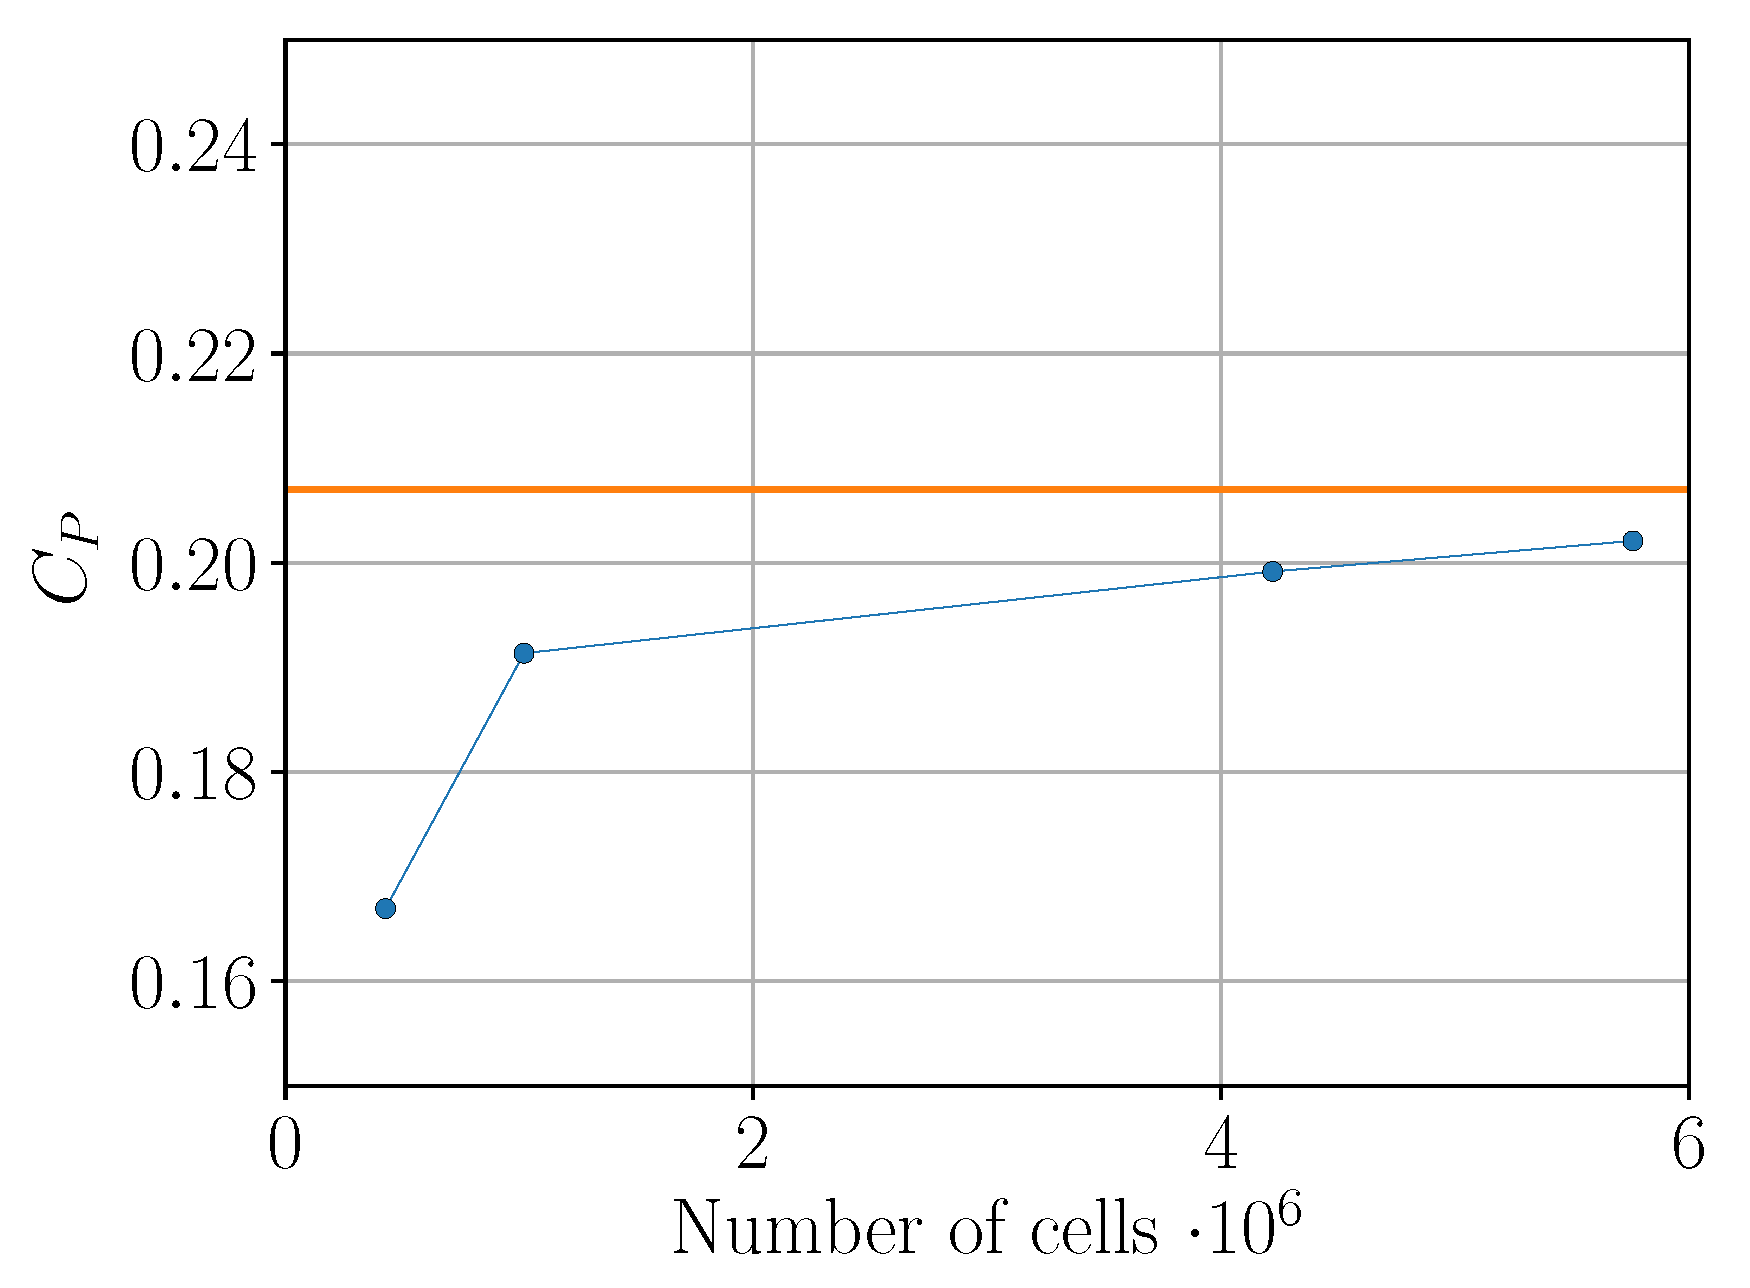
Mesh Spatial Sensitivity

The response of the model to the mesh size variation has been tested. Different domain discretizations were tested while keeping the same mesh topology with a uniform hexaedral distribution of cells in every direction considering a reference grid resolution of 5.5 cells per diameter. Two different refinement regions are considered: a primary rectangular one around and behind the turbine in order to capture the details of the resulting wake and a secondary cylindrical one (finer) in the region around the turbine for capturing the turbine-flow interaction, as it is shown in Figure 5. The moving mesh concept is applied with the turbine changing its position with respect to the upwind flow, and it consists of a cylinder with both a diameter and a height of 3.33 D , which is located inside the first refinement region. This mesh topology combined with seven layers on the whole turbine surface allowed to keep the values y + 1 , except for the blade and end plate edges, where the arrangement of layers did not cover those surfaces. The local refinement regions are characterized for different n-levels, where the reference cells are equally divided into 2 3 n sub-cells.
Figure 6 depicts an illustration of the obtained power coefficient results for a TSR of λ = 1 when varying the level of refinements. The power and torque coefficients are defined as
C P = P 1 2 ρ A V 3
and
C M = Q 1 4 ρ A V 2 D t
respectively, where A represents the frontal swept area of the rotor, with P and Q as the averaged power and torque obtained over one revolution, respectively.
The employed levels of refinement correspond with n = 1 , 1 , 1 , 2 and n = 2 , 3 , 4 , 4 for the primary and secondary refinement regions, respectively. It is observed that after the second refinement the results’ variations are not as big as after the first refinement. Since the last two local refinements produced a variation of 1.4% and 3.9% in the results (with respect to the fine mesh), while the first one of 12.7%, it can be considered that bigger refinements will not produce a relevant fluctuation (or improvement) of the results. Then, the finest configuration that has a good agreement with the expected experimental value shows an acceptable resolution that can be used for the remaining parts of the study.

4. Results and Discussion

In this section, results from the validation test case, and aerodynamic studies of both SAWINT and SAVANT are presented. For these twisted blades turbines, the mesh topology is the same as for the validation case described in Section 3.2.1; the only difference is the size of the reference mesh cells considered for the SAVANT turbine.

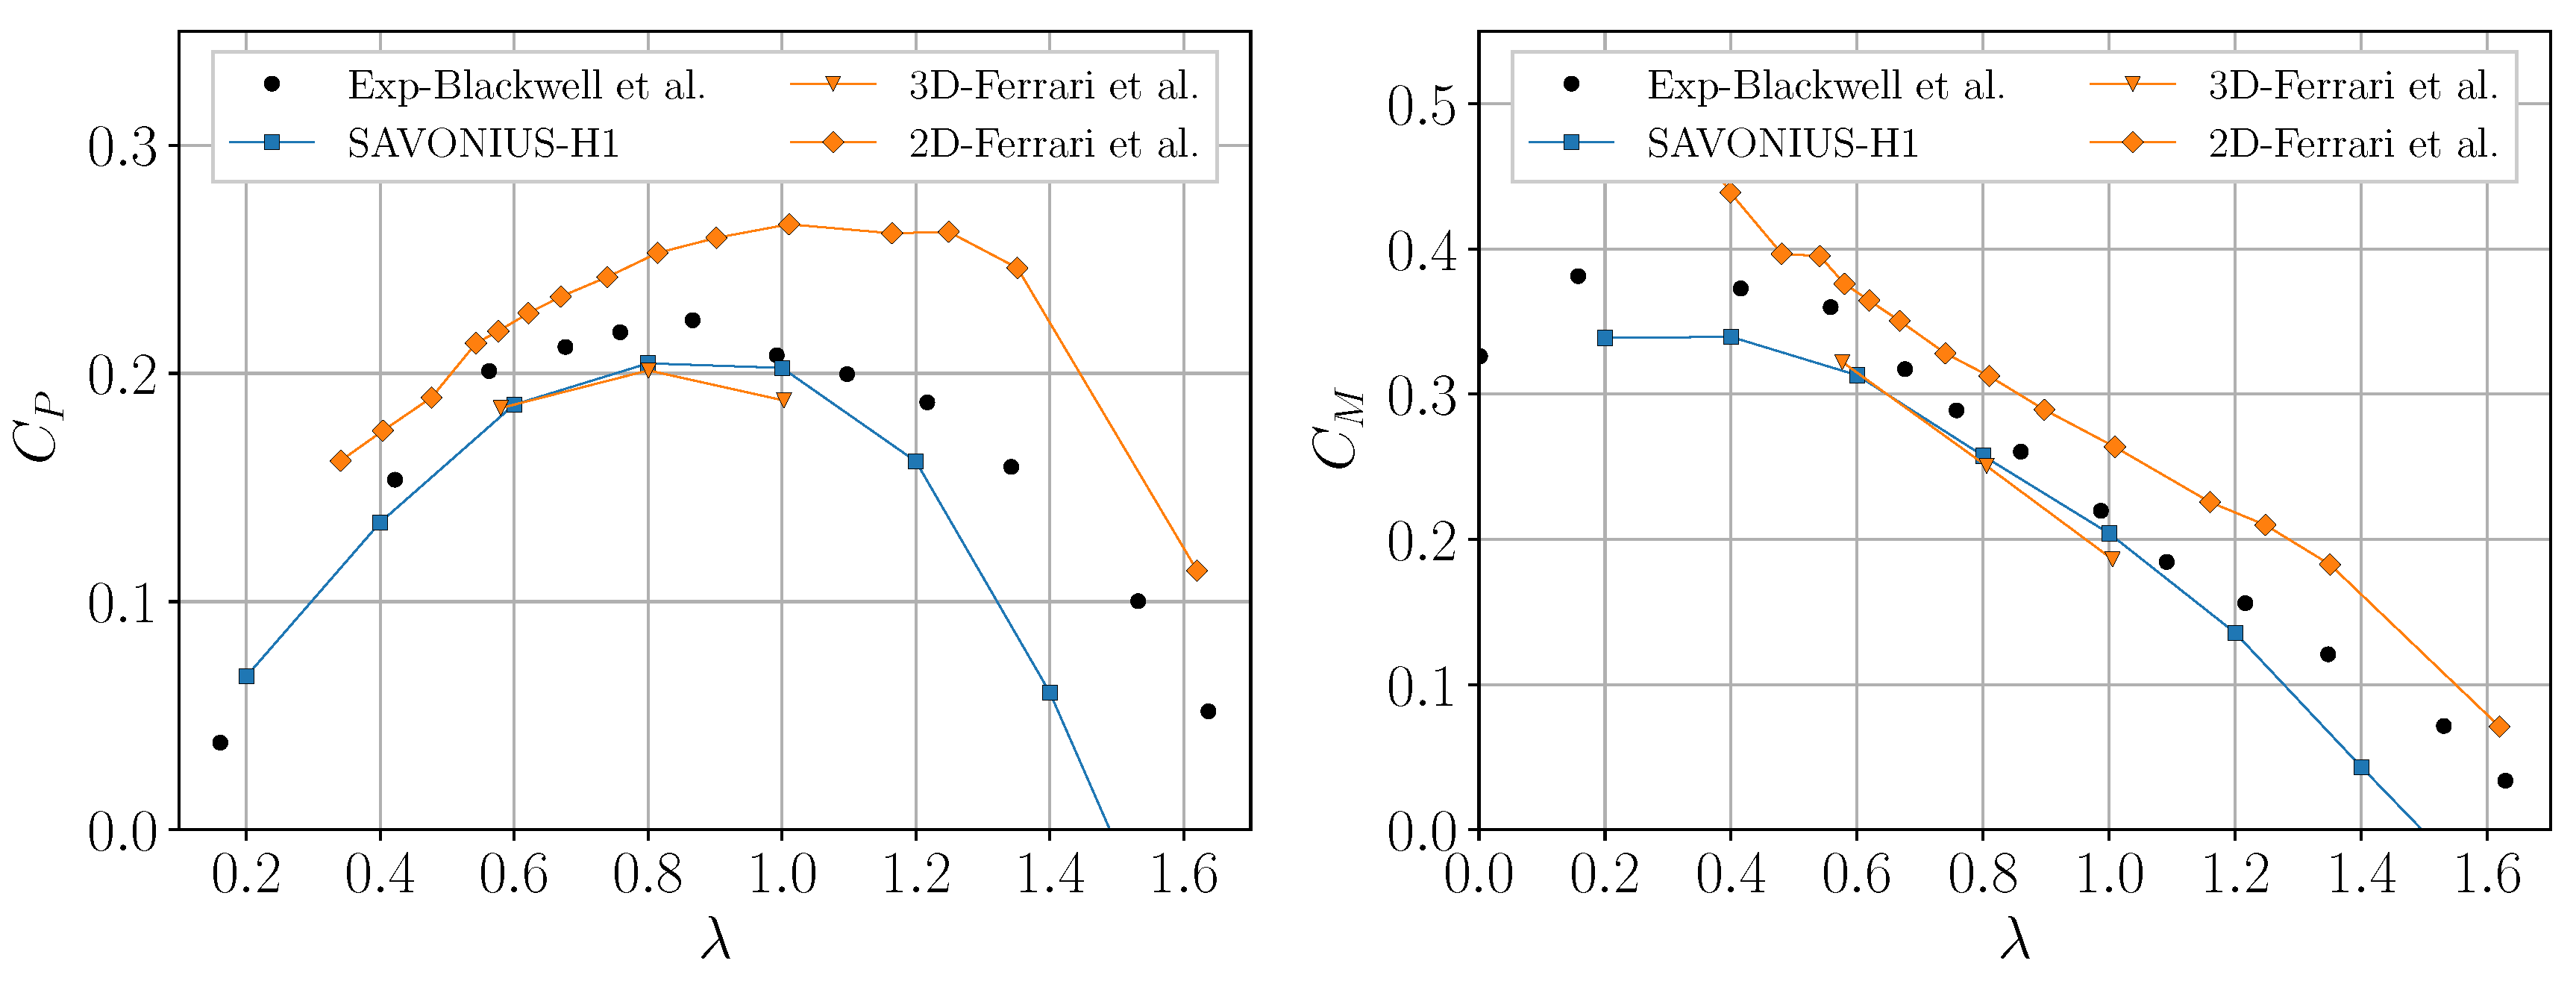
4.1. Power and Torque Coefficient Curves

The power and torque coefficient curves have been obtained as function of the TSR ( λ ). These curves provide information about aerodynamics properties of the turbine, allowing for identifying the optimal operation conditions (optimal λ ). It is depicted in Figure 7 that both C P and C M numerical curves are in agreement with the experimental values, especially in the region where the turbine operates at the maximum power coefficients (between λ = 0.6 and λ = 1.2 ). The obtained results have also been compared against the numerical (digitized) values from the work performed by Ferrari et al. [20], who investigated both two-dimensional and three-dimensional cases.
Discrepancies are observed for higher TSR values ( λ > 1.2 ) with both numerical C P and C M values being underestimated. This can be due to a lower capability of the model to represent relevant flow phenomena at high rotational velocities (high TSRs). An inaccurate prediction of the flow separation point at the outer surface of the blades can result in a wrong estimation of the resulting torque.

4.2. Aerodynamic Performance of SAWINT and SAVANT

The aerodynamic performance of both SAWINT and SAVANT are investigated in terms of the obtained power coefficients, torque coefficients, and resulting flow field pattern. In addition, these results are going to be compared against the obtained ones from the straight blade turbine SAVONIUS-H1 (studied in previous section).

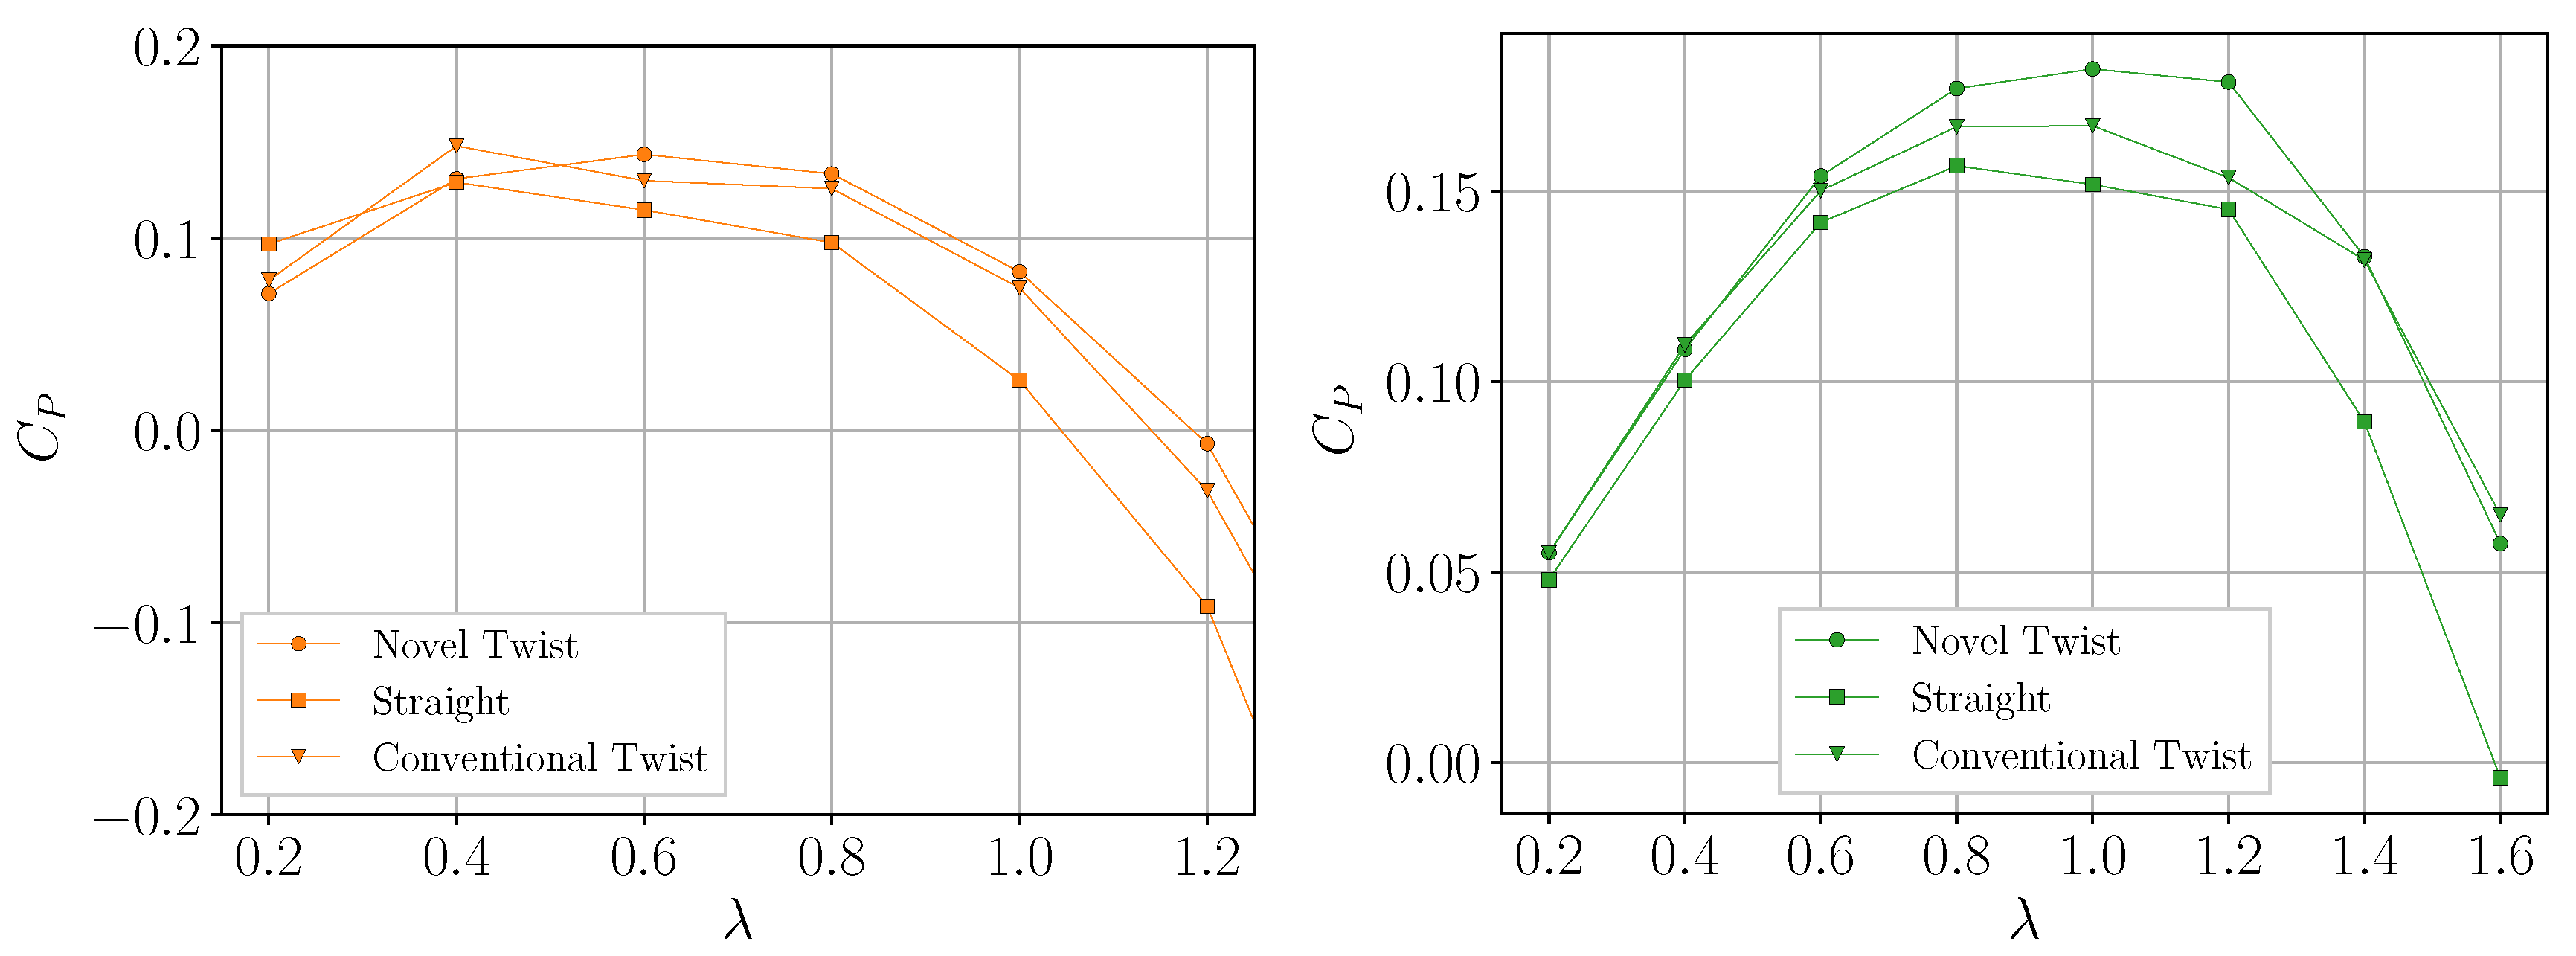
4.2.1. Power Coefficient Curves

Different geometric blade configurations of SAVANT and SAWINT were tested in order to evaluate the influence of the blade geometry on the performance of the turbines. The same dimensions (diameter and height) and operational conditions for different TSRs were kept constant. The considered geometries consist of:
  • a novel twisted blade obtained from manufacturing process presented in this work, which is based on the cutting of a hollow cylinder
  • the conventional Savonius straight blade rotor with S-shaped cross section constructed by two semi circular buckets and
  • the conventional twist blade with a cross section that changes to a certain degree in each step along the vertical axis (helical Savonius rotor).
All the studied turbines have the same cross section, and a twist angle of 90° for the twisted blade rotors. The results of the numerical C P curves are depicted in Figure 8.
For the SAWINT turbine, there is a similar performance for both twisted blades’ configurations: the presented method and the conventional one. The straight blade performance is slightly lower compared with the twisted blade turbines, and this difference increases with the TSR. All the configurations reach a maximum C P value of 0.14 at λ 0.5 . In the case of the SAVANT turbine, the twisted blades approach reaches a higher power output than the straight blades one, over the whole range of TSRs. In the operational regime of 0.6 λ 1.4 , higher values of C P are obtained by the turbine with the novel twisted blade configuration. The maximum values of C P are 0.182 and 0.167 for the novel and conventional approaches, respectively. In both cases, it occurs at λ = 1 . Large discrepancies appear between the straight and twisted blades concepts at λ > 1.2 .
Both turbines SAWINT and SAVANT were tested in a wide range of TSRs at their rated wind velocity, while varying the rotational speed. This was done in order to identify their optimal operational TSR for maximizing the power output (maximum C P ) and quantifying it. In addition, 12 m/s and 8 m/s are the rated wind velocities considered for SAWINT and SAVANT, respectively, thus different Reynolds numbers were considered in the operation conditions.
The results of the C P curves for each turbine are shown in Figure 9. There are notable differences on the obtained values of the C P curves, as well as the optimal operational regimes: the highest performance is achieved by SAVONIUS-H1 with a C P value of 0.21 at λ = 0.8 , followed by SAVANT whose maximum C P equals 0.18 at λ = 1 , and with the lower performance corresponding to SAWINT, with a maximum of C P = 0.143 at λ = 0.6 .

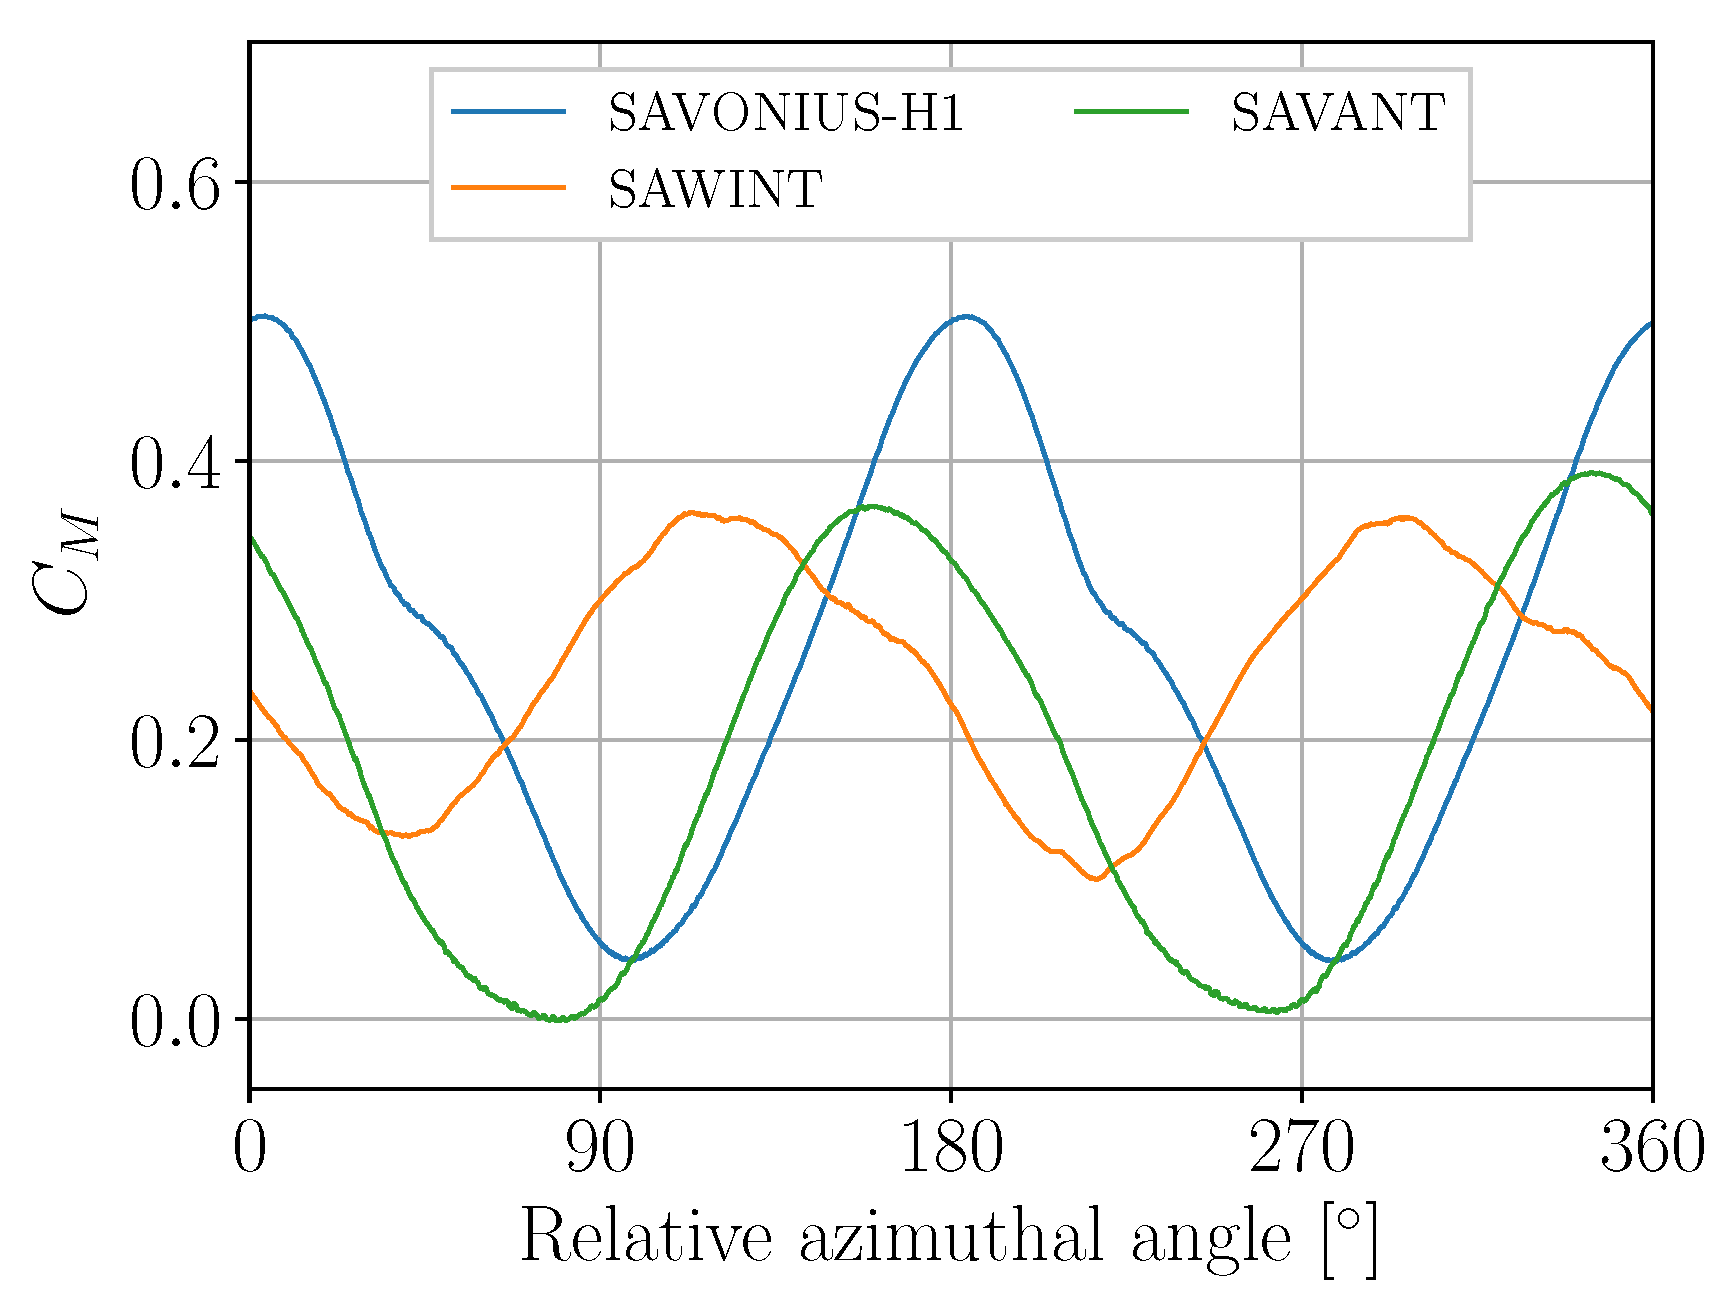
4.2.2. Torque Coefficient

The torque coefficient along one revolution has been studied for all the turbines at their optimal operating conditions. This characterizes the torque fluctuation, which is related to fatigue, and therefore structural damage of the device. The results in Figure 10 show that the larger fluctuation occurs to the straight blade turbine SAVONIUS-H1, followed by SAVANT and SAWINT. For all the turbines, both the amplitude and peaks (minimum and maximum) have different values.
The torque coefficient fluctuations of the two turbines with twisted blades, SAWINT and SAVANT, are smaller compared to the one from SAVONIUS-H1.

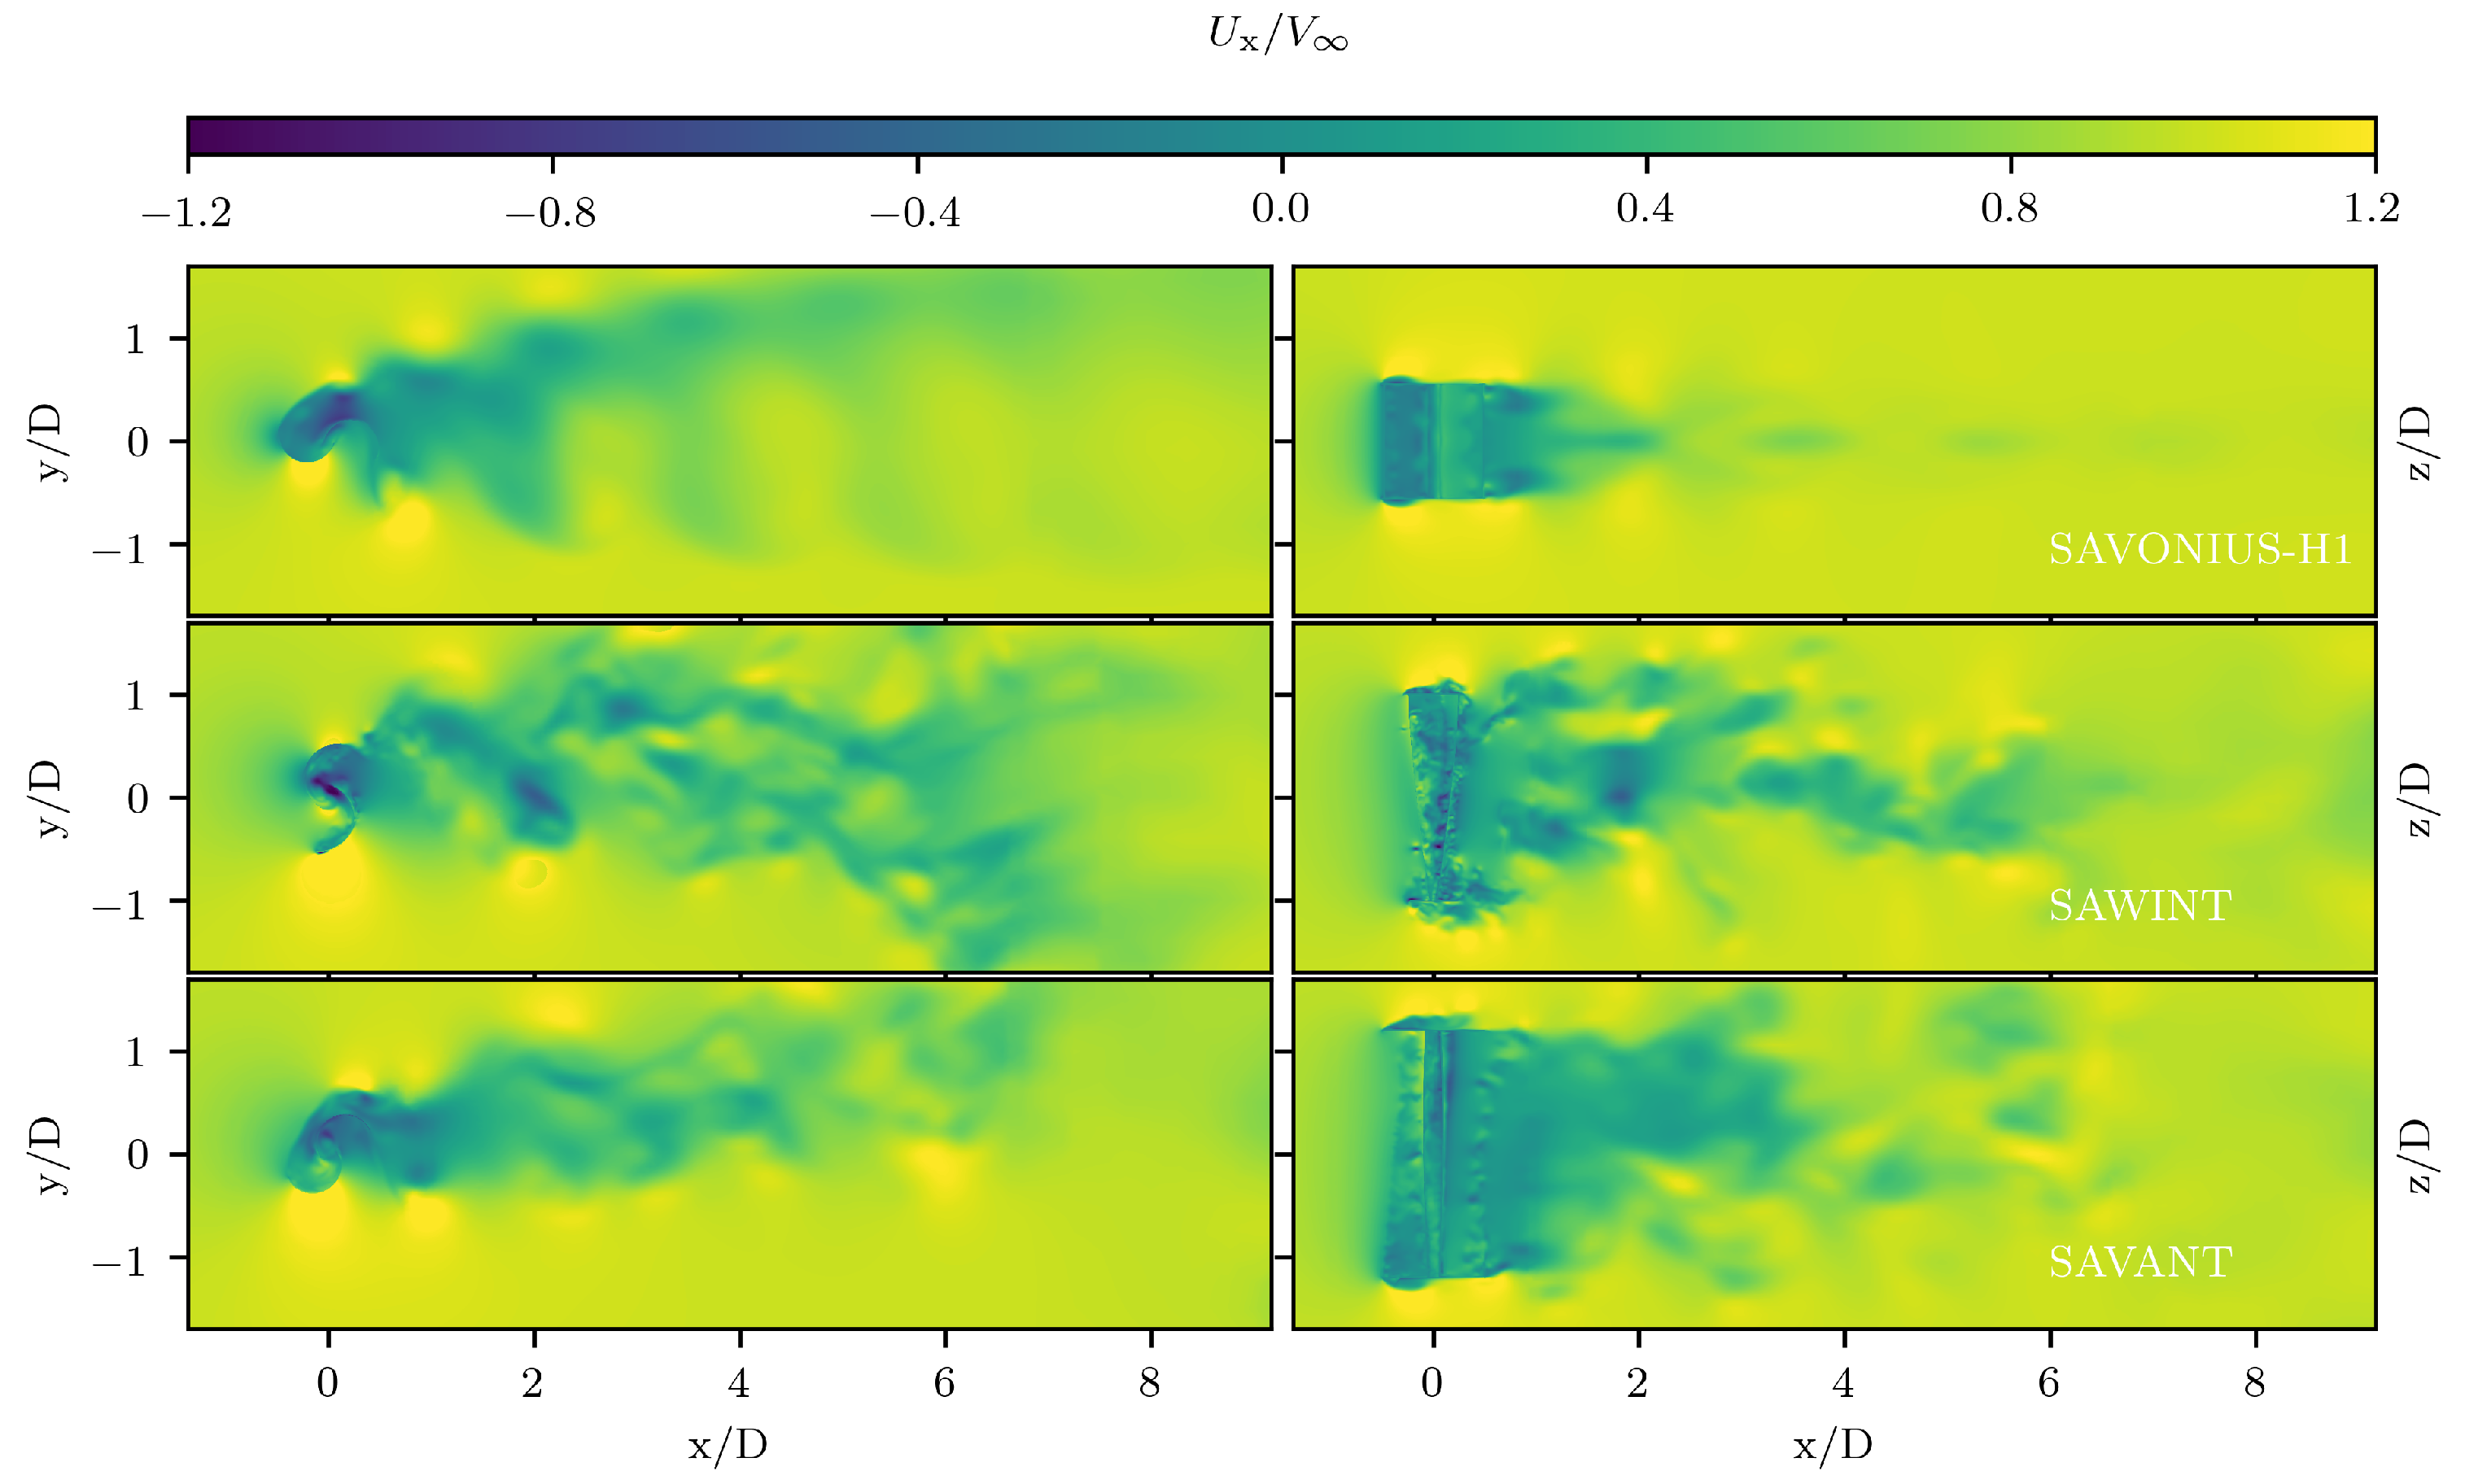
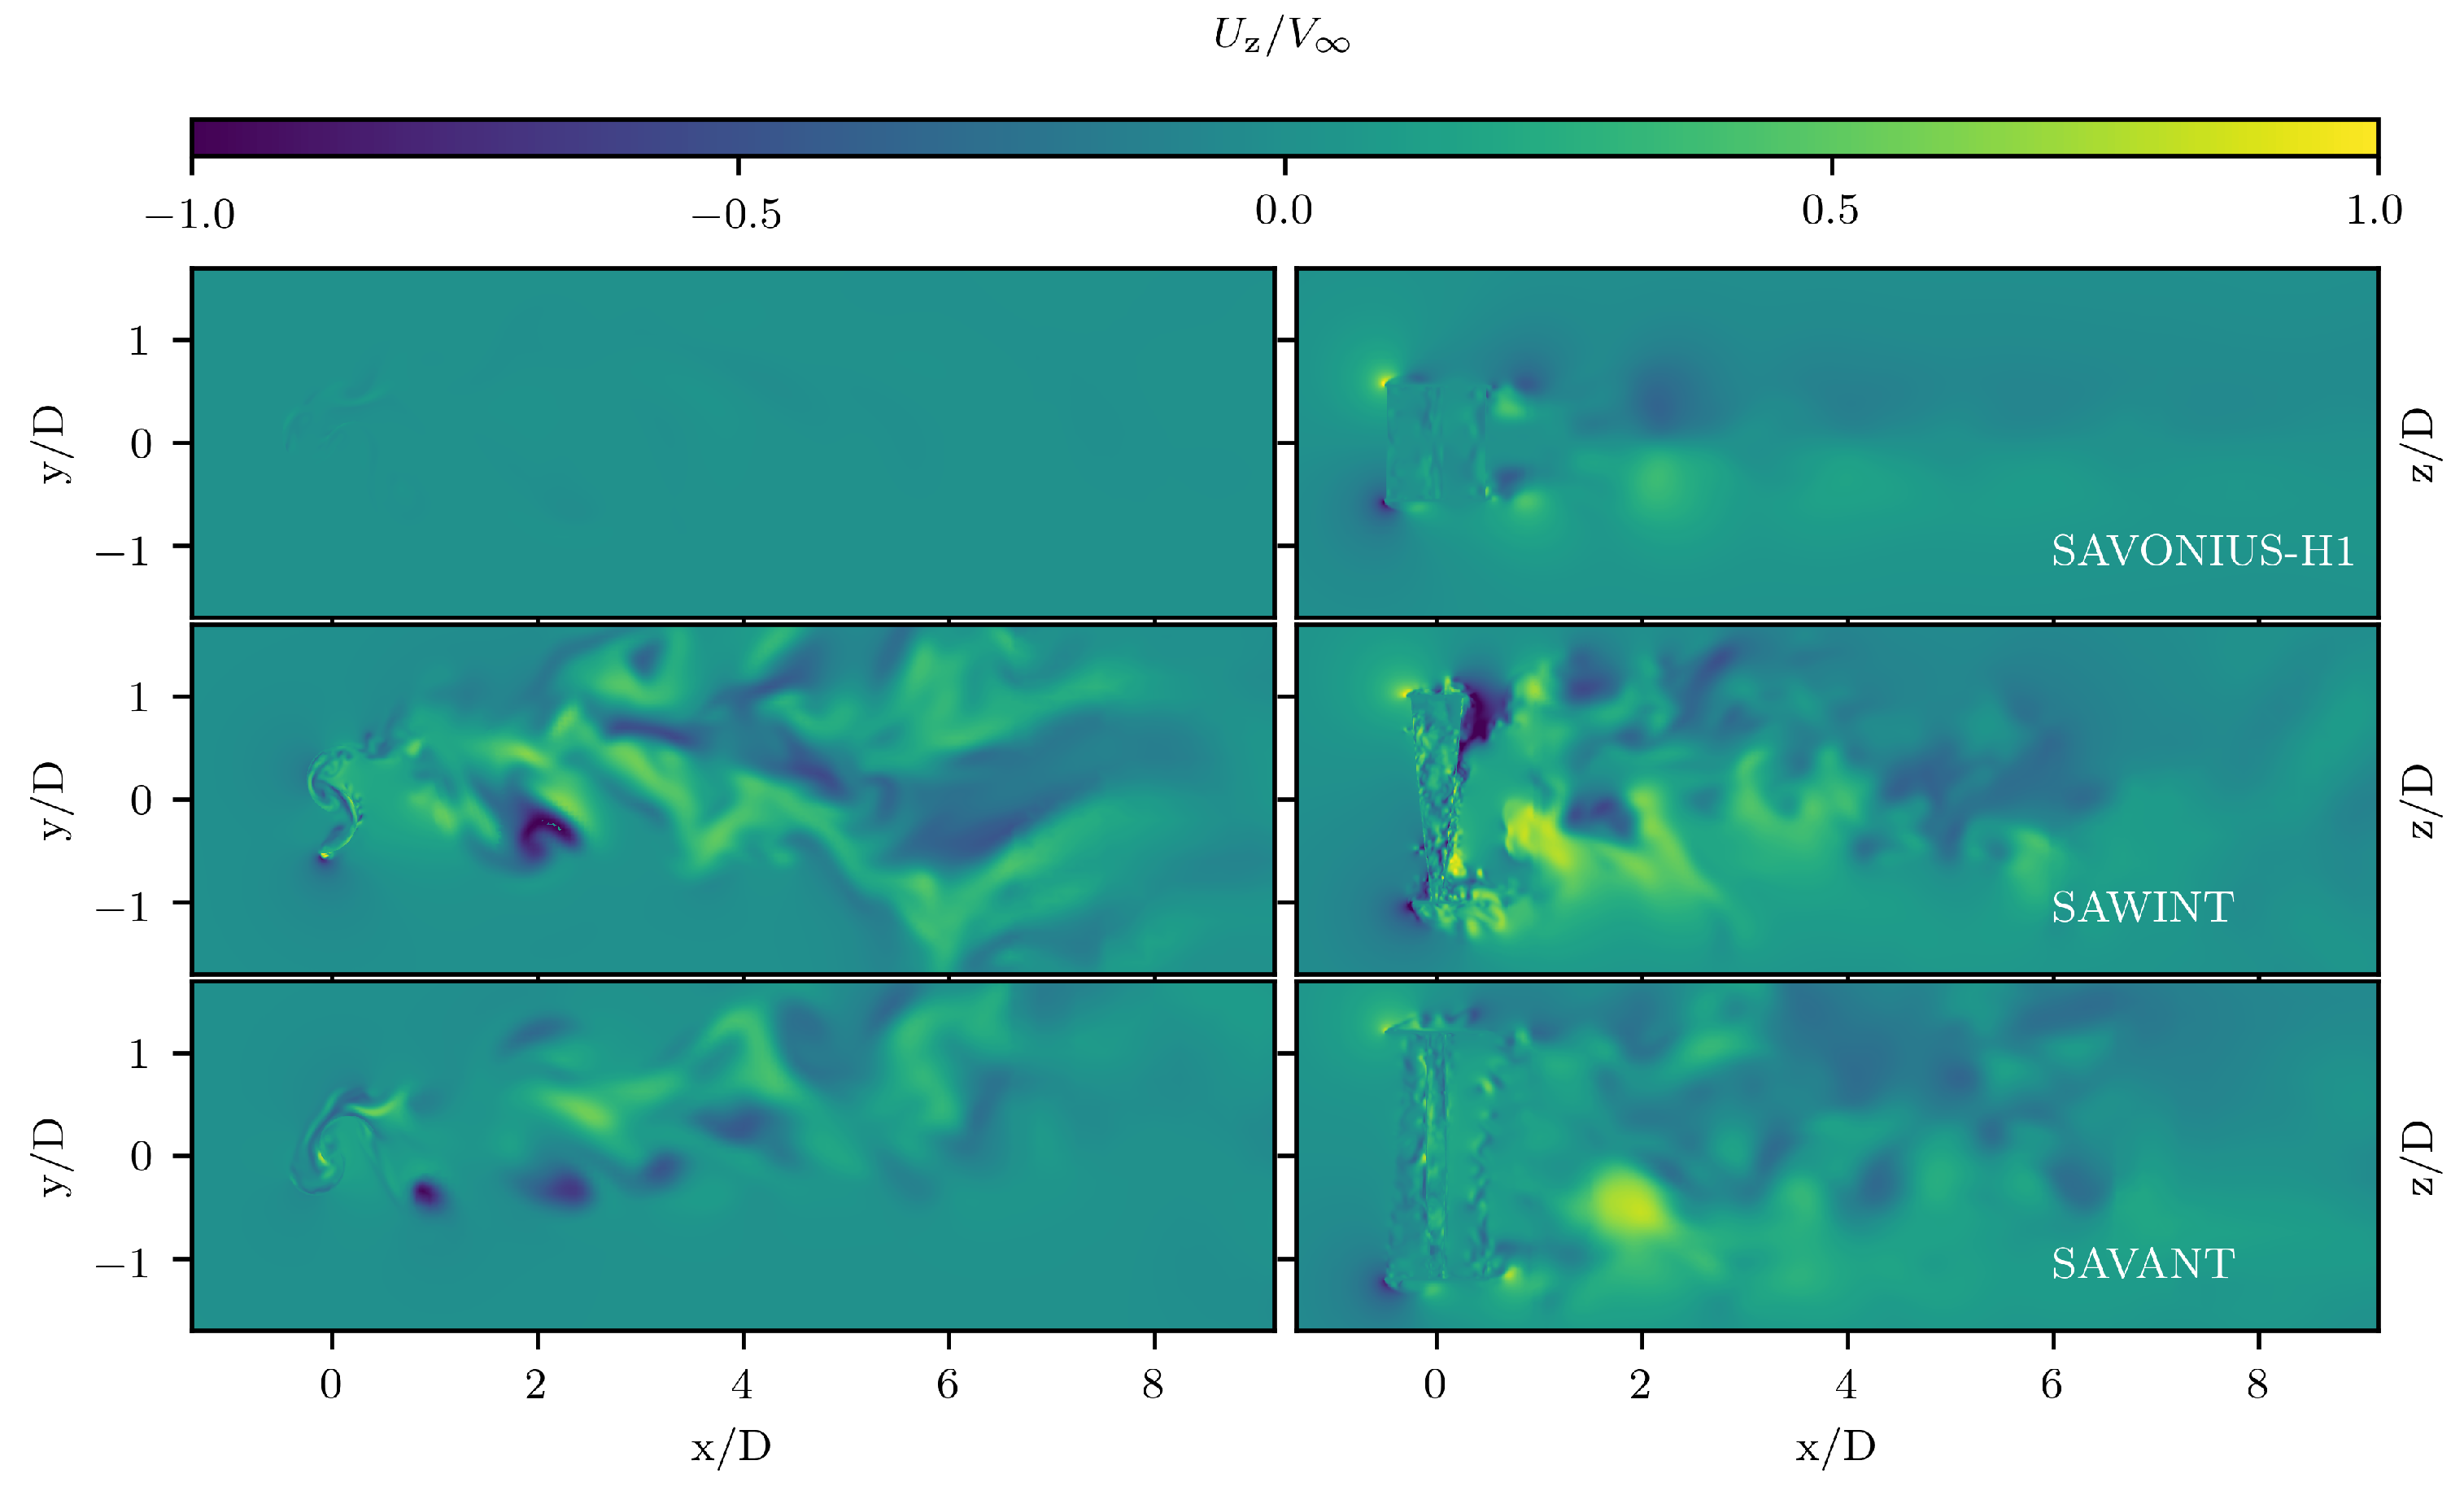
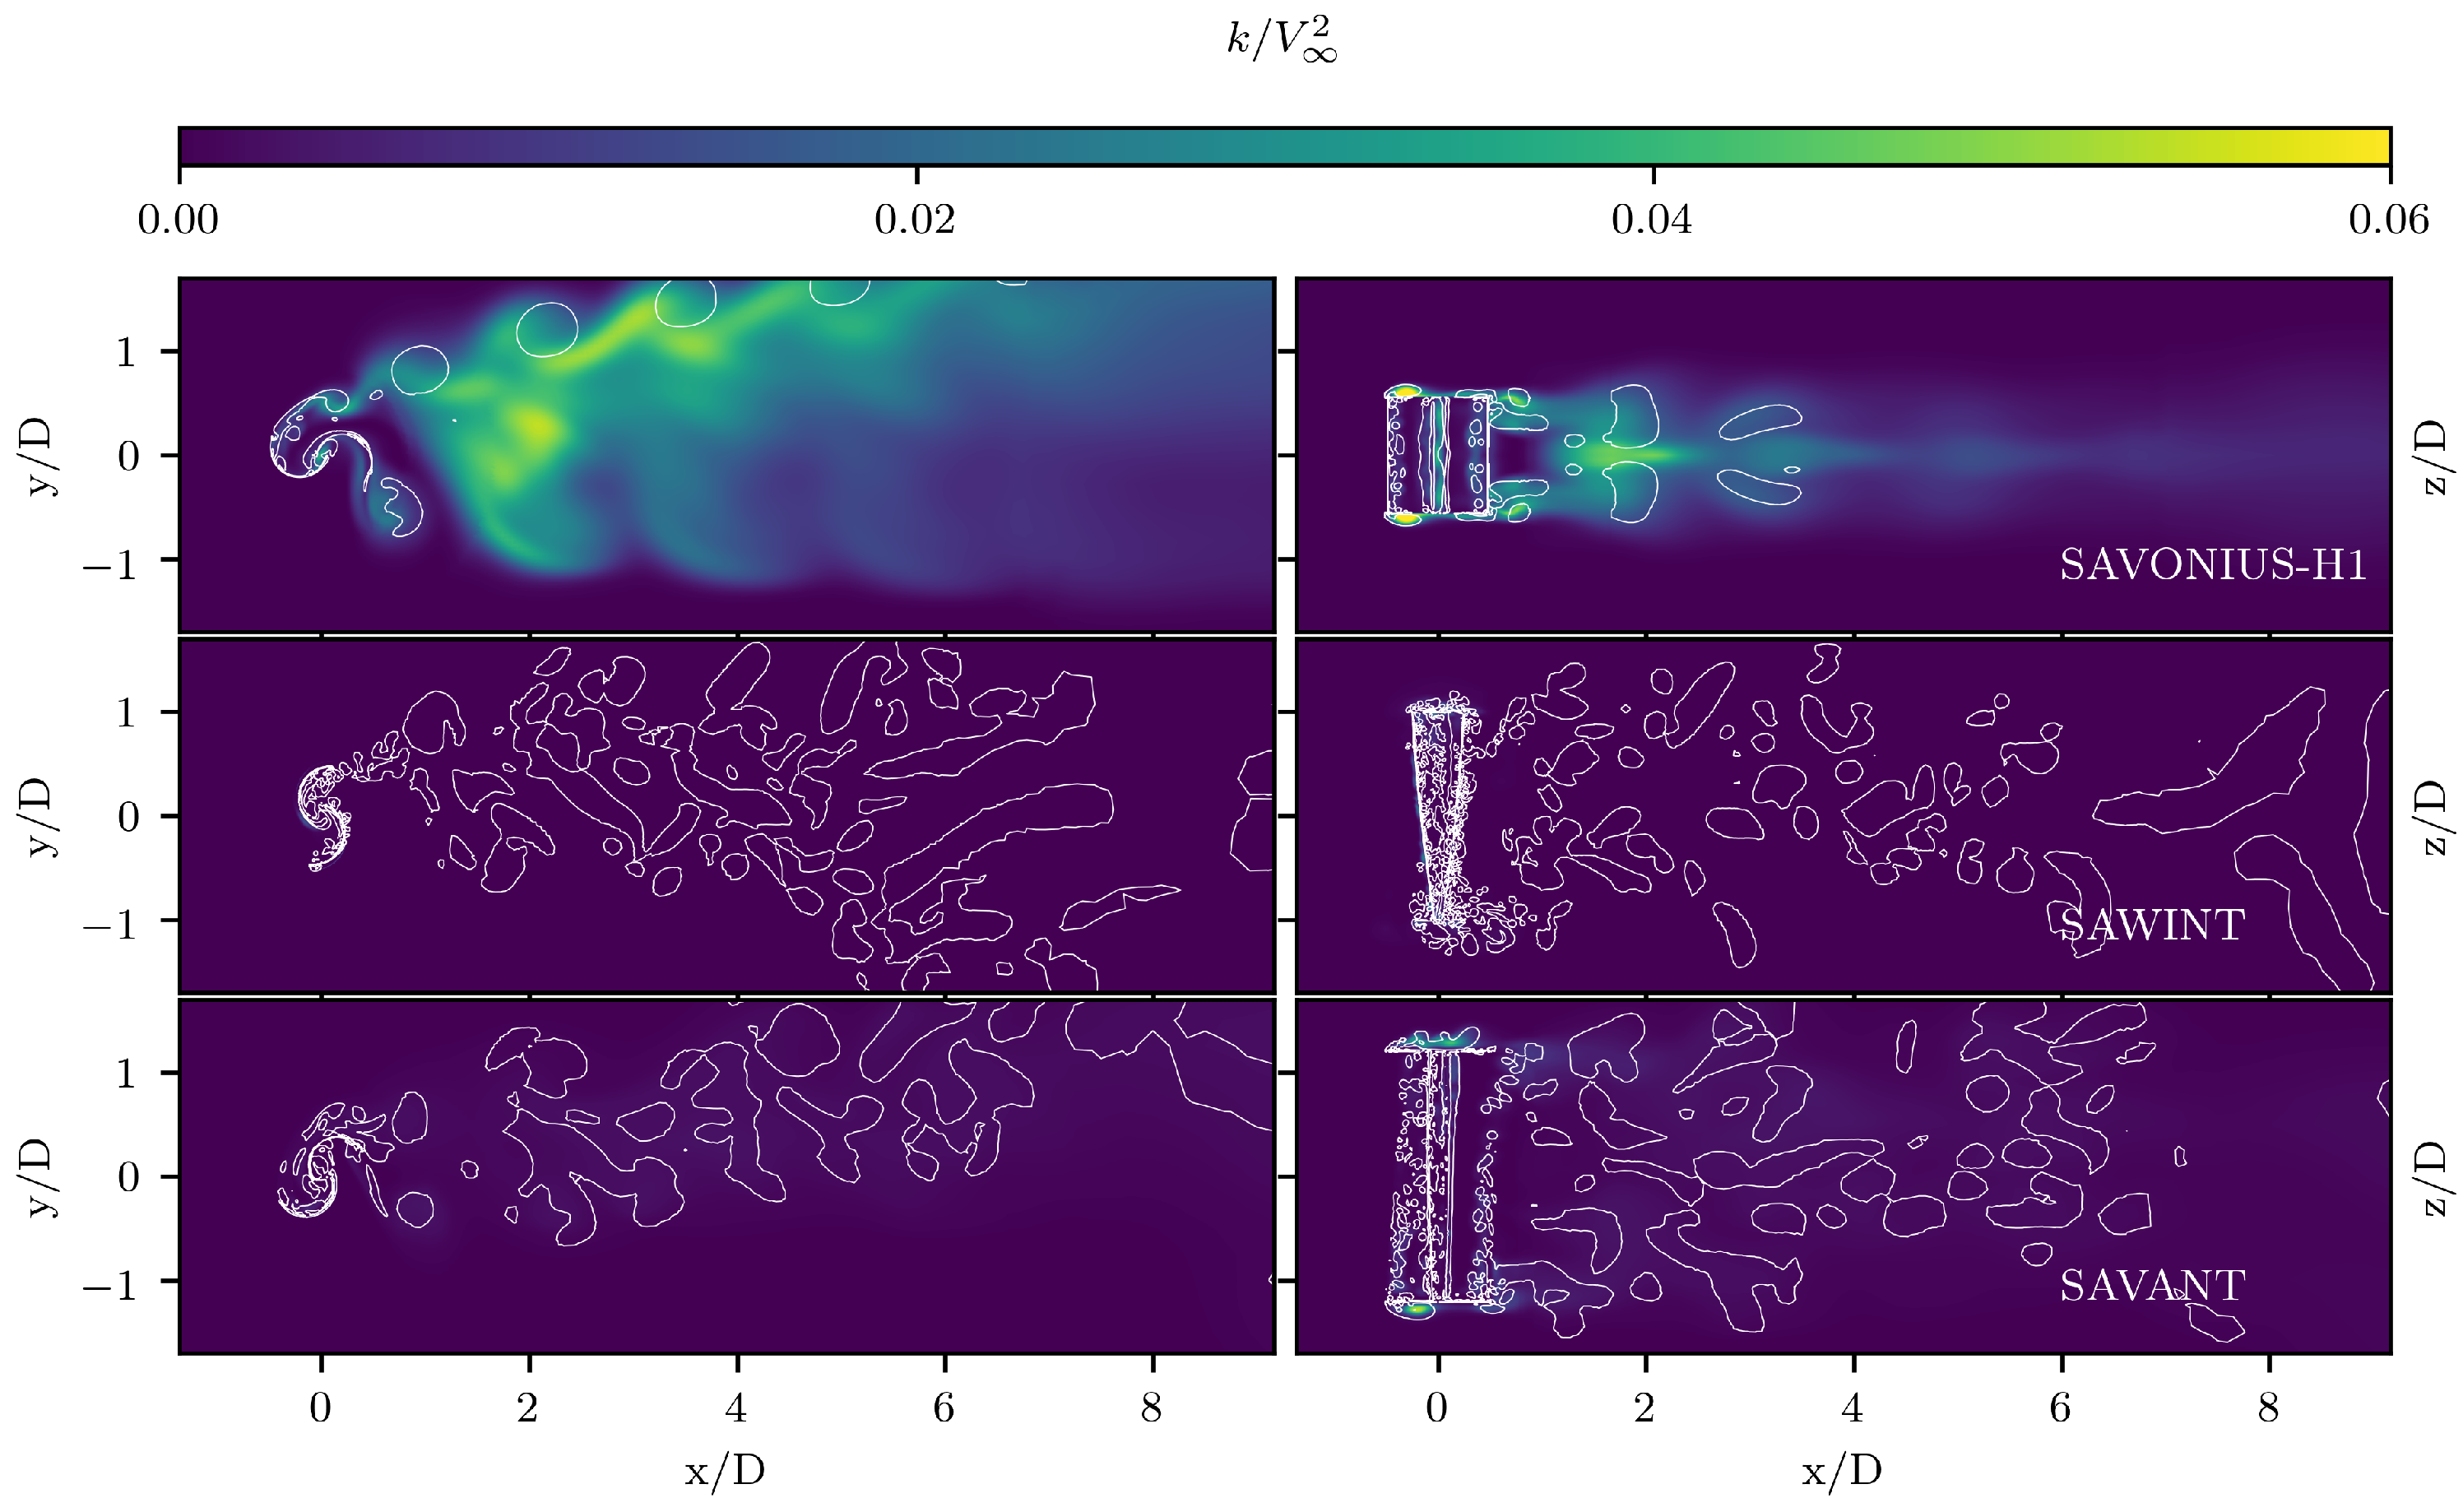
4.2.3. Resulting Flow Pattern

Figure 11 reveals the instantaneous normalized streamwise and vertical velocity components, U x and U z , respectively, in the horizontal and vertical middle planes for all the studied turbines. This allows for representing and identifying the overall structure of the resulting wake, as well as the influence of the created vorticity on it. The complexity of the resulting flow pattern was found to be asymmetric with the flow direction for all cases. Vortical structures are released from the blade tips and end plates, which are dissipated along the main flow direction. The wake produced by the turbines with twisted blades is characterized by a slower recovery. In addition, for these turbines, a noticiable flow component in the vertical direction (parallel to the rotational axis), U z , was observed. This means that the incoming flow has been deflected, with SAWINT resulting in the largest change of direction.
The turbulent kinetic energy (TKE) in the wake is defined as
k = 1 2 < u x 2 > + < u y 2 > + < u z 2 >
with u i corresponding to the time-varying velocity fluctuations for the i-component, and is depicted in Figure 12. For the visualization of vortex formation, a Q-criterion is used which can be defined as the fluid regions with a positive second invariant of the velocity [25,26]. The resulting TKE is different for all the turbines. The SAVONIUS-H1 turbine is characterized by the highest production of TKE compared with the twisted turbines, and it is concentrated in the region behind the blade moving in the opposite direction to the free stream flow. In general, larger turbulence levels lead to faster wake recovery because of the improvement of the mixing process and momentum transfer, which is consistent with the results revealed in Figure 11. For the twisted turbines, the turbulence created by the rotor does not propagate with the flow.
For SAVOINUS-H1, there is a relevant interaction between the vortical structures realized from the upper and lower part due to small aspect ratio; this is not so evident for the other turbines. The twisted turbines are characterized by a considerable formation of vortical structures, which are propagating downstream within the wake region, while, for SAVONIUS-H1, the vortices are propagating in the boundaries of the wake.

5. General Discussion

The straight blade SAVONIUS-H1 turbine produces both the larger torque fluctuations and obtained power ( C P ). The turbines with twisted blades have lower amplitude in the torque fluctuation as it is expected; however, this fact produces lower values on the aerodynamic performance of the device compared to the one produced by the straight blade turbine. Taking the amplitude of the torque coefficient fluctuations for SAVONIUS-HI into account, this has been reduced to 44% and 77% compared to SAWINT and SAVANT, respectively. The twisted blade turbines produced a flow deflection in the vertical direction which is not noticeable for SAVONIUS-H1. This vertical flow component can be one of the reasons of the lower C P values, since the turbine blades are partially changing the direction of the flow instead of extracting its kinetic energy for the power production. The average of the absolute value for U z over the studied sections provides an estimation of the amount of flow vertically deflected (either up or down). In the case of the horizontal middle plane (z-plane), the vertical flow deflection values correspond to 0.52%, 10.11%, and 5.9% for SAVONIOUS-H1, SAWINT and SAVANT, respectively, whereas for the vertical middle plane (y-plane) the corresponding values are 6.9%, 19.1%, and 8.9%. In general, the higher the vertical deflection, the lower the turbine performance, which is consistent with the results depicted in Figure 9.
For the twisted blade turbines, the resulting flow fields depicted in Figure 11 and Figure 12 are consistent with the studies one in [9,15], where the end plates help to stabilize the wake shape and increase the power coefficient. Moreover, SAWINT is the only studied turbine with a small end plate area (its geometric design is made for ice breaking in extreme cold conditions), causing fluid leakage from the concave side of the blade to the external flow, dramatically affecting its aerodynamic performance [15]. The wake is deflected in the same direction where the blades move opposite to the flow, as it was in [12].
SAVANT shows a good compromise between high power output ( C P ) and low torque fluctuations. SAWINT has the lowest torque fluctuations among the studied turbines, probably due to its high tilt angle θ tilt 10 , but at the same time this results in the largest component of the vertically deflected flow.
The presented prototypes could be sensitive to the Reynolds number (as it is for conventional twisted blade turbines). The C P curve and maximum value achieved by SAWINT are consistent with previous work of a twisted blade turbine with similar geometrical characteristics and Reynolds number [9].

6. Conclusions

The presented work investigated the aerodynamic performance of two twisted blade Savonius turbines, which are characterized by a novel blade geometry concept. A preliminary study for validating the employed numerical model has been performed, showing good agreement with experimental data presented in [7]. This numerical model is able to reproduce the main phenomena involved in the flow pattern of the presented turbines, allowing for identifying the power output over a wide range of operational conditions for different TSRs and the general wake structure. The maximum C P value obtained by the twisted blade turbines is lower than the one from the turbine with straight blades, for different Reynolds numbers (Figure 9). A considerable amount of the incoming flow is vertically deflected for the twisted blades turbines; this can be the source of a lower kinetic energy extraction.
At the same operational conditions, the novel blade prototypes show a slight improvement in terms of power output when compared to rotors with either conventional twisted or straight blades, while keeping the same main dimensions (Figure 8).
At optimal TSR, the novel blade geometry concept decreases the amplitude of the torque fluctuation over the turbine rotation. However, the smaller the fluctuation, the lower the resulting power output. In addition, these turbines are characterized by both a considerable release of vortical structures from blade tips and end plates with a lower production of turbulence compared to the conventional straight blades rotor.

Author Contributions

V.M. conducted the simulations and wrote the article. E.K. conducted the pre-process (setup) of the simulations. H.B. designed and built the presented turbines. All authors contributed to editing and reviewing the paper. All authors have read and agreed to the published version of the manuscript.

Acknowledgments

This work was conducted within the STandUP for Wind strategic research framework, which is part of STandUP for Energy. In addition, it was supported by the Center of Natural Hazards and Disaster Science (Sweden), and by the Onassis Foundation—Scholarship ID: F ZP 021-1/2019-2020. The computational works were performed on resources provided by the Swedish National Infrastructure for Computing (SNIC) at NSC.

Conflicts of Interest

The authors declare no conflict of interest.

References

  1. Shikha; Bhatti, T.; Kothari, D. Wind energy conversion systems as a distributed source of generation. J. Energy Eng. 2003, 129, 69–80. [Google Scholar]
  2. Menet, J. A double-step Savonius rotor for local production of electricity: A design study. Renew. Energy 2004, 29, 1843–1862. [Google Scholar] [CrossRef]
  3. Kumara, E.; Hettiarachchi, N.; Jayathilake, R. Overview of the vertical axis wind turbines. Int. J. Sci. Res. Innov. Technol. 2017, 4, 56–67. [Google Scholar]
  4. Savonius, S.J. Wind Rotor. U.S. Patent 1,766,765, 24 June 1930. [Google Scholar]
  5. Kamoji, M.; Kedare, S.; Prabhu, S. Performance tests on helical Savonius rotors. Renew. Energy 2009, 34, 521–529. [Google Scholar] [CrossRef]
  6. Shankar, P. The Effects of Geometry and Reynolds Number on Savonius Type Rotors. In National Aeronautic Laboratory Bangalore 560017; Technical report, AE-TM-3-76; National Aeronautical Laboratory: Bangalore, India, 1976. [Google Scholar]
  7. Blackwell, B.F.; Sheldahl, R.F.; Feltz, L.V. Wind Tunnel Performance Data for Two-and Three-Bucket Savonius Rotors; Sandia Laboratories: Springfield, VA, USA, 1977. [Google Scholar]
  8. Jang, H.; Paek, I.; Kim, S.; Jeong, D. Performance Prediction and Validation of a Small-Capacity Twisted Savonius Wind Turbine. Energies 2019, 12, 1721. [Google Scholar] [CrossRef] [Green Version]
  9. Lee, J.H.; Lee, Y.T.; Lim, H.C. Effect of twist angle on the performance of Savonius wind turbine. Renew. Energy 2016, 89, 231–244. [Google Scholar] [CrossRef]
  10. Damak, A.; Driss, Z.; Abid, M. Experimental investigation of helical Savonius rotor with a twist of 180. Renew. Energy 2013, 52, 136–142. [Google Scholar] [CrossRef]
  11. Saha, U.; Rajkumar, M.J. On the performance analysis of Savonius rotor with twisted blades. Renew. Energy 2006, 31, 1776–1788. [Google Scholar] [CrossRef]
  12. Aliferis, A.D.; Jessen, M.S.; Bracchi, T.; Hearst, R.J. Performance and wake of a Savonius vertical-axis wind turbine under different incoming conditions. Wind Energy 2019, 22, 1260–1273. [Google Scholar] [CrossRef] [Green Version]
  13. Kumar, A.; Saini, R. Performance analysis of a Savonius hydrokinetic turbine having twisted blades. Renew. Energy 2017, 108, 502–522. [Google Scholar] [CrossRef]
  14. Kumar, A.; Saini, R. Performance analysis of a single stage modified Savonius hydrokinetic turbine having twisted blades. Renew. Energy 2017, 113, 461–478. [Google Scholar] [CrossRef]
  15. Kumar, A.; Saini, R. Performance parameters of Savonius type hydrokinetic turbine–A Review. Renew. Sustain. Energy Rev. 2016, 64, 289–310. [Google Scholar] [CrossRef]
  16. Kamoji, M.; Kedare, S.; Prabhu, S. Experimental investigations on single stage, two stage and three stage conventional Savonius rotor. Int. J. Energy Res. 2008, 32, 877–895. [Google Scholar] [CrossRef]
  17. Saha, U.; Thotla, S.; Maity, D. Optimum design configuration of Savonius rotor through wind tunnel experiments. J. Wind Eng. Ind. Aerodyn. 2008, 96, 1359–1375. [Google Scholar] [CrossRef]
  18. ARIANNA—Antarctic Ross Ice-Shelf ANtenna Neutrino Array. Available online: http://arianna.ps.uci.edu/ (accessed on 9 October 2019).
  19. Davidson, L. Fluid Mechanics, Turbulent Flow and Turbulence Modeling; Chalmers University of Technology: Goteborg, Sweden, 2016. [Google Scholar]
  20. Ferrari, G.; Federici, D.; Schito, P.; Inzoli, F.; Mereu, R. CFD study of Savonius wind turbine: 3D model validation and parametric analysis. Renew. Energy 2017, 105, 722–734. [Google Scholar] [CrossRef]
  21. Nasef, M.; El-Askary, W.; Abdel-Hamid, A.; Gad, H. Evaluation of Savonius rotor performance: Static and dynamic studies. J. Wind Eng. Ind. Aerodyn. 2013, 123, 1–11. [Google Scholar] [CrossRef]
  22. Shaheen, M.; El-Sayed, M.; Abdallah, S. Numerical study of two-bucket Savonius wind turbine cluster. J. Wind Eng. Ind. Aerodyn. 2015, 137, 78–89. [Google Scholar] [CrossRef]
  23. Windt, C.; Davidson, J.; Ringwood, J.V. High-fidelity numerical modelling of ocean wave energy systems: A review of computational fluid dynamics-based numerical wave tanks. Renew. Sustain. Energy Rev. 2018, 93, 610–630. [Google Scholar] [CrossRef] [Green Version]
  24. Pope, A.; Harper, J.J. Low Speed Wind Tunnel Testing; John Willy and Sons: New York, NY, USA, 1966. [Google Scholar]
  25. Chakraborty, P.; Balachandar, S.; Adrian, R.J. On the relationships between local vortex identification schemes. J. Fluid Mech. 2005, 535, 189–214. [Google Scholar] [CrossRef] [Green Version]
  26. Launder, B.E.; Spalding, D.B. The numerical computation of turbulent flows. In Numerical Prediction of Flow, Heat Transfer, Turbulence and Combustion; Elsevier: Amsterdam, The Netherlands, 1983; pp. 96–116. [Google Scholar]
Figure 1. Schematic of the twisted blades’ manufacturing process. (a) Availability of a hollow cylinder (tube) with an inner radius r i and a height H. (b) Two symmetric twisted cuts with an azimuthal angle θ az all over along the tube, such that the remained material covers 180° (or less, as it is desired). (c) A secondary twisted cut over an azimuthal angle θ az (in the range of 90°), starting from the half height H 2 . (d) A rotation with a tilt angle θ tilt over the central axis—followed by a perpendicular cut on the extremes (endings), resulting in a single twisted blade with a new height H . (e) The two twisted blades are placed opposite and symmetric to a rotational axis for the resulting turbine.
Energies 13 01874 g001
Figure 2. Seven cross-sections equally separated along the rotation axis for the SAVANT turbine. General 3D, front, lateral, and top views.
Energies 13 01874 g002
Figure 3. Studied turbine prototypes: SAWINT (left) and SAVANT (right).
Energies 13 01874 g003
Figure 4. Schematic view of the wind turbine employed for validation.
Energies 13 01874 g004
Figure 5. Three-dimensional view of a section within the chamber domain (top-left), a zoom of the mesh around the turbine (top-right), a vertical section showing the different refinement levels of the mesh topology (bottom-left) and cross-section in the wall vicinity (bottom-right).
Energies 13 01874 g005
Figure 6. The power coefficient response to a grid size variation for a TSR of λ = 1 . The horizontal orange line represents the experimental value for the tested λ .
Energies 13 01874 g006
Figure 7. Experimental and numerical values of C P (left) and C M (right) as a function of the TSR ( λ ) for a straight blade turbine (SAVONIUS-H1).
Energies 13 01874 g007
Figure 8. Numerical values of C P as function of λ for SAWINT (left) and SAVANT (right) turbines for different geometric blade configurations.
Energies 13 01874 g008
Figure 9. Numerical values of C P as function of λ for SAVONIUS-H1 (left), SAWINT (center) and SAVANT (right) turbines, corresponding to Reynolds numbers values of 6.32 × 10 5 , 1.20 × 10 6 and 2.24 × 10 5 , respectively.
Energies 13 01874 g009
Figure 10. Torque coefficient (at optimal λ ) as function of the relative azimuthal angle for SAVONIUS-H1, SAWINT, and SAVANT turbines.
Energies 13 01874 g010
Figure 11. Instantaneous normalized streamwise (top) and vertical (bottom) velocity components in the horizontal and vertical middle plane, at optimal λ .
Energies 13 01874 g011aEnergies 13 01874 g011b
Figure 12. Normalized time-averaged turbulent kinetic energy (TKE) in the horizontal and vertical middle plane, at optimal λ . The isolines represent a Q-value of 10.
Energies 13 01874 g012
Table 1. Numerical schemes used for the present study.
TermsDiscretization Scheme
Temporal δ δ t First, order, Transient
Gradient ∇Second order, Gaussian integration
Divergence · Second order, Upwind-biased
Laplacian 2 Second order, Gaussian integration
InterpolationLinear interpolation
Table 2. Geometric parameters of the Savonius turbine used for validation.
Number of blades2
D t 0.9024 m
D p 0.9064 m
H1 m
d0.5 m
s2 mm
o92.72 mm
Aspect ratio1.11

