Synergy of Parameters Determining the Optimal Properties of Coal as a Natural Sorbent


Abstract
:
1. Introduction
2. Materials and Methods
2.1. Materials
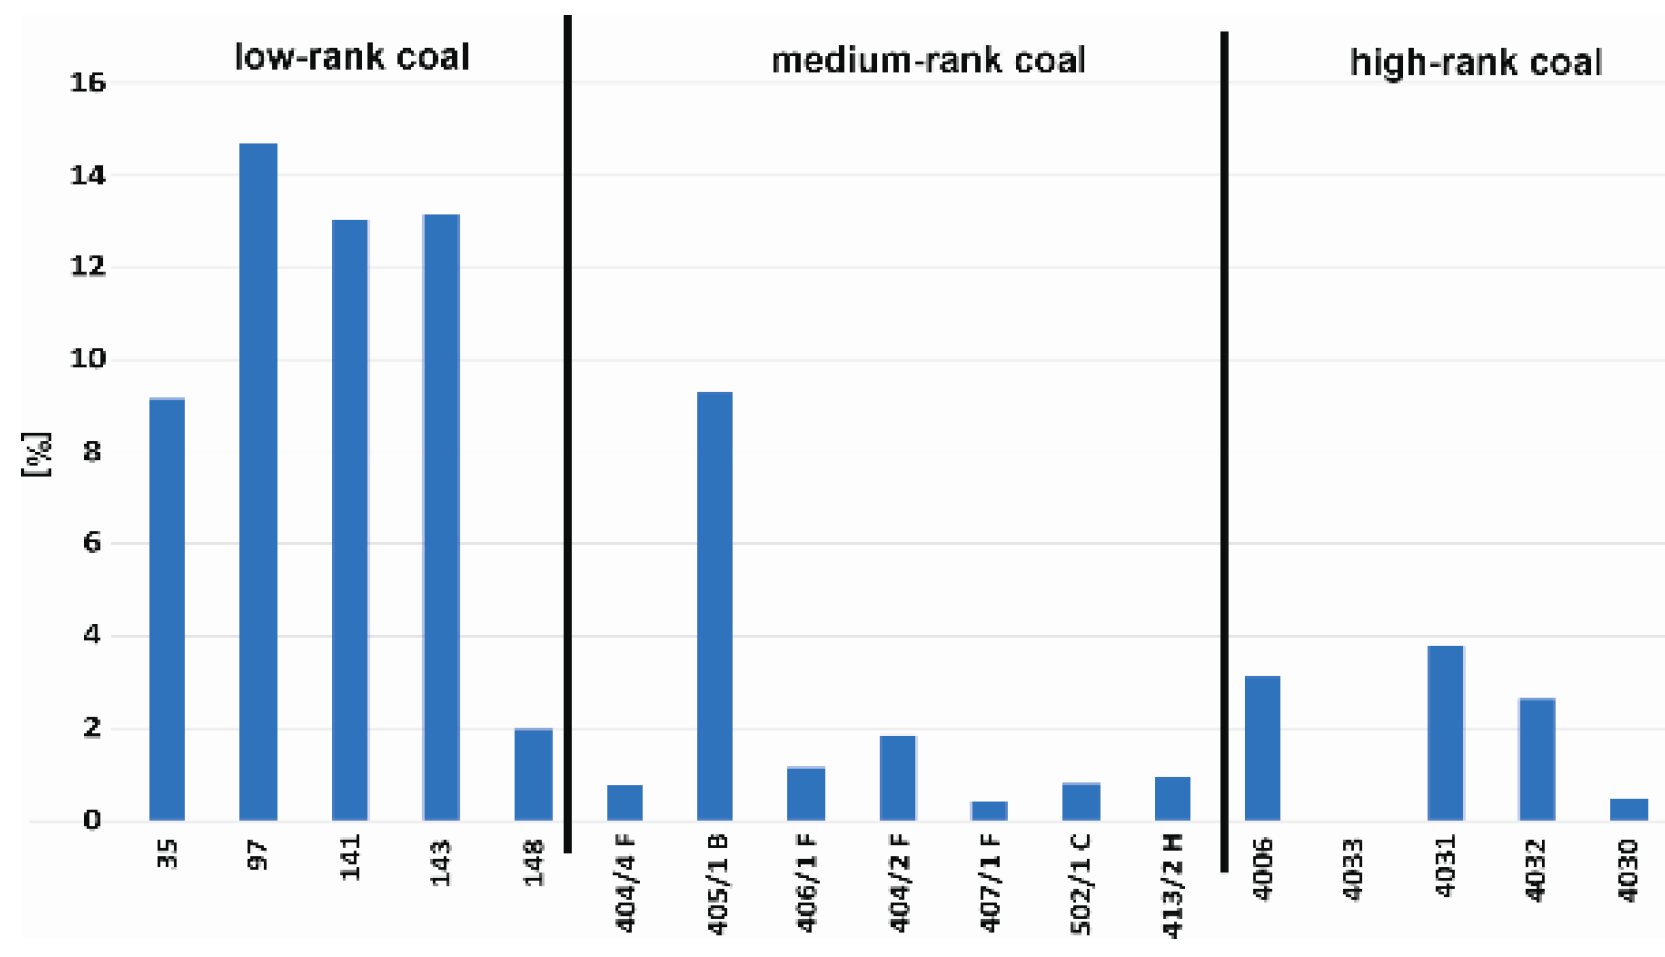
- Low-rank coal samples: 35, 97, 141, 143, and 148 with R0 in the range of 0.78%–0.85% (0.82%);
- Medium-rank coal samples: 227/2, 227/6, 227/9, 227/10, and 227/22 with R0 in the range of 0.98%–1.15% (1.08%);
- High-rank coal samples: 4006, 4030, 4031, 4032, and 4033 with R0 in the range of 1.85%–2.03% (1.94%).
2.2. Methodology
2.2.1. Technical Analysis
2.2.2. Texture Studies Using Densimetric Methods
2.2.3. Petrographic Analyses
2.2.4. Sorption Studies Using Methane
2.2.5. Strength Studies in the Micro Scale
- Vickers micro-hardness (Hv), calculated according to the following formula:whereFmax—maximum force, N;hc—indentation depth, μm;Ac—surface area of the formed imprint, μm2.
- standard elastic modulus (EIT) calculated according to the Power Law Method described by [46] after [47]:whereEi—elastic modulus of the indenter (constant), (1141 GPa);vi—Poisson’ ratio of the indenter, (0.07);Er—reduced modulus of the indentation contact;νs—Poisson’ ratio of the sample (user’s selection).
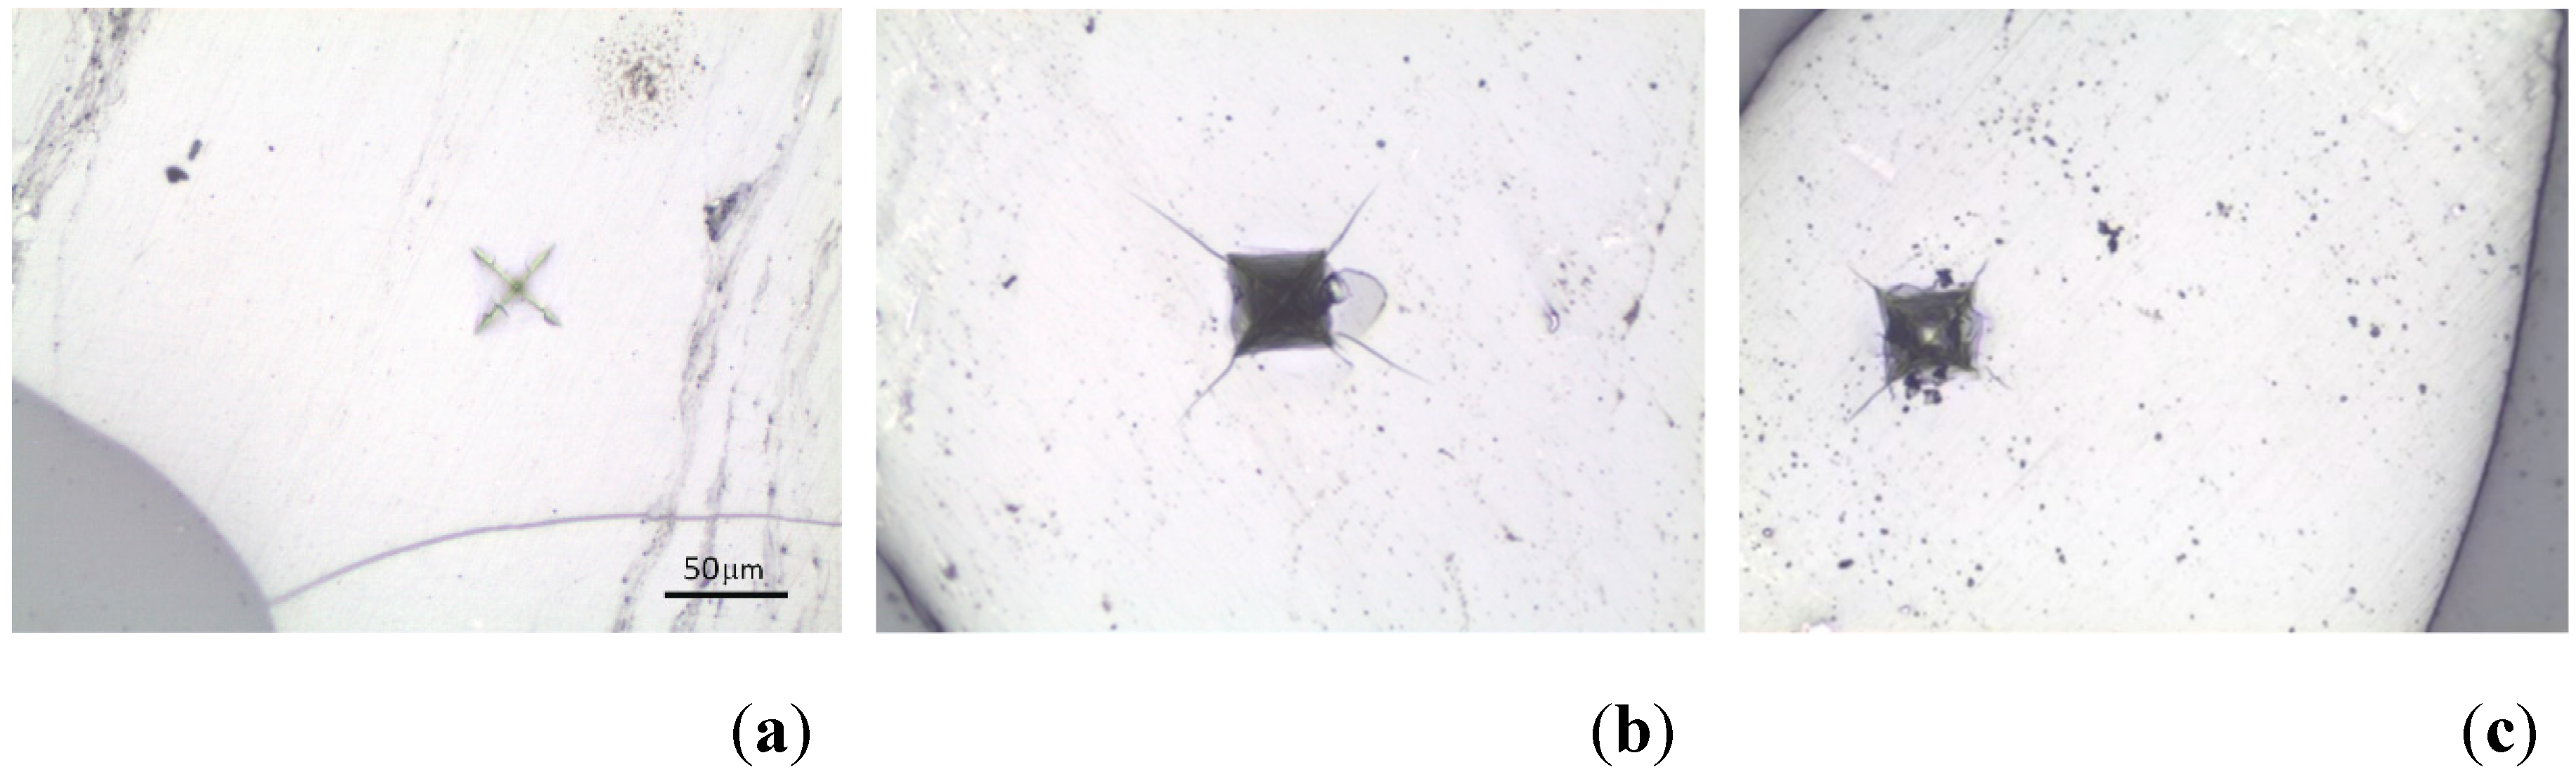
- the rate and nature of cracks and other damage caused by the Vickers indenter being pressed into the analysed material. This parameter enabled us to determine the sample behaviour under the used force and how it breaks or deforms, among others.
2.2.6. Statistical Analysis Methods
3. Results
3.1. General Characteristics of Coals
3.2. Results of Petrographic Analyses
3.3. Results of Micro-Hardness Tests
3.4. Sorption Test Results
4. Discussion
4.1. The Search for Estimation Models
4.2. Use of Multiple Regression in the Development of Mathematical Models for Sorption Parameters
4.3. Optimisation of the Method for Prediction of Sorption Properties of a Natural Coal Sorbent Based on Multiple Regression
5. Conclusions
Author Contributions
Funding
Acknowledgments
Conflicts of Interest
References
- Wojtacha-Rychter, K.; Smoliński, A. Sorption characteristic of coal as regards of gas mixtures emitted in the process of the self-heating of coal. In Proceedings of the E3S Web of Conferences 19, 01010. International Conference Energy, Environment and Material Systems (EEMS 2017), Polanica Zdroj, Poland, 13–15 September 2017. [Google Scholar]
- Pan, Z.; Ye, J.; Zhou, F.; Tan, Y.; Connell, L.D.; Fan, J. CO2 storage in coal to enhance coalbed methane recovery: A review of field experiments in China. Int. Geol. Rev. 2017, 60, 754–776. [Google Scholar] [CrossRef]
- Cuéllar-Franca, R.M.; Azapagic, A. Carbon capture, storage and utilisation technologies: A critical analysis and comparison of their life cycle environmental impacts. J. CO2 Util. 2015, 9, 82–102. [Google Scholar] [CrossRef]
- Radosz, M.; Hu, X.; Krutkramelis, K.; Shen, Y. Flue-Gas Carbon Capture on Carbonaceous Sorbents: Toward a Low-Cost Multifunctional Carbon Filter for “Green” Energy Producers. Ind. Eng. Chem. Res. 2008, 47, 3783–3794. [Google Scholar] [CrossRef]
- Skoczylas, N.; Wierzbicki, M.; Kudasik, M. A Simple Method for Measuring Basic Parameters of the Coal—Methane System under Mining Conditions. J. Min. Sci. 2018, 54, 522–533. [Google Scholar] [CrossRef]
- Dutka, B. CO2 and CH4 sorption properties of granular coal briquettes under in situ states. Fuel 2019, 247, 228–236. [Google Scholar] [CrossRef]
- Pajdak, A.; Kudasik, M.; Skoczylas, N.; Wierzbicki, M.; Teixeira Palla Braga, L. Studies on the competitive sorption of CO2 and CH4 on hard coal. Int. J. Greenh. Gas Control 2019, 90, 102789. [Google Scholar] [CrossRef]
- Li, D.; Liu, Q.; Weniger, P.; Gensterblum, Y.; Busch, A.; Krooss, B.M. High-pressure sorption isotherms and sorption kinetics of CH4 and CO2 on coals. Fuel 2010, 89, 569–580. [Google Scholar] [CrossRef]
- Godyń, K.; Dutka, B. The impact of the degree of coalification on the sorption capacity of coals from the Zofiówka Monocline. Arch. Min. Sci. 2018, 63, 727–746. [Google Scholar]
- Skoczylas, N.; Topolnicki, J. The coal-gas system-the effective diffusion coefficient. Int. J. Oil Gas Coal Technol. 2016, 12, 412–424. [Google Scholar] [CrossRef]
- Kudasik, M.; Skoczylas, N.; Pajdak, A. The repeatability of sorption processes occurring in the coal-methane system during multiple measurement series. Energies 2017, 10, 661. [Google Scholar] [CrossRef] [Green Version]
- Levy, J.H.; Day, S.J.; Killingley, J.S. Methane capacities of Bowen Basin coals related to coal properties. Fuel 1997, 76, 813–819. [Google Scholar] [CrossRef]
- Ceglarska-Stefańska, G.; Brzóska, K. The effect of coal metamorphism on methane desorption. Fuel 1998, 77, 645–648. [Google Scholar] [CrossRef]
- Laxminarayana, C.; Crosdale, P. Role of coal type and rank on methane sorption characteristics of Bowen Basin, Australia coals. Int. J. Coal Geol. 1999, 40, 309–325. [Google Scholar] [CrossRef]
- Prinz, D.; Pyckhout-Hintzen, W.; Littke, R. Development of the meso- and macroporous structure of coals with rank as analyzed with small angle neutron scattering and adsorption experiments. Fuel 2004, 83, 547–556. [Google Scholar] [CrossRef]
- Dutta, P.; Bhowmik, S.; Das, S. Methane and carbon dioxide sorption on a set of coals from India. Int. J. Coal Geol. 2011, 85, 289–299. [Google Scholar] [CrossRef]
- Olajossy, A. The influences of the rank of coal on methane sorption capacity in coals. Arch. Min. Sci. 2014, 59, 509–516. [Google Scholar]
- Nie, B.; Liu, X.; Yuan, S.; Ge, B.; Jia, W.; Wang, C.; Chen, X. Sorption charateristics of methane among various rank coals: Impact of moisture. Adsorption 2016, 22, 315–325. [Google Scholar] [CrossRef]
- Dutka, B.; Godyń, K. Predicting variability of methane pressure with depth of coal seam. Przem. Chem. 2018, 97, 1344–1348. [Google Scholar]
- Pini, R.; Ottiger, S.; Burlini, L.; Storti, G.; Mazzotti, M. Sorption of carbon dioxide, methane and nitrogen in dry coals at high pressure and moderate temperature. Int. J. Greenh. Gas Control 2010, 4, 90–101. [Google Scholar] [CrossRef]
- Feng, Q.; Zhang, J.; Zhang, X.; Shu, C.; Wen, S.; Wang, S.; Li, J. The use of alternating conditional expectation to predict methane sorption capacity on coal. Int. J. Coal Geol. 2014, 121, 137–147. [Google Scholar] [CrossRef]
- Yao, Y.; Liu, D.; Huang, W. Influences of igneous intrusions on coal rank, coal quality and adsorption capacity in Hongyang, Handan and Huaibei coalfields, North China. Int. J. Coal Geol. 2011, 88, 135–146. [Google Scholar] [CrossRef]
- Godyń, K. Structurally altered hard coal in the areas of tectonic disturbances–an initial attempt at classification. Arch. Min. Sci. 2016, 61, 677–694. [Google Scholar] [CrossRef] [Green Version]
- Wang, Y.; Liu, D.; Cai, Y.; Li, X. Variation of Petrophysical Properties and Adsorption Capacity in Different Rank Coals: An Experimental Study of Coals from the Junggar, Ordos and Qinshui Basins in China. Energies 2019, 12, 986. [Google Scholar] [CrossRef] [Green Version]
- Weniger, P.; Franců, J.; Hemza, P.; Krooss, B.M. Investigations on the methane and carbon dioxide sorption capacity of coals from the SW Upper Silesian Coal Basin, Czech Republic. Int. J. Coal Geol. 2012, 93, 23–39. [Google Scholar] [CrossRef]
- Godyń, K.; Młynarczuk, M.; Skiba, M.; Dutka, B.; Králová, L. Studies into the relationship between the technical, petrographic, gas and strength parameters of coal from seams located in the Upper Silesian Coal Basin. Int. Multidiscip. Sci. GeoConf. SGEM 2019, 19, 553–559. [Google Scholar]
- Dembowski, Z. General Information on the Upper Silesian Basin. Prace Inst. Geol. 1972, 61, 9–22. [Google Scholar]
- Jureczka, J. Nowe dane o charakterystyce litostratygraficznej kontaktu serii paralicznej i górnoślaskiej serii piaskowcowej karbonu zachodniej części Górnosląskiego Zagłebia Węgłowego. In XI Sympozjum Geologia formacji węglonośnych Polski; AGH Kraków: Kraków, Poland, 1988; pp. 41–66. [Google Scholar]
- Kotas, A.; Buła, Z.; Jureczka, J. Problematyka podziału litostratygraficznego Górnosląskiej serii piaskowcowej karbonu GZW w świetle zasad kodeksu stratygraficznego. In XI Sympozjum Geologia formacji węglonośnych Polski; AGH Kraków: Kraków, Poland, 1988; pp. 55–61. [Google Scholar]
- Sivek, M.; Dopita, M.; Krůl, M.; Čáslavský, M.; Jirásek, J. Atlas of Chemical-Technological Properties of Coals in the Czech Part of the Upper Silesian Basin; Vysoká Škola Báňská–Technical University of Ostrava: Ostrava, Czech Republic, 2003; p. 31. [Google Scholar]
- Hýlová, L.; Jureczka, J.; Jirásek, J.; Sivek, M.; Hotárková, J. The Petřkovice Member (Ostrava Formation, Mississippian) of the Upper Silesian Basin (Czech Republic and Poland). Int. J. Coal Geol. 2013, 106, 11–24. [Google Scholar] [CrossRef] [Green Version]
- Jirásek, J.; Opluštil, S.; Sivek, M.; Schmitz, M.D.; Abels, H.A. Astronomical forcing of Carboniferous paralic sedimentary cycles in the Upper Silesian Basin, Czech Republic (Serpukhovian, latest Mississippian): New radiometric ages afford an astronomical age model for European biozonations and substages. Earth-Sci. Rev. 2018, 177, 715–741. [Google Scholar] [CrossRef]
- ISO 562:2010: Hard Coal and Coke-Determination of Volatile Matter; IOS: Geneva, Switzerland, 15 June 2010.
- ISO 1171:2010: Solid Mineral Fuels-Determination of Ash; IOS: Geneva, Switzerland, 30 November 2010.
- ISO 7404-2:2009: Methods for the Petrographic Analysis of Coals-Part 2: Methods of preparing Coal Samples; IOS: Geneva, Switzerland, 1 October 2009.
- ISO 7404-3:2009: Methods for the Petrographic Analysis of Coals-Part 3: Method of Determining Maceral Group Composition; IOS: eneva, Switzerland, 1 October 2009.
- Bodziony, J.; Gabzdyl, W.; Ratajczak, T. Evaluation of effect of a subjective factor on the results of stereological analysis of coal. Arch. Min. Sci. 1986, 31, 689–702. [Google Scholar]
- Wang, H.; Lei, M.; Chen, Y.; Li, M.; Zou, L. Intelligent Identification of Maceral Components of Coal Based on Image Segmentation and Classification. Appl. Sci. 2019, 9, 3245. [Google Scholar] [CrossRef] [Green Version]
- Młynarczuk, M.; Skiba, M. The application of artificial intelligence for the identification of the maceral groups and mineral components of coal. Comput. Geosci. 2017, 103, 133–141. [Google Scholar] [CrossRef]
- Skiba, M.; Młynarczuk, M. Identification of macerals of the inertinite group using neural classifiers, based on selected textural features. Arch. Min. Sci. 2018, 63, 827–837. [Google Scholar]
- ISO 7404-5:2009: Methods for the Petrographic Analysis of Coals-Part 5: Method of Determining Microscopically the Reflectance of Vitrinite; IOS: Geneva, Switzerland, 1 October 2009.
- Klika, Z.; Serenčíšová, J.; Kožušníková, A.; Kolomazník, I.; Študentová, S.; Vontorová, J. Multivariate statistical assessment of coal properties. Fuel Process. Technol. 2014, 128, 119–127. [Google Scholar] [CrossRef]
- Langmuir, I. The adsorption of gases on plane surfaces of glass, mica and Platinum. J. Am. Chem. Soc. 1918, 40, 1361–1403. [Google Scholar] [CrossRef] [Green Version]
- Crank, J. The Mathematics of Diffusion, 2nd ed.; Oxford Science Publications: Oxford, UK, 1975. [Google Scholar]
- Timofejew, D.P. Adsorptionskinetik; VEB: Lipsk, Germany, 1967. [Google Scholar]
- Oliver, W.C.; Pharr, G.M. An improved technique for determining hardness and elastic modulus using load and displacement sensing indentation experiments. J. Mater. Res. 1992, 7, 1564–1583. [Google Scholar] [CrossRef]
- Kožušníková, A. Determination of microhardness and elastic modulus of coal components by using indentation method. Geolines 2009, 22, 40–43. [Google Scholar]
- Borradaile, G.J. Statistics of Earth Science Data; Springer: Berlin/Heidelberg, Germany, 2003. [Google Scholar]
- Chuchro, M.; Danek, M. Selection of optimal gridded dataset for application in Polish Sudetes Mountains. IOP Conf. Ser. Earth Environ. Sci. 2018, 012120, 1–8. [Google Scholar]
- Zhang, W.; Goh, A.T.C. Multivariate adaptive regression splines and neural network models for prediction of pile drivability. Geosci. Front. 2016, 7, 45–52. [Google Scholar] [CrossRef] [Green Version]
- UNECE. International Classification of In-Seam Coals; ECE UN: Geneva, Switzerland; UN: New York, NY, USA, 1998. [Google Scholar]
- Stach, E.; Mackowsky, M.-T.; Teichmuller, M.; Taylor, G.H.; Chandra, D.; Teichmuller, R. Stach’s Textbook of Coal Petrology; Gebruder Borntraeger: Berlin/Stuttgart, Germany, 1982. [Google Scholar]
- Mukherjee, A.K.; Alam, M.M.; Ghose, S. Microhardness Characteristics of Indian Coal and Lignite. Fuel 1989, 68, 670–674. [Google Scholar] [CrossRef]
- Van Krevelen, D.W. Coal–Typology–Physics–Chemistry–Constitution; Elsevier: Amsterdam, The Netherlands, 1993. [Google Scholar]
- Hower, J.C.; Trinkle, E.J.; Raione, R.P. Vickers microhardness of telovitrinite and pseudovitrinite from high volatile bituminous Kentucky coals. Int. J. Coal Geol. 2008, 75, 76–80. [Google Scholar] [CrossRef]
- Godyń, K.; Kožušníková, A. Microhardness of Coal from Near-Fault Zones in Coal Seams Threatened with Gas-Geodynamic Phenomena, Upper Silesian Coal Basin, Poland. Energies 2019, 12, 1756. [Google Scholar]


| Technical Parameters | Petrographic Parameters | Sorption Parameters | Strength Param. | Textural Param. | ||||||||||||||
|---|---|---|---|---|---|---|---|---|---|---|---|---|---|---|---|---|---|---|
| Sample | ρr [g/cm3] | ρp [g/cm3] | Vdaf [%] | Aa [%] | R0 [%] | Vtmmf [%] | Immf [%] | Lmmf [%] | (Vt+L)mmf [%] | M [%] | am [cm3/g] | a1 [cm3/g | De [cm2/s] | EIT [GPa] | Hv [N/mm2] | ε [%] | Vp [cm3/g] | |
| 35 | low-rank coals | 1.395 | 1.333 | 36.45 | 10.54 | 0.852 | 76.71 | 16.44 | 6.84 | 83.56 | 9.13 | 17.19 | 2.47 | 4.18 × 10⁻¹⁰ | 5.872 | 72.39 | 4.5 | 0.034 |
| 97 | 1.429 | 1.371 | 40.97 | 14.58 | 0.784 | 85.08 | 4.76 | 10.15 | 95.24 | 14.72 | 17.04 | 2.40 | 4.99 × 10⁻¹⁰ | 5.547 | 63.54 | 4.0 | 0.030 | |
| 141 | 1.495 | 1.425 | 34.51 | 21.28 | 0.845 | 47.23 | 39.44 | 13.33 | 60.56 | 13.04 | 14.25 | 1.94 | 8.90 × 10⁻¹⁰ | 5.731 | 70.83 | 4.7 | 0.033 | |
| 143 | 1.399 | 1.336 | 40.16 | 7.22 | 0.848 | 88.03 | 8.85 | 3.12 | 91.15 | 13.12 | 10.78 | 1.18 | 4.46 × 10⁻¹⁰ | 6.177 | 68.15 | 4.5 | 0.034 | |
| 148 | 1.361 | 1.304 | 36.61 | 4.99 | 0.793 | 68.82 | 17.81 | 13.36 | 82.19 | 1.98 | 14.96 | 1.87 | 4.42 × 10⁻¹⁰ | 6.258 | 71.35 | 4.2 | 0.032 | |
| 227/2 | medium-rank coals | 1.338 | 1.280 | 24.78 | 6 | 0.977 | 72.73 | 21.27 | 6.00 | 78.73 | 0.74 | 19.32 | 3.89 | 9.77 × 10⁻¹⁰ | 5.697 | 54.33 | 4.3 | 0.034 |
| 227/6 | 1.373 | 1.296 | 23.25 | 6.31 | 1.108 | 76.12 | 18.50 | 5.38 | 81.50 | 0.39 | 16.29 | 2.58 | 6.83 × 10⁻¹⁰ | 6.151 | 61.75 | 5.6 | 0.043 | |
| 227/22 | 1.326 | 1.276 | 21.44 | 8.76 | 1.153 | 43.39 | 53.28 | 3.33 | 46.72 | 0.79 | 15.94 | 2.83 | 7.05 × 10⁻¹⁰ | 5.980 | 60.39 | 3.8 | 0.030 | |
| 227/9 | 1.344 | 1.298 | 20.79 | 7.54 | 1.098 | 71.09 | 23.80 | 5.11 | 76.20 | 2.56 | 18.46 | 3.31 | 5.75 × 10⁻¹⁰ | 6.052 | 62.20 | 3.4 | 0.026 | |
| 227/10 | 1.324 | 1.255 | 20.2 | 5.56 | 1.071 | 87.55 | 9.78 | 2.67 | 90.22 | 3.43 | 16.42 | 2.72 | 4.00 × 10⁻¹⁰ | 5.948 | 53.86 | 5.2 | 0.041 | |
| 4006 | high-rank coals | 1.403 | 1.314 | 13.62 | 7.54 | 1.94 | 91.29 | 8.71 | 0 | 91.29 | 3.11 | 23.49 | 2.86 | 1.13 × 10⁻¹⁰ | 6.220 | 61.22 | 6.4 | 0.048 |
| 4033 | 1.378 | 1.295 | 13.91 | 8.83 | 1.87 | 85.51 | 14.49 | 0 | 85.51 | 0 | 24.60 | 3.23 | 3.46 × 10⁻¹⁰ | 5.750 | 65.00 | 6.0 | 0.047 | |
| 4031 | 1.387 | 1.301 | 12.8 | 6.87 | 2.03 | 78.60 | 21.40 | 0 | 78.60 | 3.75 | 24.62 | 4.31 | 1.7 × 10⁻¹⁰ | 5.157 | 50.54 | 6.2 | 0.048 | |
| 4032 | 1.406 | 1.313 | 13.51 | 9.02 | 2.01 | 88.18 | 11.82 | 0 | 88.18 | 2.62 | 23.94 | 4.25 | 2.26 × 10⁻¹⁰ | 5.553 | 49.69 | 6.6 | 0.051 | |
| 4030 | 1.408 | 1.327 | 14.26 | 17.14 | 1.85 | 82.43 | 17.57 | 0 | 82.43 | 0.45 | 25.85 | 3.74 | 1.13 × 10⁻¹⁰ | 5.665 | 59.13 | 5.7 | 0.043 | |
| ρr | ρp | Vdaf | Aa | R0 | Vtmmf | Immf | Lmmf | (Vt + L)mmf | M | EIT | Hv | ε | Vp | |
|---|---|---|---|---|---|---|---|---|---|---|---|---|---|---|
| am [cm³/g] | 0.015 | −0.224 | −0.822 | 0.043 | 0.904 | 0.394 | −0.201 | −0.668 | 0.201 | −0.538 | −0.531 | −0.560 | 0.693 | 0.705 |
| a1 [cm³/g] | −0.232 | −0.398 | −0.797 | −0.108 | 0.721 | 0.181 | 0.014 | −0.591 | −0.014 | −0.598 | −0.649 | −0.809 | 0.461 | 0.501 |
| De [cm2/s] | −0.075 | 0.142 | 0.450 | 0.094 | −0.703 | −0.663 | 0.531 | 0.616 | −0.531 | 0.153 | 0.158 | 0.239 | −0.639 | −0.642 |
| ρr | ρp | Vdaf | Aa | R0 | Vtmmf | Immf | Lmmf | (Vt + L)mmf | M | EIT | Hv | ε | Vp | |
|---|---|---|---|---|---|---|---|---|---|---|---|---|---|---|
| am [cm³/g] | 0.136 | −0.154 | −0.750 | 0.200 | 0.729 | 0.382 | −0.107 | −0.687 | 0.107 | −0.361 | −0.550 | −0.543 | 0.543 | 0.543 |
| a1 [cm³/g] | −0.139 | −0.425 | −0.821 | 0.004 | 0.804 | 0.164 | 0.214 | −0.658 | −0.214 | −0.429 | −0.532 | −0.789 | 0.425 | 0.454 |
| De [cm2/s] | −0.290 | −0.120 | 0.629 | −0.101 | −0.593 | −0.697 | 0.508 | 0.735 | −0.508 | 0.014 | 0.136 | 0.290 | −0.710 | −0.701 |
| Independent Variables | Dependent Variables | R2 | R |
|---|---|---|---|
| R0 | a1 | 0.520 | 0.721 |
| R0, M | 0.593 | 0.770 | |
| R0, Vp | 0.562 | 0.750 | |
| R0, Hv | 0.744 | 0.863 | |
| Hv, Vdaf | 0.754 | 0.868 | |
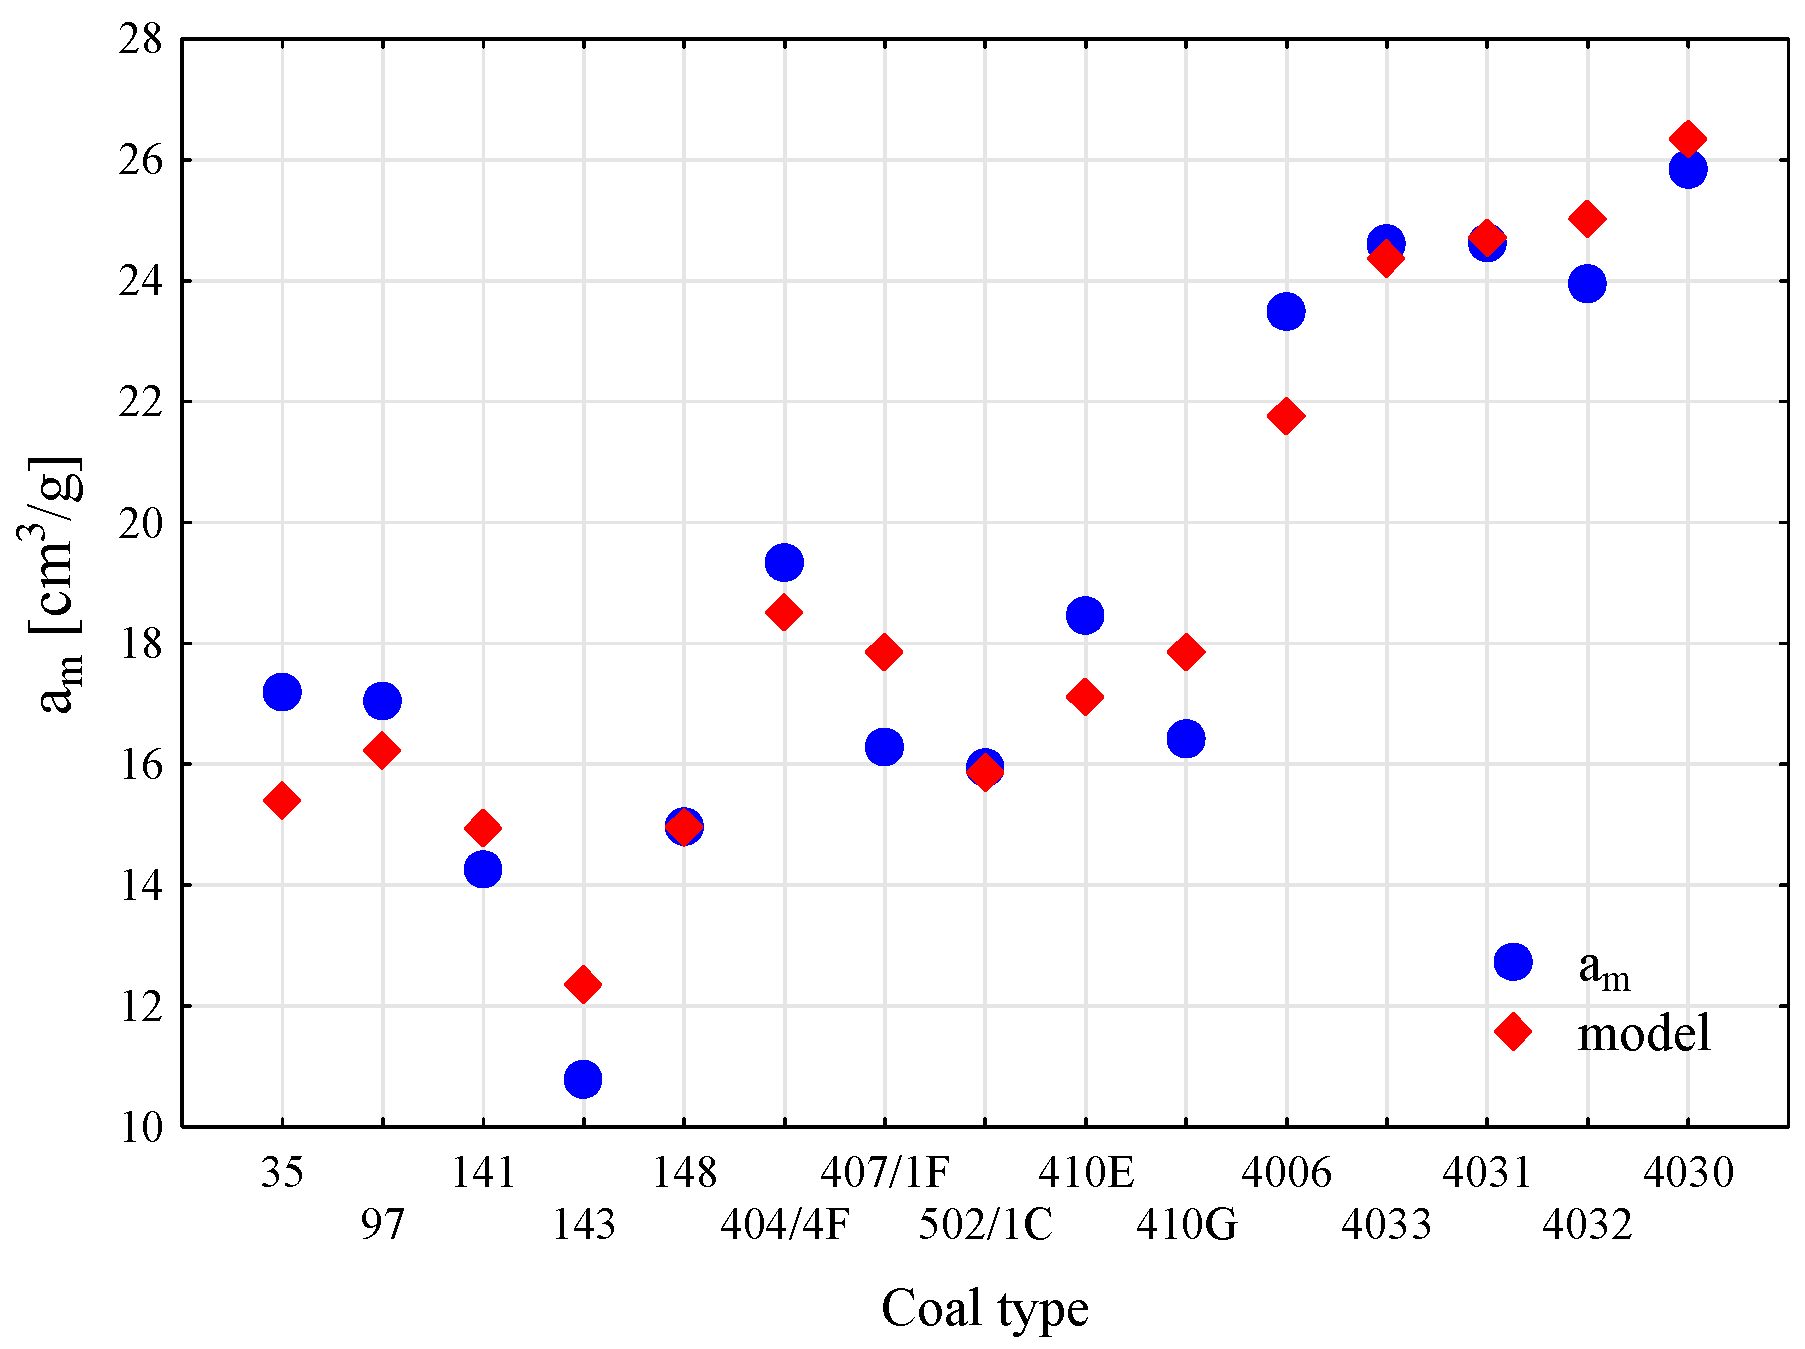
| R0 | am | 0.818 | 0.904 |
| R0, Vdaf | 0.821 | 0.906 | |
| R0, M | 0.826 | 0.910 | |
| Vdaf, Vp | 0.705 | 0.839 | |
| Vdaf, Hv | 0.678 | 0.823 | |
| R0, EIT, M, I, A | 0.937 | 0.968 | |
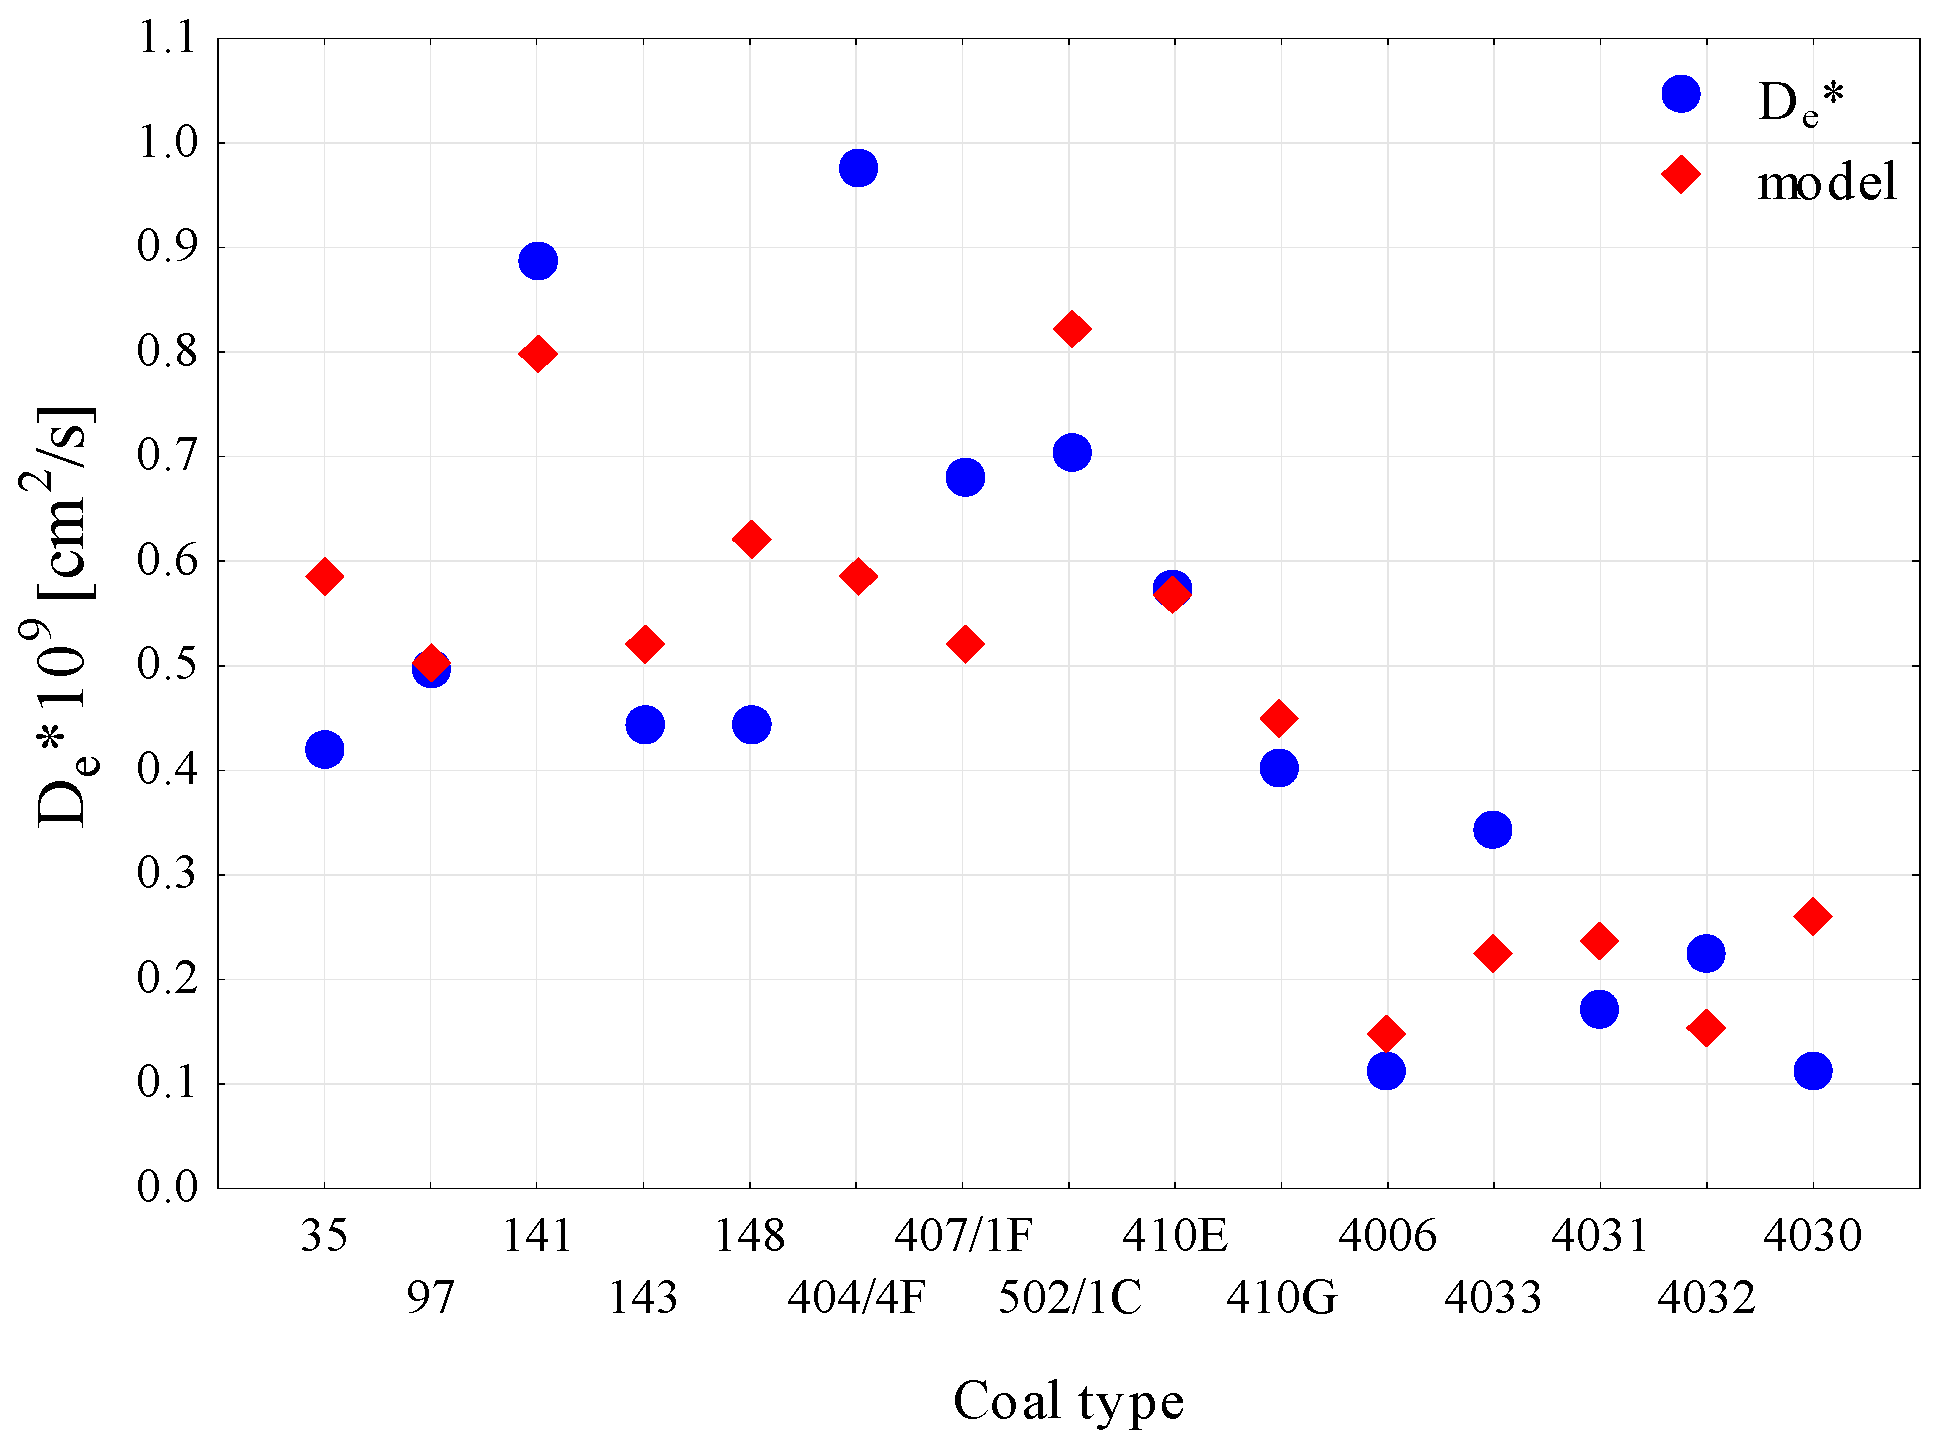
| R0 | De | 0.494 | 0.703 |
| R0, Vdaf | 0.619 | 0.786 | |
| R0, Vt | 0.672 | 0.820 | |
| R0, I | 0.677 | 0.823 | |
| R0, Vp | 0.502 | 0.708 | |
| Vt, ε | 0.557 | 0.746 | |
| I, ε | 0.508 | 0.713 |
© 2020 by the authors. Licensee MDPI, Basel, Switzerland. This article is an open access article distributed under the terms and conditions of the Creative Commons Attribution (CC BY) license (http://creativecommons.org/licenses/by/4.0/).
Share and Cite
Godyń, K.; Dutka, B.; Chuchro, M.; Młynarczuk, M. Synergy of Parameters Determining the Optimal Properties of Coal as a Natural Sorbent. Energies 2020, 13, 1967. https://doi.org/10.3390/en13081967
Godyń K, Dutka B, Chuchro M, Młynarczuk M. Synergy of Parameters Determining the Optimal Properties of Coal as a Natural Sorbent. Energies. 2020; 13(8):1967. https://doi.org/10.3390/en13081967
Chicago/Turabian StyleGodyń, Katarzyna, Barbara Dutka, Monika Chuchro, and Mariusz Młynarczuk. 2020. "Synergy of Parameters Determining the Optimal Properties of Coal as a Natural Sorbent" Energies 13, no. 8: 1967. https://doi.org/10.3390/en13081967