1. Introduction
Kuwait has experienced a steady increase in its population since the 1960s, however, with the turn of the century, an exponential rise has been observed as per
Figure 1 [
1]. This steep increase, along with economic growth, has resulted in higher electrical consumption, exceeding approximately 30 TWh per annum since 2000, whereas the highest level in the 1980s was less than 10 TWh [
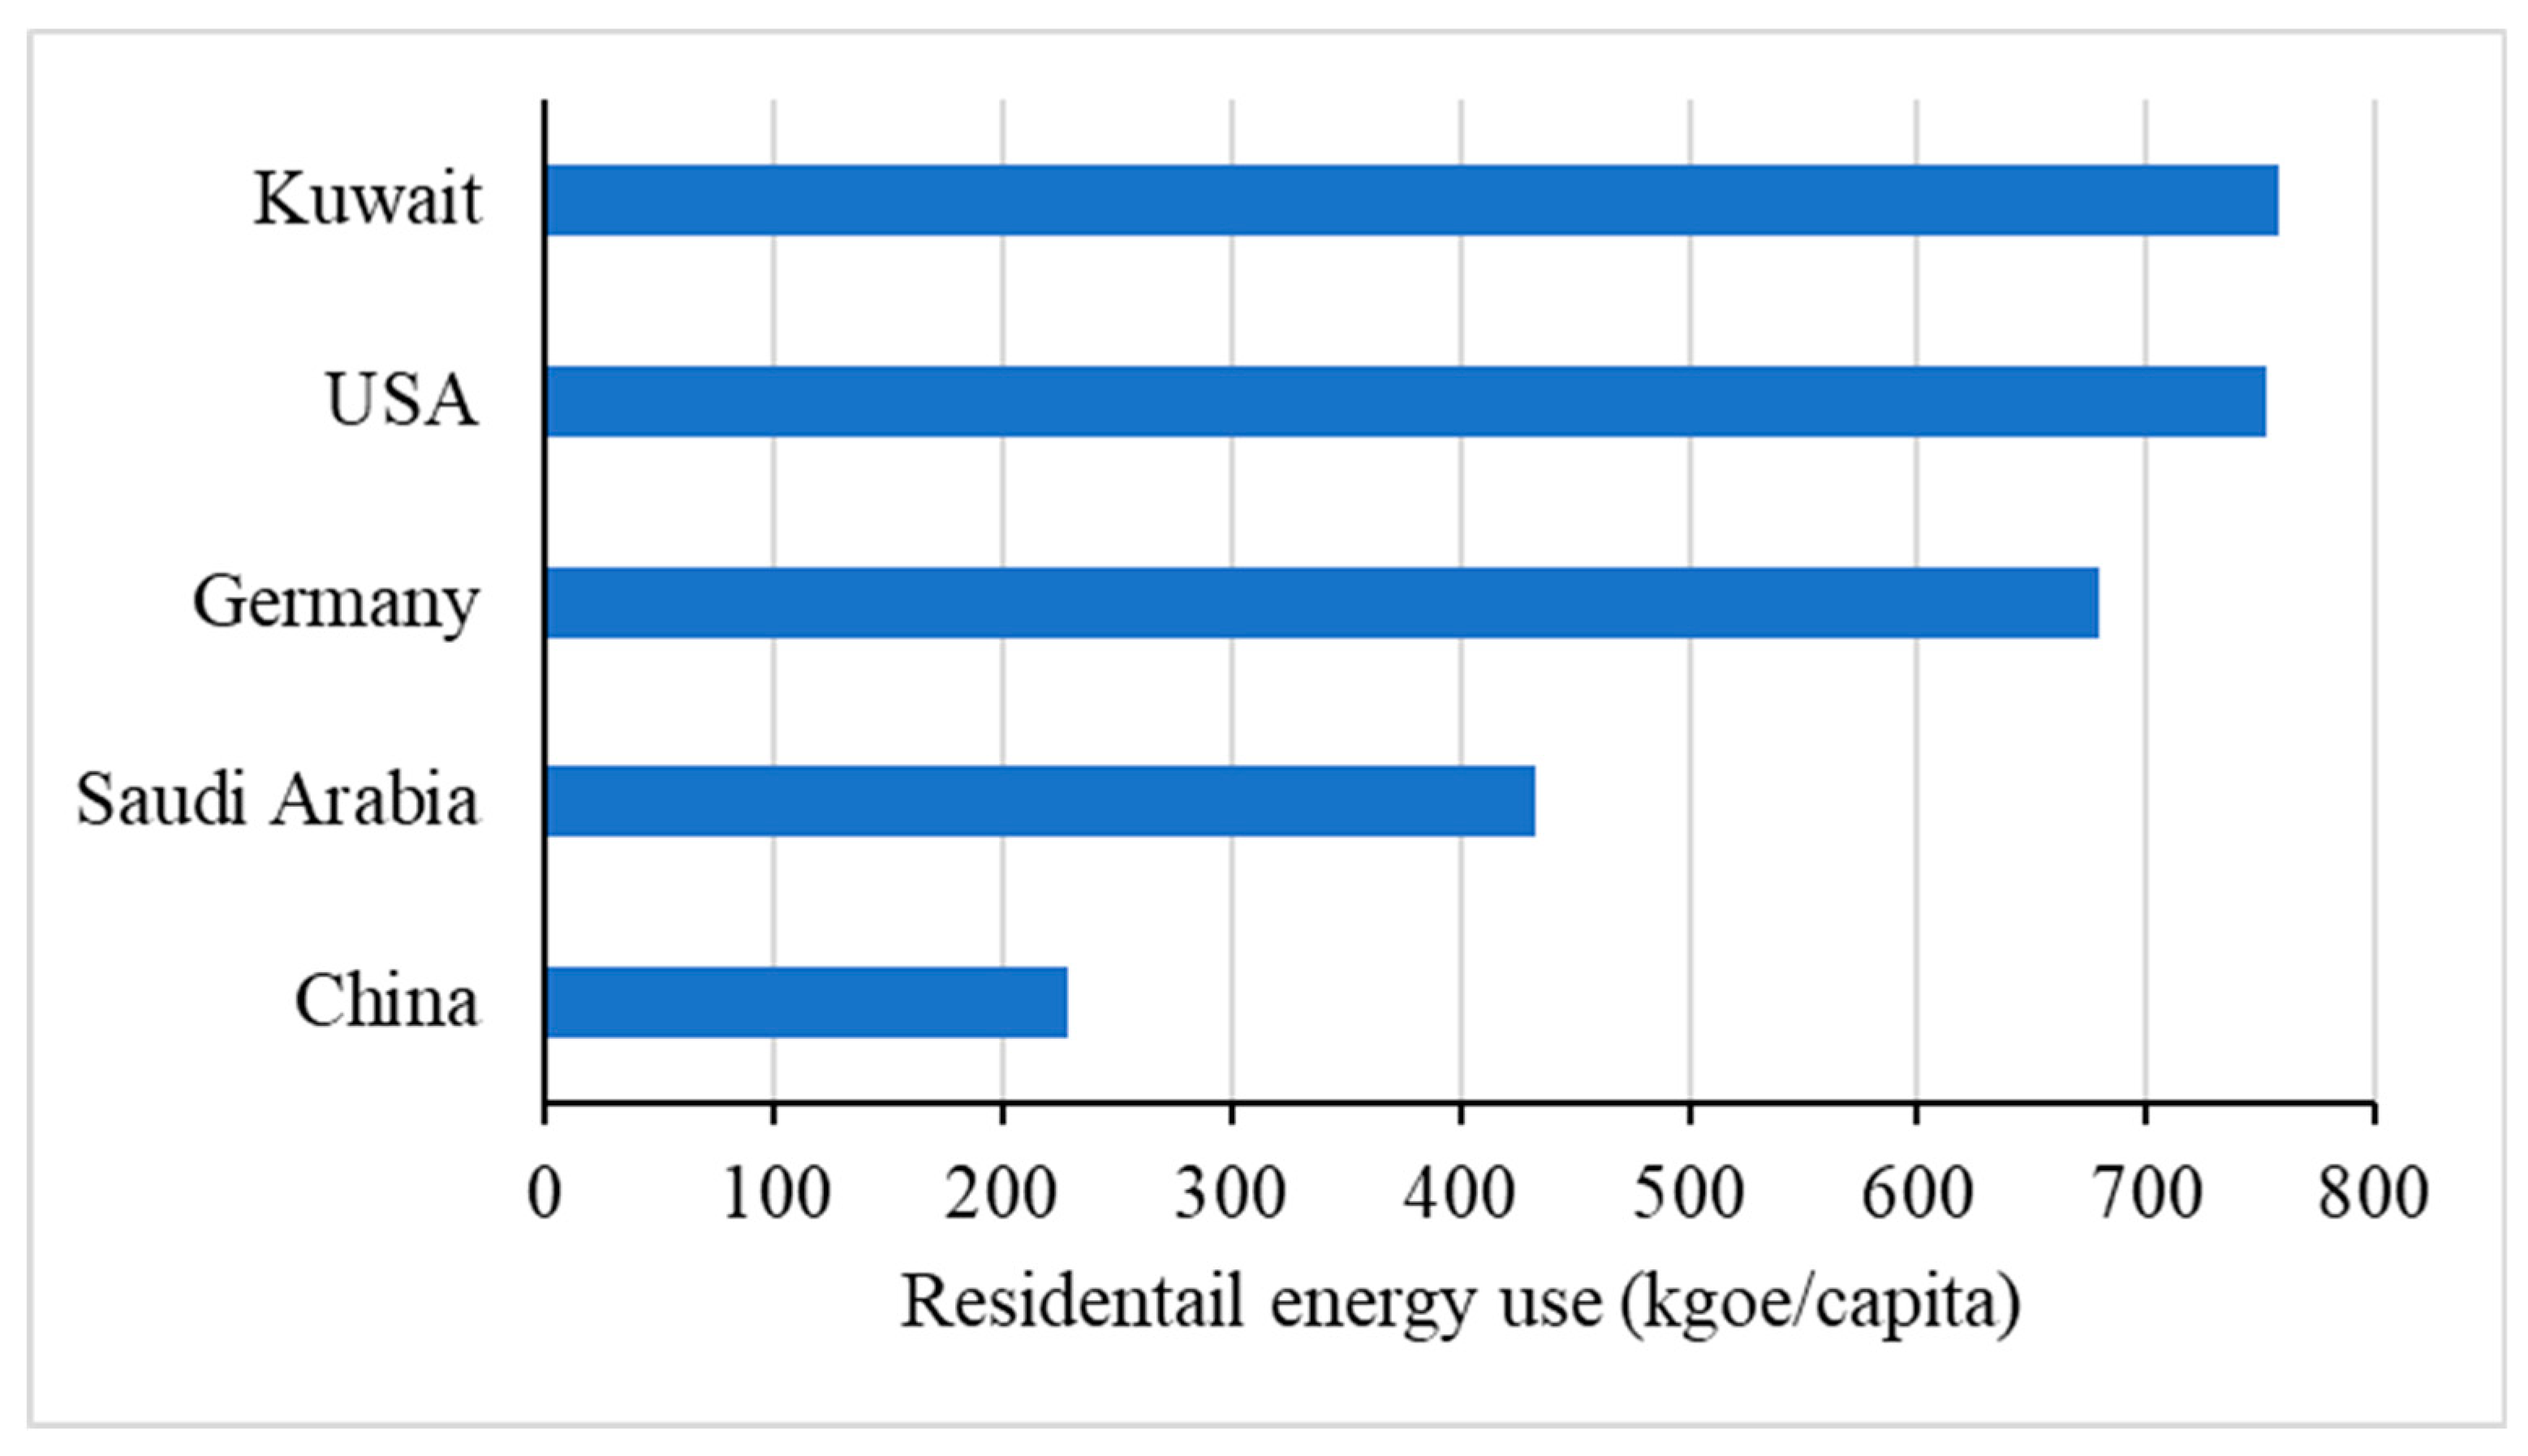
2]. Aside from the high population growth and rise in new construction, Kuwait also has a high energy use per capita, as shown in
Figure 2 [
3], which is mainly driven by the heavy subsidization of the cost of electricity. Having more than doubled since the early 1990s, per capita energy consumption poses a serious problem [
2]. Considering the demand for labor and the fast-paced development trend in the region, both
Figure 1 and
Figure 2 clearly indicate the impact created on the electrical load for Kuwait. In addition, according to the Ministry of Energy and Water, the peak demand is expected to reach 30,000 MW by 2030, whilst 70% of this is attributed to new residential construction [
4].
Given the growing population and new construction initiatives in the form of housing subsidies coupled with high energy consumption per capita, energy consumption growth trends create a risk for the stability of the electrical grid and meeting the national demand. While extensive studies have been published on building energy use in Kuwait, most have been observed to be geared toward the evaluation of certain policies or retrofit programs related to energy efficiency. In the literature, end-use energy consumption for residential buildings in Kuwait has been identified in studies that utilize archetypes. Baqer and Krarti [
5] modeled a prototypical Kuwaiti villa and carried out a series of analyses to ascertain the effectiveness of certain energy policies, and the impact of various energy efficiency measures on energy use and peak demand. It was observed that air conditioning accounts for 72% of the total electrical usage, whereas lighting and miscellaneous household appliances account for 22% of the energy consumption combined.
Another study conducted by Krarti and Hajiah [
6] examined the impact of daylight time savings (DST) on energy use for various types of buildings. Similarly, the analysis was based on a series of archetypical models that represented buildings in the residential and commercial sectors. According to their results, space cooling represents a majority of the usage and peak demand at 48% of annual energy use, and represents a peak load of 64%.
To forecast energy demand, a study by Wood and Alsayegh [
7] modeled the electrical demand up to 2030 by using a top-down approach. It was developed based on historic data of oil income, gross domestic product (GDP), population, and electric load. However, a forecasting model of the energy consumption and demand by end-use using a bottom-up approach has not, to the best of our knowledge, been developed as yet. Should a breakdown of energy end-uses be analyzed and forecasted, better building energy use can be strategized as well as the development of more effective codes and standards. Given that 57% of the energy consumption is attributed to the residential sector, it is crucial to assess the baseline energy consumption patterns [
6].
A number of different algorithms are available to study the residential energy consumption [
8,
9,
10,
11,
12]. These models depend on accurate input data to generate meaningful results. Generally, the analysis methods can be divided into ‘‘top-down’’ and ‘‘bottom-up’’ approaches, as shown in
Figure 3 [
13,
14]. The top down approach calculates the energy consumption for the entire target sector by using the econometric and technological data for the region [
15,
16]. On the other hand, the bottom up approach calculates the individual building energy consumption by using either statistical model or engineering models that are then aggregated to obtain the energy use for the entire sector [
17,
18].
Statistical and engineering methods represent two distinct approaches applied in the bottom-up models to determine the energy consumption of specified end-uses [
14]. The statistic method first identifies a sample of households that represent the entire building stock and then uses regression and other statistic models to predict the energy use of the sampled household and hence the entire building stock [
19]. Energy modeling is gaining more popularity in the bottom-up approach with the development of energy simulations. This approach utilizes the archetype models to represent the building stock and aggregate the calibrated model results to predict the energy consumptions of the entire building stock [
14]. One major advantage of the energy model is that it can predict the end-use distribution without requiring sub-metering. This offers great flexibility and more detail in terms of the end-use characteristics when compared to the statistical model. However, to obtain accurate simulation results, a high-quality set of inputs often from onsite surveys and calibration to the historical energy use data are required.
2. Residential Characteristics in Kuwait
Buildings account for nearly one-third of the global final energy consumption and 55% of global electricity demand. Electricity demand growth in buildings has been particularly rapid over the last 25 years, accounting for nearly 60% of total growth in global electricity consumption [
20]. Similar to the global figures, the energy demand in Kuwait is also rising rapidly. Due to the hot climate and high energy use per capita, residential buildings account for a significant portion of the total electrical consumption. Mainly attributed to the air conditioning and refrigeration loads, 57% of the peak demand consumed in Kuwait is from the residential sector [
21].
It should also be underlined that the main factor contributing to such high rates of energy-use-per-capita is subsidization. The government in Kuwait subsidizes 94.7% of the total cost of electricity, leaving a factional cost of only 2 fils/kWh (
$0.007/kWh) for the end-user [
5]. Targeting electrical consumption in buildings will drastically reduce the impact on the electric grid, but also reduce CO
2 emissions, since Kuwait heavily relies on fossil fuels for generation. In doing so, analyzing the energy consumption patterns is crucial.
Due to the vast differences between Kuwaiti and non-Kuwaiti (i.e., expatriate) residential households, observing both sides separately is very important. The differences range from electrical consumption patterns, appliance ownership rates, and occupancy behavior to different utility rate structures. In further detail, approximately 90% of Kuwaiti households would fall under the single-detached home category, as most are single-family homes, whereas roughly 70% of non-Kuwaiti families would be under the multi-family home category, mostly living in apartment buildings [
22]. The electrical rate for the residential sector, which includes single-detached dwellings, is 1.8 fils/kWh (
$0.006/kWh). The rate for the investment sector, which includes multi-family homes, is approximately 250% more when compared to the residential sector. Furthermore, the average household size for Kuwaiti homes is roughly eight people, whereas non-Kuwaiti homes are smaller, at around four persons [
22,
23]. In addition, the average growth rate of the expatriate population between 2000 and 2016 was 5.2%, compared to 2.9% for the Kuwaiti population [
1,
22].
3. Methodology
This work presents a bottom-up approach for modeling and forecasting end-use energy consumption and demand in Kuwait’s residential buildings up until 2040. The methodology relies on information pertaining to the energy consumption of specific household equipment and appliances, where factors such as quantity, operating hours, and power requirements are accumulated and extrapolated to a national scale to ultimately estimate the usage patterns in Kuwait. Therefore, energy consumption and demand are calculated at the individual level and aggregated to estimate the national consumption and demand. In this model, end-uses were broken into air conditioning, lighting, appliances, and space heating and water heating, and further sub-categorized by different technologies. Moreover, each end-use category was further broken down by different equipment and appliances with corresponding data on diffusion rates and energy efficiency ratings. The rate of diffusion was based on data obtained from surveys and the available literature [
23,
24]. The driver variables of this model were based on macroeconomic variables such as population, household size and income and engineering variables like unit energy consumption, and efficiency ratings.
Figure 4 and
Figure 5 illustrate the modeling structure.
The initial step is to model the quantity of equipment owned and the present initial stock. The sales and stock turnover are then derived from first purchases and replacements. The first purchases are driven by a growth in population and increase in ownership, while replacements are calculated based on the age of equipment and a retirement function. Next, the average unit energy consumption (
UEC) and unit power demand (
UPD) per equipment are derived and the total energy consumption and peak demand are modeled using the following general equations:
where
Stock (
y,
i) represents the quantity of equipment of vintage (
i) remaining annually in year (
y). The variable
UEC (
y,
i) on the other hand, denotes the unit energy consumption at the corresponding year of purchase (
y − i) and the
UPD (
y,
i) is the unit demand power during the peak time. Finally, the overall useful life of the equipment is represented by
L. Due to the lack of published information, acquiring data on the sales volumes of equipment, efficiency ratings, ownership details, and daily consumption patterns is not at all feasible for the state of Kuwait. This analysis therefore utilized an array of surveys that included national statistics and numerous reports published by the government [
2,
22,
23].
3.1. Stock and Diffusion Rate
Since the overall consumption of electricity is impacted by the total quantity of equipment, it is crucial to calculate the adoption rates for the population as well as the total sales numbers of end-use equipment. The sales are the sum of initial purchases of equipment and the replacement purchases, which includes replacements-on-burnout and early retirements. The calculations for replacements involve the age of the equipment within the stock and a retirement function, which represents the percentage of failed equipment in a vintage stock:
First purchases, shown in Equation (4), represent an increase in the stock quantity that can be due to new construction projects such as housing subsidies by the Public Authority of Housing Welfare (PAHW) or an increased rate of equipment diffusion per household, as shown in Equation (5):
where
H(
y) represents the number of new households based on [
22].
D(
y) is the equipment diffusion rate per household. Equipment diffusion rates are not available as input data, but are projected according to a macroeconomic model using a logistic function [
25,
26]:
where
I(
y) denotes the average annual income per household (
y), whereas
E(
y) is the electrification rate,
U(
y) is the urbanization rate, and
γ and
β are the parameters for scale. For the case of Kuwait, since the income, electrification, and urbanization rates are relatively high, diffusion rates for equipment are reflective of this phenomenon in the analysis. The logistic function, by definition, has a maximum value of one at which the saturation level is reached. However, some households have more than one appliance or equipment of the same type. Therefore, the logistic function is scaled by the parameter
α, as seen in Equation (6), which is the saturation level [
25]. As the climate conditions directly impact the air conditioner ownership rates, cooling degree days (CDD) were used instead of an urbanization rate in the equation above to calculate the diffusion rates of AC units. For some appliances, the sale price affects the diffusion rate as purchases depend on affordability. Therefore, a price variable was added for some appliances based on [
27]. Replacement stock are attained from previous sales as in Equation (7):
In Equation (7),
Retirements (
i) represents the probability of the equipment retiring at a given lifetime for each year up to its entire lifetime (
L), and is modeled using a Weibull distribution [
16,
28]:
where
i is the number of years after the equipment is purchased;
λ is a scale parameter; and
k is a shape parameter, which determines the way the failure rate changes through time. These parameters were estimated for each equipment based on [
29].
3.2. Unit Energy Consumption
The next section describes the methods and assumptions for determining the average unit energy consumption (
UEC) for each piece of equipment.
UEC depends on the typical product used (size and rated power), the use patterns, and equipment efficiency. Therefore, the
UEC model includes information on equipment usage and lifetime profiles as well as stock energy efficiencies by vintage and efficiency improvement profiles [
5,
30]. The assumption of the efficiency improvement of the appliances over time was made based on [
31,
32], and the likely improvement was 1–5%, depending on the equipment, considering the technical limitation of the technology.
3.2.1. Air Conditioning
Space conditioning is a large driver of energy consumption in residential buildings and is affected by many variables like weather, building envelope efficiency, building size, equipment types, and occupant behaviors. Therefore, it is challenging to determine the
UEC for AC units and some additional complexity is required for modeling space conditioning in order to obtain reasonable accuracy. This paper used archetype simulation models to estimate the average
UEC for AC systems in the residential building stock in Kuwait. The simulation models were created in DesignBuilder, which is a user interface for the EnergyPlus simulation engine. The weather dataset used as input for the simulation models was the typical meteorological year (TMY) for Kuwait, as developed by the Kuwait Institute for Scientific Research (KISR) [
33]. The TMY datasets represent one year of hourly weather data extracted from long-term data records. The data consisted of the dry-bulb temperature, diffuse radiation, direct normal radiation, wind speed, wind direction, and relative humidity, which were collected from the KISR’s weather stations. Four archetype models with different thermal and equipment performance parameters were created to represent the residential building stock in Kuwait. According to the available information, and based on detailed study as part of the Kuwait-MIT (Massachusetts Institute of Technology) projects on the sustainability of Kuwait’s built environment [
34,
35,
36],
Table 1 summarizes the archetype parameters used in the simulation.
Figure 6 shows the geometry of a sample archetype model. The results from the simulation are shown in
Table 2.
3.2.2. Water Heaters
The unit energy consumption for a water heater was estimated through Equation (9) [
37]:
where usage is the household hot water usage in cubic meter per day;
cp is the volumetric specific heat of water (Jm
−3K
−1);
Tsupply is the incoming cold-water (C);
Ttank is the tank temperature (C); and
EF is the energy factor of the water heater. This was assumed to be 0.904 for standard electric water heaters and 0.95 for high efficiency ones [
38]. Electricity is the only fuel used for water heating in residential buildings in Kuwait.
3.2.3. Lighting
Since all electrified households use electricity for lighting, the model assumes that lighting diffusion is equal to the national electrification rate, which is almost 100% for Kuwait [
1]. However, the lighting energy is largely determined by the number of lighting fixtures, type of lamps, and usage patterns. Therefore, the residential lighting stock was broken down by lamp type, based on the 2010 lighting stock data in Kuwait [
39,
40]. Almost 50% of the lighting stock in Kuwait is incandescent bulbs and around 37% is compact fluorescent lamps (CFL). The daily average use is estimated to be seven hours based on [
30].
3.2.4. Appliances
The home appliance end-use in residential households includes electric appliances like refrigerators, televisions, computers, and others. The
UEC for appliances is the product of the nameplate wattage and the usage hours. For products with multiple modes like standby mode, energy consumption for each mode is calculated separately and added to obtain the total energy consumption in all modes. The average hour use, rated wattage, and life span for most of the appliances was estimated based on [
23,
29,
30].
Table 3 lists the various metrics that can be used to calculate the modeled energy usage broken down by appliances.
3.3. Unit Power Demand
Unit power demand (
UPD) is determined in a similar way to
UEC, but only focuses on the equipment operating at the peak load period (i.e., summer in Kuwait) and can be expressed as [
44]:
where
P is the nameplate power per unit and rated load factor (
RLF) is the ratio of the maximum operating demand of equipment to the rated input power. For example, air conditioners that operate above their rated input power could result in an
RLF greater than one. The coincidence diversity factor (
CDF) is used to account for the fact that not all stock units are operating at the peak time. The coincidence diversity factor is defined as the peak demand of a population of units at the system peak time to the peak demand of an individual unit, and can be expressed as [
45]:
where
kWpop is the peak demand of the population of units;
kWi is the nameplate rating of unit
i; and
RLFi is the rated load factor of unit
i.
3.4. Forecast Analysis
Figure 7 compares the predictions of the building energy stock model to the actual total energy consumption in Kuwait from 2005 to 2017 after a systematic calibration procedure. The actual energy consumption data were obtained from the Ministry of Electricity and Water (MEW) [
2]. For the calibration analysis, three main input parameters were adjusted as follows:
The lighting power density was lowered to reflect the usage of energy efficient lighting fixtures in new and refurbished dwellings [
39];
Archetypes C and D represent buildings implemented in the 1983 and 2010 MEW energy conservation codes. Therefore, the AC system COP (coefficient of performance) for Archetypes C and D was adjusted to be 2.4 and 2.9, respectively, to reflect the energy efficiency requirements by the MEW [
46,
47];
The household hot water usage was raised to 25 gallon per person per day to reflect the high per capita water consumption in Kuwait [
48].
Good agreement between the predictions of the building energy stock model and the actual energy consumption was obtained with a relative error of less than 5%, as shown in
Figure 7.
To predict a business-as-usual case (i.e., the baseline scenario), the forecast model mainly relies on the UEC and stock. With the projected values of UEC and stock for each equipment, we can use Equations (1) and (2) to predict the energy consumption and peak demand. The forecast of the equipment stock is mainly driven by the diffusion rate D(y) and new housing construction. For Kuwait, the diffusion rate is higher due to the high levels of income and electrification rate.
In addition to the population data mentioned in the Introduction,
Table 4 shows the amount of housing subsidies provided by the Public Authority of Housing Welfare (PAHW) each year that has been projected until 2034. The housing subsidy values are another driving variable used to estimate the stock included in the model by
First purchases(
y) in Equation (3).
Even with the base case scenarios, the efficiency of equipment and appliances tends to improve over the years. This was estimated by assigning an efficiency improvement rate for each equipment and appliance in the model. Depending on the equipment type,
UEC was assumed to improve 1–5% in efficiency per year based on [
31,
32] to account for the technology changes and code requirements. In addition, some new technologies will diffuse into the market and replace old ones that can be less efficient. Light-emitting diode (LED) lighting is a good example since it was introduced in the Kuwaiti market a couple of years ago. A Bass model was used to estimate the adoption rate of LED lighting and was incorporated into the baseline model. The Bass model defines the fraction of sales
F(y) in year
y to represent the adoption rate of a new technology or product as follows:
where
p represents the external factors that drive the market to adopt a new technology such as advertisement, and
q is often referred to as the “word-of-mouth” effect from the early adopters to encourage the “imitators” to adopt the new technology [
50]. To use the Bass model to forecast the adoption of a new product or technology, the parameter
p (innovators),
q (imitators), and the potential market size need to be estimated. Since no historical sales data of LEDs are available for Kuwait, the Bass model parameters were estimated by an analogy to the compact fluorescent lamps (CFL) that have past shipment data and similar diffusion characteristics with LEDs [
51]. The ordinary least squares (OLS) method was used to estimate the Bass model parameters (i.e., the coefficient of innovation (
p) and imitation (
q)), as shown in
Table 5.
Several researchers have analyzed the effect of weather on energy consumption [
52,
53,
54]. For the case of Kuwait, and based on [
55,
56,
57], the influence of weather in the form of cooling degree-days (CDD) on long-term electricity demand forecasting is only statistically significant at 20% due to the low year-to-year weather variation in Kuwait. Therefore, the effect of annual weather variation was not considered in the forecasting model.
4. Results and Discussion
Based on the specified inputs explained in the previous section,
Figure 8 shows a bubble plot of the unit energy consumption of home appliances against the total stock to reveal the energy usage. The additional dimension, the size of the bubble, represents the total annual energy consumption. Household appliances included in the analysis consist of televisions (TV), personal computers (PC), washers, irons, microwave, refrigerator, freezer, water cooler, and dryers.
It can be observed that two major data clusters emerged with similar UECs. One contained the following household appliances: televisions (TVs), personal computers (PCs), washers, irons, and microwaves. The UEC for this group ranged from approximately 200 kWh/year to 400 kWh/year. Despite the relatively low unitary electrical consumption of TVs, the quantity of the stock raised the level of impact. With approximately a thousand sets at a UEC of roughly 250 kWh per year, TVs represent a significant portion of the domestic energy use in Kuwait.
The second group consisting of higher UECs, contained the following household appliances: water coolers, refrigerators, dryers, and freezers. Unlike refrigerators, freezers, and water coolers, dryers have low duty cycles and therefore consume less energy in a year, hence the smaller bubble. Moreover, in contrast, this group had a higher UEC range starting from approximately 800 kWh/yr to 1000 kWh/yr. Collectively, despite being less in stock, the overall impact is almost equally relevant due to the higher electrical consumption. This is partly due to the components that require significant power to operate such as compressors in refrigeration systems or resistive heaters commonly found in irons and electrical dryers.
Table 6 displays the
UEC, stock quantity, and the 2017 total energy consumption for specific household appliances for Kuwaiti homes. Due to the differences in energy use patterns between Kuwaiti and non-Kuwaiti homes, a similar analysis was conducted utilizing equal usage parameters, but with different stock quantities. The
UEC values for the listed household appliances were calculated as outlined in the Methodology section and remain unchanged for both models. The highest
UEC was noted to be freezers, refrigerators, and dryers, respectively, while PCs, washers, and TVs had
UECs that were less than a third that of freezers.
The results indicate that the energy consumption for the listed appliances totaled 1972.36 GWh for Kuwaiti households. Approximately 40% of the total consumption was attributed to refrigerators and freezers. The high energy consumption for these appliances was expected as the UEC values were high to begin with. However, due to the relatively high stock quantities, TVs also represented a significant load on the grid. Despite their low UECs, the impact was offset by the volume, adding up to 926,505 TV sets, the highest stock quantity in all the listed appliances.
Utilizing the same list of appliances, along with their
UEC,
Table 7 shows the 2017 total energy consumption of modeled household appliances with corresponding stock quantities for expatriate (non-Kuwaiti) residential homes in Kuwait and displays the total energy consumption for specific household appliances for non-Kuwaiti homes.
According to the results, the distribution of electricity consumption in residential households in Kuwait differs vastly, since the stock quantity weighs in heavily. Kuwaiti households account for roughly 70% of the total electrical consumption of the modeled appliances, whereas the remaining 30% was attributed to non-Kuwaiti household usage at 721.53 GWh. Parallel to the Kuwaiti profile, the results governing the expatriate households indicated that the top two energy-consuming appliances were refrigerators and freezers. The energy consumption of these two appliances make up approximately 40% of the overall energy usage for the expatriate household appliances.
From a broader perspective, the electrical consumption and demand distribution in residential households in Kuwait is broken down by the following main usage categories: lighting, air conditioning, space heating, water heating, and miscellaneous loads. Electrical consumption patterns remain heavily dependent on air-conditioning, as it represents the biggest slice within the pie charts shown in
Figure 9. Air conditioning accounts for two thirds of the residential household consumption. However, although it is as little as 4.5%, space heating still accounts for a small load.
As seen in the distribution for residential electricity consumption, air conditioning makes up the bulk of the demand for Kuwaiti households at 66%, whereas the rest of the categories (miscellaneous loads, water heating, and lighting) range from 5% to 13%.
Utilizing the methodology outlined in this paper, the forecast of the residential energy consumption end-use was modeled and plotted in
Figure 10. Revealing a similar trend observed in the household electrical consumption distribution and the household electricity demand distribution, air conditioning load is one of the highest loads for households. As per the results of the analysis, it is expected to rise exponentially from the year 2022 onward, reaching an estimated load of 60 TWh. Lighting is predicted to also rise, but much flatter, unlike the trend in air conditioning. The comparison between the actual and forecast points show an accurate model starting from 2005 until 2017. In terms of electrical demand,
Figure 11 displays the growth for the air conditioning load, as it comprises a significant portion of the annual power demand. The results are also presented in a tabular form in
Table 8.
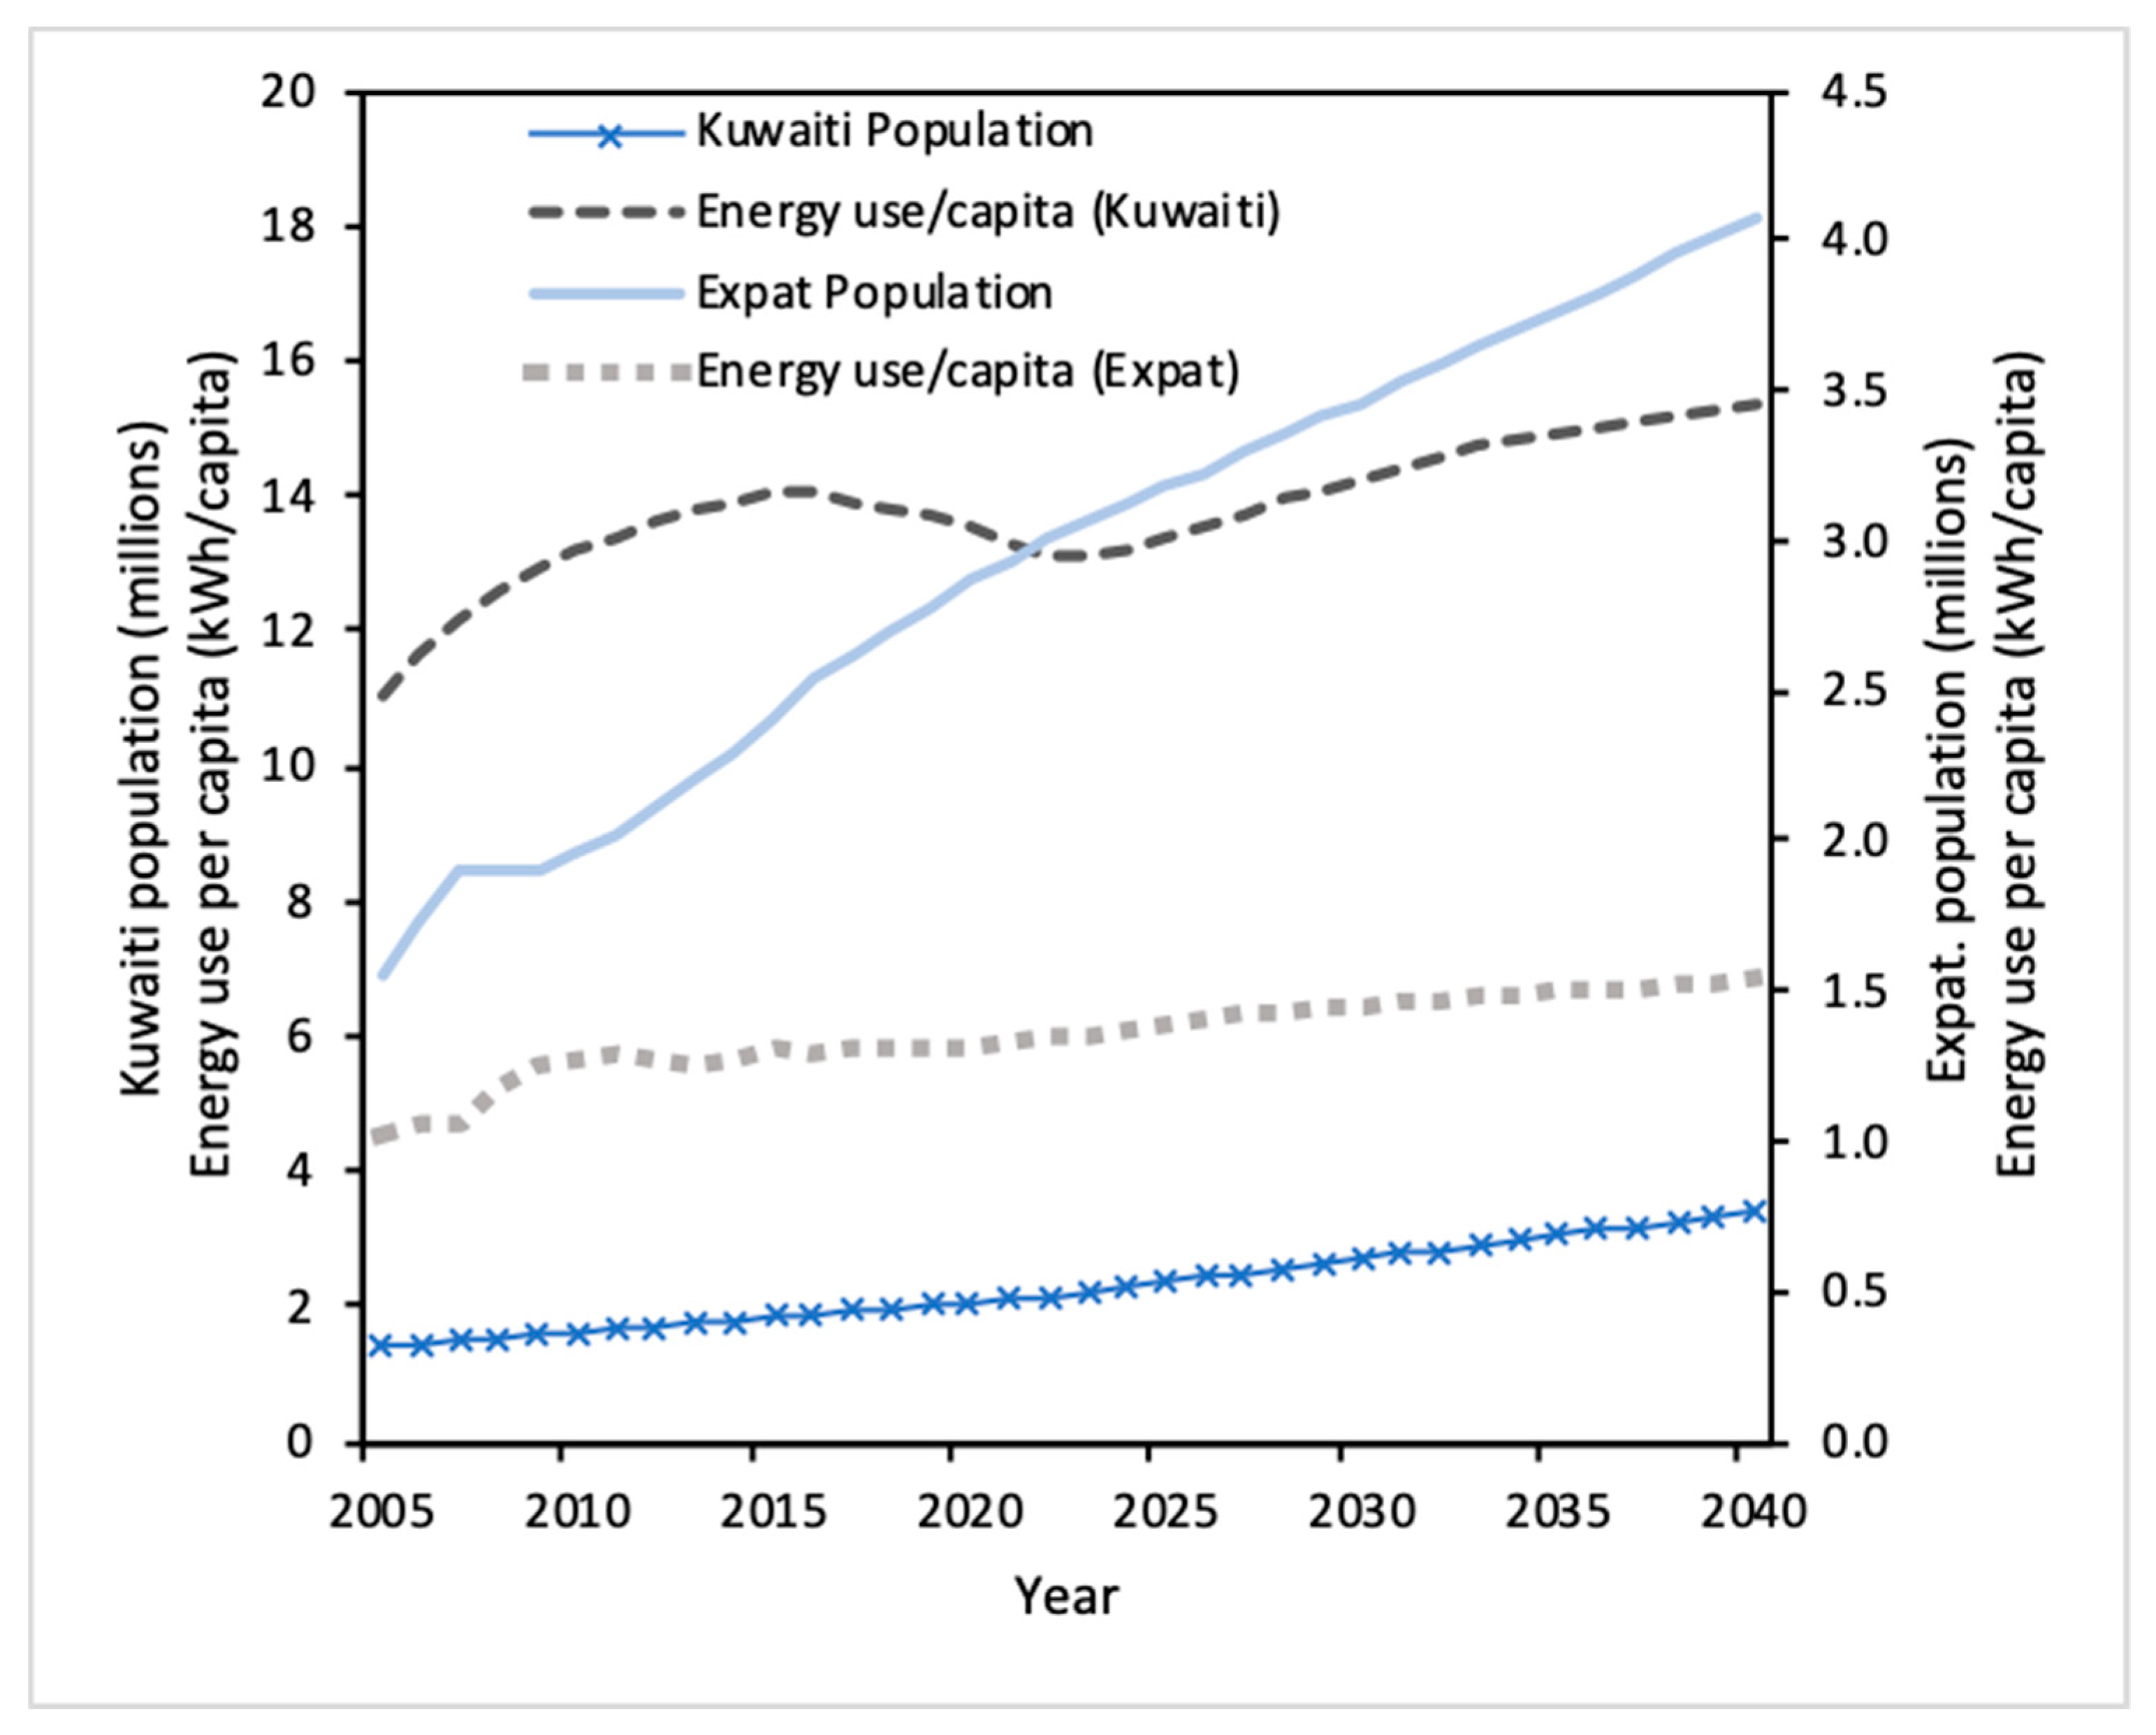
Figure 12 displays the forecast of electrical consumption for Kuwaiti and expatriate (non-Kuwaiti) households until the year 2040. Despite the slow growth in population, the forecast analysis indicates that the Kuwaiti energy consumption per capita was significantly higher than that of the expatriates, reaching levels of 15 MWh. The values for expatriates were almost stagnant, staying well below 1.5 MWh, despite the growing population figures that are expected to reach four million, more than doubling since 2005. The results are also represented in tabular form in
Table 8.
5. Conclusions
Kuwait has one of the highest energy consumption per capita levels in the world. This large-scale consumption is negatively impacting its natural resources and the environment. The building sector alone accounts for 57% of electrical consumption. It is therefore important to study the driving impacts in a building’s energy consumption in Kuwait. Utilizing end-use baseline information for residential loads sets an important foundation to help understand the residential consumption patterns. Based on the specified end-use equipment and certain parameters, a forecasting analysis was conducted to estimate the end-use distribution of electrical consumption for the state of Kuwait until the year 2040. In the model, end-uses were broken down into the following: air conditioning, lighting, miscellaneous loads, and space heating and water heating.
The resulting unit energy consumption (UEC) of home appliances was plotted against the total stock, which illustrated the impact of each of the specified home appliances. Refrigeration units, out of all appliances, held the highest UEC by far, as they were high in both stock and UEC values. A forecast model was then plotted to reveal the end-use energy consumption and peak demand in Kuwait until 2040. The air conditioning loads are expected to rise in the future with an average annual growth rate of 2.9%. Meanwhile, the rise in lighting energy consumption is much flatter due to an expected gradual shift toward more efficient lighting. Furthermore, based on the forecast results, differences between the Kuwaiti and expatriate (non-Kuwaiti) residential loads were observed. To the best of our knowledge, this is the first attempt to estimate the energy consumption of non-Kuwaiti households, where expatriates make up two-thirds of the population. These results provide opportunities for the development of more effective energy policies as well as opportunities for energy efficiency initiatives for the future.
The proposed model in this paper integrates equipment stock and unit energy consumption in order to project energy consumption at a more detailed level than other forecasting models. This level of detail in individual end-use equipment allows for the construction of various and detailed energy efficiency scenarios such as energy efficiency standards and labeling programs. Since the model accounts for replacement stock of equipment and appliances, this can also be used to evaluate energy retrofit programs. Moreover, this approach allows for data on equipment efficiency, sales, and stock over time to be separately developed, assessed, and incorporated into the model. The result is the ability to evaluate the stock turnover and penetration of energy-efficient equipment to the building stock, and their effect on the energy use and peak demand. It will also make the model more dynamic and updated based on the available sales data.


