A Comparison of Energy and Thermal Performance of Rooftop Greenhouses and Green Roofs in Mediterranean Climate: A Hygrothermal Assessment in WUFI


Abstract
:1. Introduction
State of the Art
2. Materials and Methods
2.1. Climate
2.2. Green Roof
2.3. Rooftop Greenhouse
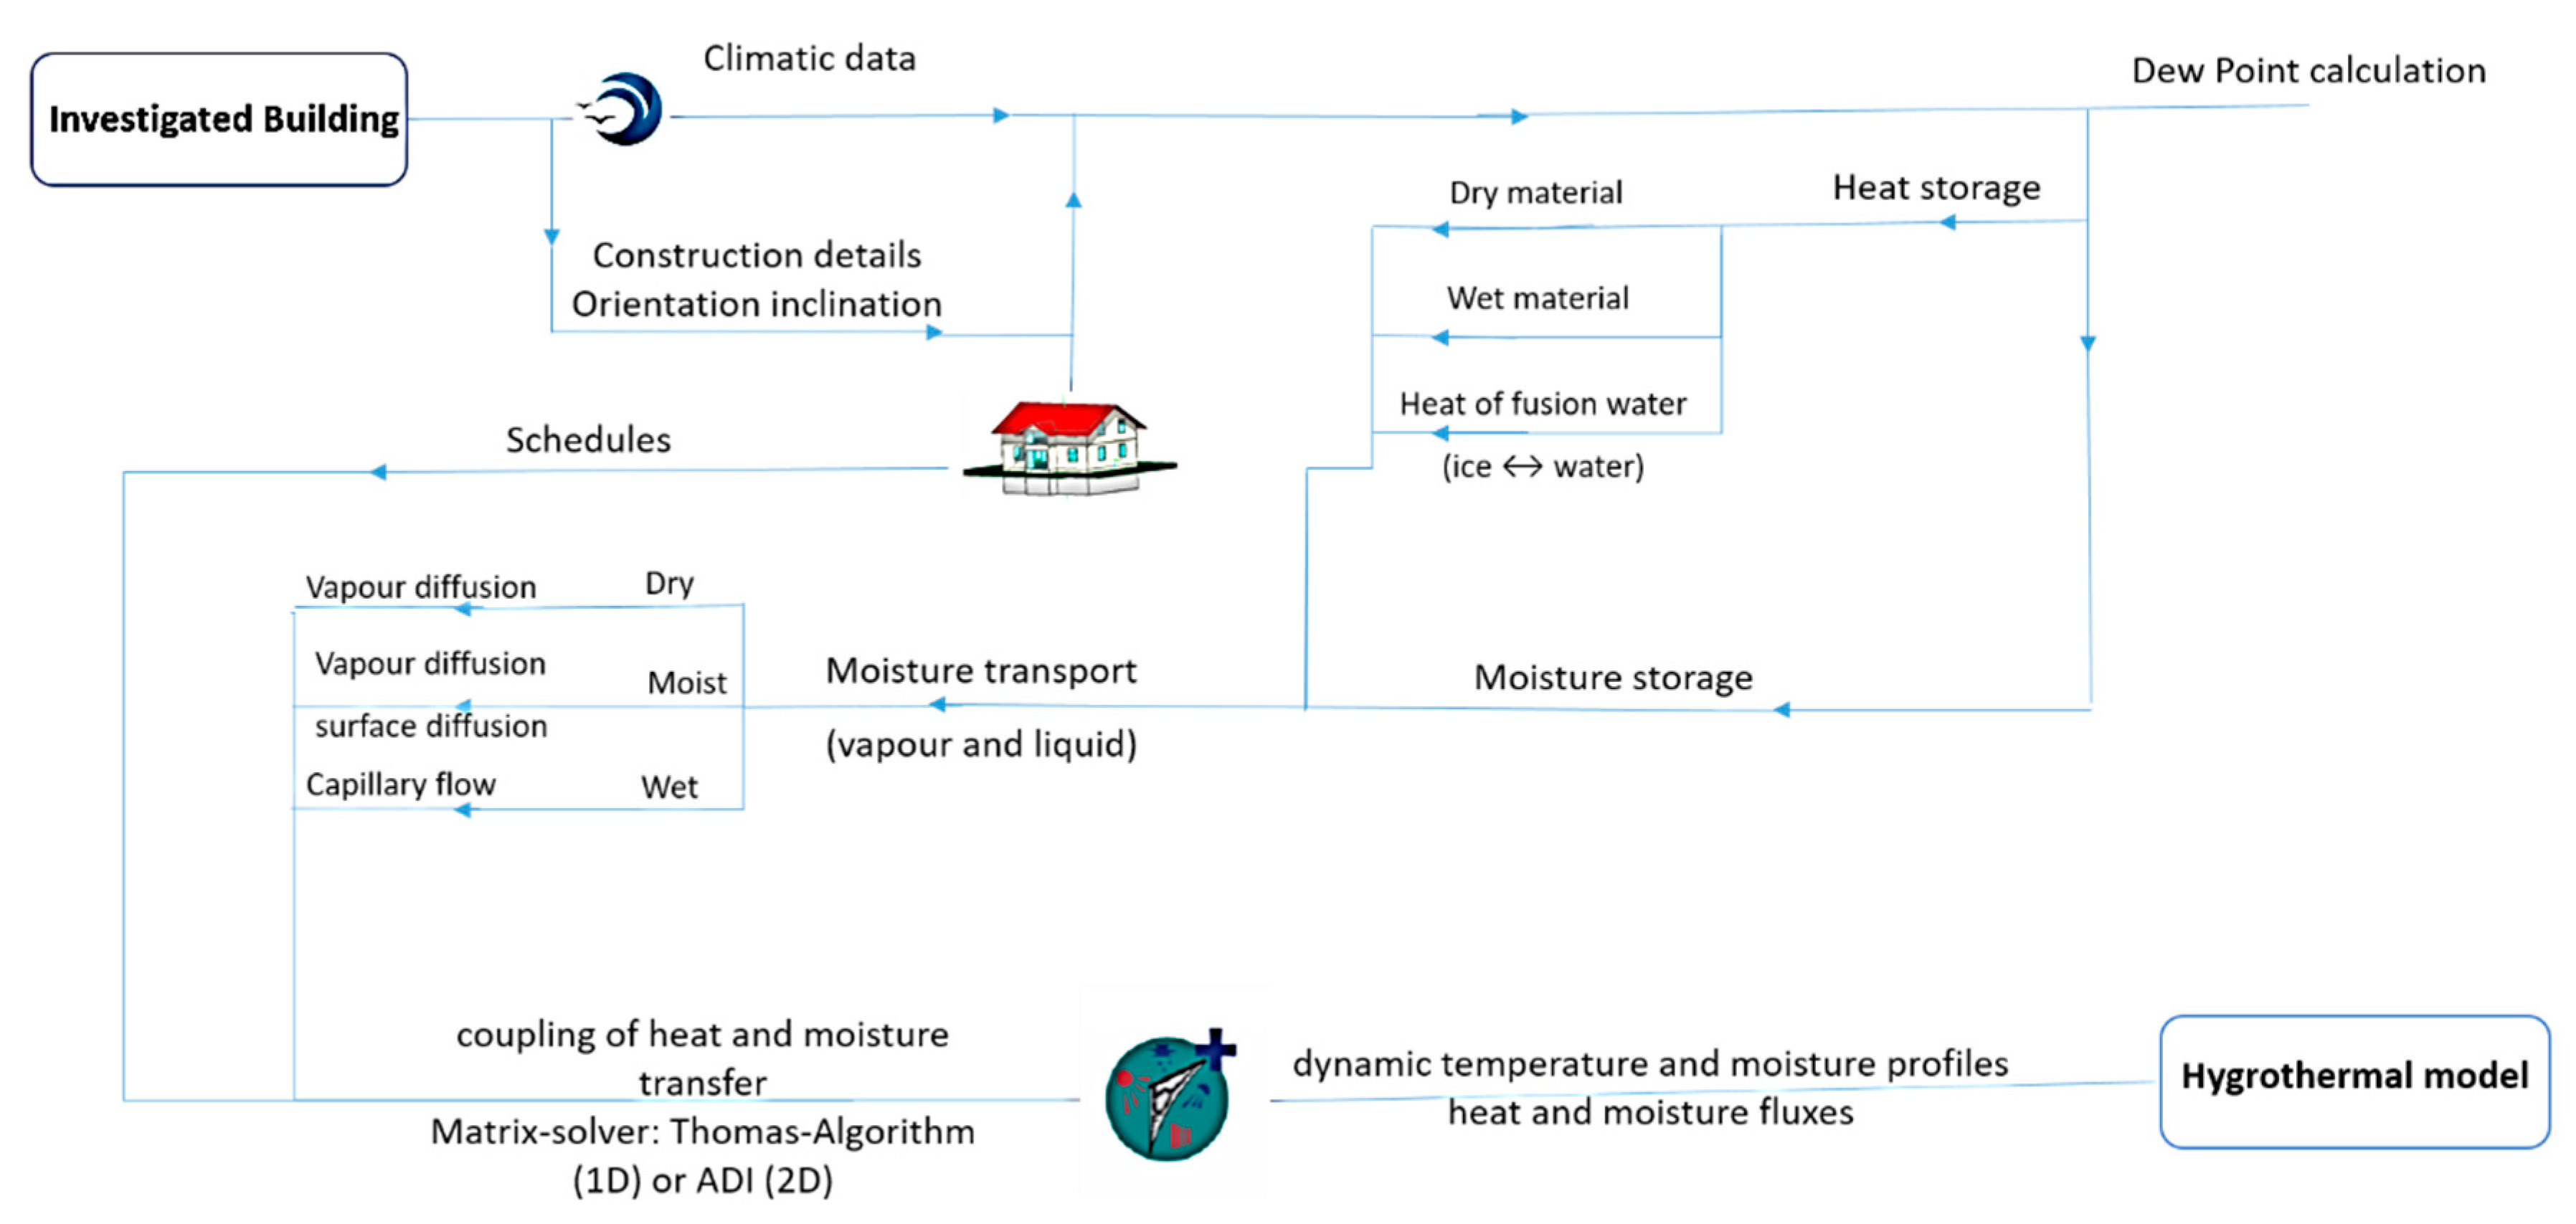
2.4. Model Description
3. Results and Discussion
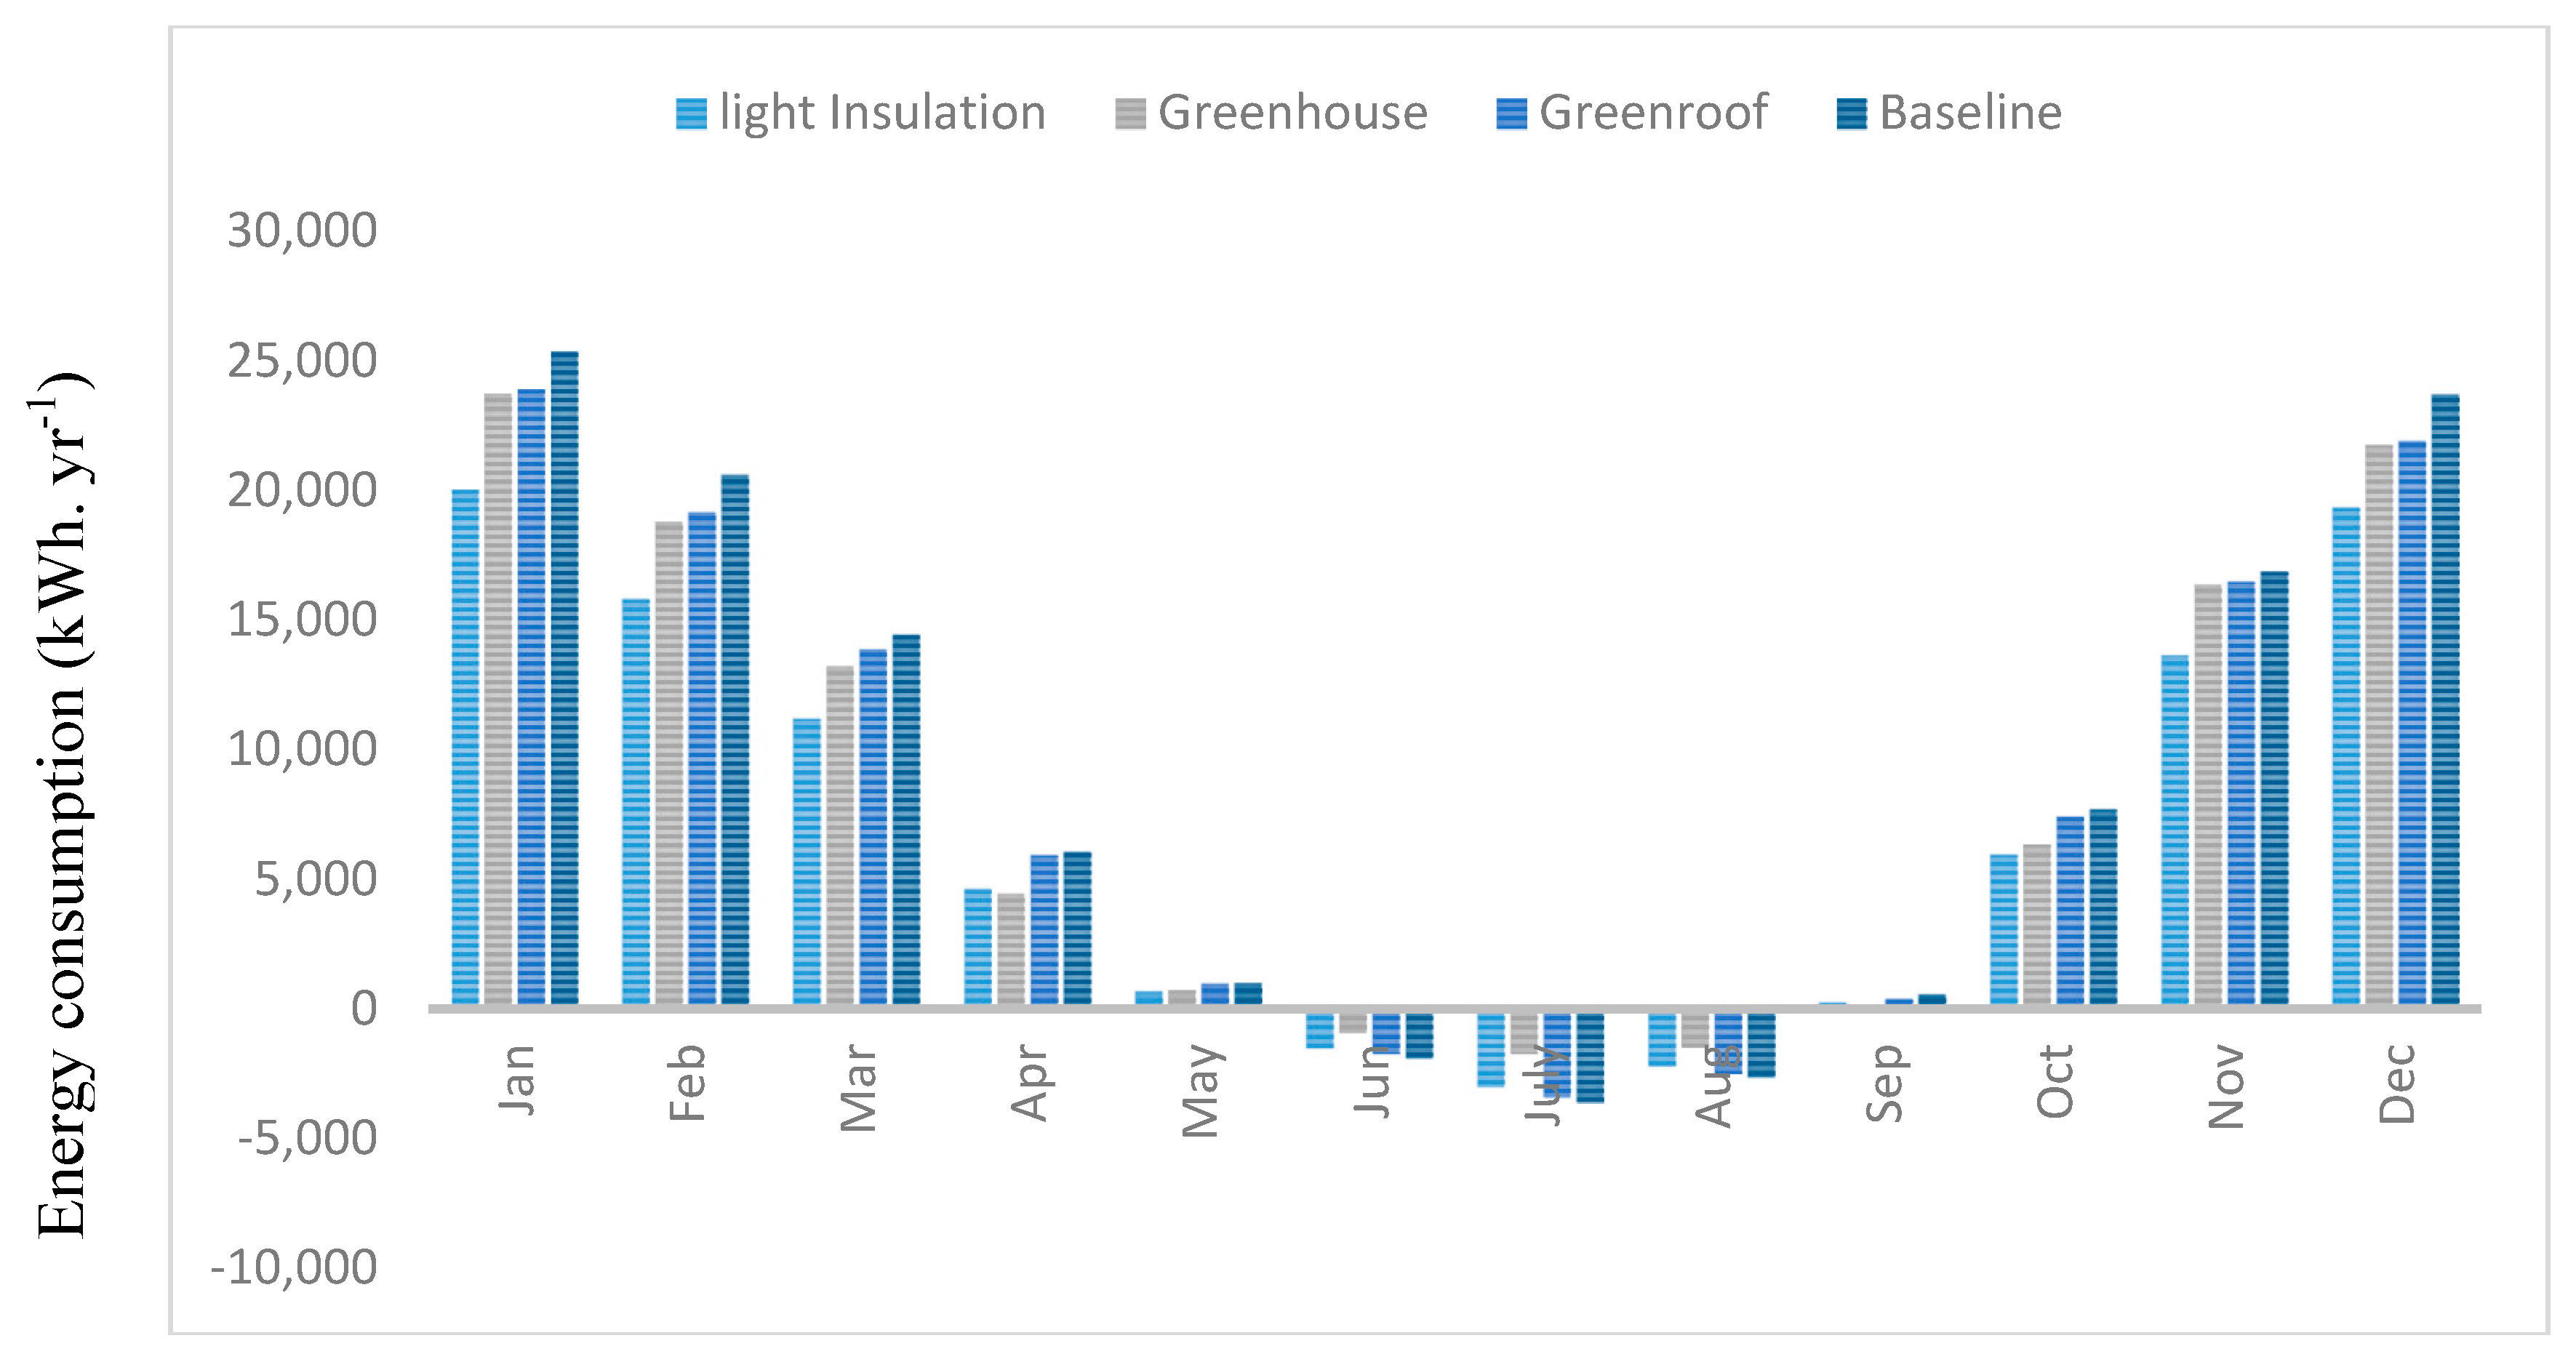
3.1. Energy Needs
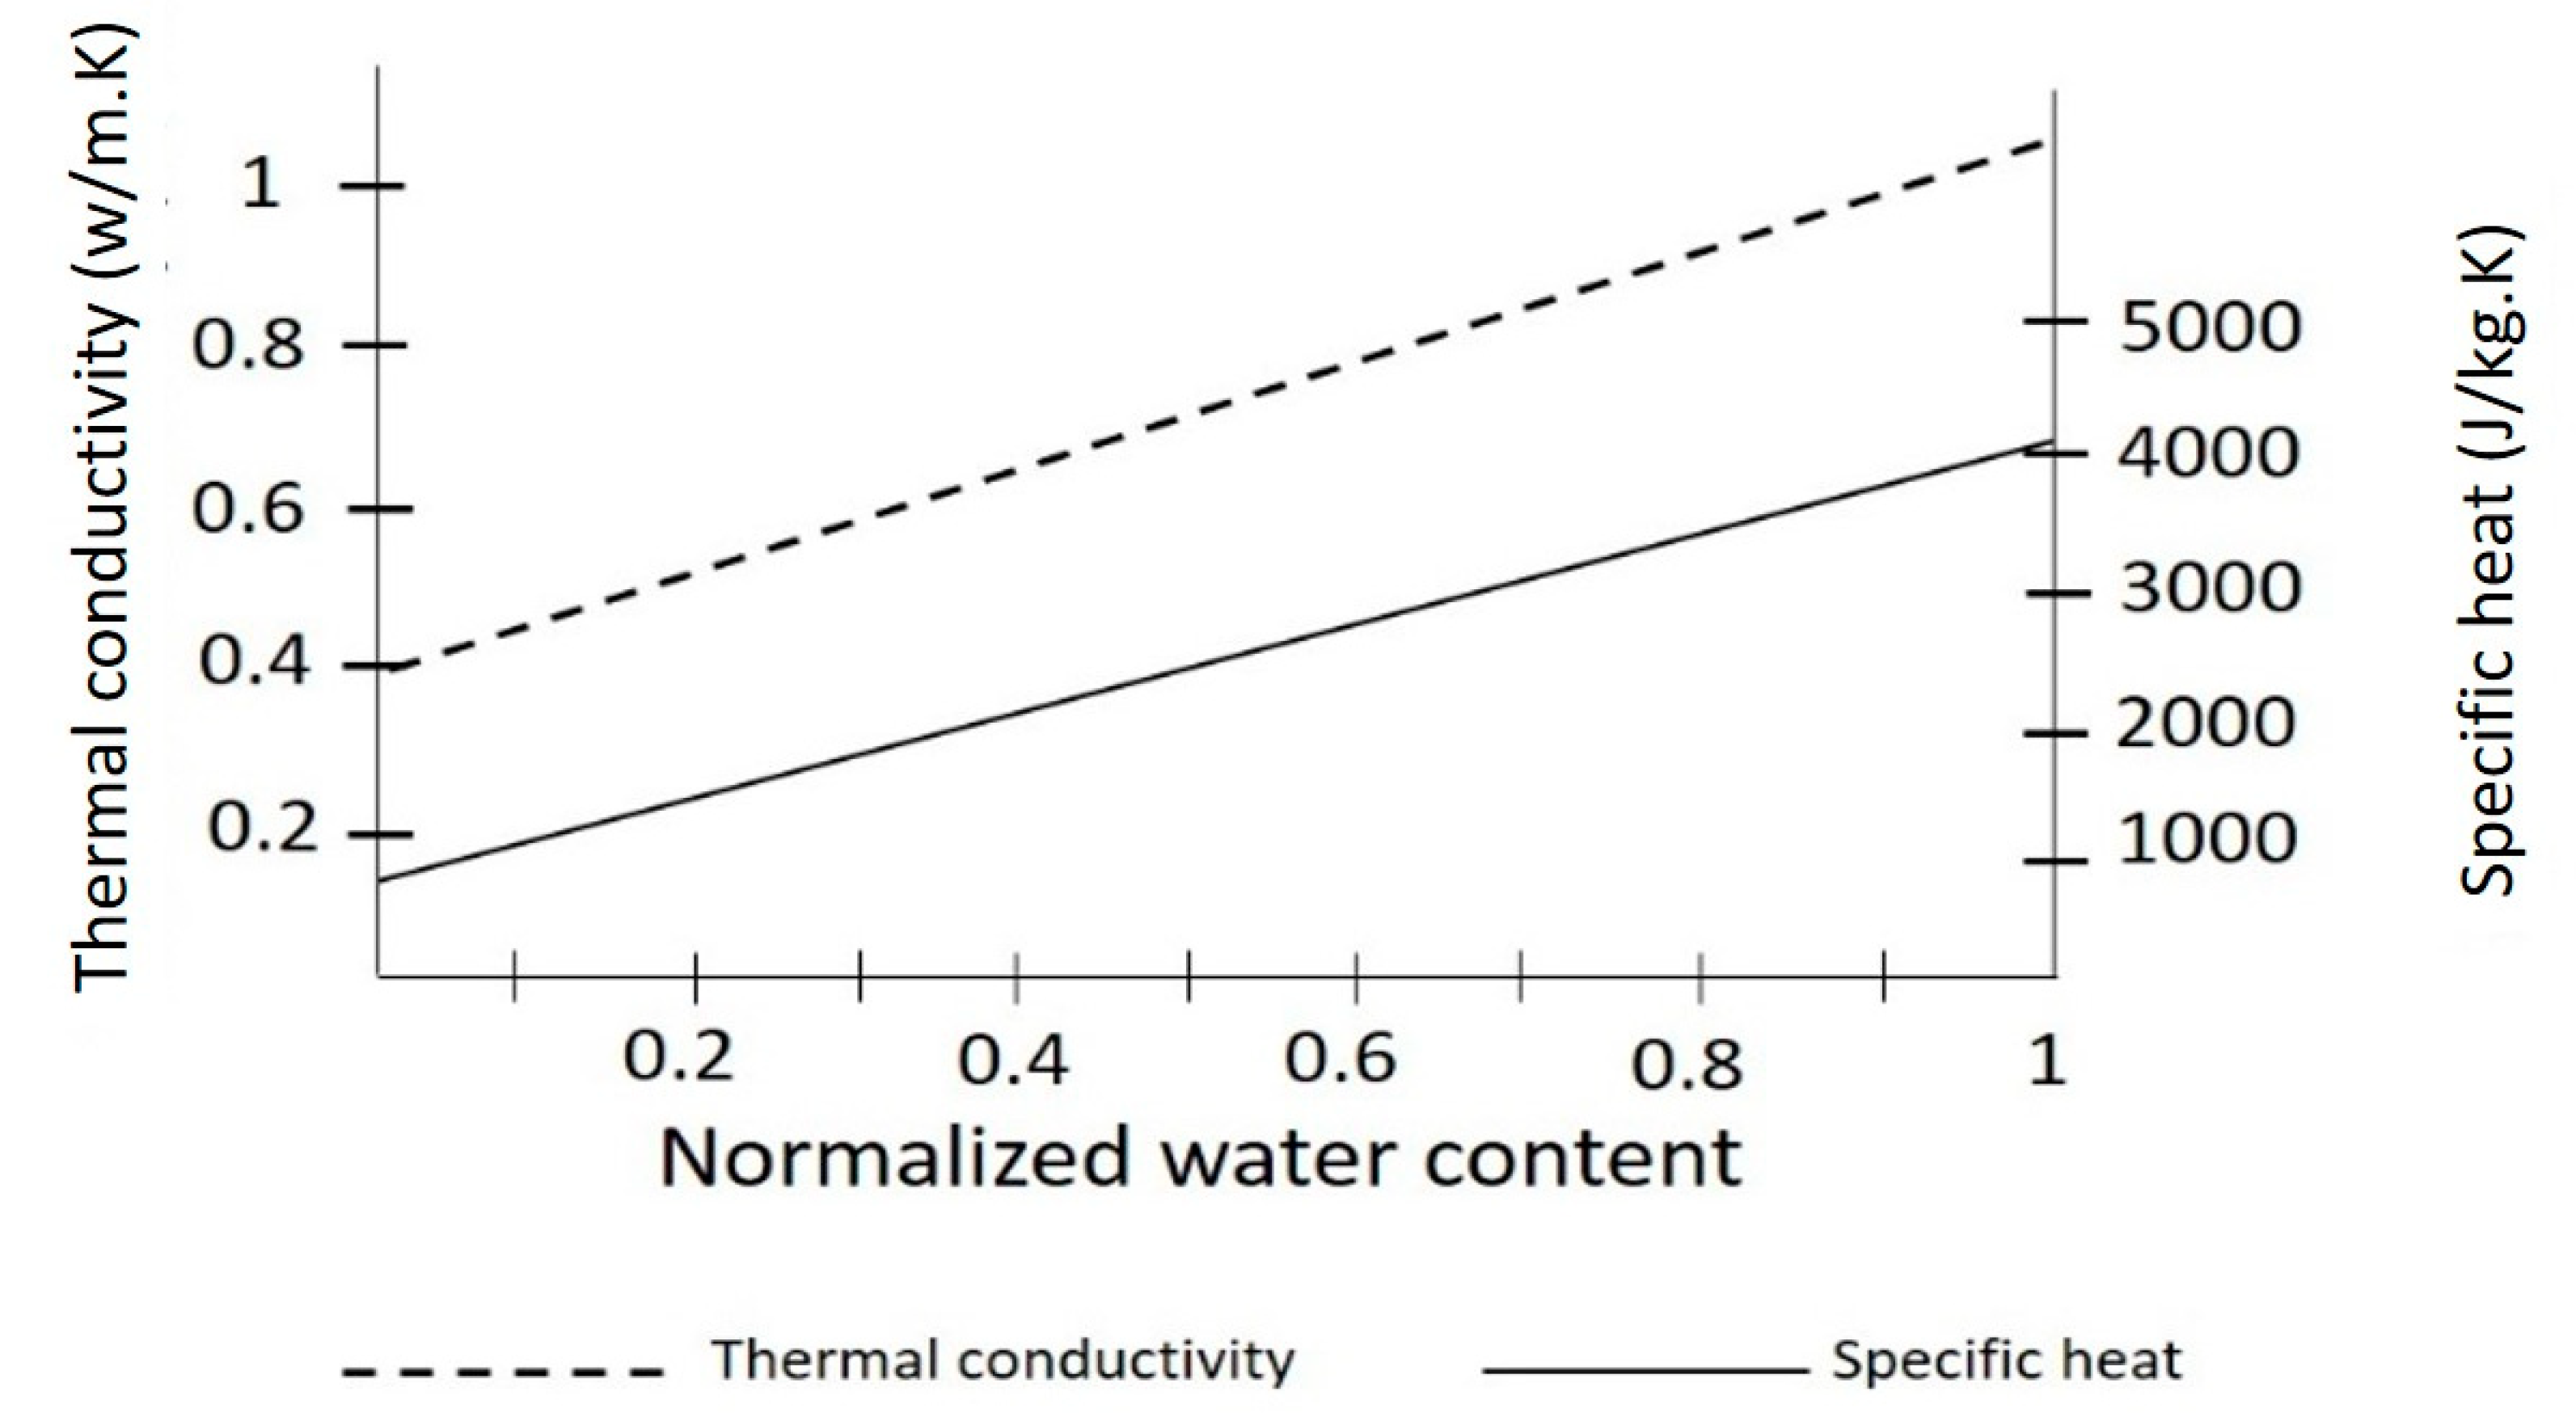
3.2. The Impact of Moisture on the Green Roof Performance
3.3. Rooftop Greenhouse Space Performance
3.4. The Possibility of the Nearly Zero Cooling Need Scenario
4. Conclusions
Author Contributions
Funding
Conflicts of Interest
Nomenclature
| Variables | Greek letters | ||
| A | Roof Surface [m2] | ε | Thermal emissivity [–] |
| F | Net heat flux [W·m−2] | ε1 | View factor |
| Is | Total incoming short wave radiation [W·m−2] | η | Efficiency |
| r | Solar reflectance | Density of air [kg·m−3] | |
| Iir | Total incoming longwave radiation [W·m−2] | Stefan-Boltzmann constant [W·m−2·K−4] | |
| H | Sensible heat flux [W·m−2] | partial derivatives | |
| L | Latent heat flux [W·m−2] | Fractional vegetation coverage | |
| k | Dry soil thermal conductivity [W·m−1·K−1] | vapour permeability | |
| T | Temperature [K] | Fictitious thermal conductivity | |
| t | Time [h] | gradient of a divergence | |
| Saturation pressure [Pa] | Subscripts | ||
| h | Enthalpy [J·m−3] | f | Foliage layer |
| LAI | Leaf Area index | g | Soil layer |
| FKD | Fest Körper Dränagen(Firm Body Drainage) | sat | Saturation |
| HVAC | heating, ventilation, and air conditioning | v | Relative to vapour |
References
- Asadi, E.; Gameiro, M.; Henggeler, C.; Dias, L.; Glicksman, L. Multi-objective optimization for building retrofit : A model using genetic algorithm and artificial neural network and an application. Energy Build. 2014, 81, 444–456. [Google Scholar] [CrossRef]
- Costanzo, V.; Evola, G.; Marletta, L. Energy savings in buildings or UHI mitigation? Comparison between green roofs and cool roofs. Energy Build. 2016, 114, 247–255. [Google Scholar] [CrossRef]
- World Energy Outlook—Topics—IEA. Available online: https://www.iea.org/topics/world-energy-outlook (accessed on 17 February 2020).
- Hasan, A. Optimizing insulation thickness for buildings using life cycle cost. Appl. Energy 1999, 63, 115–124. [Google Scholar] [CrossRef]
- Sisman, N.; Kahya, E.; Aras, N.; Aras, H. Determination of optimum insulation thicknesses of the external walls and roof (ceiling) for Turkey’s different degree-day regions. Energy Policy 2007, 35, 5151–5155. [Google Scholar] [CrossRef]
- Ouldboukhitine, S.E.; Belarbi, R.; Sailor, D.J. Experimental and numerical investigation of urban street canyons to evaluate the impact of green roof inside and outside buildings. Appl. Energy 2014, 114, 273–282. [Google Scholar] [CrossRef]
- Bowler, D.E.; Buyung-Ali, L.; Knight, T.M.; Pullin, A.S. Urban greening to cool towns and cities: A systematic review of the empirical evidence. Landsc. Urban Plan. 2010, 97, 147–155. [Google Scholar] [CrossRef]
- Lamnatou, C.; Chemisana, D. A critical analysis of factors affecting photovoltaic-green roof performance. Renew. Sustain. Energy Rev. 2015, 43, 264–280. [Google Scholar] [CrossRef]
- Chemisana, D.; Lamnatou, C. Photovoltaic-green roofs: An experimental evaluation of system performance. Appl. Energy 2014, 119, 246–256. [Google Scholar] [CrossRef]
- Palermo, S.A.; Turco, M.; Principato, F.; Piro, P. Hydrological Effectiveness of an Extensive Green Roof in Mediterranean Climate. Water 2019, 11, 1378. [Google Scholar] [CrossRef] [Green Version]
- Jungels, J.; Rakow, D.A.; Allred, S.B.; Skelly, S.M. Attitudes and aesthetic reactions toward green roofs in the Northeastern United States. Landsc. Urban Plan. 2013, 117, 13–21. [Google Scholar] [CrossRef]
- Cascone, S.; Coma, J.; Gagliano, A.; Pérez, G. The evapotranspiration process in green roofs: A review. Build. Environ. 2019, 147, 337–355. [Google Scholar] [CrossRef]
- Barrio, E.P. Del Analysis of the green roofs cooling potential in buildings. Energy Build. 1998, 27, 179–193. [Google Scholar] [CrossRef]
- Nocera, F.; Gagliano, A.; Detommaso, M.; Evola, G. Thermal Behavior of an Extensive Green Roof: Numerical Simulations and Experimental Investigations International journal of heat and technology a publication of iieta. Artic. Int. J. Heat Technol. 2016, 34, 226–234. [Google Scholar]
- Sailor, D.J. A green roof model for building energy simulation programs. Energy Build. 2008, 40, 1466–1478. [Google Scholar] [CrossRef]
- Silva, C.M.; Gomes, M.G.; Silva, M. Green roofs energy performance in Mediterranean climate. Energy Build. 2016, 116, 318–325. [Google Scholar] [CrossRef]
- Ferrante, P.; La Gennusa, M.; Peri, G.; Scaccianoce, G.; Sorrentino, G. Comparison between Conventional and Vegetated Roof by Means of a Dynamic Simulation. In Proceedings of the Energy Procedia; Elsevier Ltd.: Amsterdam, The Netherlands, 2015; Volume 78, pp. 2917–2922. [Google Scholar]
- Zeng, C.; Bai, X.; Sun, L.; Zhang, Y.; Yuan, Y. Optimal parameters of green roofs in representative cities of four climate zones in China: A simulation study. Energy Build. 2017, 150, 118–131. [Google Scholar] [CrossRef]
- Ávila-Hernández, A.; Simá, E.; Xamán, J.; Hernández-Pérez, I.; Téllez-Velázquez, E.; Chagolla-Aranda, M.A. Test box experiment and simulations of a green-roof: Thermal and energy performance of a residential building standard for Mexico. Energy Build. 2020, 209, 109709. [Google Scholar] [CrossRef]
- Huang, Y.; Chen, C.; Liu, W. Thermal performance of extensive green roofs in a subtropical metropolitan area. Energy Build. 2018, 159, 39–53. [Google Scholar] [CrossRef]
- Collins, S.; Kotze, D.J.; Lü, X.; Kuoppam, K. Thermal behavior of green roofs under Nordic winter conditions. Build. Environ. 2017, 122, 206–214. [Google Scholar] [CrossRef] [Green Version]
- Jaffal, I.; Ouldboukhitine, S. A comprehensive study of the impact of green roofs on building energy performance. Renew. Energy 2012, 43. [Google Scholar] [CrossRef]
- Congedo, P.M.; Baglivo, C.; Centonze, G. Walls comparative evaluation for the thermal performance improvement of low-rise residential buildings in warm Mediterranean climate. J. Build. Eng. 2020, 28, 101059. [Google Scholar] [CrossRef]
- Kalmár, F. Summer operative temperatures in free running existing buildings with high glazed ratio of the facades. J. Build. Eng. 2016, 6, 236–242. [Google Scholar] [CrossRef] [Green Version]
- Ascione, F.; Bianco, N.; De’ Rossi, F.; Turni, G.; Vanoli, G.P. Green roofs in European climates. Are effective solutions for the energy savings in air-conditioning? Appl. Energy 2013, 104, 845–859. [Google Scholar] [CrossRef]
- Gotham Greens: Brooklyn’s New High-Tech Rooftop Farm. Available online: https://www.fastcompany.com/1678197/gotham-greens-brooklyns-new-high-tech-rooftop-farm (accessed on 17 February 2020).
- The Vinegar Factory—Eli Zabar EliZabar.com. Available online: https://www.elizabar.com/The-Vinegar-Factory.aspx (accessed on 17 February 2020).
- Sky Vegetables. Available online: http://www.skyvegetables.com/ (accessed on 6 December 2019).
- NYC Rooftop Hydroponic Garden Classroom Urban Farm Greenhouse. Available online: https://www.urbangardensweb.com/2011/11/16/nyc-classroom-in-an-urban-rooftop-farm/ (accessed on 6 December 2019).
- Developer Raises the Bar in the Bronx|Architect Magazine. Available online: https://www.architectmagazine.com/technology/developer-raises-the-bar-in-the-bronx_o (accessed on 6 December 2019).
- Caplow, T.; Nelkin, J. Building-integrated greenhouse systems for low energy cooling. In Proceedings of the 2nd PALENC/28th AIVC Conference on Building Low Energy Cooling and Advanced Ventilation Technologies, Crete Island, Greece, 27–29 September 2007; Volume 1, pp. 172–176. [Google Scholar]
- Nadal, A.; Llorach-Massana, P.; Cuerva, E.; López-Capel, E.; Montero, J.I.; Josa, A.; Rieradevall, J.; Royapoor, M. Building-integrated rooftop greenhouses: An energy and environmental assessment in the mediterranean context. Appl. Energy 2017, 187, 338–351. [Google Scholar] [CrossRef] [Green Version]
- Nadal, A.; Rodríguez-Cadena, D.; Pons, O.; Cuerva, E.; Josa, A.; Rieradevall, J. Feasibility assessment of rooftop greenhouses in Latin America. The case study of a social neighborhood in Quito, Ecuador. Urban For. Urban Green. 2019, 44, 126389. [Google Scholar] [CrossRef]
- Astee, L.Y.; Kishnani, N.T. Building integrated agriculture utilising rooftops for sustainable food crop cultivation in Singapore. J. Green Build. 2010, 5, 105–113. [Google Scholar] [CrossRef]
- Benni, S.; Tassinari, P.; Barbaresi, A.; Torreggiani, D. Efficacy of greenhouse natural ventilation : Environmental monitoring and CFD simulations of a study case Efficacy of greenhouse natural ventilation : Environmental monitoring and CFD simulations of a study case. Energy Build. 2016, 7, 117–132. [Google Scholar]
- WUFI (en). Available online: https://wufi.de/en/ (accessed on 11 December 2019).
- Gholami, M.; Mofidi Shemirani, M.; Fayaz, R. A modelling methodology for a solar energy-efficient neighbourhood. Smart Sustain. Built Environ. 2018, 7, 117–132. [Google Scholar] [CrossRef]
- Bueno, B.; Norford, L.; Hidalgo, J.; Pigeon, G. The urban weather generator. J. Build. Perform. Simul. 2013, 6, 269–281. [Google Scholar] [CrossRef]
- Direct Data Access—Dexter System Hydro-Weather-Climate|Arpae. Available online: https://www.arpae.it/dettaglio_generale.asp?id=3284&idlivello=1625 (accessed on 17 February 2020).
- Kumar, R.; Kaushik, S.C. Performance evaluation of green roof and shading for thermal protection of buildings. Build. Environ. 2005, 40, 1505–1511. [Google Scholar] [CrossRef]
- Busser, T.; Berger, J.; Piot, A.; Pailha, M.; Woloszyn, M.; Experimental, M.W. Experimental Validation of Hygrothermal Models for Building Materials and Walls: An Analysis of Recent Trends; HAL: Lyon, France, 2018. [Google Scholar]
- Frankenstein, S.; Koenig, G.G. Fast All-Season Soil STrength (FASST); US Army Corps of Engineers: Washington, DC, USA, 2004.
- EnergyPlus Documentation Engineering Reference. Available online: https://energyplus.net/sites/default/files/pdfs_v8.3.0/EngineeringReference.pdf (accessed on 19 April 2020).
- Corrado, V.; Ballarini, I.; Corgnati, S.P. Typology Approach for Building Stock National Scientific Report on the TABULA activities in Italy; Politecnico di Torino–Dipartimento Energia: Torino, Italy, 2012; ISBN 9788882020392. [Google Scholar]
- Hirano, Y.; Ihara, T.; Gomi, K.; Fujita, T. Simulation-based evaluation of the effect of Green Roofs in Office Building Districts on Mitigating the Urban Heat Island effect and reducing CO2 emissions. Sustainability 2019, 11, 2055. [Google Scholar] [CrossRef] [Green Version]
- Barbaresi, A.; Dallacasa, F.; Torreggiani, D.; Tassinari, P. Retrofit interventions in non-conditioned rooms: Calibration of an assessment method on a farm winery. J. Build. Perform. Simul. 2017, 10, 91–104. [Google Scholar] [CrossRef]
- Barbaresi, A.; Torreggiani, D.; Benni, S.; Tassinari, P. Underground cellar thermal simulation: Definition of a method for modelling performance assessment based on experimental calibration. Energy Build. 2014, 76, 363–372. [Google Scholar] [CrossRef]


| Hygrothermal Parameters | Sedum Planting | Substrate | Protection Mat |
|---|---|---|---|
| Bulk density kg/m3 | 1500 | 405 | 83 |
| Porosity | 0.5 | 0.82 | 0.95 |
| Specific heat capacity J/kg K | 1000 | 1000 | 840 |
| Thermal conductivity, dry, 10 c/50F W/m K | 0.2 | 0.4 | 0.035 |
| Water vapor diffusion resistance factor | 5 | 3 | 1 |
| Typical built-in moisture kg/m3 | 1 | 4.2 | 0.7 |
| Reference water content kg/m3 | 12 | - | - |
| Free water saturation | 300 | - | - |
| Temperature-Dependent thermal conductivity supplement W/m K | 2 · 10−4 | 2 · 10−4 | 2 · 10−4 |
| Thickness(m) | 0.01 | 0.1 | 0.02 |
| Element | Thickness (m) | U-Value(W/m2 K) |
|---|---|---|
| Wall | 0.265 | 0.512 |
| Ceiling | 0.41 | 0.970 |
| Roof | 0.30 | 0.523 |
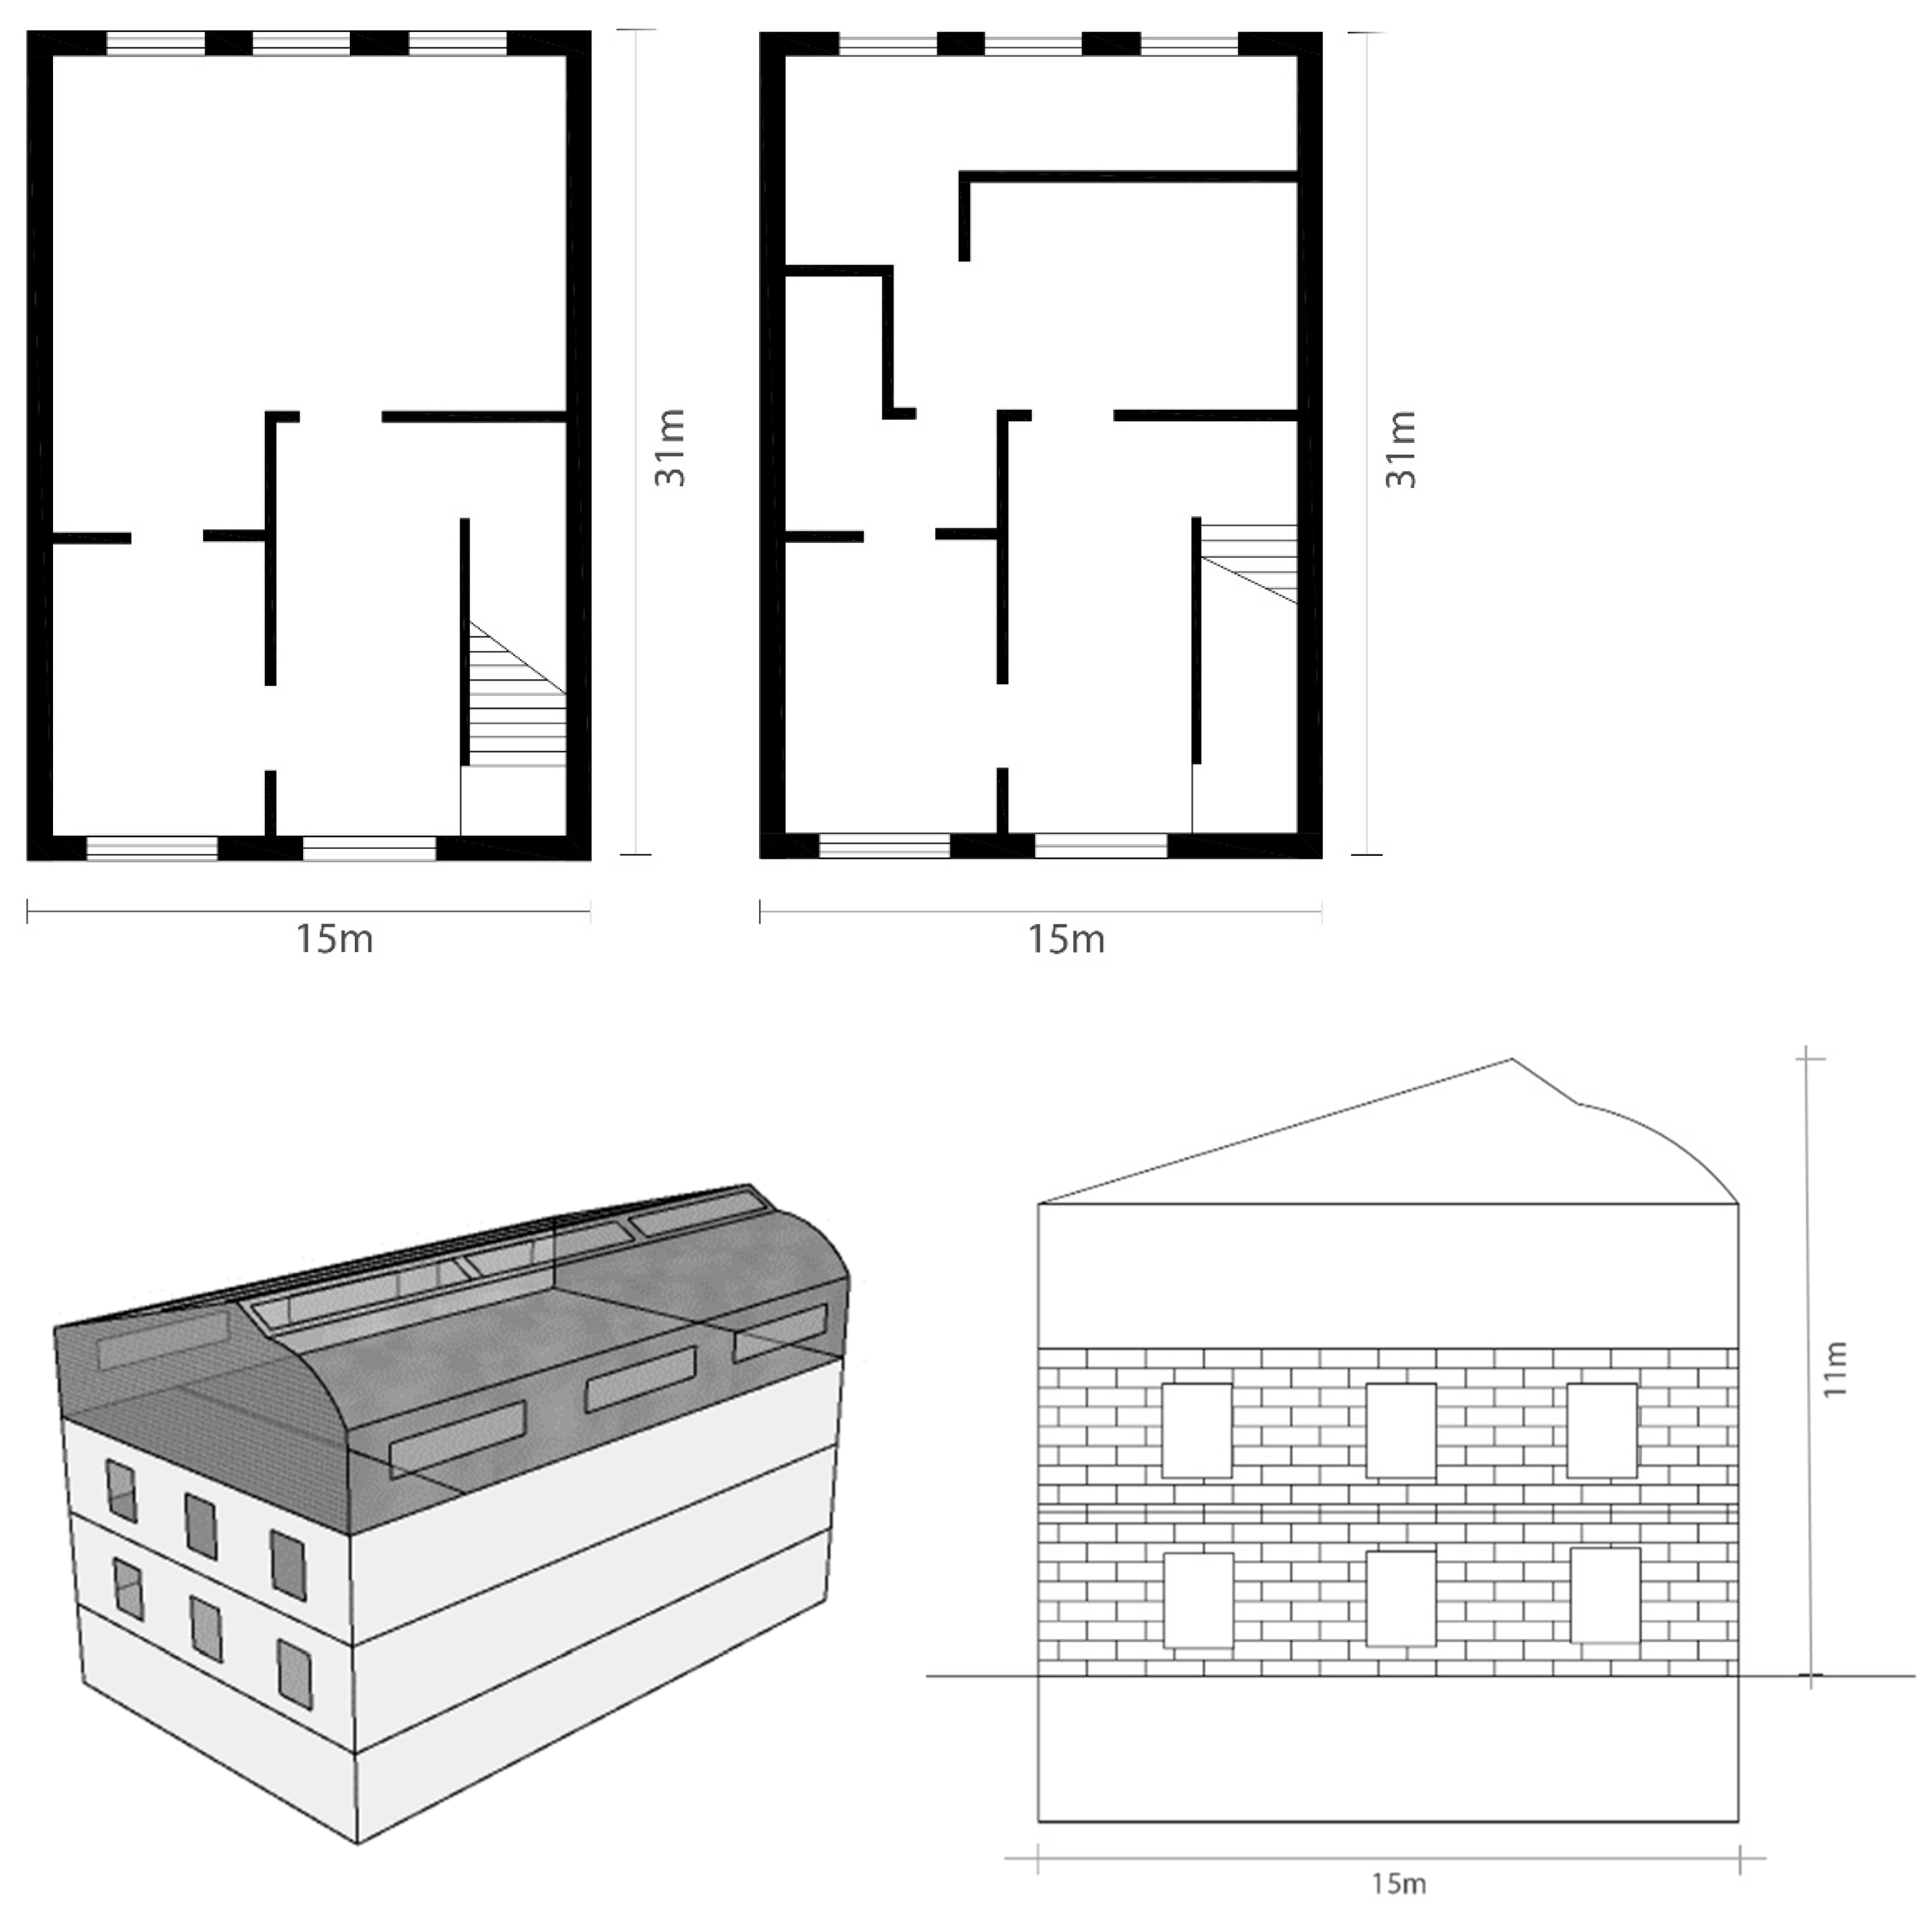
| Parameter | Value |
|---|---|
| Gross volume | 1060 m3 |
| Total external surface | 302 m2 |
| Glazed surface | 302 m2 |
| Roof surface | 240 m2 |
| Roof surface/total external surface | 0.79 |
| Month | Temperature of Interior Air in the Rooftop Greenhouse (°C) | Temperature of Exterior Air (°C) | ||||
|---|---|---|---|---|---|---|
| Mean | Max | Min | Mean | Max | Min | |
| Jan | 3.22 | 15.67 | −2.15 | 1.12 | 10.46 | −12.98 |
| Feb | 5.62 | 18.14 | −1.48 | 3.32 | 15.49 | −5.90 |
| March | 10.81 | 23.48 | −0.80 | 8.12 | 20.69 | −1.16 |
| April | 14.96 | 27.00 | 3.98 | 12.72 | 23.16 | 3.00 |
| May | 19.31 | 30.86 | 6.67 | 17.49 | 27.19 | 6.49 |
| Jun | 23.40 | 35.83 | 13.37 | 21.39 | 32.99 | 12.20 |
| July | 25.94 | 36.37 | 13.39 | 24.91 | 34.80 | 12.03 |
| Aug | 25.27 | 35.01 | 11.98 | 23.57 | 34.80 | 11.01 |
| Sept | 20.88 | 32.04 | 9.07 | 19.70 | 30.20 | 8.11 |
| Oct | 15.32 | 25.23 | 6.87 | 13.71 | 23.96 | 4.43 |
| Nov | 10.46 | 19.01 | −0.70 | 7.22 | 18.59 | −1.70 |
| Dec | 6.88 | 13.83 | −3.48 | 2.64 | 14.09 | −5.16 |
© 2020 by the authors. Licensee MDPI, Basel, Switzerland. This article is an open access article distributed under the terms and conditions of the Creative Commons Attribution (CC BY) license (http://creativecommons.org/licenses/by/4.0/).
Share and Cite
Gholami, M.; Barbaresi, A.; Tassinari, P.; Bovo, M.; Torreggiani, D. A Comparison of Energy and Thermal Performance of Rooftop Greenhouses and Green Roofs in Mediterranean Climate: A Hygrothermal Assessment in WUFI. Energies 2020, 13, 2030. https://doi.org/10.3390/en13082030
Gholami M, Barbaresi A, Tassinari P, Bovo M, Torreggiani D. A Comparison of Energy and Thermal Performance of Rooftop Greenhouses and Green Roofs in Mediterranean Climate: A Hygrothermal Assessment in WUFI. Energies. 2020; 13(8):2030. https://doi.org/10.3390/en13082030
Chicago/Turabian StyleGholami, Mansoureh, Alberto Barbaresi, Patrizia Tassinari, Marco Bovo, and Daniele Torreggiani. 2020. "A Comparison of Energy and Thermal Performance of Rooftop Greenhouses and Green Roofs in Mediterranean Climate: A Hygrothermal Assessment in WUFI" Energies 13, no. 8: 2030. https://doi.org/10.3390/en13082030