Article

Co-Gasification of Treated Solid Recovered Fuel Residue by Using Minerals Bed and Biomass Waste Blends

1
Department of Environmental Engineering, Yonsei University, Wonju, Gangwon-do 26493, Korea
2
Department of Chemical Engineering, Monash University, Clayton, VIC 3800, Australia
*
Author to whom correspondence should be addressed.
Energies 2020, 13(8), 2081; https://doi.org/10.3390/en13082081
Submission received: 27 March 2020 / Revised: 16 April 2020 / Accepted: 17 April 2020 / Published: 21 April 2020
(This article belongs to the Section A4: Bio-Energy)

Abstract

:
Solid recovered fuel (SRF) residue, which is leftovers from the SRF manufacturing process, usually is discarded in landfill because of its low heating value and high ash and moisture content. However, it could be used as a fuel after mechanical and biological treatment. Gasification experiments were conducted on treated SRF residue (TSRFR) to assess the viability of syngas production. Efforts were also made to improve the gasification performance by adding low-cost natural minerals such as dolomite and lime as bed material, and by blending with biomass waste. In the case of additive mineral tests, dolomite showed better performance compared to lime, and in the case of biomass blends, a 25 wt% pine sawdust blend with TSRFR showed the best performance. Finally, as an appropriate condition, a combined experiment was conducted at an equivalence ratio (ER) of 0.2 using a 25 wt% pine sawdust blend with TSRFR as a feedstock and dolomite as the bed material. The highest dry gas yield (1.81 Nm3/kg), with the highest amount of syngas (56.72 vol%) and highest lower heating value (9.55 MJ/Nm3) was obtained in this condition. Furthermore, the highest cold gas efficiency (48.64%) and carbon conversion rate (98.87%), and the lowest residue yield (11.56%), tar (0.95 g/Nm3), and gas pollutants content was observed.

Graphical Abstract

1. Introduction

Energy plays a vital role in our modern life. An accessible and secured supply of energy has become imperative for the sustainable growth of society [1]. To meet its energy demand, the world is heavily dependent on fossil fuel at present [2]. Representatives of fossil fuels like oil, gas, and coal are currently meeting nearly 80% of the world’s energy demand [3]. The reckless use of fossil fuels has evoked many problems in the world, such as global warming, fossil fuel reserve depletion, and other environmental concerns [4]. Thus, to lessen the reliance on fossil fuels, to assure the pathway of energy production, and to branch out the use of new and renewable fuels, energy production from waste is inevitable [5].
Because of the improved lifestyle and urbanization, the quantity of municipal solid waste (MSW) is increasing all over the globe [6]. A recent report from the World Bank shows that around 2.2 billion tons of MSW will be generated by the year 2025, which is almost twice the amount produced in 2010 [7]. In the case of South Korea, the total waste generation has steadily increased by about a factor of five over the last 30 years, from 77,000 tons/day to 375,000 tons/day [8]. Currently, South Korea is generating 48,934 tons of MSW per day [8]. Usually, this MSW carries an incredible amount of materials like plastic, paper, wood, metals, and glass which can be recycled easily and effectively by doing energy recovery [9].
Gasification of MSW is a productive way of generating heat and power. In addition, it is a propitious route to produce fruitful end products using various synthesis routes [10]. In the past decades, gasification of biomass and waste has been comprehensively studied by many researchers [11,12,13], whereas, in the present day, gasification of solid recovered fuel (SRF), an alternative fuel produced from the combustibles in MSW, is one of the key topics in waste gasification [1,14,15,16].
In South Korea, during the SRF manufacturing process, there is a significant amount of residue generated which approaches 40 wt% of input waste, and the disposal cost occupies 20% of the annual operating cost in a few manufacturing facilities [17]. The SRF residue produced as leftovers during the SRF manufacturing process is usually discarded in landfill because of its high ash content (>20 wt%) and high moisture content (>10 wt%) but low energy content (<3500 kcal/kg). However, the South Korean government has set a goal to reach 3% landfill for overall waste and zero landfill for recyclable waste by the year 2020 [8]. In addition, by the year 2050, the South Korean government aimed to expand the share of renewable and new energy to 20% [18]. Thus, to support the South Korean government’s vision, in this study, an effort was made to recover energy from SRF residue via the gasification process. However, before applying the gasification process, to improve the quality of SRF residue it was treated by applying mechanical biological treatment (MBT). After the MBT process, the product that we obtained was called treated-SRF residue (TSRFR), which showed a calorific value as high as SRF. Later, attempts were taken to assess the viability of syngas production from TSRFR. Additionally, efforts were made to improve the gasification performance.
Several researchers reported that biomass blends with SRF could be advantageous to improve gasification performance as it dilutes some unfavorable characteristics (like high ash content) [19,20,21]. In addition, it increases the heating value of the product gas and enhances the conversion rate of energy. Again, many researchers reported that low-cost minerals like dolomite and lime help to destruct hydrocarbons by executing some catalytic upshot and influencing the steam reforming reaction, cracking reaction and CO2 reforming reactions [21,22,23]. Considering the above-mentioned facts, to improve the gasification performance of TSRFR, minerals, and biomass waste blends were used in this study. The main objectives of this study are: (i) To analyze the viability of syngas production from TSRFR, (ii) to analyze the consequence of natural minerals on TSRFR gasification, (iii) to analyze the effect of TSRFR and biomass waste blends combined gasification on the gas quality and yield, and finally, (iv) to select the most viable option for gasification.

2. Materials and Methods

2.1. Feedstock Preparation

The feedstock used in this experiment was TSRFR, which was obtained after treating SRF residue by the MBT process. The treatment of SRF residue was required because it had a very high moisture content (39.91 wt%), high ash content (14.27 wt%), and low HHV (9.45 MJ/kg). But, according to Korean SRF and bio-SRF regulation standard, energy could not be recovered from any feedstock whose moisture content is >10 wt%, ash content is >20 wt%, and HHV is <3500 kcal/kg (14.65 MJ/kg) [24]. Thus, in this study SRF residue was treated with the MBT process which is a combination of mechanical and biological treatment.
The biological treatment process in MBT can be classified as aerobic and anaerobic processes. Whereas aerobic process can be further classified as composting and bio-drying. It has differences of purpose and method, even though it has the similarity of growth of aerobic microorganisms. The composting process takes a long residence time, 6–12 weeks to produce the usable compost for stabilization and reformation of the soil. On the other hand, the bio-drying process takes a relatively short time 7–14 days to produce high quality SRF and minimize the amount of landfill. In this study, bio-drying technology was used as a part of biological treatment. Bio-drying is the process that is used to remove the moisture content using heat generated in the biological decomposition reaction of organic materials within waste by aerobic microorganisms. It uses the decomposition treat of microorganisms, unlike the existing drying mechanism required for an external heat source such as hot-air drying. The drying mechanism of the decomposition reaction of microorganisms absorbing the moisture of the waste surface, then being vaporized to the upper space of the waste. At this time, moisture is removed by discharging emission gas like evaporated seam by blowing. Sometimes, it is also emitted as leachate, condensing by temperature variation in emitted gas or the outlet. In this study, the test was conducted using a 10 ton/day capacity bio-drying facility. During the test, an automated control system controlled the airflow changes by switching the air supply direction (upwards or downwards), the process temperature ranged between 40–45 °C and residence time was 9 days.
In the case of mechanical treatment, blow type separator and high-grade combustible equipment were used instead of existing technologies like particle size and wind force separation. This equipment improves the quality of SRF residue, as it focuses on separating the foreign substances and incombustible material.
The most common tree species that are found in South Korea is pine, and it is mainly used for making furniture [25]. During the furniture making process from the pinewood, an enormous amount of sawdust is generated, which is considered as waste and discarded in the landfill. Thus, in this study, an attempt was made to utilize this pine sawdust waste as a representative of biomass feedstock. The particle size of the pine sawdust waste used in this study was 1–2 mm, and it was dried in an oven for 24 h at 105 °C before the experiment.

2.2. Properties of Feedstocks

The feedstock used in this study was TSRFR and pine sawdust. TSRFR was obtained after treating the SRF residue produced in the SRF manufactory. The size of the TSRFR feedstock ranged from 15–45 mm. The pine sawdust was obtained from a sawmill which deals with pine wood. The size of pine sawdust ranged from 1–2 mm. To analyze the physicochemical characteristics of the feedstock used in the experiment, elemental analysis, proximate analysis and higher heating value (HHV) analysis were conducted. The elemental analyzer (EA 1110, CE Instrument, Wigan, Greater Manchester, England; EA 1112, Thermo Fisher Scientific, Waltham, MA, USA) was used to perform elemental analysis and it was done in accordance with ASTM D 5373. Based on the ASTM D 3172 method and by using a TGA (LECO, TGA-701, St. Joseph, MI, USA), proximate analysis was done. HHV analysis was done in accordance with ASTM D 4809 using a calorimeter (LECO, AC-600, St. Joseph, MI, USA). Table 1 exemplifies the results of elemental, proximate, and HHV analysis of TSRFR and pine sawdust. Results of the elemental analysis showed that both feedstocks are rich in carbon and oxygen content (as the elemental ratio of these components are much higher compared to other elements), but low in nitrogen and hydrogen content. However, no trace of sulfur and chlorine was detected in both feedstocks. The elemental composition of pine sawdust showed similar characteristics when compared with the results in other articles [26,27]. In the case of TSRFR, it shows an agreement with element composition of RDF reported by Kathirvale et al. [28] and Cozzani et al. [29]. Results of the proximate analysis of TSRFR showed relatively higher moisture content than pine sawdust. Both of the feedstocks showed a high amount of volatile matter. In the case of fixed carbon, pine sawdust showed relatively higher fixed carbon content than TSRFR. Regarding ash content, TSRFR showed a high amount of ash content whereas pine sawdust showed a very low amount of ash content. Besides, both of the feedstocks showed good heating values in comparison to the typical heating value of woody biomass (18–21 MJ/kg) and SRF (17–22 MJ/kg) feedstocks. However, TSRFR showed a relatively higher HHV than pine sawdust.
Thermogravimetric (TG) analysis was conducted using a thermogravimetric analyzer (Leco, TGA-701, St. Joseph, MI, USA) in accordance with ASTM E 1131 method. The thermal combustion of each sample was measured under oxidative conditions, the heating rate was 10 °C/min and the samples were heated up to 950 °C. After each sample was loaded, oxygen gas was supplied as the carrier gas to form the oxidation condition. In addition, the derivative thermo-gravimetry (DTG) curve was drawn to explain the reaction temperature of the sample more accurately. Figure 1 shows TG and DTG curves of TSRFR and pine sawdust feedstocks at oxidation condition. TG curves depict that a sharp weight loss takes place between 250 ℃ and 350 ℃ in the case of pine sawdust feedstock, whereas for TSRFR a sharp weight loss takes place between 250–500 ℃. In the case of DTG curve, pine sawdust at the temperatures between 250 ℃ and 350 ℃ show a sharp peak which depicts that main reactions take place at this temperature zone. In the case of TSRFR, two sharp peaks were found, one ranged between 250 ℃ and 350 ℃, another one from 350–500 ℃. A small peak has been found near 100 °C for both feedstocks, although the peak of TSRFR is relatively sharper than pine sawdust. This phenomenon can be explained by their moisture content, as TSRFR had higher moisture content compared to sawdust, so it shows higher weight loss around 100 °C. At 950 °C, the lowest amount of residue yielded for both of the feedstocks, which means most reactions took place at this temperature. Thus, 950 °C was selected as the operating temperature in this study. To verify these TG and DTG results, a comparison was also made with previous studies on similar feedstocks. Yoo and Choi [25] have done a comprehensive study on pine sawdust and reported a similar trend in TG and DTG curve based on their experimental results. In the case of TSRFR, its TG and DTG trends also showed an agreement with the TG and DTG curves reported by Cozzani et al. [29] based on their experiments on RDF.

2.3. Experimental Method

Figure 2 illustrates the schematic diagram of the lab-scale fixed-bed gasification unit used in this study. The capacity of the gasifier was 1 kg/h, and its diameter and height were 70 and 300 mm, respectively. This gasification unit can be classified into three main segments namely, main control unit, main gasification unit, and air pollution control unit. The airflow rate and temperature of gasifier were controlled through the main control unit. From the feeder, the feedstock was manually fed into the gasifier (semi-batch type). The feeding pipe was installed 150 mm from the furnace bottom to make a sufficient residence time. For controlling gas pollutants and particles, instruments like the scrubber, cyclone, and fabric filter were used as a part of the air pollution control unit in this study. At the end of the gas outlet, a gas analyzer was placed to analyze the product gas characteristics. Three types of residue namely bottom ash containing fixed carbon, fly ash, and tar which generates during gasification can be collected in this system. The bottom ash was recovered at the bottom of the reactor, fly ash was collected in the residue box, and tar was collected after fabric filter.
The gasification experiments were conducted at various equivalence ratios (ERs) using air as a gasification agent. Experimental conditions of gasification experiments such as ER, reaction temperature, particle size, bed material are shown in Table 2. Product gas composition was examined using micro gas chromatography (Micro-GC 3000A; Agilent) at two-minute intervals, and obtained results were averaged after maintaining temperature consistency in the five thermocouples. For all experimental conditions, gasification performance measuring parameters such as lower heating value (LHV), dry gas yield (Gy), cold gas efficiency (CGE), carbon conversion rate (Cc), and residue yield (Ry) were calculated using the data processing equations given below [30].
LHV   ( kcal / Nm 3 ) = { ( CO × 30.35 ) + ( H 2 × 24.70 ) + ( CH 4 × 85.70 ) + ( C 2 H 6 × 153.80 ) + ( C 3 H 8 × 223.50 ) }
where CO, H2, CH4, C2H6, and C3H8 represent the molar per centum of the elements of the product gas.
Gy   ( Nm 3 / kg ) = { Product   gas   flow   rate   ( Nm 3 / h )   ÷ Input   feedstock   mass   rate   ( kg / h ) }
Cc   ( % ) = [ { 12 × Gy × ( CO + CO 2 + CH 4 ) + ( 2 × C 2 H 6 ) + ( 3 × C 3 H 8 × 100 ) }   ÷   ( 22.4 × C ) ]
where C denotes the mass per centum of carbon in the feedstock from elemental analysis and rest of the symbols represents the molar per centum of the components of the product gas.
CGE   ( % ) = { LHV   of   Product   gas   ( kcal / kg )   ÷   LHV   of   feedstock   ( kcal / kg ) × 100 }
Ry   ( % ) = { Product   residue   mass   rate   ( kg / h )   ÷ Input   feedstock   mass   rate   ( kg / h ) }

2.4. Tar and Gas Pollutants Sampling Methods

Tar content in the product gas, sampled through the cooling process, predominantly consists of aromatics. It has been reported by Son et al. [31] that light tar can be quantified by using an immensely absorbable organic gas sampler. Son et al. [31] also reported a tar measuring method using activated carbon bed that offers absorption of aromatics such as xylene, benzene, and chlorobenzene to a great extent. In this study, we followed that method and used an activated carbon bed for quantitative analysis of tar. The activated carbon used in this experiment had a Brunauer–Emmett–Teller (BET) surface area of 614.1 m2/g and pore volume of 0.30705 cm3/g. The sampling process was as follows: an activated carbon bed was installed after the fabric filter and before the dry gas meter in such a way that all the produced syngas passes through the bed. The weight of activated carbon was measured before placing it on the bed. After completing the experiment, it was taken out of the bed and weighed again. Tar concentration was determined using the below equation.
Tar concentration (g/Nm3) = {(Mass of activated carbon before the experiment − Mass of activated carbon after the experiment) ÷ Total gas flow}
In this study, gas pollutants were measured in accordance with the Korean standard method for air pollution measurement titled measurement of inorganic materials in emission gases [30]. This method traps pollutants in suitable cold organic solvents or adsorbents. The sampling unit consists of three impinger bottles of which two were filled with adsorbent (each bottle was filled with 50 mL solvent) and the third one was filled with silica gel. In this study, we tried to measure the amount of NH3 and HCN. Pollutants such as H2S or HCl were not measured, as no presence of chlorine or sulphur were found in the elemental analysis. In the case of NH3, 10% H2O2 was used as an adsorbent, whereas 0.5 mol/L NaOH was used as an adsorbent for HCN. Using a pump, the product gas was sent through the gas pollutant sampling unit. The gas flow was controlled using a flow meter attached to the pump. The gas flow rate was 2 L/min for NH3 and 1 L/min for HCN and the sampling time was 10 min for both cases.

3. Results and Discussion

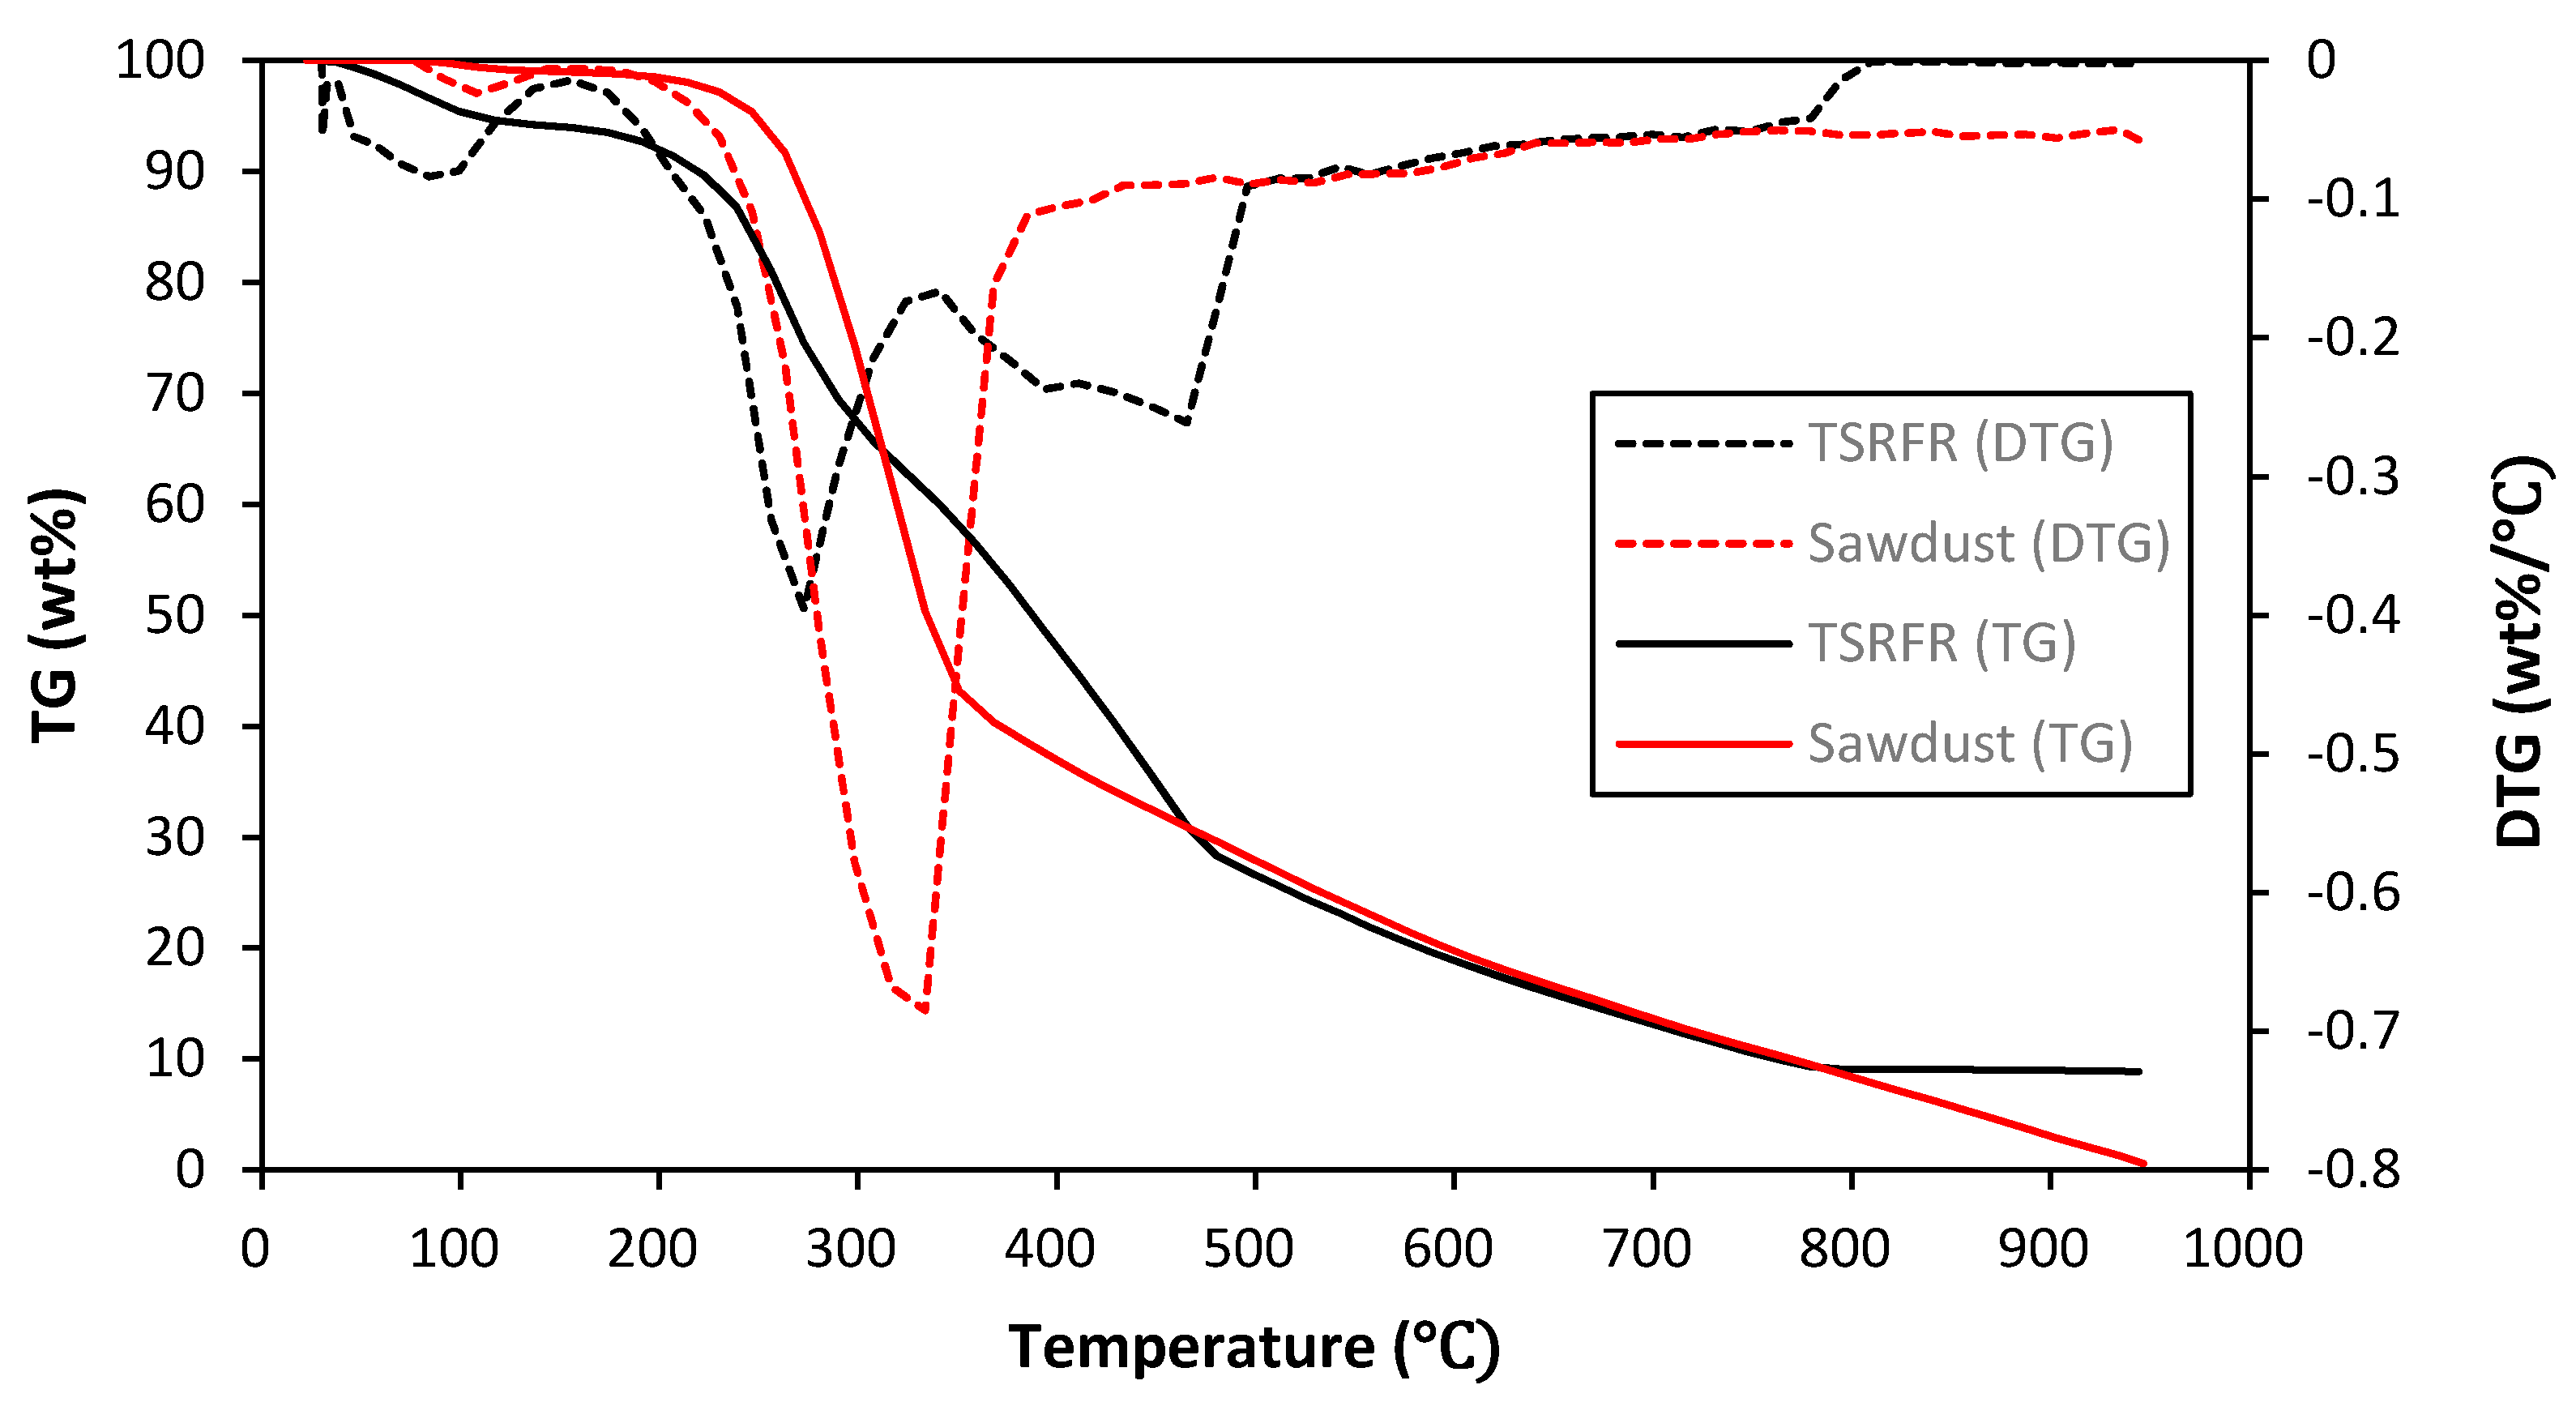
3.1. TSRFR Gasification

Figure 3 exemplifies the product gas composition with increasing ERs. The main components of product gas were H2, CO, CO2, and CH4; C2H6 and C3H8 were also present in small amount. With increasing ER value, product gas components like H2, CO, and CH4 showed a decreasing trend whereas CO2 showed increasing trend, and the trends of C2H6 and C3H8 were not clear. The gradual increase of CO2 with increasing ER resembles the prevalence of oxidation reaction (C + O2 → CO2), whereas the gradual decrease of CO with increasing ER shows the deficiency of water-gas reaction (C + H2O → 2CO + H2) or the reverse Boudouard reaction (C + CO2 → 2CO) [32]. As the formation CO2 was better than CO with increasing ER, it can be assumed that CO2 and CO formation is relative to the atmosphere. Increasing ER results in decreased H2 and CO, which favored the reverse methanation reaction (CO + 3H2 → CH4 + H2O). Therefore, it can be concluded that increasing of ER decreases the H2, CO, and CH4 concentrations. The LHV of product gas was calculated based on the gaseous concentration using Equation (1), and it ranged from 6.72–8.62 MJ/Nm3. With increasing ER, LHV showed a decreasing trend, and the highest LHV (8.62 MJ/Nm3) was obtained at ER 0.2. Gy rate was 1.75 Nm3/kg, 1.84 Nm3/kg, and 1.98 Nm3/kg at ER 0.2, 0.3, and 0.4 respectively, and was calculated using Equation (2). With a more oxidizing condition (i.e. with increasing ER), Gy showed an increasing trend, and this happened because of the higher oxidation of char and excessive release of volatiles at elevated temperatures [33].
Figure 4a shows CGE, Cc, and Ry with ER for TSRFR gasification. CGE, which is a major criterion of measuring gasification performance, was determined by combustible gaseous compositions and Gy [34]. In this case, CGE ranged from 33.47–42.92%, and with increasing ER, CGE showed a gradually decreasing trend. Highest CGE (42.92%) was obtained at ER 0.2. Cc was calculated by using Equation (3) and it ranged from 76.12–80.91%. Highest Cc took place at ER 0.3 and it was 80.91%. Ry was calculated by using Equation (5) and it ranged between 17.33–23%. With increasing ER, Ry showed a decreasing trend. At higher ER, more oxidation reaction takes place [35], more oxidation means less residue yield and that is why we obtained this kind of trend.
In order to obtain low tar concentration in the product gas and to achieve higher Cc, a high operating temperature is preferred [36]. Several researchers reported that at high temperatures (above 850 °C), thermal cracking of aromatic hydrocarbons takes place inside the gasifier [37,38,39]. In this study, our operating temperature was very high (950 °C), so it was expected that the tar concentration in the product gas will be lower. Figure 4b illustrates the tar concentration with ER. Results of our experiments showed an agreement with our assumption. The tar concentration in the product gas was very low. It ranged from 1.12–1.22 g/Nm3. No clear trend had been observed with an increasing ER value. No significant difference was found in the tar concentration. Because of the presence of N2 in the feedstock gas, pollutants such as NH3 and HCN were also formed during gasification. According to the Korean emission standard, the allowable limit for NH3 is less than 100 ppm, and for HCN, less than 10 ppm [40]. In this study, the concentration of NH3 and HCN pollutants were far less in comparison to the standard set by the Korean government. Figure 4b shows no specific trend between the concentration of gas pollutants and ER. The concentration of NH3 was higher than that of HCN. Author Ohtsuka and Wu [41] and Zhou et al. [42] also reported a higher yield of NH3 comparing to HCN during gasification. Tian et al. [43] stated that during gasification, NH3 is formed either by the thermal cracking of volatile N in the gas phase or by the hydrogenation of char-N by H radicals, and HCN is formed by the thermal cracking of unstable N-containing structure existing in the char. Thus, we can conclude that in this experiment, either thermal cracking of volatile N in the gas phase or hydrogenation of char-N by H radicals was dominant.

3.2. TSRFR Gasification Using Low-Cost Minerals as Bed Material

From our previous experiments, ER 0.2 was found as the most suitable condition to gasify the TSRFR feedstock. In this case, efforts were made to enhance the gasification performance further by using low-cost natural minerals such as calcined dolomite (MgO.CaO) and lime (CaCO3) as bed materials. The BET surface area of dolomite was 4.6409 m2/g and pore volume were 0.015864 cm3/g, whereas the BET surface area of lime was 0.2284 m2/g and pore volume were 0.005949 cm3/g. In both cases, 500 g of minerals was added with 1000 g silica sand.
Figure 5 exemplifies the gas composition and LHV of TSRFR product gas after using minerals as bed materials. It also shows a comparison with previous experimental results without using minerals. Like previous experimental results, the main components of product gas were H2, CO, CO2, and CH4, while gases like C2H6 and C3H8 were also present in small amounts. For both cases, after using minerals, a number of gas components such as CO, CH4, and CO2 increased. Which means both of the minerals showed some catalytic effect that favored the forward methanation reaction (CO+ 3H2 → CH4+ H2O), forward water-gas reaction (C + H2O → CO + H2), water-gas shift reaction (CO + H2O → CO2 + H2), and reverse Boudard reaction (C + CO2 → 2CO). Although the amount of H2 decreased a bit for both cases, however, overall syngas yield increased. The highest syngas yield (58.46%) was obtained using dolomite. Also, the LHV of product gas increased using both minerals. The LHV of the product gas using dolomite and lime were almost same i.e., 9.33 MJ/Nm3 and 9.36 MJ/Nm3 respectively. However, Gy remained unchanged after using minerals at 1.75 Nm3/kg.
Figure 6a depicts CGE, Cc, and Ry after using minerals as bed materials at ER 0.2. Both dolomite and lime showed a positive effect on CGE, increasing by more than 4% in both cases. The CGE of dolomite and lime showed almost similar performance i.e., 46.48% and 46.67% respectively. In the case of Cc, for both cases, the conversion rate increased by at least 7%. The highest Cc rate was obtained after using lime (87.82%). It happened because of the high yield of CO2 gas after using lime. The use of minerals also successfully decreased Ry, which means more reactions took place after using minerals. After using dolomite, Ry decreased by 7%, whereas after using lime Ry decreased by 5.67%. So, it can be said that dolomite showed a comparatively better result than lime.
Figure 6b illustrates the tar and gas pollutants concentration after using minerals as bed materials at ER 0.2. As discussed before, because of the high operating temperature, the concentration of tar was less in the product gas and using minerals lowered this concentration further, meaning that dolomite and lime promoted hydrocarbon destruction. Both dolomite and lime showed similar results. After using dolomite, the tar concentration became 1.17 g/Nm3, whereas after using lime, the tar concentration became 1.16 g/Nm3. The use of dolomite and lime increased the concentration of gas pollutants insignificantly. In the case of dolomite, the concentration of HCN and NH3 both increased, which means dolomite either enhanced the thermal cracking of volatile N in the gas phase or intensified the hydrogenation of char-N by H radicals, thus increased the NH3 concentration. In addition, it intensified the thermal cracking of unstable N-containing structure inside the gasifier, which formed more HCN. In the case of lime, only the concentration of HCN increased which means it only enhanced the thermal cracking of unstable N-containing structure inside the gasifier. However, the overall concentration of gas pollutants was still much lower than the allowable limit set by Korean emission standard.
Considering the effects of dolomite and lime on TSRFR gasification, dolomite was found to be the best performing minerals because, after using dolomite, the highest syngas yield (58.45 vol%) with very high LHV (9.33 MJ/Nm3) was obtained. Additionally, very high CGE (46.48%) and Cc (86.96%) and the lowest Ry (16%) with very low tar and gas pollutant was found after using dolomite.

3.3. Co-Gasification of TSRFR and Biomass Waste Blends

From our previous experiment, we found that at 950 °C temperature, ER 0.2 is the optimum condition for TSRFR gasification. In this study, efforts were made to enhance the gasification performance further by doing co-gasification with biomass, as biomass blends improve the gasification performance by diluting some unfavorable characteristics like high ash content. Also, it increases the gasification gas heating value and energy conversion [18,19,20]. Thus, co-gasification experiments were conducted at 950 °C temperature and ER 0.2 by mixing TSRFR with pine sawdust in two different ratios; in the first case, 75 wt% TSRFR mixed with 25 wt% pine sawdust and in the second case 50 wt% TSRFR mixed with 50 wt% pine sawdust.
Figure 7 depicts the gas composition and LHV of product gas after the co-gasification of TSRFR with biomass. In addition, it shows a comparison with TSRFR gasification at ER 0.2. Like previous experimental results, the main components of product gas were H2, CO, CO2, and CH4; gases like C2H6 and C3H8 were also present in insignificant amounts. Co-gasification with biomass has increased the concentration of CO, CO2, and CH4, whereas it decreased the amount of H2 insignificantly. This means biomass addition favored the forward water-gas reaction, forward methanation reaction, reverse Boudard reaction and water-gas shift reaction. For the 25 wt% sawdust blend, overall syngas yield remained unchanged, however, for 50 wt% sawdust blends, the overall syngas yield decreased by 2.67 vol%. As expected, after using biomass blends, the LHV of the product gas increased for both cases, and product gases showed an almost similar LHV. The LHV of the 25 wt% sawdust blend product gas was 9.23 MJ/Nm3, and the LHV of the 50 wt% sawdust blend product gas was 9.25 MJ/Nm3. In the case of Gy, both blends showed higher yield than only TSRFR gasification. For the 25 wt% sawdust blend and 50 wt% sawdust blends, the Gy was 1.81 Nm3/kg and 1.76 Nm3/kg respectively. The highest Gy was obtained from the blend of 25 wt% sawdust with 75 wt% TSRFR.
Figure 8a shows the CGE, Cc, and Ry after co-gasification at ER 0.2. After using biomass blends, the 25 wt% sawdust blends showed a 4.26% increase in CGE, and 50 wt% sawdust blends showed a 5.41% increase in CGE. Cc rate also increased after using biomass blends. For 25 wt% sawdust blend Cc increased by 16.78%, and for 50 wt% sawdust blending, Cc increased by 14.23%. The highest Cc (96.47%) was obtained after using 25 wt% sawdust blends. As predicted earlier, uses of biomass blends decreased the amount of Ry. As 50 wt% sawdust blend contains a higher amount of biomass compared to 25 wt% sawdust blends; therefore, the lowest Ry (13%) was obtained for the 50 wt% sawdust blends.
Figure 8b illustrates the tar and gas pollutants concentration after co-gasification at ER 0.2. As discussed before because of the high operating temperature, the tar concentration was very low in every experiment. This experimental result followed a similar trend. The tar concentration was 0.99 g/Nm3 for the 25 wt% sawdust blend and 1.16 g/Nm3 for the 50 wt% sawdust blends. In the case of gas pollutants, for both sawdust blends, the NH3 concentration remained constant, but the concentration of HCN increased in both cases. This means that more unstable N-containing structures were thermally cracked inside the gasifier in these cases and formed HCN. However, the gas pollutants concentration was still much less than the allowable limit set by Korean emission standard.
Considering all the gasification performance parameters, 25 wt% sawdust blends with TSRFR was found as the best performing feedstock for this case. Because, after using this feedstock, the highest Gy (1.81 Nm3/kg) with the highest syngas yield (56.06 vol%) and very high (9.23 MJ/Nm3) was obtained. Furthermore, the highest Cc (96.47%) and very high CGE (47.17%) was found for this feedstock, as well as a meagre amount of tar, gas pollutants, and Ry.
Lastly, a combined experiment was conducted at 950 °C temperature and ER 0.2, using the best performing feedstock (25 wt% sawdust blend with TSRFR) as the feed material and the best performing minerals as a bed material (dolomite) to analyze the effect on gas quality and yield. Results obtained from this experiment were also compared with previous experimental results. Results depicted that overall, the highest Gy (1.81 Nm3/kg), with the highest amount of syngas (56.72%) and highest LHV (9.55 MJ/Nm3) was obtained from this combination (shown in Figure 7). Also, in this case, the overall highest CGE (48.64%), Cc (98.87%), and lowest Ry (11.56%) were obtained [results are shown in Figure 8a]. The lowest amount of tar (0.95 g/Nm3) was also generated during this combined gasification. As seen in previous experiments, because of the use of dolomite, the amount of gas pollutants also increased by a small amount. However, the overall gas pollutants concentration was much below the allowable limit set by the Korean government [results are shown in Figure 8b]. Considering all the results, this combined gasification was found as the best option for TSRFR gasification.

4. Conclusions

Gasification experiments were conducted at 950 °C on TSRFR obtained from SRF residue (leftovers in the SRF manufacturing process) after the MBT process to assess the viability of syngas production. In addition, gasification experiments were carried out on TSRFR using low-cost natural minerals as bed materials to enhance the gasification performance. Additionally, co-gasification experiments were conducted on TSRFR and biomass waste blends in order to improve the gasification performance. The key findings that came from this research are summarized below:
(i)
For TSRFR gasification, ER 0.2 was found as the most suitable condition to gasify. At ER 0.2, the maximum syngas yield with the highest LHV was obtained. Also, the highest CGE and very high Cc was found at ER 0.2, and the concentration of tar and gas pollutants were found to be very low in this condition.
(ii)
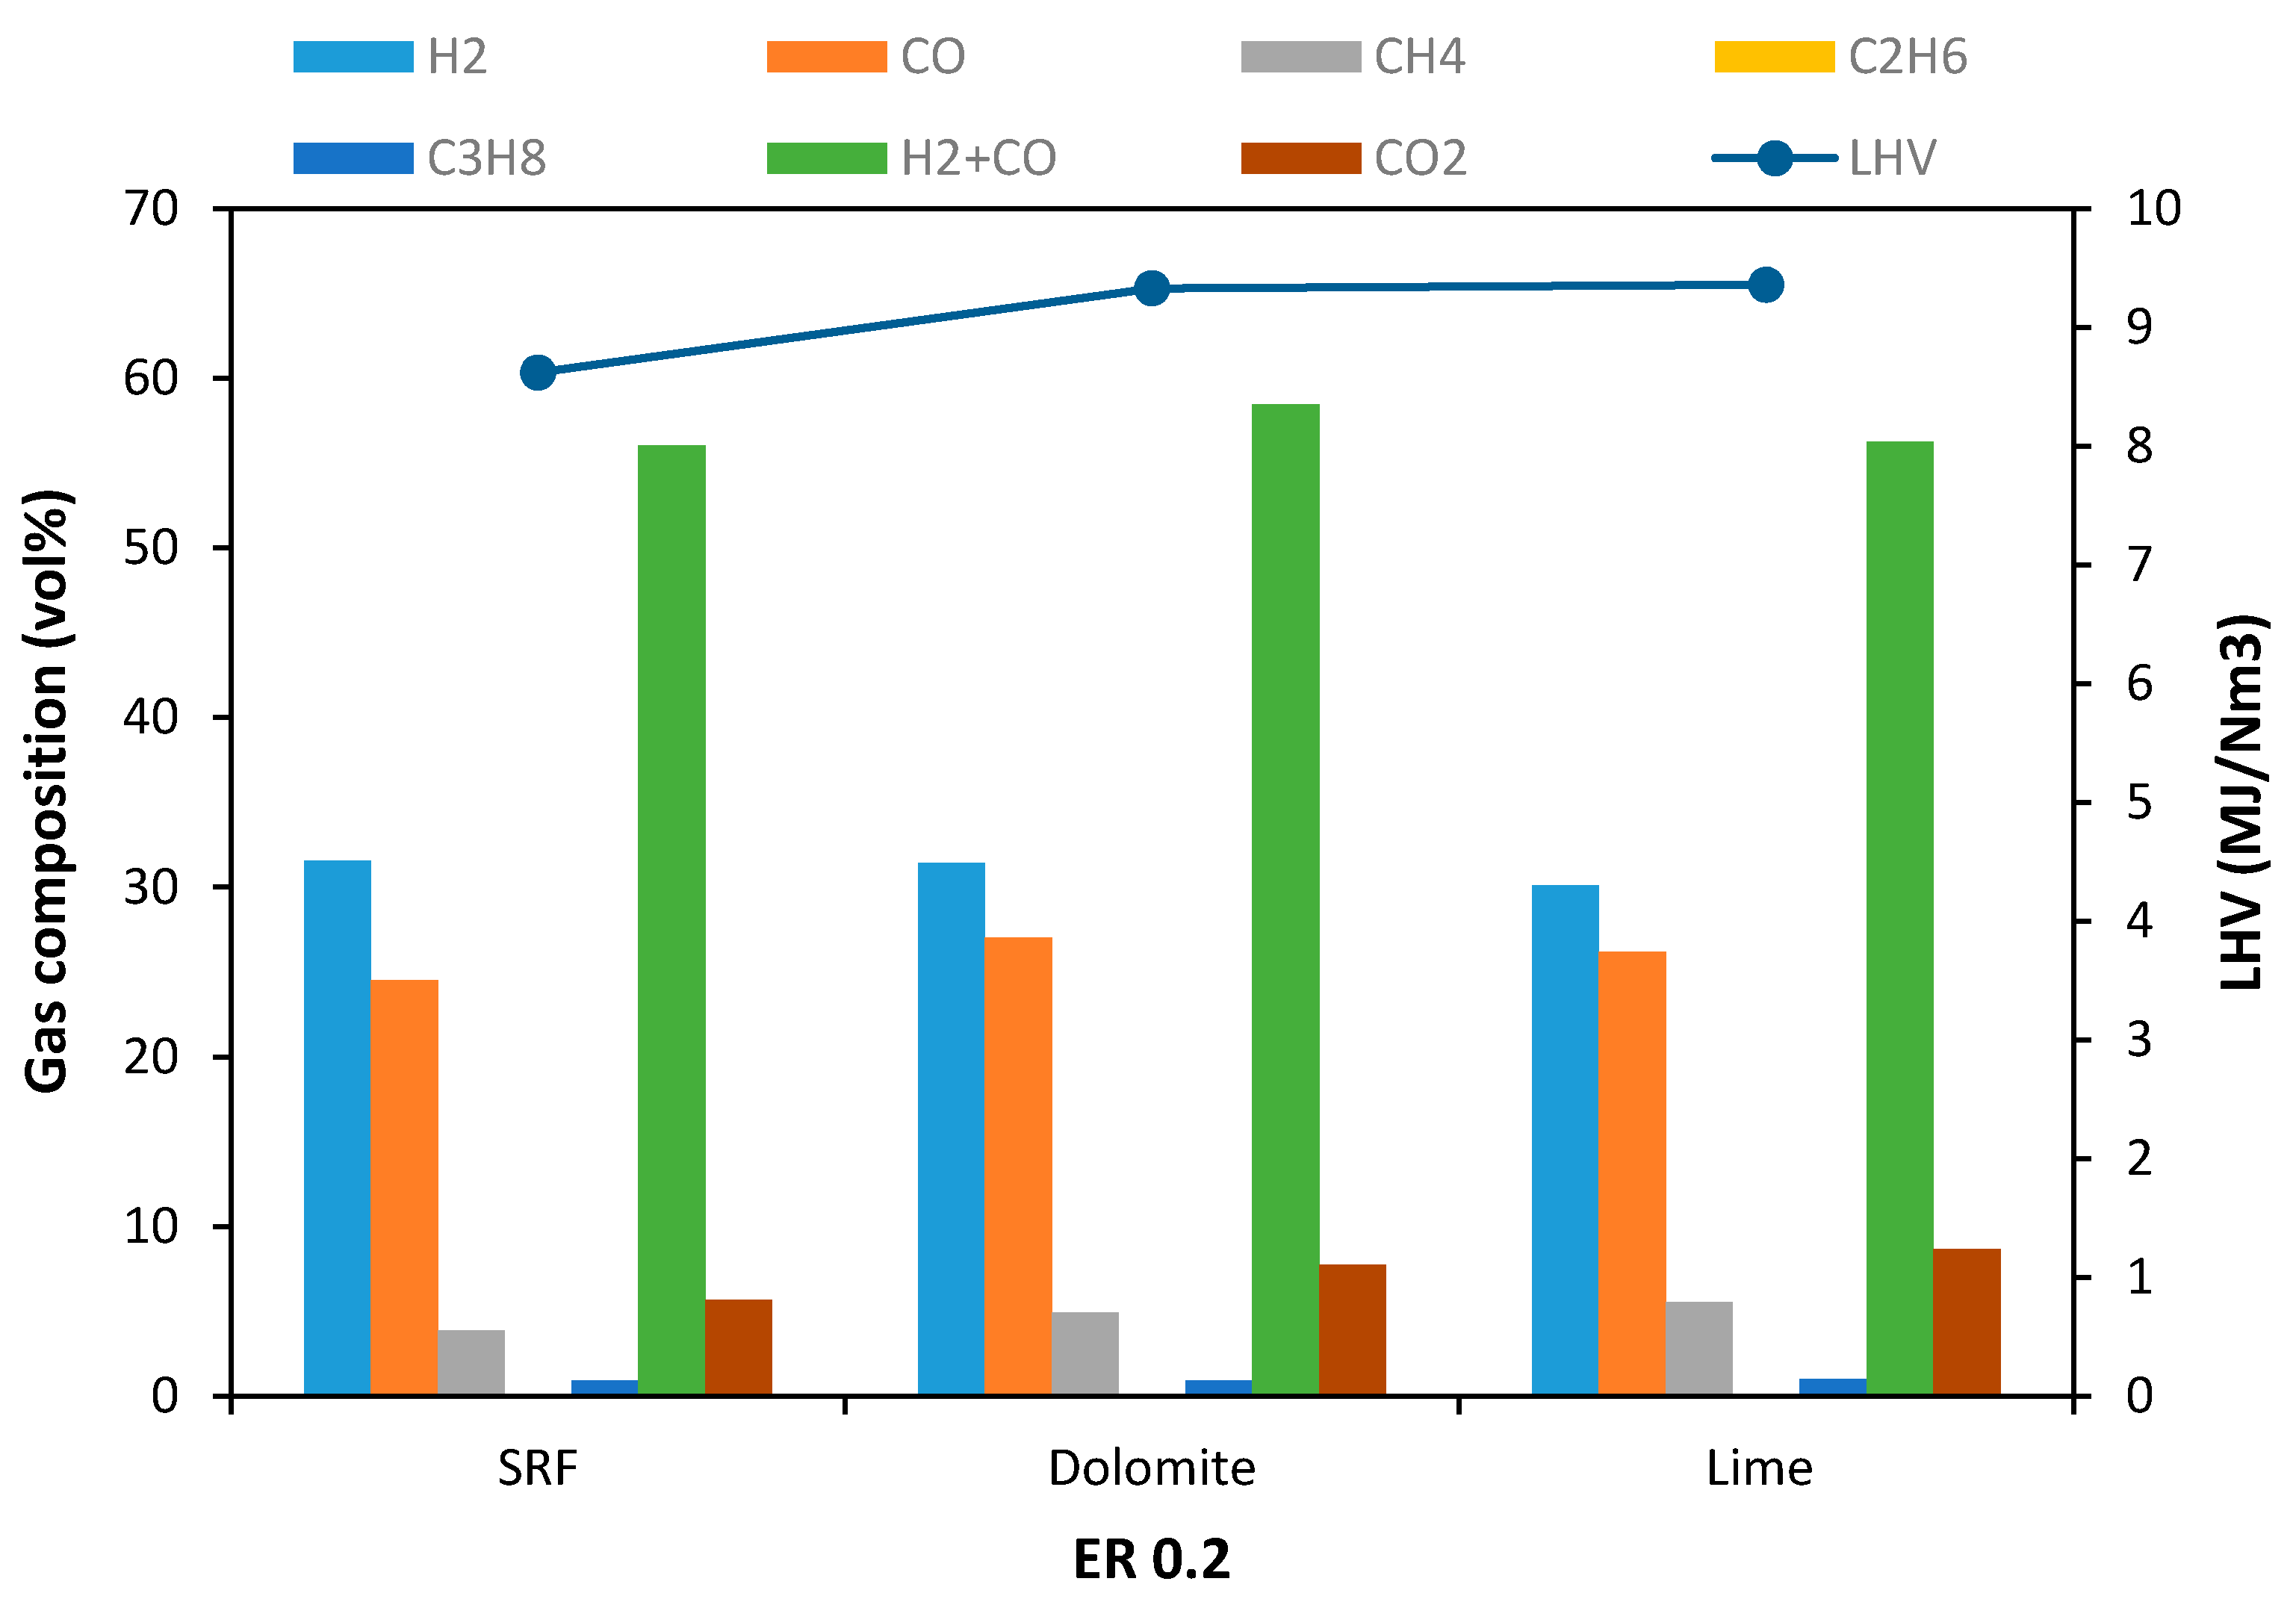
The use of dolomite and lime minerals as bed materials successfully increased the syngas yield, LHV of product gas, CGE, and Cc. Uses of dolomite and lime also successfully decreased the amount of Ry and tar concentration. In addition, a low amount of gas pollutants was obtained in the product gas. Overall, dolomite showed comparatively better performance than lime.
(iii)
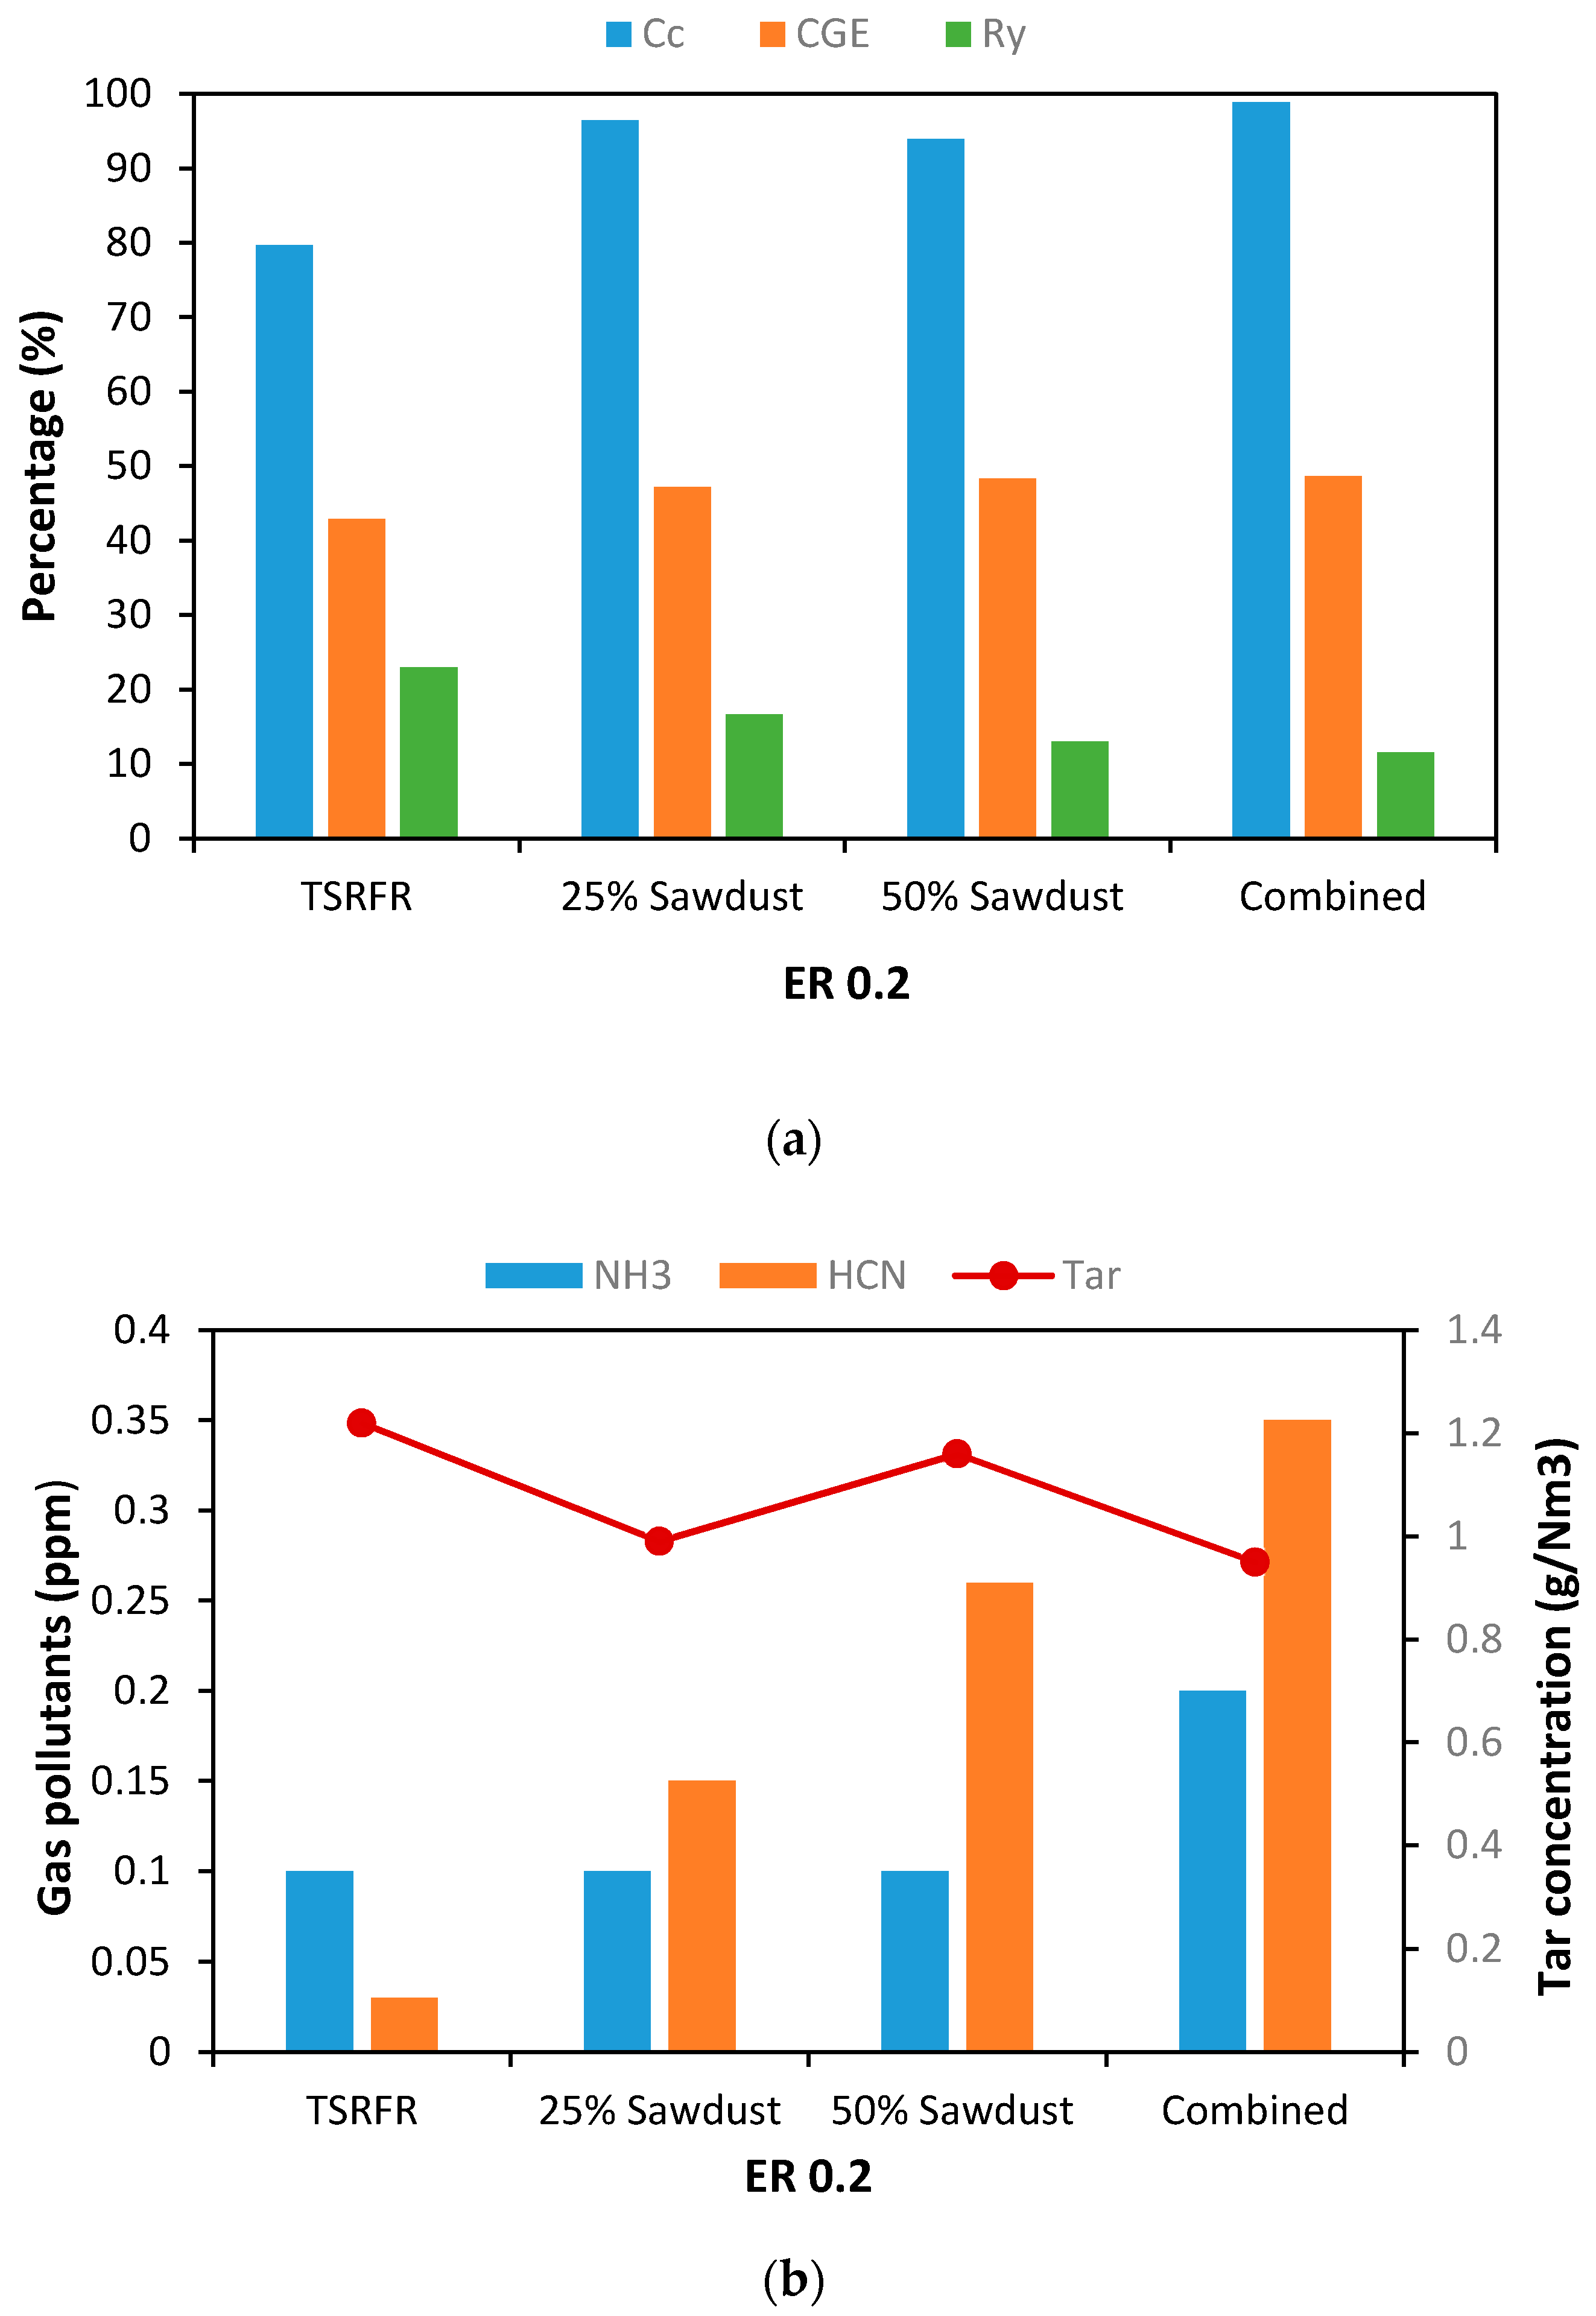
In the case of co-gasification of TSRFR with biomass waste blends, both blends (25 wt% sawdust, 50 wt% sawdust) showed excellent performance. After using biomass blends, Gy, syngas yield, LHV of product gas, CGE, Cc increased, and Ry decreased. Concentrations of tar and gas pollutants were deficient in both cases. Overall, the 25 wt% sawdust blends showed a better performance compared with 50 wt% sawdust.
(iv)
In an experiment conducted using 25 wt% sawdust blends with TSRFR as a feedstock and dolomite as the bed material, the highest syngas yield with the highest LHV of product gas was obtained. Moreover, CGE, Cc, and residue yield showed the highest performance, and tar and gas pollutants concentration were found very low in the product gas. Considering all the facts, it can be concluded that TSRFR blended with 25 wt% pine sawdust and accompanied by dolomite as bed material was found as the most viable condition for TSRFR gasification.

Author Contributions

Conceptualization: M.T.A.; investigation: M.T.A., S.-W.P., S.-Y.L., and Y.-O.J.; methodology: M.T.A.; resources: Y.-C.S. and H.S.C.; supervision: Y.-C.S. and H.S.C.; original draft writing M.T.A.; review and editing: M.T.A., A.D.G., Y.-C.S., and H.S.C. All authors have read and agreed to the published version of the manuscript.

Funding

This work was supported by the Korea Institute of Energy Technology Evaluation and Planning (KETEP) and the Ministry of Trade, Industry & Energy (MOTIE) of the Republic of Korea (No. 20184030202240).

Conflicts of Interest

The authors declare no conflict of interest.

References

  1. Park, S.-W.; Lee, J.-S.; Yang, W.-S.; Alam, M.T.; Seo, Y.-C. A Comparative Study of the Gasification of Solid Refuse Fuel in Downdraft Fixed Bed and Bubbling Fluidized Bed Reactors. Waste Biomass Valorization 2020, 11, 2345–2356. [Google Scholar] [CrossRef]
  2. Alam, M.T.; Lee, J.-S.; Lee, S.-Y.; Bhatta, D.; Yoshikawa, K.; Seo, Y.-C. Low Chlorine Fuel Pellets Production from the Mixture of Hydrothermally Treated Hospital Solid Waste, Pyrolytic Plastic Waste Residue and Biomass. Energies 2019, 12, 4390. [Google Scholar] [CrossRef] [Green Version]
  3. Asif, M.; Muneer, T. Energy supply, its demand and security issues for developed and emerging economies. Renew. Sustain. Energy Rev. 2007, 11, 1388–1413. [Google Scholar] [CrossRef]
  4. Cheng, H.; Hu, Y. Municipal solid waste (MSW) as a renewable source of energy: Current and future practices in China. Bioresour. Technol. 2010, 101, 3816–3824. [Google Scholar] [CrossRef]
  5. Park, S.-W.; Lee, J.-S.; Yang, W.-S.; Alam, M.T.; Seo, Y.-C.; Lee, S.-Y. Gasification characteristics of biomass for tar removal by secondary oxidant injection. J. Mater. Cycles Waste Manag. 2018, 20, 823–831. [Google Scholar] [CrossRef]
  6. Bourtsalas, A.T.; Seo, Y.; Alam, M.T.; Seo, Y.-C. The status of waste management and waste to energy for district heating in South Korea. Waste Manag. 2019, 85, 304–316. [Google Scholar] [CrossRef]
  7. Hoornweg, D.; Bhada-Tata, P. What a Waste: A Global Review of Solid Waste Management; World Bank: Washington, DC, USA, 2012; Volume 15. [Google Scholar]
  8. Yang, W.-S.; Park, J.-K.; Park, S.-W.; Seo, Y.-C. Past, present and future of waste management in Korea. J. Mater. Cycles Waste Manag. 2015, 17, 207–217. [Google Scholar] [CrossRef]
  9. Arena, U.; Di Gregorio, F. Gasification of a solid recovered fuel in a pilot scale fluidized bed reactor. Fuel 2014, 117, 528–536. [Google Scholar] [CrossRef]
  10. Seo, Y.-C.; Alam, M.T.; Yang, W.-S. Gasification of Municipal Solid Waste. In Gasification for Low-Grade Feedstock; IntechOpen: London, UK, 2018; pp. 115–141. [Google Scholar]
  11. Tchapda, A.H.; Pisupati, S.V. A review of thermal co-conversion of coal and biomass/waste. Energies 2014, 7, 1098–1148. [Google Scholar] [CrossRef] [Green Version]
  12. Prins, M.J.; Ptasinski, K.J.; Janssen, F.J. From coal to biomass gasification: Comparison of thermodynamic efficiency. Energy 2007, 32, 1248–1259. [Google Scholar] [CrossRef]
  13. Guan, Y.; Luo, S.; Liu, S.; Xiao, B.; Cai, L. Steam catalytic gasification of municipal solid waste for producing tar-free fuel gas. Int. J. Hydrog. Energy 2009, 34, 9341–9346. [Google Scholar] [CrossRef]
  14. Park, S.-W.; Lee, J.; Yang, W.; Kang, J.; Sung, J.; Alam, M.T.; Seo, Y.; Rao, C.S.; Saravanakumar, A.; Kumar, K.V. For Waste to Energy, Assessment of Fluff Type Solid Refuse Fuel by Thermal Characteristics Analyses. Procedia Environ. Sci. 2016, 35, 498–505. [Google Scholar] [CrossRef]
  15. Park, S.; Lee, J.; Yang, W.; Kang, J.; Alam, M.; Seo, Y.; Oh, J.; Gu, J.; Chennamaneni, S.; Kandasamy, V. Emission Characteristics of Gaseous Pollutants from Pilot-Scale SRF Gasification Process. In Waste Management and Resource Efficiency; Springer: Berlin/Heidelberg, Germany, 2019; pp. 51–58. [Google Scholar]
  16. Dunnu, G.; Panopoulos, K.; Karellas, S.; Maier, J.; Touliou, S.; Koufodimos, G.; Boukis, I.; Kakaras, E. The solid recovered fuel Stabilat®: Characteristics and fluidised bed gasification tests. Fuel 2012, 93, 273–283. [Google Scholar] [CrossRef]
  17. Yang, W.S.; Lee, J.S.; Park, S.W.; Kang, J.J.; Alam, M.T.; Seo, Y.C. Studies on combustion characteristics of low calorific waste generated in SRF manufactory by mechanical biological treatment (MBT). In Proceedings of the 3rd 3R International Scientific Conference on Material Cycles and Waste Management, Hanoi, Vietnam, 9–11 March 2016. [Google Scholar]
  18. Energy Recovery Policy. Available online: http://eng.me.go.kr/eng/web/index.do?menuId=144 (accessed on 15 November 2019).
  19. André, R.N.; Pinto, F.; Franco, C.; Dias, M.; Gulyurtlu, I.; Matos, M.; Cabrita, I. Fluidised bed co-gasification of coal and olive oil industry wastes. Fuel 2005, 84, 1635–1644. [Google Scholar] [CrossRef]
  20. Lapuerta, M.; Hernández, J.J.; Pazo, A.; López, J. Gasification and co-gasification of biomass wastes: Effect of the biomass origin and the gasifier operating conditions. Fuel Process. Technol. 2008, 89, 828–837. [Google Scholar] [CrossRef]
  21. Pinto, F.; André, R.N.; Carolino, C.; Miranda, M.; Abelha, P.; Direito, D.; Perdikaris, N.; Boukis, I. Gasification improvement of a poor quality solid recovered fuel (SRF). Effect of using natural minerals and biomass wastes blends. Fuel 2014, 117, 1034–1044. [Google Scholar] [CrossRef] [Green Version]
  22. Devi, L.; Ptasinski, K.J.; Janssen, F.J.; van Paasen, S.V.; Bergman, P.C.; Kiel, J.H. Catalytic decomposition of biomass tars: Use of dolomite and untreated olivine. Renew. Energy 2005, 30, 565–587. [Google Scholar] [CrossRef]
  23. Weerachanchai, P.; Horio, M.; Tangsathitkulchai, C. Effects of gasifying conditions and bed materials on fluidized bed steam gasification of wood biomass. Bioresour. Technol. 2009, 100, 1419–1427. [Google Scholar] [CrossRef]
  24. Jo, M.-H.; Lee, B.-J.; Lee, J.-Y. Effect of modified mechanical treatment facilities on SRF yield in Korea. Sci. J. Riga Tech. Univ. Environ. Clim. Technol. 2013, 12, 47–53. [Google Scholar] [CrossRef] [Green Version]
  25. Yoo, H.S.; Choi, H.S. A study on torrefaction characteristics of waste sawdust in an auger type pyrolyzer. J. Mater. Cycles Waste Manag. 2016, 18, 460–468. [Google Scholar] [CrossRef]
  26. Chen, G.; Leung, D. Experimental investigation of biomass waste, (rice straw, cotton stalk, and pine sawdust), pyrolysis characteristics. Energy Sources 2003, 25, 331–337. [Google Scholar] [CrossRef]
  27. Park, H.J.; Park, Y.-K.; Kim, J.S. Influence of reaction conditions and the char separation system on the production of bio-oil from radiata pine sawdust by fast pyrolysis. Fuel Process. Technol. 2008, 89, 797–802. [Google Scholar] [CrossRef]
  28. Kathirvale, S.; Yunus, M.N.M.; Sopian, K.; Samsuddin, A.H. Energy potential from municipal solid waste in Malaysia. Renew. Energy 2004, 29, 559–567. [Google Scholar] [CrossRef]
  29. Cozzani, V.; Nicolella, C.; Petarca, L.; Rovatti, M.; Tognotti, L. A fundamental study on conventional pyrolysis of a refuse-derived fuel. Ind. Eng. Chem. Res. 1995, 34, 2006–2020. [Google Scholar] [CrossRef]
  30. Yang, W.-S.; Lee, J.-S.; Park, S.-W.; Kang, J.-J.; Alam, T.; Seo, Y.-C. Gasification applicability study of polyurethane solid refuse fuel fabricated from electric waste by measuring syngas and nitrogenous pollutant gases. J. Mater. Cycles Waste Manag. 2016, 18, 509–516. [Google Scholar] [CrossRef]
  31. Son, Y.-I.; Sato, M.; Namioka, T.; YOSIKAWA, K. A study on measurement of light tar content in the fuel gas produced in small-scale gasification and power generation systems for solid wastes. J. Environ. Eng. 2009, 4, 12–23. [Google Scholar] [CrossRef] [Green Version]
  32. Rezaiyan, J.; Cheremisinoff, N.P. Gasification Technologies: A Primer for Engineers and Scientists; CRC Press: Boca Raton, FL, USA, 2005. [Google Scholar]
  33. Guo, X.; Xiao, B.; Liu, S.; Hu, Z.; Luo, S.; He, M. An experimental study on air gasification of biomass micron fuel (BMF) in a cyclone gasifier. Int. J. Hydrogen Energy 2009, 34, 1265–1269. [Google Scholar] [CrossRef]
  34. Kumar, A.; Eskridge, K.; Jones, D.D.; Hanna, M.A. Steam–air fluidized bed gasification of distillers grains: Effects of steam to biomass ratio, equivalence ratio and gasification temperature. Bioresour. Technol. 2009, 100, 2062–2068. [Google Scholar] [CrossRef]
  35. Cho, S.-J.; Jung, H.-Y.; Seo, Y.-C.; Kim, W.-H. Studies on gasification and melting characteristics of automobile shredder residue. Environ. Eng. Sci. 2010, 27, 577–586. [Google Scholar] [CrossRef]
  36. Devi, L.; Ptasinski, K.J.; Janssen, F.J. A review of the primary measures for tar elimination in biomass gasification processes. Biomass Bioenergy 2003, 24, 125–140. [Google Scholar] [CrossRef]
  37. Brage, C.; Yu, Q.; Chen, G.; Sjöström, K. Tar evolution profiles obtained from gasification of biomass and coal. Biomass Bioenergy 2000, 18, 87–91. [Google Scholar] [CrossRef]
  38. Kinoshita, C.; Wang, Y.; Zhou, J. Tar formation under different biomass gasification conditions. J. Anal. Appl. Pyrolysis 1994, 29, 169–181. [Google Scholar] [CrossRef]
  39. Narvaez, I.; Orio, A.; Aznar, M.P.; Corella, J. Biomass gasification with air in an atmospheric bubbling fluidized bed. Effect of six operational variables on the quality of the produced raw gas. Ind. Eng. Chem. Res. 1996, 35, 2110–2120. [Google Scholar] [CrossRef]
  40. Kwak, T.-H.; Lee, S.; Park, J.-W.; Maken, S.; Yoo, Y.D.; Lee, S.-H. Gasification of municipal solid waste in a pilot plant and its impact on environment. Korean J. Chem. Eng. 2006, 23, 954–960. [Google Scholar] [CrossRef]
  41. Ohtsuka, Y.; Wu, Z. Nitrogen release during fixed-bed gasification of several coals with CO2: Factors controlling formation of N2. Fuel 1999, 78, 521–527. [Google Scholar] [CrossRef]
  42. Zhou, J.; Masutani, S.M.; Ishimura, D.M.; Turn, S.Q.; Kinoshita, C.M. Release of fuel-bound nitrogen during biomass gasification. Ind. Eng. Chem. Res. 2000, 39, 626–634. [Google Scholar] [CrossRef]
  43. Tian, F.-J.; Yu, J.; McKenzie, L.J.; Hayashi, J.-I.; Li, C.-Z. Conversion of fuel-N into HCN and NH3 during the pyrolysis and gasification in steam: A comparative study of coal and biomass. Energy Fuels 2007, 21, 517–521. [Google Scholar] [CrossRef]
Figure 1. Thermogravimetric (TG) and derivative thermo-gravimetry (DTG) curves of TSRFR and pine sawdust.
Energies 13 02081 g001
Figure 2. Schematic diagram of the experimental setup: 1—air supply; 2—mass flow controller (MFC); 3—feeder; 4—feeding pipe; 5—furnace; 6—cyclone; 7—residue box; 8—scrubber; 9—water circulation pump; 10—fabric filter; 11—activated carbon bed; 12—filtering system; 13—gas pollutants sampling; 14—gas vacuum pump; 15—dry gas meter; 16—micro GC.
Energies 13 02081 g002
Figure 3. Gas composition and LHV at different equivalence ratio (ER) for TSRFR gasification.
Energies 13 02081 g003
Figure 4. Effect of ER on TSRFR gasification: (a) CGE, Cc, and Ry at different ER, (b) tar and gas pollutants concentration at different ER.
Energies 13 02081 g004
Figure 5. Comparison of gas composition and LHV after using minerals as bed materials at ER 0.2.
Energies 13 02081 g005
Figure 6. Effect of low-cost minerals on gasification performance: (a) CGE, Cc, and Ry at ER 0.2, (b) tar and gas pollutants concentration at ER 0.2.
Energies 13 02081 g006
Figure 7. Comparison of gas composition and LHV after co-gasification at ER 0.2. Note that combined denotes the optimum condition of TSRFR gasification; which is 950 °C, ER 0.2, feedstock—75 wt% TSRFR and 25 wt% sawdust blend, bed material—dolomite.
Energies 13 02081 g007
Figure 8. Effect of biomass waste blends on gasification performance: (a) CGE, Cc, and Ry at ER 0.2, (b) tar and gas pollutants concentration at ER 0.2.
Energies 13 02081 g008
Table 1. Physicochemical characteristics of treated SRF residue (TSRFR) and pine sawdust (as received).
FeedstockElemental Analysis (wt%)Proximate Analysis (wt%)HHV (MJ/kg)
CHONSClMCVMFCAC
TSRFR43.246.0341.890.44NDND5.0478.097.529.3521.54
Pine sawdust45.665.8145.320.11NDND1.4081.5216.650.4319.38
ND = not detected; MC = moisture content; VM = volatile matter; FC = fixed carbon, AC = ash content.
Table 2. Operating conditions of gasification experiments.
ParameterCondition 1Condition 2Condition 3Condition 4
FeedstockTSRFRTSRFRTSRFR + Pine sawdust (75 wt%+25 wt%)
TSRFR + Pine sawdust (50 wt%+50 wt%)
Optimum one from Condition 3
Temperature (°C)950950950950
Equivalent ratio0.2, 0.3, 0.4Optimum result from Condition 1Optimum result from Condition 1Optimum result from Condition 1
Feeding rate (g/min)5555
Particle size (mm)15–4515–4515–45 (TSRFR);
1–2 (Pine sawdust)
15–45 (TSRFR);
1–2 (Pine sawdust)
Bed materialSilica sandSilica sand + dolomite (67 wt% + 33 wt%)
Silica sand + lime (67 wt% + 33 wt%)
Silica sandOptimum result from Condition 2
Gasification agentAirAirAirAir

