Abstract
Investigation of the damage characteristics of rock material under the combined effect of cyclic load and impact load is extremely crucial for many mining engineering applications. Based on energy dissipation theory, we considered factors such as circulation times, the cyclic stress of a uniaxial cyclic load test, and the impact pressure (strain rate) of a split Hopkinson pressure bar (SHPB) test, studying the damage mechanism of red sandstone under the combined action of a uniaxial cyclic and impact loads. We found that when the load stress is 60%, 70%, and 80% of the uniaxial compressive strength (UCS) of red sandstone, the stress can still promote the development of microcracks and the generation of new cracks in the rock, increasing the inner damage of the rock so that it reduces the rock strength. As the cyclic time increases, the energy dissipation ratio presented a trend of decreasing dramatically and then maintaining basically no change, and the peak strain and the damage variable of the rock both increased first and then tended to remain relatively constant. The damage variable of the rock specimen under the combined action of the uniaxial cyclic loading and impact load had a significant corresponding relationship with the initial damage. As the rock specimen initial damage increases, the damage variable and the peak stress of the rock specimen both decreases almost linearly with initial damage. Meanwhile, the average particle diameter of the rock specimen after breakage gradually increased, showing a positively correlated tendency. The ratio between the fragment quality of the bigger particle diameter in the total rock specimen quality gradually increased. Under the conditions of the same initial damage, a higher impact pressure resulted in smaller rock fragment average particle diameters.
1. Introduction
Rock masses often suffer from the combined action of cyclic loads and impact loads in many mining engineering applications [1,2,3]. For instance, the rock bench above slopes in an open pit coal mine are usually subjected to combined action of the cyclic loads of passing heavy trucks and the impact loads of blasting. Specifically, shovel trucks handling materials are the preferred system in open pit mining due to the featured efficiency, flexibility, and high productivity [4]. Generally, haul roads of trucks are arranged above the slope, and the payload capacities of ultra-large trucks are up to hundreds of tons, which have a huge cyclic impact on the rock strata of slopes exposed to such a load [5]. Mines commonly adopt loosening blasting before stripping the overburden over coal seams, and the shockwave generated by blasting may also have a strong load effect on rock slopes [6,7]. As a result, the strength of the rock mass gradually decreases under this combined load, which causes surrounding rock instability and potentially engineering disasters [8,9,10]. Hence, basic research on the rock damage behavior under the combined action of cyclic load and impact load is vital for optimizing engineering designs and preventing geological disasters.
Research of the cyclic load or impact load on rock damage has produced some achievements. Duan et al. [11] found that the deformation degree and dissipated energy of sandstone undergo synchronous changes under the action of uniaxial cyclic load, so the dissipated energy curve reflects the fatigue fracture of the sandstone. Ning et al. [12] analyzed the stress–strain relationship, acoustic emission mode, and energy evolutionary characteristics in the triaxial compression test, constructing a new method for determining crack generation and expanding threshold valve energy dissipation. Cerfortaine and Collin [13] studied the fatigue and cyclic loading technology of natural rock materials, finding that cyclic loading is the main reason for damage accumulation. Lv et al. [14] studied the fatigue strength and damage mode of coal specimens under the conventional compression test conditions. A low breakage point of the coal specimen is conducive to the growth and rapid development of cracks on a large scale. In a long-term cyclic loading test, this is conducive to generating small cracks. Wang et al. [15] studied the creep property and damage model of rock salt regarding the low-frequency cyclic loading effect. Yin et al. [16] studied the mechanical behaviors of sandstone after thermal treatment and established a damage constitutive law under an impact load. Li [17] systematically studied the mechanical properties and damage fracture mechanisms of coal series sandstone under high temperature and high strain rate actions, thus obtaining the stress–strain curve, influence rules of the peak stress, and peak strain of the coal series sandstone under high temperature and high strain rate, determining the failure characteristics and transformation laws of energy dissipation as a function of the temperature and temperature loading rate. Wang et al. [18], Zhang et al. [19], and Chen et al. [20] studied the energy dissipation and damage evolution of the sandstone dynamic compression process after a freezing and thawing cycle. As the cycle number increases, the dynamic uniaxial compression strength and elasticity modulus lower. Du et al. [21] studied a damage constitutive model of red sandstone under the coupling action of a dry and watering cycle and impact load. Lu et al. [22] and Gu et al. [23] studied the mechanical properties and energy dissipation of rocks with different moisture contents under an impact load. Yin et al. [24] analyzed the dynamic mechanical properties of quickly cooling high-temperature granite. The through crack caused by rapid cooling has a decisive influence on the failure mode of rock specimens under the action of a dynamic load.
Some scholars discussed the damage definition in cyclic loading and unloading tests or dynamic loading tests. Liu et al. [25] and Wang et al. [26] adopted the ratio of the area of a microdefect to the cross-sectional area of a rock specimen to determine the damage to rock specimens. Sun et al. [27] examined the fatigue damage evolution of sandstone and its mechanical behavior under cyclic loading and redefined the size parameter of a multi-axial fatigue damage model. Lemaitre [28] and Peng et al. [29] adopted the degraded elasticity modulus to define damage in a cyclic loading and unloading test. Xie et al. [30], Hou et al. [31], and Liu et al. [32] considered plastic deformation and constructed elasticity modulus correction methods to define the damage to a uniaxial test rock specimen. Feng et al. [33] conducted dynamic loading tests on coal specimens with the Split Hopkinson Pressure Bar (SHPB) system, analyzing the dynamic behavior and energy dissipation characteristics, discussing the energy dissipation mechanisms based on the coal’s fracture process under the dynamic load, and introducing a semi-empirical dissipation model describing the positive correlation between dissipated energy and stress.
Scholars have already examined the damage of uniaxial cyclic loading or impact loading, but the damage mechanism of rock under the combined action of uniaxial cyclic loading and impact load requires further study. Based on energy dissipation theory, we considered factors such as circulation times, the upper and lower limits of cyclic stress of a cyclic load test, and the impact pressure of an impact test, studying the damage mechanism of rock under the combined action of cyclic and impact load. The research results can be used to optimize engineering designs and prevent geological disasters.
2. Materials and Methods
2.1. Materials
The red sandstone used for the experiments was obtained from an open-pit mine in China, with an average density of 2.41 g/cm3. The standard cylindrical rock specimens (Figure 1) have dimensions of 50 mm (in diameter) × 100 mm (in height) and were prepared with a coring machine, rock saw, and grinder. The main mineral contents (Figure 2) were 67% albite, 14.9% quartz, 13.4% anorthoclase, 3.3% laumontite, and 1.4% santafeite. There were no visible joints or cracks. On the entire rock specimen altitude, the diameter error was below 0.3 mm and the non-parallelism of both ends was below 0.05 mm.
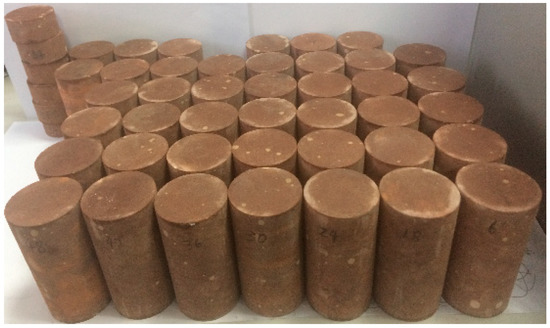
Figure 1.
Standard red sandstone specimens.
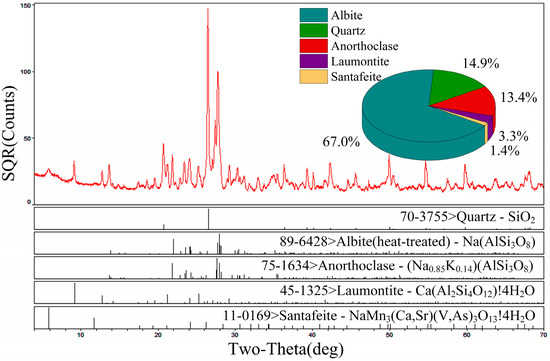
Figure 2.
Composition analysis of the red sandstone specimens.
2.2. Experimental Scheme
The experiment in this study was divided into three stages, and the specific steps are as follows:
Firstly, six standard-sized cylindrical rock specimens, numbered R1-1 to R1-6, were selected for a uniaxial compressive strength (UCS) test. The objective of the test was to obtain the UCS of the red sandstone specimens. The results would provide the necessary data for the subsequent uniaxial cyclic loading and unloading test and the split Hopkinson pressure bar (SHPB) test.
Secondly, the uniaxial cyclic loading and unloading test was carried out by a microprocessor control tester, as shown in Figure 3. We divided 18 red sandstone specimens into 3 groups on average. For each group, the rock specimens were firstly loaded to 20% of the UCS (σc) of red sandstone (σmin) at a loading rate of 1.5 kN/s, then the load was kept constant for 300 s (T1). The axial stress was then loaded at 60%, 70%, or 80% of the UCS (σc) of the red sandstone (σmax) at a loading rate of 1.5 kN/s, then immediately unloading the stress to σmin at a loading rate of 1.5 kN/s and maintaining this state for 30 s (T3), then circulating repeatedly for 100, 200, or 600 times, respectively. Figure 4 illustrates the loading path during the cyclic loading process. Table 1 provides the detailed experimental schemes.
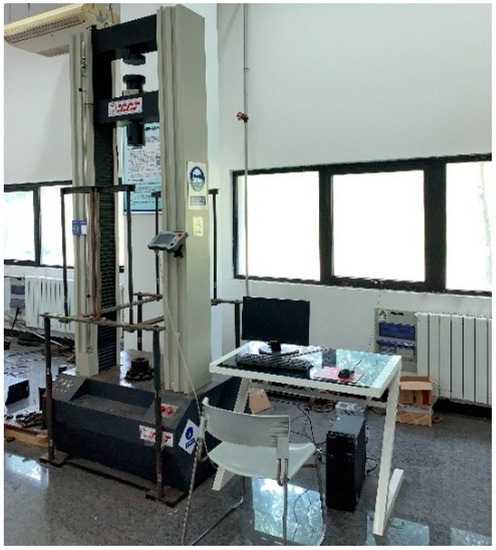
Figure 3.
A microprocessor control tester.
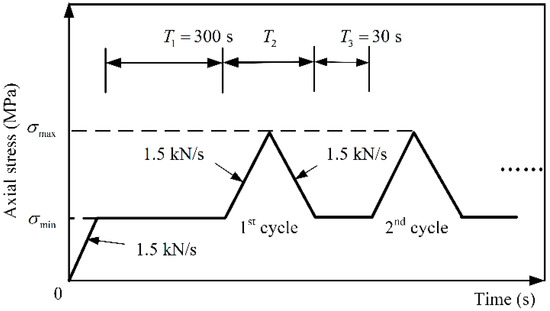
Figure 4.
Stress path diagram of uniaxial loading and unloading test.

Table 1.
Cyclic loading test scheme.
Thirdly, every piece of a rock specimen (Φ50 × 100 mm) subjected to the cyclic loading test was cut into 3 pieces (Φ50 × 25 mm) for the SHPB test. For instance, rock specimen R6-1-1 was cut into three pieces, producing R6-1-1-1, R6-1-1-2, and R6-1-1-3. The detailed test scheme is summarized in Table 2. Some rock specimens that were not subjected to the cyclic loading test (R1-7-1, R1-7-2, R1-7-3, R1-8-1, R1-8-2, and R1-8-3) were selected as the control group. A grinding machine is used to flatten the ends of each specimen to the condition in which the ends of the specimen are flat to 0.02 mm and are not allowed to depart from perpendicularity to the specimen axis by more than 0.001 rad or 0.025 mm in 25 mm. The sides of the specimen are kept smooth, and the abrupt irregularities and straight are limited to 0.02 mm over the full length of the specimen. The ultrasonic velocities of the specimens are measured in order to group the specimens with similar velocities [34].

Table 2.
Split Hopkinson pressure bar (SHPB) test scheme.
Figure 5 shows the schematic of the SHPB system. The SHPB tester mainly has four parts: the striker bar, incident bar, transmission bar, and absorption bar, respectively. These parts are made of 40Cr steel. The elasticity modulus was 240 GPa, and the longitudinal wave velocity was 4975 m/s. The striker bar had a length of 200 mm, a diameter of 37 mm, and an ultimate strength of over 800 MPa. The incident bar had a length of 2400 mm, a diameter of the striker bar contact end of 37 mm, and a diameter of 50 mm after a 120 mm transition. The transmission bar had a length of 1400 mm and a diameter of 50 mm. The strain gauge on the incident bar was 1190 mm from the rock specimen, and the strain gauges are attached to the transmission bar with distances 1000 mm away from the rock specimen.
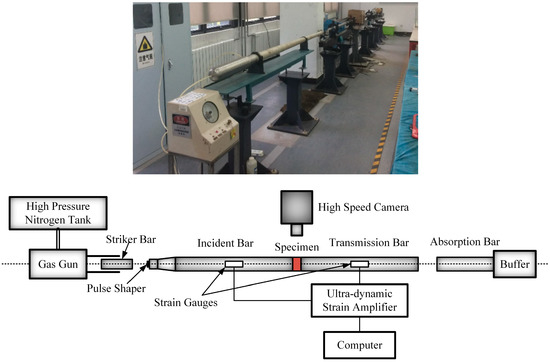
Figure 5.
The split Hopkinson pressure bar (SHPB) test system.
2.3. Test Data Processing Method
Figure 6a shows the stress–strain curve obtained by the SHPB test, taking rock specimen 1-7-1 as an example. For the separation of the incident, transmitted, and reflected waves, the method proposed by Li [35] was used, which is based on the theoretical study of stress wave propagation characteristics in an elastic rod, with 1/3 site of the stress amplitude value as the starting point and the modified average slope as the extrapolated line slope. Then, the intersection with the datum line is considered the calculation starting point of the wave and the zero-crossing point variable symbol point as the wave termination site. This method was used to process the wave curve shown in Figure 6a to produce the wave curve shown in Figure 6b. Then, the wave curve was integrated to obtain the wave curve shown in Figure 6c. Figure 6c shows that the method can quickly and effectively separate the stress–strain curve obtained by the SHPB test, and the superimposed waveform of the incident wave and the reflected wave coincide with the wave curve of the transmitted wave, which verifies the effectiveness of the method proposed by Li [35].
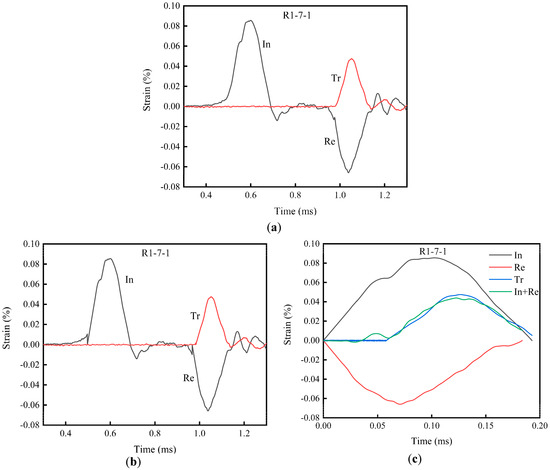
Figure 6.
SHPB test wave curve processing contrast diagram (In implies Incident wave, Re implies Reflected wave, Tr implies Transmitted wave): (a) Original wave diagram, (b) wave curve processed with Li’s method [35] and (c) wave curve after a symmetrical wave.
2.4. Calculation Methods of Rock Damage
2.4.1. Energy Dissipation Analysis
Rock deforms because of external loads, which leads to the development of internal rock defects and the deterioration of rock performance. Energy is the force driving the development, expansion, and damage development of rock defects [36,37,38,39]. In the process of rock deformation caused by external loads, it undergoes compaction, elastic, stable rupture development, unstable rupture development, and post-peak failure stages. Each stage is closely related to energy conversion. Under the uniaxial stress state, it is assumed that the rock external load deformation process has no heat exchange with the external environment, that is, the rock forms a closed system because of the external load. According to the first law of thermodynamics, the total input energy W produced by the work of internal and external forces per unit volume of rock is as follows:
where is the axial stress, and is the axial strain.
In the uniaxial cyclic loading test, the stress–strain curve of the ith loading and unloading is used to indicate the relationship between the strain energy and dissipated energy. As shown in Figure 7, the loading path is AB and the unloading path is BC. The general strain generated in the rock loading stage is , the recoverable strain released in the unloading process is , and the residual strain is . The residual strain causes rock damage—the plastic deformation energy dissipation. If it is analyzed from the energy perspective, the area circled by the loading curve AB and horizontal axis is the total input energy, , and the area circled by the unloading curve BC and horizontal axis (curve BCEDB) is the unloading recovery strain energy, . The difference between and minus the area of rectangle ACEF () is the energy of the ith uniaxial cyclic loading and unloading energy dissipation. Therefore:
where , , and are the input energy, elastic strain energy, dissipation energy, and area of rectangle ACEF of the ith cyclic loading and unloading unit volume of the rock specimen, respectively.
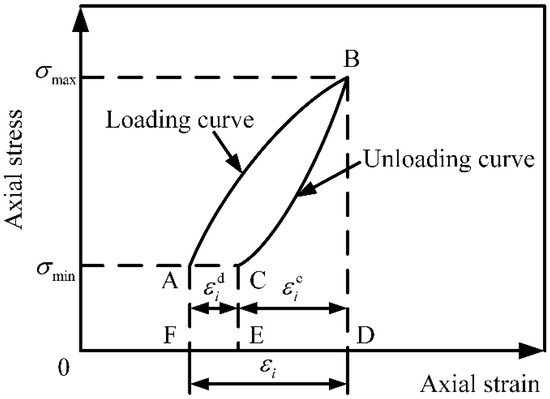
Figure 7.
The relationship between the strain energy and dissipated energy.
In the SHPB test, the material performance test was conducted through the following process: The punch collides with the incident bar under the driving force of the high-pressure gas, forming an incident pulse, , in the incident bar. When the incident pulse propagates to the two ends of the rock specimen in the incident bar, the stress impulse acts on the rock specimen and is reflected and transmitted repeatedly at the rock specimen interface at both ends, causing the high-speed deformation of the rock specimen. Simultaneously, part of the impulse is reflected and the other part of the impulse is transmitted through the rock specimen into the incident bar, forming the reflected impulse signal and the transmitted impulse signal . Each signal is recorded by the signal acquisition system by a strain gauge on the incident bar and transmission bar. After the completion of the test, the mechanical properties of the rock specimen and the corresponding parameters can be obtained by further calculating the stress wave signals in the incident bar and the transmission bar.
The stress, strain, and strain rate of the rock specimen in SHPB test are obtained by adopting a three-wave method for data processing [35,40]:
where , , and represent the strain signals of the incident wave, reflected wave, and transmitted wave, respectively; C, E, and A represent the stress wave velocity, elasticity modulus of the rod material, and the cross-sectional area of the incident bar and transmission bar, respectively; and L and represent the initial length and cross-sectional area of the rock specimen, respectively.
According to the hypothesis of the stress evenness, if the stress in the rock specimen is always the same, then:
Substituting Equation (4) into Equation (3), the two-wave treatment formula of the test data can be obtained:
Then the calculation formula of the incident energy, , reflected energy, , and transmitted energy, , can be obtained:
where , , and represent the stress signals of the incident wave, reflected wave, and transmitted wave, respectively.
Because the rock specimen was smeared with Vaseline on the end surface, the friction between the compression rod and rock specimen can be ignored. According to the SHPB test principle, the dissipated energy in the system can be expressed:
where the variable symbols in the formula have the same significance as above.
2.4.2. Rock Damage Calculation
Red sandstone is a heterogeneous multiphase composite structural material with various interior defects. The fracture process of red sandstone is essentially a process of energy accumulation, dissipation, and release. The deformation and fracture of red sandstone is closely related with energy transformation. Rock specimen damage and plastic deformation both consume some input energy. The energy consumed in this part is called dissipated energy. Therefore, the ratio of dissipated energy to input energy can reflect the interior damage development and plastic deformation of the rock specimen to a certain extent.
In the uniaxial cyclic loading and unloading test, it is assumed that the energy loss between the rock specimen and the contact surface of tester is ignored. Then the energy dissipation ratio can be introduced, it represents the ratio of the dissipated energy in the input energy during the uniaxial cyclic loading and unloading process [11,12]. The energy dissipation ratio is unable to represent the influence of the cyclic number to the rock damage, so the damage variable is introduced. represents the damage of the rock specimen after n events of cyclic loading and unloading. Therefore, the energy dissipation ratio of the rock specimen after the ith cycle of loading and unloading and the damage variable of the rock specimen can be represented as follows:
where and are the dissipated energy and input energy of the ith cyclic loading and unloading, respectively; is the energy dissipation ratio of the rock after the ith cyclic loading and unloading; is the damage variable of the rock specimen after experiencing n cyclic loading and unloading events; is the approximate area circled by the curve ABCG (Figure 8); and W is approximately the area circled by the curve ABCDF (Figure 8).
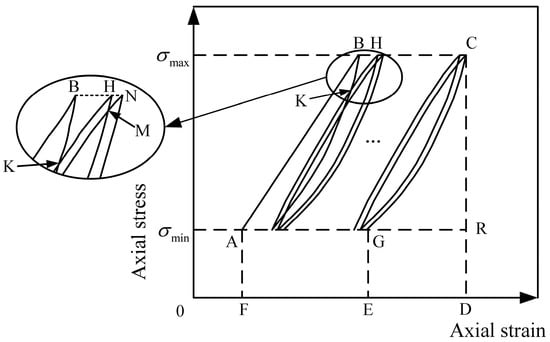
Figure 8.
Stress–strain curve of the uniaxial cyclic loading and unloading test.
As shown in Figure 8, after practical curve verification, we found the ratio of the area circled by the curve BKH and the total input energy is less than 0.1% of the case with two circulations. When circulating three times, the ratio between the area circled by the curve HMN and the total input energy is lower, so the influence of the area circled by the curve BKH and the curve HMN and the similar curves can be ignored.
In the SHPB test, the energy loss between the incident bar, the transmission bar, and the rock specimen interface is ignored. The damage variable D is introduced here, which represents the rock damage after experiencing the SHPB test. The damage variable D can be calculated by:
where D is the damage variable, is the dissipated energy, and is the incident energy.
3. Results
3.1. Rock Stress–Strain Curve of the Cyclic Load Test
In the UCS test, the UCS values of six rock specimens were 48.5, 59.5, 56.3, 62.4, 55.6, 52.8 MPa, respectively, and an average UCS was 55.8 MPa, as illustrated in Table 3. Figure 9 presents the stress–strain curves of the six rock specimens.

Table 3.
Record table of uniaxial compressive strength (UCS) test.
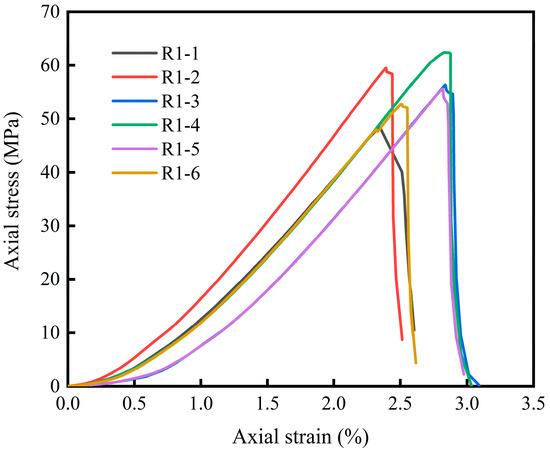
Figure 9.
Stress–strain curve of the UCS test.
In the cyclic loading test, the peak strain of the rock specimen in the cyclic loading and unloading test has a certain relationship with the cyclic upper limit loading. As exhibited in Table 4 and Figure 10, the uniaxial compressive strength of the rock specimen with a cyclic upper limit load of 60% of σc had no significant damage after circulating 600 times. The uniaxial compressive strength rock specimens with the cyclic upper limit load of 70% of had significant damage after circulating 314 and 358 times. The two uniaxial compressive strength rock specimens, with a cyclic upper limit load of 80% of , suffered significant damage after cycling for 229 times, and 252 times, respectively.

Table 4.
Test results of the rock specimen after cycling for 600 times.
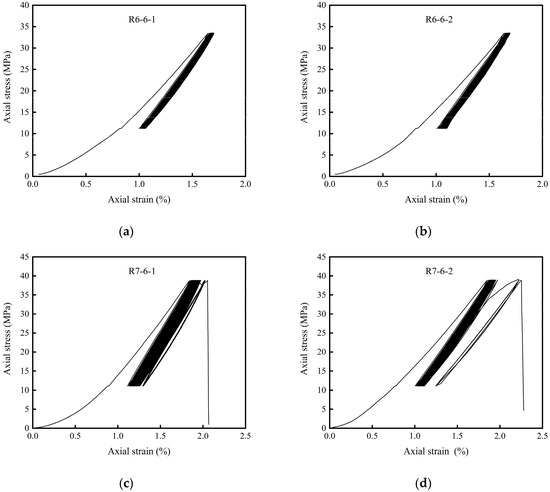
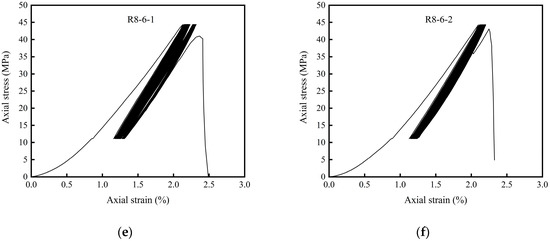
Figure 10.
The stress–strain curve of the cyclic loading and unloading test.
The growth rate of peak strain was not constant during the whole test process. When the rock specimen was not destroyed, the accumulation of deformation generated by the first cycle was the largest, and the rate of deformation accumulation decreased with the number of cycles. When the rock specimen was destroyed, the accumulation of deformation in the first cycle and the last cycle was usually larger than the accumulation of deformation between the two cycles. Between these two cycles, the stress–strain curves of rock specimens were approximately straight and closed.
In the uniaxial cyclic loading and unloading experiment, a certain relationship existed between the peak strain of the single cycle and the number of cycles. As shown in Figure 11, the peak strains of the rock specimens under three different loading conditions were statistically analyzed. We found that peak strain of the rock specimen increased obviously as the number of cycles increased in the first 200 circulations, regardless of the upper limit of the cyclic loading and unloading stress, whether 60%, 70%, or 80% of . When the number of cycles was more than 200, the peak strain accumulation rate was almost equal to zero as the number of cycles increased. Therefore, we mainly studied the effects of the first 200 cycles of the loading and unloading tests.
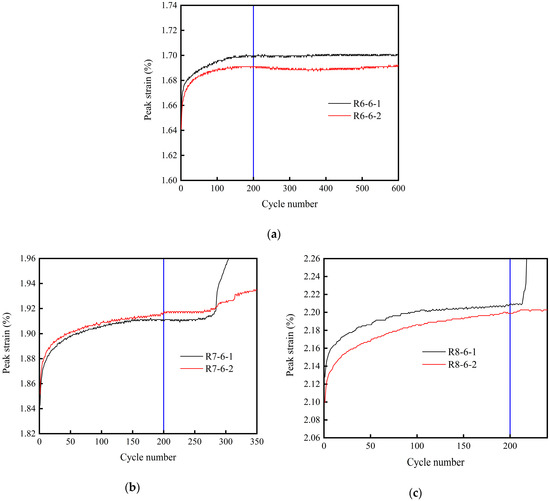
Figure 11.
The relationship between the cyclic loading and unloading peak strain and cycle number when the stress upper limit is (a) 60%, (b) 70%, and (c) 80% of .
3.2. Rock Damage under Cyclic Load and Impact Load
As shown in Figure 8, if the rock specimen is destroyed in the nth cycle, the stress unloading curve is CR, the dissipated energy in Equation (9) is equal to the area surrounded by curve ABCRA, and the input energy is equal to the area surrounded by curve ABCRA. Then, the damage variable of rock specimen is equal to one. If the rock specimen is not destroyed in the nth cycle, the stress unloading path is CG, and the dissipated energy in Equation (9) is equal to the area of curve ABCGA. If the area enclosed by curve ABCRA is the value of the input energy, then the damage variables of rock specimen is less than one.
As shown in Figure 12, under 60%, 70%, and 80% of , three stress upper limits occurred in the cyclic loading test. For the first 200 cycles, as the number of cycles increased, presented a trend of decreasing dramatically and then maintaining basically no change. The peak strain and both increased first and then tended to remain relatively constant. The reason for this is that when decreases and total input energy is unvarying, the dissipated energy used for the generation and development of inner rock fissures decreases, and as a result, the increases in the peak strain and both decrease.
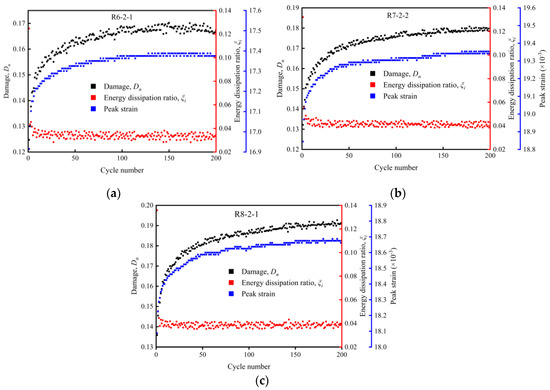
Figure 12.
The relationship of the rock specimen damage variable, energy dissipation ratio of a single cycle, peak strain, and cyclic number under three different kinds of stress upper limits in the cyclic loading and unloading test: (a) 60%, (b) 70%, and (c) 80% of .
Therefore, under the condition of not changing the lower limit of stress in the cyclic loading test, the influences of the cycle number (i.e., the peak strain) and the energy dissipation ratio of a single cycle () on the damage variable () are considered, which can better reflect the actual rock damage.
As shown in Figure 13 and Table 5, we statistically analyzed the relationship between the rock specimen damage variable under three different kinds of stress upper limit conditions in the cyclic loading test and the cycle number. We found that the damage variables, , of the rock specimens under 60%, 70%, and 80% of , the three stress upper limits, have a rather significant degree of distinction.
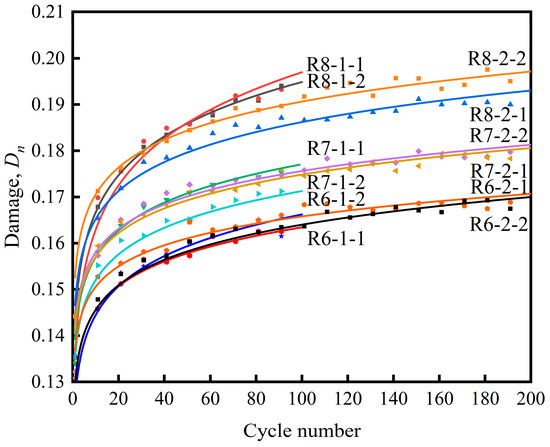
Figure 13.
The relationship between the rock specimen damage variable and cycle number under three different stress upper limits in the cyclic loading and unloading tests.

Table 5.
Rock specimen damage variable in the cyclic loading and unloading tests.
Under the 60% of stress condition, the damage variable average value after circulating for 100 times was 0.1622, and the damage variable average value after circulating for 200 times was 0.1675, which is an increase amplitude of 3.3%. Due to the stress level being much lower than the stress threshold of fatigue fracture, their damage variable growth is rather close.
Under the 70% of stress condition, the damage variable average value after circulating for 100 times was 0.1724, and the damage variable average value after circulating for 200 times was 0.1801, which is an increase amplitude of 4.5%. Due to the stress level being close to the stress threshold of the fatigue fracture, the damage variable growth curve has a certain discreteness at the beginning.
Under the 80% of stress condition, the damage variable average value after circulating for 100 times was 0.1952, and the damage variable average value after circulating for 200 times was 0.1936, which is a decrease in amplitude of 0.8%. This change is not significant. Because the stress level is higher than the stress threshold of the fatigue fracture, the damage variable growth curve displays a rather high level of discreteness.
Therefore, the uniaxial cyclic loading and unloading with a peak stress lower than the uniaxial compressive strength promotes microcrack development and new crack generation, increasing the inner damage of the rock such that it reduces the rock strength.
The damage variable of the rock specimen D had a significant corresponding relationship with the initial damage in the SPHB test. As shown in Figure 14 and Table 6; Table 7, the incident energy and the strain rate are basically consistent at the same impact pressure. As the rock specimen initial damage increases, the reflected energy gradually decreases, the transmission energy gradually increases, the dissipated energy gradually decreases, the damage variable D and the peak stress of the rock specimen both decreases almost linearly with initial damage .
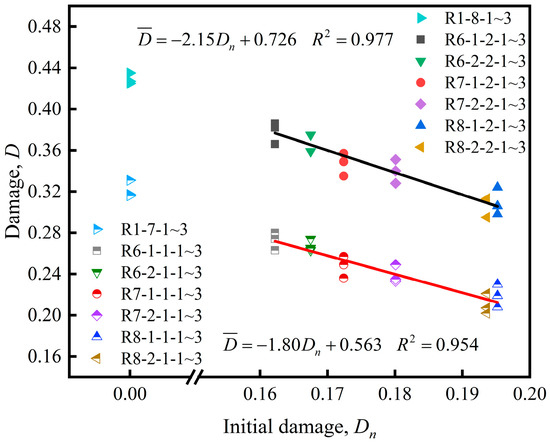
Figure 14.
The damage variable of rock specimen under different initial damage in the SHPB test.

Table 6.
The dissipated energy condition of the rock specimen under a 0.30 MPa impact pressure in the SHPB test.

Table 7.
The dissipated energy condition of the rock specimen under a 0.35 MPa impact pressure in the SHPB test.
In the SHPB test, the rock specimen was pressed between the incident bar and transmission bar, and the general destruction mode of the rock specimen is tensile splitting failure along the axial direction. The expansion and closing of the microcrack in the rock specimen is the main reason for the change of macromechanical characteristics under external load [41]. For the rock specimens with the initial damage (such as R6-1-1-1), before undergoing the SHPB test, they had already experienced a cyclic loading and unloading test, enabling the original cracks inside the rock specimen to be further expanded, thereby generating new cracks in the test process. In the SHPB test, the cracks in the rock specimen with initial damage further expanded, and even cut though, thereby damaging the specimen. Therefore, under the same impact pressure, the rock specimens with the initial damage were more susceptible to crack penetration than the rock specimen in the control group, namely, the dissipated energy ratio for rock specimens with initial damage is lower than that for rock specimens without initial damage (control group, e.g., R1-7-1), and the damage variable D is defined by the dissipated energy ratio, which gradually decreases as the initial damage increases.
Figure 15 shows the peak stress statistics of the rock specimen with different initial damage under 0.30 and 0.35 MPa impact pressures in the SHPB test. As the initial damage increased, the peak stress of the rock specimen gradually decreased, showing a linear tendency. As the initial damage increased from 0 to 0.1952 when the impact pressure was 0.30 MPa, the peak stress of the rock specimen decreased from 115.9 to 86.4 MPa. When the pressure was 0.35 MPa, the peak stress of the rock specimen decreased from 130.6 to 96.3 MPa. Under the same initial damage conditions, the peak stress of the rock specimens increased as the impact pressure increased.
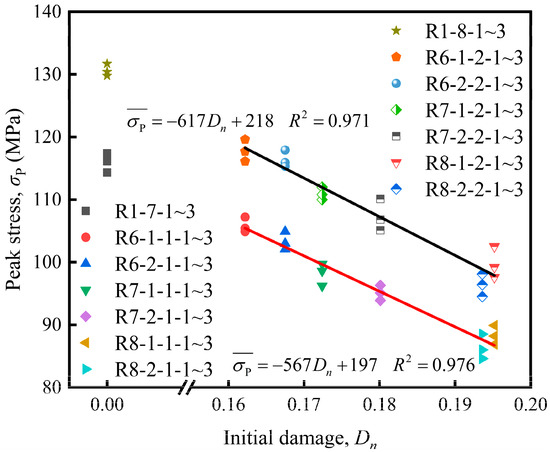
Figure 15.
The peak stress of rock specimen under different initial damage in the SHPB test.
4. Discussion
After comparing the fragment size of the rock specimens under different initial damage conditions in the SHPB test, as shown in Figure 16; Figure 17, we found that under the same impact pressure, as the initial damage increases, the fragment size of the rock specimen gradually increases. The energy consumed in expanding the rock specimen results in cracks, and the generation of new cracks gradually decreases, where the damage variable D gradually decreases. However, under the same initial damage condition, the increased impact pressure aggravates the breakage of the rock specimen.
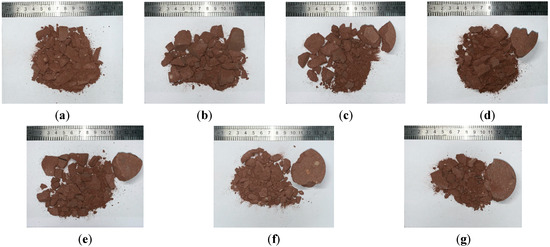
Figure 16.
The breakage conditions of the rock specimens under a 0.30 MPa impact pressure in the SHPB test: (a) R1-7-1, (b) R6-1-1-1, (c) R6-2-1-1, (d) R7-1-1-1, (e) R7-2-1-1, (f) R8-1-1-1 and (g) R8-2-1-1.
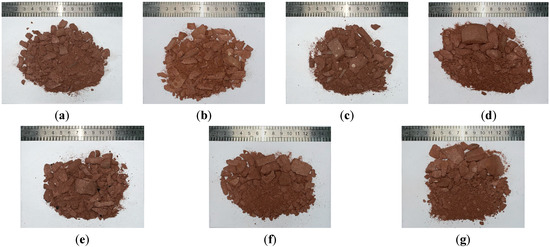
Figure 17.
The breakage conditions of the rock specimens under a 0.35 MPa impact pressure in the SHPB test: (a) R1-8-1, (b) R6-1-2-1, (c) R6-2-2-1, (d) R7-1-2-1, (e) R7-2-2-1, (f) R8-1-2-1 and (g) R8-2-2-1.
The rock specimen fragments, after undergoing the SHPB test, were screened and weighed with a classifying screen and electronic scale. The six-layer classifying screen divided the fragments into levels from a bigger size to a smaller size. The corresponding pore sizes were 15, 11, 8.5, 4, 2.5, and 1 mm. The particle distribution of the fragments for the levels was 15.0–50.0, 11.0–15.0, 8.5–11.0, 4.0–8.5, 2.5–4.0, 1.0–2.5, and 0–1.0 mm. Hence, the calculation formula of the average particle diameter of the rock specimen after breakage can be obtained [17]:
where i is the level of the classifying screen and i = 1,2,3,…,7; is the average particle size of the fragment of the classified fragments in each layer, which calculated with the average screen hole diameter of the upper and lower levels of the classifying screen; and is the ratio between the fragment quality at all levels and the total rock specimen quality M.
Comparing Figure 18; Figure 19, in the SHPB test under the same impact pressure, as the initial damage of the rock specimen increased, the average particle diameter of the rock specimen after breakage gradually increased, showing a positively correlated tendency. When the impact pressure was 0.30 MPa, increased from 9.95 to 23.37 mm, which in an increase in amplitude of 134.9%. When the impact pressure was 0.35 MPa, increased from 6.33 to 11.2 mm, which is an increase in amplitude of 76.9%, and the ratio between the fragment quality of the bigger particle diameter (15–50 mm) in the total rock specimen quality gradually increased. Under the conditions of the same initial damage , a higher impact pressure resulted in smaller rock fragment average particle diameters.
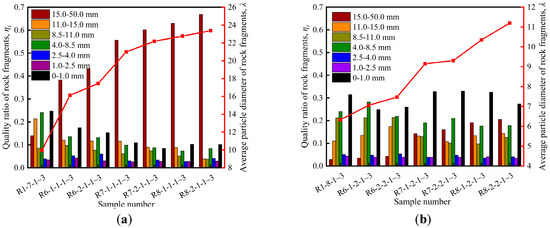
Figure 18.
The quality ratio of rock fragments at all levels, , and the average particle diameter of rock fragments, : (a) 0.30 and (b) 0.35 MPa.
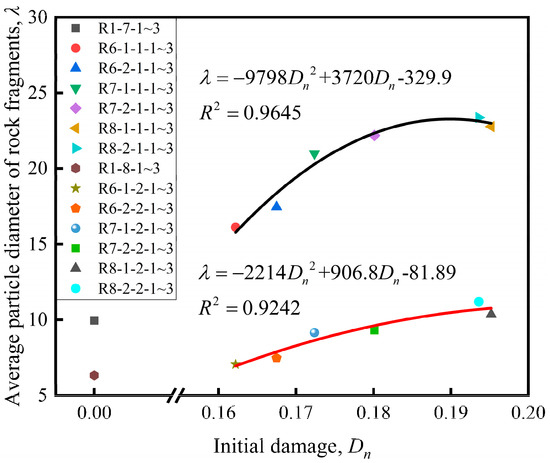
Figure 19.
The average particle diameter of rock fragments under different initial damage conditions.
If a lower impact pressure is adopted, the cracks that can be expanded by consuming lower energy have already cut through and damaged the rock specimen before the expansion and generation of other cracks. However, if a higher impact pressure is adopted, when the cracks that can cut through the rock specimen by consuming a lower energy further expand and develop, the rock specimen generates more cracks, so more energy is consumed in the rock specimen destruction process. In other words, under a rather high impact pressure, the dissipated energy of the rock specimen is relatively high and the average particle diameter of the rock fragments is rather slow. This is also the reason for the increase in the rock specimen damage and peak stress.
Therefore, we found that under cyclic loading, the rocks generate fatigue fractures and damage, reducing the rock strength. If the impact load is acted on such basis, rock with damage will more easily fail than rock without damage.
5. Conclusions
In this paper, uniaxial cyclic loading and unloading tests and SHPB tests are performed to analyze the energy dissipation conditions of red sandstone. Considering the circulation number, the upper and lower limits of the cyclic stress, and impact pressure (strain rate) of SHPB test, the damage characteristics of the red sandstone under the combined action of the uniaxial cyclic load and impact load was studied, and the following conclusions were drawn:
(1) Under the condition keeping the lower limit of the cyclic stress unchanged, the damage variable of the rock specimen redefined in the cyclic loading test simultaneously considers the influence of the energy dissipation ratio of the rock under single cycle and the circulation number, so that it better reflects the practical damage condition of the rock.
(2) Even though the loading stress is lower than the uniaxial compressive strength, the stress can still promote the development of microcracks and the generation of new cracks in the rock, increase the inner damage of the rock and reduces the rock strength. It is found that the peak strain of the rock specimen increases obviously with the number of cycles in the first 200 circulations, and the peak strain accumulation rate approaches zero if the number of cycles is more than 200. In the first 200 cycles, as the cycle number increases, the energy dissipation ratio decreases dramatically and then remains stable. Both the peak strain and the damage variable of the rock both increase first and then tend to become relatively constant.
(3) The damage variable of the rock specimen under the combined action of the uniaxial cyclic load and impact load has a significant corresponding relationship with the initial damage. The incident energy and the strain rate are basically consistent at the same impact pressure. As the initial damage of the rock specimen increases, the reflected energy gradually decreases, the transmission energy gradually increases, the dissipated energy gradually decreases, and both the damage variable and the peak stress of the rock specimen decreases almost linearly with initial damage.
(4) In the SHPB test under the same impact pressure, as the initial damage of the rock specimen increases, the average particle diameter of the rock specimen after breakage gradually increases, which shows a positively correlated tendency. Under the conditions of the same initial damage, a higher impact pressure resulted in smaller rock fragment average particle diameters.
Author Contributions
Conceptualization, Y.C. and H.W.; methodology, H.P. and K.Z.; data curation, F.J.; writing—original draft preparation, Y.W. and J.L.; writing—review and editing, Y.C. All authors have read and agreed to the published version of the manuscript.
Funding
This work was financially supported by National Natural Science Foundation of China (Grant Nos. 51974295, U1803118, 51974296).
Conflicts of Interest
The authors declare no conflict of interest.
References
- Wu, S.C.; Wu, Z.G.; Zhang, C.X. Rock burst prediction probability model based on case analysis. Tunn. Undergr. Sp. Tech. 2019, 93, 103069. [Google Scholar] [CrossRef]
- Yu, L.Y.; Zhu, Z.H.; Meng, Q.B.; Jing, H.W.; Jian, S.H.; He, M. Dynamic characteristics of marble damaged by cyclic loading. Explos. Shock Waves 2019, 39, 228–233. [Google Scholar]
- He, J.; Dou, L.M.; Cao, A.Y.; Gong, S.Y.; Lv, J.W. Rock burst induced by roof breakage and its prevention. J. Cent. South Univ. 2012, 19, 1086–1091. [Google Scholar] [CrossRef]
- Chen, Y.L.; Shimada, H.; Sasaoka, T.; Hamanaka, A.; Matsui, K. Research on exploiting residual coal around final end-walls by highwall mining system in China. Int. J. Min. Reclam. Env. 2013, 27, 166–179. [Google Scholar] [CrossRef]
- Kansake, B.A.; Frimpong, S.; Ali, D. Multi-body dynamic modelling of ultra-large dump truck-haul road interactions towards haul road design integrity. Int. J. Min. Reclam. Env. 2019, 1–23. [Google Scholar] [CrossRef]
- Kesimal, A.; Ercikdi, B.; Cihangir, F. Environmental impacts of blast-induced acceleration on slope instability at a limestone quarry. Environ. Geol. 2008, 54, 381–389. [Google Scholar] [CrossRef]
- Mohammadi Azizabadi, H.R.; Mansouri, H.; Fouché, O. Coupling of two methods, waveform superposition and numerical, to model blast vibration effect on slope stability in jointed rock masses. Comput. Geotech. 2014, 61, 42–49. [Google Scholar] [CrossRef]
- Han, L.; Shu, J.S.; Hanif, N.R.; Xi, W.J.; Li, X.; Jing, H.W.; Ma, L. Influence law of multipoint vibration load on slope stability in Xiaolongtan open pit mine in Yunnan, China. J. Cent. South Univ. 2015, 22, 4819–4827. [Google Scholar] [CrossRef]
- Liu, H.L.; Zhu, W.C.; Yu, Y.J.; Xu, T.; Li, R.F.; Liu, X.G. Effect of water imbibition on uniaxial compression strength of sandstone. Int. J. Rock Mech. Min. 2020, 127, 104200. [Google Scholar] [CrossRef]
- He, Q.Y.; Li, Y.C.; Xu, J.H.; Zhang, C.G. Prediction of mechanical properties of igneous rocks under combined compression and shear loading through statistical analysis. Rock Mech. Rock Eng. 2020, 53, 841–859. [Google Scholar] [CrossRef]
- Duan, H.Q.; Yang, Y.J. Deformation and dissipated energy of sandstone under uniaxial cyclic loading. Geotech. Geol. Eng. 2018, 36, 611–619. [Google Scholar] [CrossRef]
- Ning, J.G.; Wang, J.; Jiang, J.Q.; Hu, S.C.; Jiang, L.S.; Liu, X.S. Estimation of crack initiation and propagation thresholds of confined brittle coal specimens based on energy dissipation theory. Rock Mech. Rock Eng. 2018, 51, 119–134. [Google Scholar] [CrossRef]
- Cerfontaine, B.; Collin, F. Cyclic and fatigue behaviour of rock materials: Review, interpretation and research perspectives. Rock Mech. Rock Eng. 2018, 51, 391–414. [Google Scholar] [CrossRef]
- Lv, J.K.; Yang, Y.J.; Ning, S.; Duan, H.Q. The fatigue strength and failure mode of coal specimen subjected to cyclic loading. Geotech. Geol. Eng. 2019, 37, 2255–2266. [Google Scholar] [CrossRef]
- Wang, J.B.; Liu, X.R.; Liu, X.J.; Huang, M. Creep properties and damage model for salt rock under low-frequency cyclic loading. Geomech. Eng. 2014, 7, 569–587. [Google Scholar] [CrossRef]
- Yin, T.B.; Wang, P.; Yang, J.; Li, X.B. Mechanical behaviors and damage constitutive model of thermally treated sandstone under impact loading. IEEE Access 2018, 6, 72047–72062. [Google Scholar] [CrossRef]
- Li, M.; Mao, X.B.; Cao, L.L.; Pu, H.; Mao, R.R.; Lu, A.H. Effects of thermal treatment on the dynamic mechanical properties of coal measures sandstone. Rock Mech. Rock Eng. 2016, 49, 3525–3539. [Google Scholar] [CrossRef]
- Wang, P.; Xu, J.Y.; Fang, X.Y.; Wang, P.X. Energy dissipation and damage evolution analyses for the dynamic compression failure process of red-sandstone after freeze-thaw cycles. Eng. Geol. 2017, 221, 104–113. [Google Scholar] [CrossRef]
- Zhang, J.; Deng, H.W.; Deng, J.R.; Ke, B. Development of energy-based brittleness index for sandstone subjected to freeze-thaw cycles and impact loads. IEEE Access 2018, 6, 48522–48530. [Google Scholar] [CrossRef]
- Chen, Y.; Wu, P.; Yu, Q.; Xu, G. Effects of Freezing and Thawing Cycle on Mechanical Properties and Stability of Soft Rock Slope. Adv. Mater. Sci. Eng. 2017, 2017, 1–10. [Google Scholar] [CrossRef]
- Du, B.; Bai, H.B. A damage constitutive model of red sandstone under coupling of wet-dry cycles and impact load. Shock Vib. 2019, 2019, 1–12. [Google Scholar] [CrossRef]
- Lu, A.H.; Hu, S.C.; Li, M.; Duan, T.Z.; Li, B.; Chang, X.Y. Impact of moisture content on the dynamic failure energy dissipation characteristics of sandstone. Shock Vib. 2019, 2019, 1–10. [Google Scholar] [CrossRef]
- Gu, H.L.; Tao, M.; Wang, J.X.; Jiang, H.B.; Li, Q.Y.; Wang, W. Influence of Water Content on Dynamic Mechanical Properties of Coal. Geomech. Eng. 2018, 16, 85–95. [Google Scholar]
- Yin, T.B.; Zhang, S.S.; Li, X.B.; Bai, L. Evolution of dynamic mechanical properties of heated granite subjected to rapid cooling. Geomech. Eng. 2018, 16, 483–493. [Google Scholar]
- Liu, J.J.; Yang, M.; Wang, D.; Zhang, J.H. Different bedding loaded coal mechanics properties and acoustic emission. Environ. Earth Sci. 2018, 77, 1–11. [Google Scholar] [CrossRef]
- Wang, Z.L.; Shi, H.; Wang, J.G. Mechanical behavior and damage constitutive model of granite under coupling of temperature and dynamic loading. Rock Mech. Rock Eng. 2018, 51, 3045–3059. [Google Scholar] [CrossRef]
- Sun, B.; Zhu, Z.D.; Shi, C.; Luo, Z.H. Dynamic mechanical behavior and fatigue damage evolution of sandstone under cyclic loading. Int. J. Rock Mech. Min. 2017, 94, 82–89. [Google Scholar] [CrossRef]
- Lemaitre, J. A continuous damage mechanics model for ductile fracture. J. Eng. Mater. Technol. 1985, 107, 83–89. [Google Scholar] [CrossRef]
- Peng, R.D.; Xie, H.P.; Jv, Y. Analysis of energy dissipation and damage evolution of sandstone during tensile process. Chin. J. Rock Mech. Eng. 2007, 26, 2526–2531. [Google Scholar]
- Xie, H.P.; Jv, Y.; Dong, Y.L. Discuss on elastic modulus method of classical damage definition. Mech. Eng. 1997, 19, 1–5. [Google Scholar]
- Hou, R.B.; Zhang, K.; Tao, J.; Xue, X.R.; Chen, Y.L. A nonlinear creep damage coupled model for rock considering the effect of initial damage. Rock Mech. Rock Eng. 2019, 52, 1275–1285. [Google Scholar] [CrossRef]
- Liu, J.F.; Xie, H.P.; Hou, Z.M.; Yang, C.H.; Chen, L. Damage evolution of rock salt under cyclic loading in unixial tests. Acta Geotech. 2014, 9, 153–160. [Google Scholar] [CrossRef]
- Feng, J.J.; Wang, E.Y.; Shen, R.X.; Chen, L.; Li, X.L.; Xu, X.Y. Investigation on energy dissipation and its mechanism of coal under dynamic loads. Geomech. Eng. 2016, 11, 657–670. [Google Scholar] [CrossRef]
- Zhou, Y.X.; Xia, K.; Li, X.B.; Li, H.B.; Ma, G.W.; Zhao, J.; Zhou, Z.L.; Dai, F. Suggested methods for determining the dynamic strength parameters and mode-I fracture toughness of rock materials. Int. J. Rock Mech. Min. 2012, 49, 105–112. [Google Scholar] [CrossRef]
- Li, X.B.; Zhou, Z.L.; Zou, Y. Measuring dynamic stress-strain curve of rocks with SHPB. In Proceedings of the 1st International Conference on Rock Dynamics and Applications (RocDyn)—State of the Art, Lausanne, Switzerland, 6–8 June 2013; Zhao, J., Li, J., Eds.; CRC Press-Taylor & Francis Group: London, UK; pp. 179–184. [Google Scholar]
- Wu, N.; Liang, Z.Z.; Zhou, J.R.; Zhang, L.Z. Energy evolution characteristics of coal specimens with preformed holes under uniaxial compression. Geomech. Eng. 2020, 20, 55–66. [Google Scholar]
- Song, S.L.; Liu, X.S.; Tan, Y.L.; Fan, D.Y.; Ma, Q.; Wang, H.L. Study on Failure Modes and Energy Evolution of Coal-Rock Combination under Cyclic Loading. Shock Vib. 2020, 2020, 5731721. [Google Scholar] [CrossRef]
- Zhang, Z.Z.; Deng, M.; Bai, J.B.; Yu, X.Y.; Wu, Q.H.; Jiang, L.S. Strain energy evolution and conversion under triaxial unloading confining pressure tests due to gob-side entry retained. Int. J. Rock Mech. Min. 2020, 126, 104184. [Google Scholar] [CrossRef]
- Nikolić, M.; Do, X.N.; Ibrahimbegovic, A.; Adnan, I.; Nikolić, Z. Crack propagation in dynamics by embedded strong discontinuity approach: Enhanced solid versus discrete lattice model. Comput. Methods Appl. Mech. Eng. 2018, 340, 480–499. [Google Scholar] [CrossRef]
- Wang, P.; Yin, T.B.; Li, X.B.; Zhang, S.S.; Bai, L. Dynamic properties of thermally treated granite subjected to cyclic impact loading. Rock Mech. Rock Eng. 2019, 52, 991–1010. [Google Scholar] [CrossRef]
- Grady, D.E.; Kipp, M.E. Continuum modelling of explosive fracture in oil shale. Int. J. Rock Mech. Min. 1980, 17, 147–157. [Google Scholar] [CrossRef]
© 2020 by the authors. Licensee MDPI, Basel, Switzerland. This article is an open access article distributed under the terms and conditions of the Creative Commons Attribution (CC BY) license (http://creativecommons.org/licenses/by/4.0/).