Featured Application
The article highlights the huge potential for energy saving in the building stock in the Mediterranean region and analyzes the parameters and possibilities for their upgrade to zero energy facilities.
Abstract
This article aims to present the results from studies on the energy performance upgrade of buildings and facilities located in Crete, Greece, in a typical Mediterranean climate. In Mediterranean islands, the most buildings remain uninsulated, classified in C or even lower energy performance rank. In this article four reference buildings and one sports facility are investigated: a residential building, a municipality building, a school building, a museum and the Pancretan Stadium. Detailed calculations based on the computational simulation of each examined facility were executed, giving accurate results on the heating and cooling loads, both for the existing conditions and after the integration of the proposed passive measures. Thorough dimensioning and energy calculations have been executed for specific active energy systems too, particularly proposed for each examined case. With this parametric approach, the article indicates the effect and the economic efficiency of the proposed active or passive measures for each examined facility, expressed with specific key performance indicators. The common conclusion for all investigated cases is the huge margin for energy saving, which can reach 65% with regard to the existing annual consumptions. The payback period of the introduced energy upgrade measures can be as low as 15 years.
1. Introduction
1.1. Energy Performance Upgrade of Buildings and Facilities in Mediterranean Climate
Mediterranean climate is characterized with mild winters and cool summers, especially as far as the insular territories are concerned. Minimum winter temperatures rarely fall below 0 °C, with most frequent minimum values above 5 °C. On the other hand, the normal peak daily temperature during summer ranges around 30 °C, due to the cool sea-blowing winds [1,2], apart from some very specific regions, mainly in the eastern Mediterranean basin (Cyprus and Middle East) and the north of Africa. These seasonally fluctuating mild climate conditions result to the configuration of moderate, yet absolutely certain, heating and cooling loads of buildings. In most Mediterranean regions, these loads are exclusively restricted during winter and summer, respectively. In spring and autumn, the outdoor climate conditions are quite close to the indoor space thermal comfort conditions, eliminating any needs for indoor space active conditioning [3,4].
Yet, despite this favorable climate background, the energy consumption in buildings in the Mediterranean region remains disproportionally high, mainly because of the inadequate insulation of the existing buildings’ envelope, regarding both the opaque and the transparent surfaces. This is clearly depicted in Figure 1 [5]. In this Figure, the annual specific energy consumption for heating per m2 of indoor conditioned space covered area is depicted for several insulated and uninsulated buildings in Denmark, Finland, Greece, Poland and Switzerland. It is clearly seen that there are uninsulated buildings in Greece which exhibit higher annual energy specific consumption for heating than insulated buildings in Denmark, in Finland and in Switzerland, namely in countries with considerably colder climates.
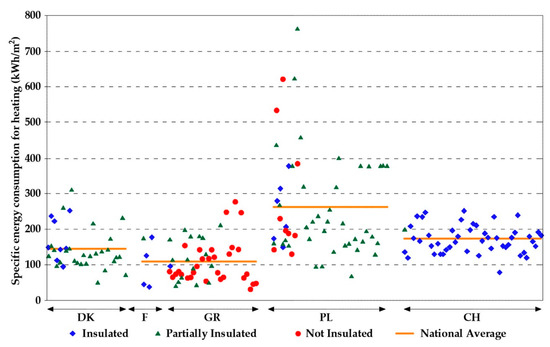
Figure 1.
Specific energy consumption for indoor space heating in five different countries and for different buildings regarding their insulation adequacy [5].
Given the above inadequate situation in the Mediterranean basin, a significant effort has been initiated during the last two decades from the National States to support the energy performance upgrade of buildings for both the residential and the industrial—commercial sector. This is practically realized with specific funding calls for the insulation of the buildings’ envelope and the replacement of old and low-efficiency air conditioning and lighting systems. This effort has been supported and accompanied with a large number of innovative systems and methods from the academic community and the technological stakeholders involved in the design and the commercial production of relevant products. It is truly impossible to present all the achievements of these last two decades, maybe even the advancements on the various topics of the very recent years. Hence, in the next paragraphs of this introductory section, only some indicative recent references will be provided, which, in no case, should be considered as exhaustive, aiming just to provide a general image on the field of the buildings’ energy performance upgrade.
Firstly, a major parameter is the global warming trend of the plant, due to the climate change, and how this can affect the energy consumption for indoor space conditioning, especially in warm climates, like the Mediterranean. The effect of the evolved climate change is investigated in [6] for two different time periods, in the middle and at the end of the 21st century. Certain warmer ambient temperature profiles are introduced, under two emission scenarios, RCP4.5 and RCP8.5. The results show clear reduction on the heating demand and definite increase on the cooling demand. The most effective measures against the latter trend are proved to be increased insulation (thicker insulating layers or materials with lower thermal conductivity factor) and reduction in air infiltration.
A favorite topic in the relevant literature is the energy performance evaluation and upgrade of school buildings. This can be justified because school buildings represent a high percentage of public buildings. The total number of school building only in mild Mediterranean climates is estimated at 87,000 [7]. Additionally, many school buildings operate with significant thermal discomfort and without any heating strategy, due to economic restrictions [8]. The energy upgrade of school buildings has been investigated in several articles. Two of them [9,10] examine this topic for warmer and colder climate in Greece and Spain, respectively. The introduction of all the possible passive measures is examined and a variety of potential active measures for indoor space conditioning, lighting and energy management. Both articles conclude that the achieved saving on the consumption of non-renewable primary energy sources can be at the range of 65% and the reduction on CO2 annual emissions can exceed 70%. The introduction of the appropriate essential passive measures in school buildings (insulation, openings replacement, shadings) can lead to annual reduction of the heating the cooling demand of 17.7% and 15.9% respectively, with a total specific set-up cost of 146 €/m2 [7].
Green rooves constitute a special passive measure, despite the fact that we find its origin in the traditional architecture from the southern to the northern geographical latitudes [11]. The installation of green rooves is investigated for a typical office building under warm Mediterranean climate in Cyprus [12] and a typical for residential buildings in Catania, Sicily [13]. The results showed that a primary energy annual saving of 25% for heating and 20% for cooling is achieved for the office building in Cyprus. The case studies executed in Sicily resulted to annual energy saving between 31% and 35% for cooling and between 2% and 10% for heating. Green rooves, apart from the achieved energy saving, also exhibit significant environmental benefits. In Sicily, for example, the annual saving on the CO2 and NO2 emissions, due to the installation of green rooves, was estimated to be equal to 1.35 kg/m2 and 0.03 kg/m2 respectively [13].
A special parameter which can significantly affect the final thermal energy consumption both for heating and cooling is the air infiltration, mainly due to inadequately sealed openings. It has been shown that the contribution of air infiltration on the total final energy specific consumption can be between 2.43 kWh/m2 and 16.44 kWh/m2 for heating and between 0.54 kWh/m2 and 3.06 kWh/m2 for cooling [14], basically dependent on three major parameters: the location of the building in urban, countryside, mountainous or coastal environments, the climate zone and the quality of the installed openings, configured essentially by the used material and the achieved airtightness between the opened and the fixed frame of the opening.
Regarding the active energy systems, an integrative research has been accomplished and presented in [15]. In this work, alternative heating systems are investigated, based on the use of diesel oil, natural gas, biomass pellets and electricity, consumed either in panel heaters, infrared heaters, radiative heaters, electric boiler, electrical fireplace or in air-to-air or air-water heat pumps. The work is also expanded in all four different climate zones established for the Greek territory, starting from the warmest zone A (southern insular territory) and ending at the northern and coldest regions in Western Macedonia (zone D). The results indicated were evaluated on the achieved total life cycle cost. Heat pumps were proved to be the most cost-effective solutions for zone A, while, for the colder climates in northern Greece (Western Macedonia), the use of biomass pellets was proved to be the optimum approach.
Particularly, old and inefficient air-to-air heat pumps, used for indoor space cooling, are proposed to be replaced with new, with the seasonal energy efficiency ratio (EER) being between 3.2 and 4.8. This intervention can lead to an annual primary energy saving of up to 16% [16]. Even higher EER values can be achieved with the installation of geothermal source heat pumps [17,18]. In this case, the most cost-effective layout is the installation of an open-loop geothermal system, in case of the availability of an underground aquifer. The achieved annual primary energy saving can be from 25% to 75%. In case of a lack of aquifer, of course the installation of closed loop geothermal heat exchangers constitutes an alternative solution with similar annual energy saving percentages, yet with higher set-up costs [19].
A special geothermal heat pumps application is the swimming pools heating. In this case, the high heating demand creates a highly favorable application field for the introduction of geothermal heat pumps [20]. Given the fact that in most cases swimming pools heating is still based on conventional heaters operating with diesel oil, the payback period of a geothermal heat pump can be as low as three years, accounted on the avoided diesel oil procurement cost [21].
Solar collectors have also been proposed and studied, starting from the installation of simple flat plate collectors for hot water production [22] to advanced systems, involving solar-combi systems for hot water production and indoor space heating [23,24,25], solar cooling with absorption chillers [26] and the newly introduced hybrid solar thermal photovoltaic panels for combined electricity and thermal energy production [27,28]. Solar-combi systems exhibit excellent applicability under the rich available solar radiation in the Mediterranean basin. They can be introduced either with flat-plate collectors or vacuum tubes to undertake the heating loads of residential, commercial, public and educational buildings and the swimming pools heating. In case of combined operation with a biomass heater, the heating load is totally covered with renewable energy sources (RES). In this way, any primary energy source consumption is totally eliminated.
A special case of active energy systems is the combined heat and power cogeneration systems. In case of biomass fuel, both electricity and thermal energy needs can be covered with renewable energy sources, exhibiting a total efficiency higher than 85% [29,30]. Such systems can be introduced for residential [29] and commercial [30] buildings, sports facilities, hospitals etc., implemented either with small compact steam turbines, or with biomass gasification units and internal combustion engines. Their feasibility seems higher in colder climates, where higher heating needs are met, even though they can be combined with absorption chillers for cooling production. They also seem to be ideal for swimming pools, where heating is required during the whole annual period.
Lighting needs in commercial and residential buildings constitute the second most important need in raw consumption sector after indoor space conditioning. With an installed lighting power density of 10 W/m2 to 30 W/m2, the annual electricity consumption for a commercial building can be from 20 kWh/m2 to 25 kWh/m2 [31]. The contribution of natural lighting can be significant towards the reduction of the consumed primary energy sources for the lighting needs coverage of indoor space. The annual electricity consumption saving with the proper orientation of the building’s openings and the exploitation of natural lighting can be from 40% to 80% in commercial buildings, depending mainly on required lighting luminosity [32].
Finally, in a more advanced and sophisticated approach, smart buildings can incorporate smart energy management systems, smart metering, decentralized energy storage devices and decentralized production [33]. Being integrated within smart grids, apart from electricity and thermal energy saving, they can also contribute to the reduction of the energy procurement cost, approached from several alternative directions: power peak demand shaving, improvement of energy use efficiency, direct load curtailment, decentralized production and storage and involvement in the electricity liberalized wholesale market [34,35].
The aforementioned literature survey can only be considered as indicative. The amount of work accomplished in this particular field is huge and impossible to be covered within the available space of the introductory section. Nevertheless, this literature survey aims to provide a general, yet clear, image of the most popular technologies, systems and methods employed towards the energy performance upgrade of buildings. As already underlined, in no case should it be considered exhaustive.
1.2. Scope of the Article
The present article gathers and presents, in a comprehensive approach, the methodologies, the occupied active and passive measures and the results obtained from the energy performance upgrade of five buildings in Crete, which are:
- a residential detached building at the town of Heraklion;
- a school building at the town of Rethimno;
- the municipality building of the town of Rethimno;
- the Natural History Museum of Crete (NHMC), at the town of Heraklion;
- the Pancretan Stadium, the biggest sports facility in Crete, at the town of Heraklion.
With the aforementioned investigated cases, five fundamental buildings’ categories in a typical insular Mediterranean urban environment are covered. Their locations are depicted in Figure 2.
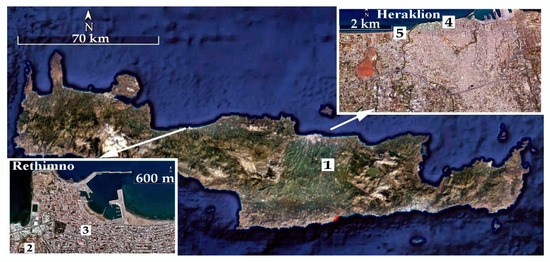
Figure 2.
The location of the investigated buildings in the towns of Heraklion and Rethimno.
The scope of this article is to present and compare a series of passive and active measures introduced in these different building categories, currently of different energy performance ranks, located in a typical Mediterranean climate. In a sense, it could be considered as a review article, yet, with specific innovation points regarding the introduced active energy systems in the investigated buildings. The strong point of the article is the comparative investigation of buildings with different uses and different current energy performance ranks, through which the contribution and the technical and economic feasibility of each cluster of applied interventions towards energy performance upgrade is evaluated. Conclusions will be made on the energy saving contribution and the cost-effectiveness of each type of measure for each alternative examined type of building and existing energy performance rank, evaluated with the calculation of typical key performance indicators.
2. Energy Consumption in the Examined Buildings
Table 1 summarizes the U-factors of the constructive elements of the examined buildings’ envelope. Most of them are old buildings, constructed without any specific insulation regulations. Hence, they remain uninsulated, exhibiting quite high U-factors. It should be underlined, that according to the Greek Directive on Buildings’ Energy Performance [36], the maximum permissible U-factors for Crete (A climatic zone) are 0.45 W/m2K for rooves, 0.55 W/m2K for vertical opaque surfaces and 2.8 W/m2K for openings. As seen in Table 1, only the residential building exhibits U-factors close or below the maximum permissible for its constructive elements. For all the other examined buildings and facilities, the opaque vertical and horizontal surfaces remains uninsulated, apart from the municipality building’s roof. Additionally, all the openings are with aluminum frame without thermal brake, very bad airtightness and single or double glazing, exhibiting very high U-factors. The different U-factors presented for the same constructive elements of a building refer to different constructive synthesis of the same element at different parts of the building. For example, the NHMC building constitutes a synthesis of an old construction, set up with physical stone walls, and a new one, constructed with synthetic materials [37].

Table 1.
U-factors of the examined buildings’ envelope constructive elements.
In Table 2, fundamental features regarding the size, the occupants, the thermal comfort conditions and the operation schedule of each examined building are presented. These features are annually averaged for all buildings. For example, for the school building, there is no use and no occupants during July and August. Additionally, the number of visitors in NHMC increases gradually from January to August and vice versa. Furthermore, the number of users in the Pancretan Stadium presented in Table 2 is the total average number per day. This number varies for the different sports halls and the swimming pools center. Conclusively, it must be understood that the figures presented in Table 2 are average values, shown indicatively to offer a picture for the size and the usage of the examined buildings. Behind these figures, there is a detailed analysis for all the examined buildings, regarding all these parameters involved in the heating and cooling loads calculation. For the case of NHMC and the Pancretan Stadium, the accomplished works have been published in detail in former articles [38,39], hence, thorough information can be retrieved from these.
Table 2.
Fundamental features regarding the size, the occupants, the thermal comfort conditions and the operation schedule of the examined buildings.
The above presented data are used for the calculation of the annual indoor space heating and cooling loads in the investigated buildings. All buildings were computationally simulated, by introducing their profile in TRNSYS (Transient System Simulation Tool), along with all the aforementioned operating and thermos-physical parameters. Typical meteorological data regarding the ambient temperature, the global horizontal irradiance, the wind velocity and the ambient relative humidity were also employed. For space economy reasons, the reader is kindly requested to seek the adopted meteorological data in [37,38].
The developed TRNSYS logical diagram is presented in Figure 3. As seen in this Figure, firstly, the climate data are introduced in the form of annual time series with hourly average values with the sub-routine “weather”. The incident solar radiation is then calculated on vertical surfaces with 8 different fundamental orientations with the sub-routine “8 surfaces” (southern, northern, southeastern, northwestern etc.) and on horizontal surfaces, with the sub-routine “horizontal”. The long-wave radiation loss in the space is finally calculated with the “sky temperature” sub-routine. The building’s geometry, orientation and qualitative features are introduced with the “building” sub-routine, where the main heating and cooling load calculations are also executed. The results of the process are presented in the form of graphs and in the form of output text files with the “OUTPUT” sub-routine. The structure of the introduced TRSNSYS logical diagram is obvious and simple. It has been validated with its application in tens of studies on buildings’ energy performance evaluation and the comparison of the computational results, with the real diesel oil or electricity annual consumptions for the heating and cooling load coverage.
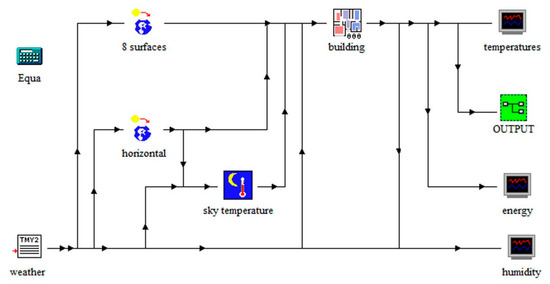
Figure 3.
The introduced logical diagram in TRNSYS (Transient System Simulation Tool) for the simulation of the buildings’ thermal performance.
The annual heating and cooling loads were calculated in the form of annual time series with average hourly values. They are presented in Figure 4 for all the examined buildings. From these figures we can observe:
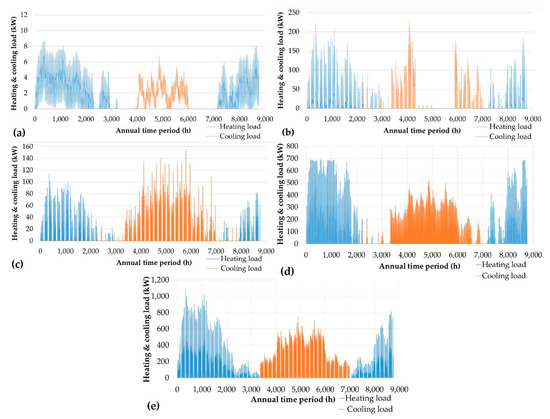
Figure 4.
Annual fluctuation of the heating and cooling loads in the examined buildings and in the existing situation ((a): residential building, (b): school building, (c): municipality hall, (d): NHMC, (e): Pancretan Stadium).
- The high heating load and the relatively low cooling load for the residential building, which is located in higher absolute altitude in the mainland of the island, namely in more harsh weather conditions during winter.
- The cooling loads are null for two months in the summer for the school building because it remains inoperative. Sensibly, the main indoor space conditioning demand is heating.
- The considerably higher cooling load of the municipality building, compared to the heating load, a common feature for a public or a municipal administrative building in Mediterranean climates.
- The annual thermal peak demand for heating is higher than for cooling in NHMC and in Pancretan Stadium, due to their vicinity with the coastline and their exposure to strong northwest winds during winter.
The results presented in Figure 4 are also presented in tabular format on a monthly aggregated basis in Table 3, levelized per m2 of indoor conditioned space. It is clarified that these results refer only to the final heating and cooling loads. These loads are covered with the following means and energy sources:
Table 3.
Heating and cooling loads monthly analysis, levelized per m2 of indoor conditioned space, for the examined building in the existing operation.
- remote air-to-air split units for the residential building, for both heating and cooling;
- a central heating system supplied by a diesel oil burner and remote, air-to-air split units exclusively for cooling, for the school building and the municipality building;
- electrical resistances for heating in the municipality building;
- a central variable air volume (VAV) system supplied by a central air-to-air heat pump for the NHMC for both heating and cooling;
- remote, autonomous air-to-air heat pumps units, particularly for heating of offices in the Pancretan Stadium, while the sports halls remain unconditioned during winter;
- a central chiller for the cooling of all the conditioned indoor space in the Pancretan Stadium.
According to the aforementioned, the only energy sources consumed in the examined buildings are electricity, in all of them, and diesel oil for indoor space heating in the school building and the municipality building. Diesel oil is also consumed for the swimming pools’ heating and hot water production in the Pancretan Stadium. These are the main final energy uses in the examined buildings. Apart from these uses, electricity is sensibly consumed for indoor space lighting and the operation of the commonly met electrical and electronic devices in the examined types of buildings. Among them, of considerable contribution in the annual energy consumption is the electricity consumed for the indoor and outdoor space lighting in the Pancretan Stadium. Finally, as already mentioned above, there is no heating distribution for the sports halls in the Pancretan Stadium, regardless of the existence of certain heating loads, as shown in Figure 4. This is exclusively for economy reasons. Hence, there is a definite thermal discomfort in the stadium in its current operation, as far as the sports halls heating is concerned.
All these final energy consumptions were, in detail, calculated for each one of the examined buildings. For example: all the involved technical specifications of the existing heating and cooling active systems were introduced: efficiency of the central heaters, the heating distribution network and the radiators, coefficient of performance (COP) and EER curves for the employed heat pumps versus the ambient temperature. Additionally, all the existing indoor and outdoor lighting apparatus was listed, along with the nominal electrical power consumption of the installed bulbs and the daily operation schedule for each one of them and for the whole annual period. For further details on the adopted methodology for the calculation of the current electricity and diesel oil consumption in the NHMC and the Pancretan Stadium, please refer to [37,38]. Similar approaches are also applied for the other three buildings.
In Table 4, the calculated annual primary energy consumptions are presented for the existing operation of the examined buildings. The results presented in Table 4 reveal the current energy status in the examined buildings. Before analyzing the results in Table 4, it should be clarified that the percentage shares of each consumption are calculated only for the active electricity consumptions (reactive electricity consumptions are not included).
Table 4.
Primary energy consumptions in the examined buildings in their current operation.
The only building that exhibits an acceptable energy performance is the residential building. This is because it is a new building, constructed according to the relevant insulation directives. New or renovated residential buildings in Mediterranean countries are gradually aligned with the national insulation directives. Particularly regarding the hot water consumption, it is estimated that the required final thermal energy is 60% covered by solar collectors, hence, the primary energy consumption presented in Table 4 only refers to the electricity consumption for the coverage of the rest of the 40%.
All other buildings fall into the D or even E energy performance rank. For the four of the examined buildings the highest energy consumption comes from indoor space heating and cooling, with annual percentage shares from 65% to 72% over the total active primary energy consumption. Only for the Pancretan Stadium is the indoor space heating and cooling not the most important energy consumption. Instead, the lighting needs, essentially configured by the outdoor space needs, have almost an equal electricity consumption percentage with the electricity annually consumed by the pumps and circulators of the irrigation and the hot water distribution hydraulic networks (other consumptions). Significant reactive electricity consumption is also calculated for the NHMC and the Pancretan Stadium, due to the frequent switches on and off of the motors for the air conditioning and the water distribution system, respectively.
The proposed interventions towards the energy performance upgrade of the examined buildings should precisely focus on the energy saving for the most energy consuming processes; namely the indoor space heating and cooling, the lighting and the reactive power compensation.
3. The Proposed Passive Energy Systems
The proposed energy performance upgrade measures for the examined buildings should focus on the most energy consuming applications, which, for the four of the examined buildings, are the indoor space heating and cooling and the indoor and outdoor space lighting. Significant energy consumption is also met in Pancretan Stadium for hot water production and the swimming pools’ heating. The reduction of heating and cooling loads was approached with both the introduction of passive measures adapted to the conditions met at each building and the upgrade of the existing air conditioning active systems.
Regarding passive measures, full buildings’ envelope insulation (vertical and horizontal opaque surfaces) and the replacement of existing ineffective openings was proposed for the School Building, the municipality building (apart from the already insulated roof) and the NHMC. The scope of the introduced passive measures in the buildings’ envelope is to meet the requirements of the relevant Directive on Buildings’ Energy Performance (see Section 2) [36]. The installation of external insulation is specifically proposed, in order to minimize the disturbances on the regular operation of the buildings. Specifically, the installation of 7 cm thickness extruded polystyrene with thermal conductivity factor lower than 0.035 W/mK can ensure the achievement of the required U-factors for both the vertical and the horizontal opaque surfaces. The applied insulation layout for vertical and horizontal surfaces is presented in Figure 5. The proposed insulation technique is a widely used one in the Mediterranean basin, and not only, which ensures cost-effective and quick applicability, through the availability locally of the required materials and of experts specialized on the installation process.
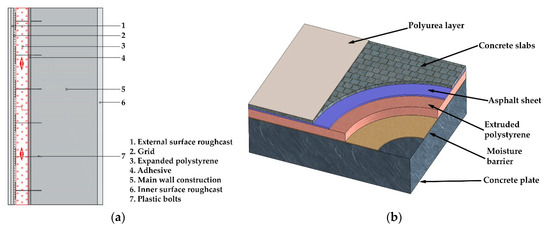
Figure 5.
(a) Construction layout of external insulation on vertical surfaces. (b) Construction layout of external insulation on horizontal surfaces.
Additionally, openings with synthetic frames are proposed, equipped with thermal brake and double-glazing with 6 mm glass thickness and 12 mm air gap between them. With these technical specifications, total U-factors between 1.7 W/m2K and 2.4 W/m2K are achieved, depending on the geometry of each opening. To avoid any deterioration of the buildings’ aesthetics and architectural identity and to minimize the set-up cost of the proposed interventions and any potential disturbances on the buildings’ regular operation, no modification of the existing openings area was examined.
Specific openings at the western and the southern vertical surfaces of the residential building have a negative impact on the indoor space overheating during summer, through direct solar gains, leading also to degraded lighting conditions due to the direct solar radiation penetration in the building and the causing of the optical blur effect. To treat this inadequacy, the construction of permanent, outdoor horizontal overhangs is proposed for all the openings at the western and southern vertical surfaces in the building. In this way, the contribution solely of shading interventions on the cooling loads reduction of a building with adequate insulation and acceptable energy performance rank (B+) is investigated, justifying the role of this particular case study in the article.
The size and the position of these overhangs are in detail studied, following the essential principles of solar geometry [39,40], aiming at the openings’ total shading from the 10th of May until the 20th of September. The final dimensioning and positioning of the horizontal overhangs, presented in Figure 6, can be considered as typical for locations with geographical latitudes around 35°, aiming at the indoor space shading during the aforementioned period. As seen in Figure 6, the opening is totally shaded for solar heights higher than 32°. The solar height becomes lower than 32° at 10:00 a.m. and at 17:00 p.m. on the 20th of September and at 9:00 a.m. and at 18:00 p.m. on the 10th of May.
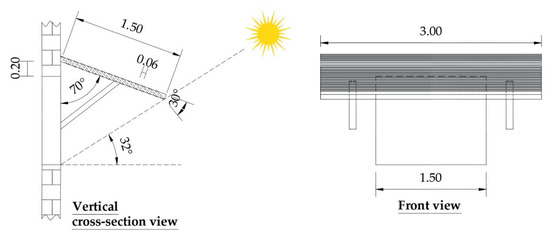
Figure 6.
Typical dimensioning and positioning of horizontal overhangs for adequate indoor space shading from the 10th of May until the 20th of September for geographical latitudes at 35°.
Speaking of shading, a special treatment is required for the municipality building and, particularly, for the Municipal Board conference hall. As shown in Figure 7a, this hall is extended in two floors (first and second) with a transparent southern surface of 22.80 m × 5.90 m = 134.52m2. This surface has a considerable contribution on the cooling loads of the specific hall, while, on the other hand, it constitutes a characteristic feature of the building’s architecture, hence, it was requested not to abolish it. The solution is presented in Figure 7b. All the existing glazing will be replaced with new with high reflectivity, while the currently existing aluminum frame will also be replaced with synthetic. Additionally, vertical banners will be placed during the summer months, advertising the cultural events of the local Municipality or cultural clubs, also providing natural shading on the transparent surface.
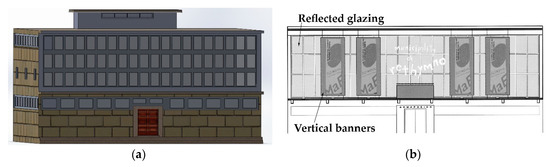
Figure 7.
(a) Here, a 3D view of the municipality building with the southern oriented Municipal Hall. (b) Proposed shading measures of the Municipal Hall southern oriented transparent surface.
Despite the inadequate insulation of the external walls in the Pancretan Stadium, no insulation installation was proposed for two main reasons. Firstly, because almost all sports halls and all the offices are hosted in the first floor of the Stadium, which is semi-basement. Hence, roughly half of the vertical external surfaces are in contact with the ground, instead of the ambient environment, exhibiting, thus, considerably reduced thermal losses. Secondly, the remaining vertical surfaces, which are exposed in the ambient environment, are mostly covered with windows. Consequently, instead of the insulation installation, the replacement of the existing openings is proposed.
From the aforementioned presentation, it is seen that rather typical passive measures are proposed. This is because all the investigated cases refer to already existing and operating buildings, with restrictions of different nature on the potentially applied interventions. For example, some of these buildings are old, like the western half of the NHMC (1920) and the municipality building (1950), so the outdoor passive interventions should be selected and applied with respect to their already configured architectural identity through the decades. Additionally, all of them are integrated inside the urban environment, so there were also several practical restrictions regarding the introduction of passive interventions in the surroundings (e.g., planting of deciduous trees at the northern sides of the buildings for shading during summer). Finally, the introduction of more sophisticated passive solar systems, such as a Trombe wall, a solar greenhouse or a solar chimney, would require considerable destructive works on the existing buildings’ envelope and would impose significant disturbances on their daily use, also increasing the set-up cost of the overall proposed measures, without adding significantly to their energy performance upgrade.
4. The Proposed Active Energy Systems
The introduced active measures are different from the one building to the other, depending on the size of the heating and cooling loads and the existing infrastructure. For the residential building, given its small size and the lack of any central heating and cooling system, only the replacement of the existing remote split-units with new, split air-to-air heat pumps, with higher COP and EER values, can be proposed as a feasible measure.
In the municipality building, the following active measures are proposed:
- the replacement of the existing diesel oil burner with a new, biomass burner, for the heating load coverage;
- the replacement of all the existing remote split units with a central air-to-air heat pump and the installation of a variable refrigerant volume (VRV) cooling distribution network;
- the replacement of all the existing lighting systems and bulbs with new, energy-efficient ones and the installation of a central building management system (BMS) for the automatic operation of the lighting system.
Typical COP and EER curves for air-to-air VRV heat pumps are given in Figure 8, retrieved from a commercially available model.
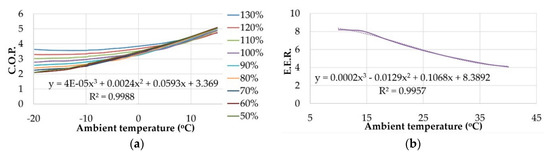
Figure 8.
(a) Typical coefficient of performance (COP) curves for a commercial, air-to-air variable refrigerant volume (VRV) heat pump model. (b) Typical energy efficiency ratio (EER) curves for a commercial, air-to-air VRV heat pump model.
The same measures are also proposed for the school building, apart from the installation of the VRV heat pump and distribution network, because of the low cooling needs of the building, given its limited operation during the summer period. Instead of the central VRV heat pump, the replacement of the existing air-to-air heat pumps is proposed with new, equipped with inverter and exhibiting higher COP and EER values.
The size of the Pancretan Stadium and the NHMC, the corresponding heating and cooling loads and the vicinity of both facilities to the coastline, create highly favorable prerequisites for the installation of open loop geothermal system. Corresponding COP and EER curves for geothermal heat pumps are given in Figure 9.
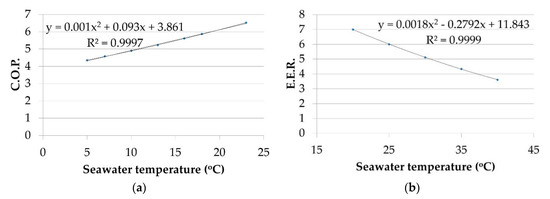
Figure 9.
(a) Typical COP curves for a geothermal heat pump. (b) Typical EER curves for a geothermal heat pump.
The overall layout of the introduced geothermal system in NHMC is indicatively presented in Figure 10. A similar layout has also been applied in the Pancretan Stadium.
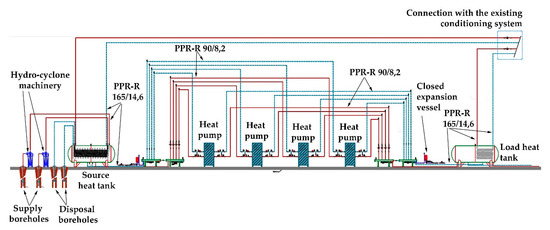
Figure 10.
Construction and operation layout of the proposed open loop geothermal system.
According to Figure 10, seawater is pumped through two boreholes and led to two hydro-cyclones to remove any solid particles. Through a closed loop, it is passed from the source heat tank, where thermal energy is removed from the seawater in winter or disposed in the seawater in summer, before it is returned back to the aquifer. In heating mode operation, a secondary closed loop is used to transfer the supplied thermal energy from the source heat tank to the geothermal heat pumps, at which, it is pumped to be provided for the next in sequel closed loop, through which warm water will be stored in the load heat tank, from which it will be finally distributed in the conditioned indoor space. The reverse operation is executed during cooling mode. Heat pumps dispose heat in the source heat tank, returning cool water in the load heat tank.
The above presented geothermal system is combined with hybrid photovoltaic thermal panels, in the case of NHMC, constituting a major innovation of the proposed cluster of energy performance upgrade measures. The overall layout is presented in Figure 11. As seen in this figure, during winter, the removed heat from the hybrid photovoltaic thermal panels is supplied to the load heat tank of the geothermal system. In this way, the required thermal power production from the geothermal heat pumps is reduced, leading to further energy saving. In summer, the removed thermal power from the hybrid photovoltaic thermal panels will be disposed of in an enclosure space in the sea, which can be used by the elderly people to have therapeutic baths.
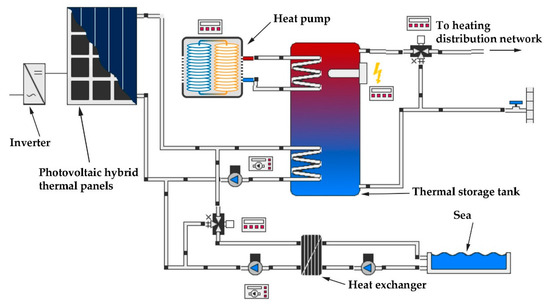
Figure 11.
Combined operation concept of the open loop geothermal system with hybrid photovoltaic thermal panels.
Of considerable importance, towards energy saving in the Pancretan Stadium, is the reduction of the currently consumed electricity and diesel oil for hot water production and swimming pools heating. These two discrete final energy uses are handled together with the introduction of a solar-combi system, which is highly favored, in this particular case, given the existing of final thermal power demand for both of the aforementioned uses during the whole annual period. The proposed system has been proposed and constructed for two school buildings in Crete, aiming at the coverage of the indoor space heating load [23]. The layout of the proposed system is presented in Figure 12 [23].
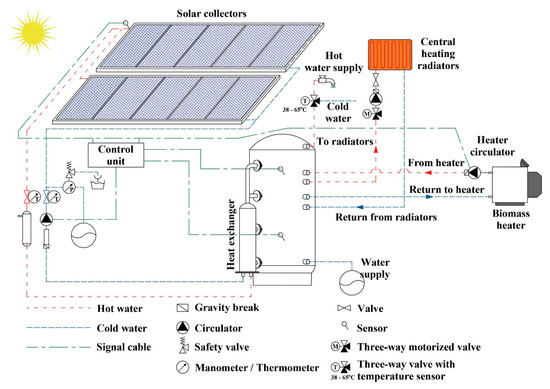
Figure 12.
Construction and operation layout of the proposed solar-combi system.
In the case of the Pancretan Stadium, the solar-combi system will exploit the already existing warm water distributing network, originating from four thermal storage tanks, evenly allocated at the four corners of the Stadium. Each thermal storage tank serves specific hot water consumptions. Two of them are for the swimming pools heating. The computational dimensioning of the overall system concluded in the configuration of four independent solar-combi systems, each one of them supported with one thermal storage tank and 32 flat-plate solar collectors of selective coating. The existing diesel oil burner will be substituted by a new biomass heater, which will support the operation of the solar-combi systems.
The operation algorithm is simple, presented in detail in [23]. The produced thermal power from the solar collectors is stored in the thermal storage tanks, on the condition of higher temperature of the working mean in the solar collectors’ primary loop than in the thermal storage tank. The computational dimensioning of the system and the connection layout of the solar collectors aim to maximize the annual penetration of the thermal power production from the solar collectors. The biomass heater is employed whenever thermal power storage from the solar collectors is lower than the concurrent thermal power demand. Priority is given for hot water production, given its higher annual thermal energy demand (see Table 4).
Regarding lighting, both in NHMC and in Pancretan Stadium, all the existing lighting systems and bulbs are proposed to be replaced with corresponding lighting equipment, with the minimum possible electrical power consumption. Central building energy management systems (BEMS) are additionally proposed to control and optimize the operation of both lighting systems. Particularly for the Pancretan Stadium, the lighting system of the main stadium was studied according to the standards of IAAF and FIFA for international sports and football events, respectively [38]. Furthermore, the introduced BEMS for the Pancretan Stadium was studied to control not only the lighting system, but also the air conditioning, the hot water production and distribution and the swimming pools heating systems. The goal is not only the primary energy saving from the main operation of the essential thermal power production units (geothermal heat pumps, biomass heater), but also from operation of the pumps and the circulators employed in the hydraulic distribution networks through the optimization of their operation algorithms.
Further details on the adopted approach of the energy performance upgrade of the NHMC and the Pancretan Stadium can be found in [37,38]. It is reminded that the objective of this article is not the thorough presentation of all the adopted methods and systems, but the evaluation, through the comparative analysis of the achieved results, of the contribution of each introduced system on the total energy performance upgrade and its economic feasibility.
Finally, reactive power compensation panels are proposed for the NHMC and the municipality building, given their considerable reactive power consumption and the low power factors.
5. Summary of the Proposed Measures—Applied Methodology
The proposed passive and active systems towards the energy performance upgrade of the examined buildings are summarized in Table 5.
Table 5.
Summary of the proposed passive and active systems in the examined buildings.
As seen in Table 5, the type, the size of the building and the different final energy uses impose the optimum cluster of the introduced interventions. For example, the extensive final thermal energy needs in the Pancretan Stadium for hot water production and swimming pools heating and the existing infrastructure regarding the thermal energy distribution network ensures the feasibility of the proposed solar-combi system. Additionally, the high heating and cooling load in the NHMC and the Pancretan Stadium and their vicinity to the coastline creates positive perspectives for the installation of an open-loop geothermal system for indoor space conditioning. Similarly, high heating and cooling load, concentrated during the operating hours in the municipality building, imposes the installation of a centralized VRV heat pump. On the contrary, the reduced cooling load in the school building and the heating load coverage with a biomass heater does not create favorable conditions for the installation of a centralized cooling system. In this case, autonomous split units with high EER are proposed for each teaching class or office separately.
For all the above studies, regardless of the proposed passive and active measures, the calculation process remains the same and is roughly depicted in Figure 13. Firstly the annual heating and cooling load calculation is executed with the computational simulation of the buildings’ performance in TRNSYS. In case of ineffective performance, passive measures are proposed, adapted and designed according to the buildings constructive elements. They are introduced in the computational model and the heating and cooling load calculation is executed again. In this way, the annual heating and cooling load reduction is calculated due to the passive measures application. In the second step, active measures are proposed for the coverage of the expecting heating and cooling load after the passive measures application and the primary energy consumption for the indoor space conditioning is eventually calculated, as a result of both passive and active interventions. At the same time, parallel active measures are studied, designed and proposed for the coverage of any other final energy use in the buildings, apart from indoor space conditioning: indoor and outdoor lighting, hot water production, any other special energy-consuming uses (e.g., swimming pools heating) etc. The total primary energy consumption is then calculated for the coverage of all the final energy uses with the proposed, effective active energy systems. To approach a zero energy building, an electricity production technology from RES is proposed, with nominal power adequate to compensate, on an annual basis, the remaining primary energy consumption calculated in the previous step. In case of high reactive electricity consumption, a power correction panel can also be introduced.
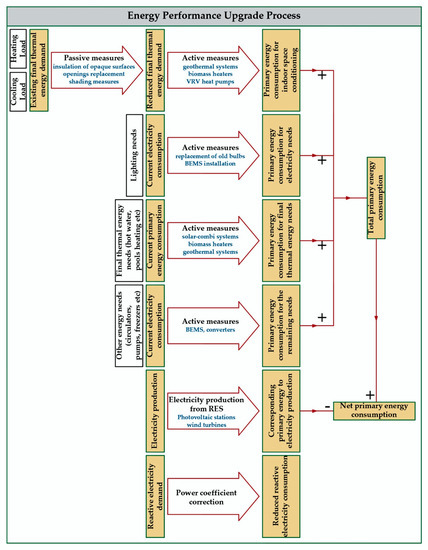
Figure 13.
Typical logical diagram of an energy performance upgrade process.
6. Results
The operation of all the examined buildings, upgraded with the integration of the proposed passive measures, described in Section 3, was computationally simulated again using TRNSYS and the annual heating and cooling loads fluctuation versus time was calculated. All the parameters involved in the corresponding calculation for the buildings’ existing operation, presented in Table 2 (Section 2), were maintained, apart from the U-factors of the opaque and transparent surfaces and for all the buildings. All the new U-factors were formulated below the maximum permissible values of 0.45 W/m2K for rooves and 0.55 W/m2K for vertical opaque surfaces [36], apart from the Pancretan Stadium, for which only the existing openings were replaced, as explained in Section 3. Additionally, the total U-factors for the transparent surfaces were formulated below 2.4 W/m2K. The annual heating and cooling load fluctuations are presented for each building separately in Figure 14, after the integration of the proposed passive measures.
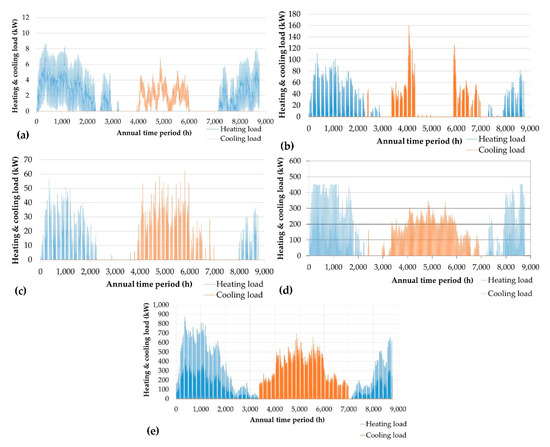
Figure 14.
Annual fluctuation of the heating and cooling loads in the examined buildings after the integration of the proposed passive measures ((a): residential building, (b): school building, (c): municipality hall, (d): NHMC, (e): Pancretan Stadium).
Additionally, in Table 6, the newly calculated heating and cooling loads are presented, levelized per m2 of indoor conditioned space. For a better understanding of the impact of the proposed passive measures, a comparison of the examined buildings’ annual levelized heating and cooling loads is presented in Table 7, between their existing operation and their operation after the integration of the proposed passive measures.
Table 6.
Heating and cooling loads monthly analysis, levelized per m2 of indoor conditioned space, after the integration of the proposed passive measures.
Table 7.
Heating and cooling loads reduction with the integration of the proposed passive measures.
The comparative results presented in Table 7 are sensible, given the type and the operation of each building. For example, in the school building, the heating load percentage reduction is almost twice as high than the cooling load reduction, due to the limited operation of the building in the summer months and the corresponding low cooling needs.
The installation of new openings with adequate airtightness in NHMC results in lower air infiltration, which, in turn, has a negative effect on the building’s cooling load. It should be underlined that the openings in NHMC always remain closed, due to the vicinity of the building with the coastline and the strictly required indoor space conditions for the maintenance of the exhibits.
The higher airtightness achieved with the installation of the new openings, combined with the considerable indoor space cooling loads from the humans under exercise in the Pancretan Stadium’s sports halls, also leads to lower cooling loads’ percentage reduction. The restricted passive interventions in the Pancretan Stadium (only replacement of existing openings) leads sensibly to lower percentage reduction for both the heating and cooling loads, with regard to the other examined buildings.
Regarding the municipality building, the high cooling loads configured by the southern oriented Municipal Board conference hall (see Section 3) create the margin for the high achieved reduction percentage on the building’s total cooling loads.
Finally, in the residential building, the appropriate shading of all the openings leads to annual cooling loads percentage reduction of 29.1%. At the same time, due to partial shading during late autumn and early spring, there is a slight increase (2.6%) of the annual heating load.
In general, with the exception of the Pancretan Stadium and the residential building, heating and cooling loads reduction percentages from 30% to 64% are calculated. These percentages highlight the inadequate current condition of the examined buildings regarding their insulation and their alignment with the guidelines of the relevant directives, as well as the high existing margin for energy saving through the appropriate integration of passive measures in the buildings’ envelope.
The total primary energy consumptions, with the application of both the proposed passive and active energy measures, is presented in Table 8 for all the examined buildings, categorized per different final energy use. For a more integrative picture of the achieved primary energy saving, the results presented in Table 8 are compared with the corresponding primary energy consumptions in the existing operation of the examined buildings, presented in Table 4 (Section 2). The primary energy savings per building and different final energy use are summarized in Table 9.
Table 8.
Primary energy consumptions in the examined buildings after their energy performance upgrade.
Table 9.
Primary energy annual achieved savings in the examined buildings with the introduction of all the proposed passive and active measures.
With a first glance at the results presented in Table 9, three negative figures are observed. This means that with the introduced interventions, the primary energy annual consumption for the corresponding final energy use and buildings increases. This is simply because, in the existing operation of the school building and the Pancretan Stadium, the existing cooling and heating loads respectively are not fully covered. With the proposed measures, this inadequacy is appropriately treated, with the expansion of the existing indoor space conditioning active systems, assuring the achievement of thermal comfort conditions in both facilities for the whole year. This, however, leads to the increase of the corresponding primary energy annual consumption, with regard to the existing operation. Nevertheless, despite the aforementioned increases on these particular final energy uses, even in these facilities, the overall annual primary energy achieved savings are considerably high. Additionally, as already clarified previously, the shading of the openings in the residential building leads to a slight increase of the heating loads.
Before proceeding to any further analysis on the achieved results, it must be clarified that the final primary energy annual saving is calculated by also accounting the contribution of the electricity production from the photovoltaic panels introduced in all the examined facilities.
Moving on the analysis of the achieved energy performance upgrade, firstly it is seen that the annual primary energy saving for the school building is higher than 100%. This, practically, means, that the building is upgraded to a zero energy building, as also highlighted in Table 8. This is approached, in practical terms, after the introduction of the energy saving measures, with the installation of a 22.8 kWp photovoltaic station on the building’s roof. Similarly, the complete compensation of the annual electricity consumption in the residential building can also be achieved with the installation of a 2.5 kWp photovoltaic station, leading to another zero energy building. The high primary energy annual saving for the cooling needs coverage in the residential building is also remarkable, since it is achieved only with the appropriate shading of the transparent surfaces.
Annual primary energy saving percentages higher than 80% are achieved for the municipality building and the NHMC. These total percentages are mainly formulated by the high achieved primary energy savings on the coverage of the heating and cooling (from 77% to 87%). The nominal power of the photovoltaic stations was configured at 24.6 kWp for the municipality building and at 28.6 kWp for the NHMC (photovoltaic hybrid thermal panels). These values were formulated by the available space on the buildings’ rooves. Both buildings were upgraded at A+ energy performance rank.
Considerable primary energy annual saving percentages, from 41% to 69%, are also achieved for the lighting consumptions and for all the investigated buildings with corresponding proposed interventions.
Particularly regarding the Pancretan Stadium, the largest and most energy consuming facility among the examined cases, the introduced solar-combi system results in significant primary energy annual saving percentages for both the hot water production (almost 80%) and the swimming pools’ heating (almost 60%). These energy savings, along with the achieved saving on the cooling loads coverage (almost 69%), result in a 60% total primary energy annual saving percentage. The building is upgraded to B+ energy performance rank, with the installation of a 300 kWp photovoltaic station, which is the maximum permissible value for a photovoltaic installation in the non-interconnected system of Crete for a single, non-profit facility and under net metering operation mode.
A further 20% primary energy annual saving is also approached with the introduction of BEMS in the municipality building, the school building and the Pancretan Stadium. Finally, a significant reduction on the annual reactive electricity consumption is also achieved.
7. Key Performance Indicators—Discussion
In this section, the proposed passive and active measures are evaluated and the achieved results are discussed through the calculation of the following key performance indicators (KPIs):
- the primary energy annual saving, with regard to the existing annual consumption (already presented in Table 9);
- the payback period of the required investment, calculated over the avoided annual energy procurement cost;
- the annual RES penetration, calculated with regard to the primary energy consumption in the upgraded buildings’ operation;
- the CO2 emissions annual reduction, with regard to the existing operation.
The aforementioned KPIs are presented in Table 10.
Table 10.
Key Performance Indicators.
As seen in Table 10, with the proposed interventions, the primary energy annual saving achieved percentages are quite high, starting from 60% in the Pancretan Stadium and exceeding 100% for the two zero energy buildings. These high percentages are mainly achieved through the reduction of the energy consumption for the indoor space heating and cooling for all buildings, and additionally for hot water production and swimming pools, heating in the Pancretan Stadium. The effect of the indoor space conditioning on the total achieved annual primary energy saving is presented in Figure 15a. In this Figure, it is seen that the total primary energy annual saving percentage increases as the primary energy percentage saving on indoor space conditioning increases, depicting its strong impact on the total primary energy saving margin.
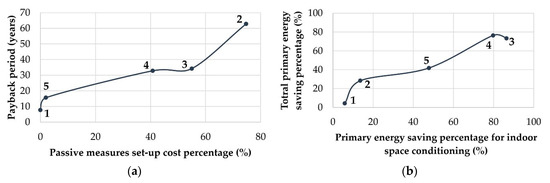
Figure 15.
(a) Fluctuation of the total payback period of the proposed measures versus the passive measures set-up cost percentage over the total investments. (b) Fluctuation of the total primary energy saving percentage versus the primary energy saving percentage for indoor space conditioning. 1. Residential building, 2. School building, 3. municipality building, 4. NHMC, 5. Pancretan Stadium.
Significant energy reduction is also calculated for the lighting systems of the examined facilities, especially in the case of the Pancretan Stadium, due to the high existing energy consumption for the indoor and outdoor space.
The lowest payback period is calculated for the residential building, obviously because no passive measures are proposed, apart from the installation of the openings’ overhangs. In this case, with the installation of the shading overhangs and a photovoltaic station, the building is easily upgraded to a zero energy building, while the corresponding investment is payed back within less than eight years.
The payback period for the Pancretan Stadium is also quite satisfying. This is another case with limited interventions on the facility’s envelope (only the existing openings are replaced). The lower payback period, achieved despite the complexity and the size of the proposed active systems (open-loop geothermal plant, solar-combi system etc.), should be justified with the high final thermal energy needs met in the Stadium, for hot water production, swimming pools’ heating and indoor space conditioning. The economic feasibility of the proposed measures is further strengthened by the fact that these thermal energy needs are partially covered by expensive diesel oil.
With the introduction of the passive measures, the payback period of the overall proposed measures is remarkably increased above 30 years for the municipality building and the NHMC and above 60 years for the school building. Payback periods close to 30 years are typical in cases of extensive insulation application and openings’ replacement. In the case of the school building, the payback period is doubled, because of its large size and, furthermore, the extensive outdoor wall surfaces, imposed by its configuration. Specifically, the building actually follows the shape of a closed orthogonal shape, with a quadrangle also in the middle of it, formulating, in this way, outdoor wall surfaces in both parts of the shape (outer and inner). The impact of the passive measures set-up cost on the total payback period of the investigated investments is presented in Figure 15b. In this Figure, the payback period fluctuation is depicted versus the percentage of the proposed passive measures set-up cost over the total set-up of the introduced interventions. The increasing attitude of the payback period versus the passive measures set-up cost percentage contribution is clearly shown.
However, despite the high payback periods, it should be underlined that the introduction of passive measures on the buildings’ envelope should be considered only as an energy performance upgrade measure. Practically, they constitute essential renovation elements of the building itself, adding on the safety for its occupants, on its durability against adverse weather conditions, and prolonging its life period.
Regarding the RES penetration, this is calculated on the basis of the electricity injected from the photovoltaic station, for the school building and the municipality building. Additionally, the contribution of the solar collectors also accounts for hot water production in the residential building, for swimming pools’ heating and hot water production in the Pancretan Stadium. Finally, in case of the NHMC, the support of the photovoltaic hybrid thermal panels for the geothermal heat pumps is also taken into account. By eliminating, or minimizing, the energy consumption in the examined buildings, the thermal energy or electricity production technologies exhibit high technical and economic feasibility.
Two buildings are upgraded to zero energy buildings with the installation of adequate photovoltaic stations (school building) and solar collectors’ power. This achievement is not always feasible. Even if all possible passive and active measures have been applied and the maximum possible energy saving has been achieved, there will always be some energy still consumed, for the coverage of any remaining energy consumptions. The building’s energy performance upgrade to a zero energy building implies the compensation of this remaining energy consumption with the production of at least equal energy from a RES technology, e.g., a photovoltaic plant or a wind turbine. The power of these plants should be determined according to the remaining energy consumptions. Yet, the installation of the required photovoltaic or wind power is not always possible, most probably due to space limits, licensing issues or grid restrictions; mainly met in insular, non-interconnected systems. In the investigated cases, the lack of available space has not enabled the upgrade of the NHMC and the municipality building to zero energy facilities. In the case of the Pancretan Stadium, the maximum permissible photovoltaics power for a single consumer and for net metering operation, defined at 300 kWp for the insular system of Crete, was the exclusive reason for upgrading the facility’s energy performance rank only to B+. In cases that such restrictions do not exist, the abundant solar radiation and, in plenty of cases, wind potential met in the Mediterranean region, offers the required renewable primary energy source for the achievement of zero energy facilities.
8. Conclusions
The article proved the huge potential for the energy performance upgrade of buildings and facilities in the Mediterranean region. This potential springs mainly from the inadequate envelope conditions met in the vast majority of the existing building stock in this geographical area, referring to the insulation of the opaque surfaces, the quality of the existing openings, regarding both their thermos-physical properties and airtightness, and the appropriate exploitation of the solar gains, through the effective shading of the transparent surfaces. The ineffective operation of the buildings’ envelope leads to high energy consumptions for the indoor space conditioning. This existing overconsumption sets the basis for annual primary energy saving above 70%, with the introduction of the appropriate passive and active measures, particularly for the upgrade of the indoor space conditioning processes. The most energy and cost-effective active systems for indoor space conditioning are the open-loop geothermal systems and the VRV heat pumps.
Apart from indoor space conditioning, other final thermal energy needs always have a crucial role on the configuration of the total energy consumption, with the most common of them being the hot water production or, for sports facilities, the swimming pools’ heating. In the case of the examined Pancretan Stadium, the estimated annual primary energy saving is almost 80% for hot water production and almost 60% for the swimming pools heating. This energy saving is achieved with the introduction of a clever solar-combi system and the substitution of the existing diesel oil burner with a biomass heater.
Significant energy saving percentages can be approached for the lighting needs, especially when they exhibit a considerable share on the building’s energy consumption balance (e.g., like the school building, the municipality building and the Pancretan Stadium). The most feasible measures for the lighting system upgrade are the replacement of ineffective bulbs with new, low-consumption ones and, in case of complex facilities with multiple users, the installation of a central BEMS (NHMC and Pancretan Stadium).
Finally, particularly for the Mediterranean region, the availability of high solar radiation and, often, wind potential, creates a favorable environment for the upgrade to zero energy facilities. This can be easily approached if the existing restrictions on the available space for installation, from the licensing process and due to grid stability issues (for non-interconnected insular grids) do not affect the installation of the required power for the annual energy production at least equal to the remaining energy consumption after the implementation of the energy saving measures.
The present article also proved the energy saving potential in different buildings and facilities consumptions, from small residential buildings to large sports facilities and museums. With the optimum mixture and dimensioning of passive and active energy saving systems, high primary energy saving percentages can be approached. The payback period of the overall energy performance upgrade interventions can be quite attractive in cases of buildings and facilities with low requirements for passive measures integration in their envelope.
Author Contributions
Conceptualization, D.A.K.; methodology, D.A.K.; software, D.A.K. and G.Z.; validation, D.A.K., Y.Y.; formal analysis, Y.Y.; investigation, D.A.K., Y.Y. and E.M.; resources, I.D., G.Z., Y.Y. and E.M.; data curation, G.Z., I.D. and E.M.; writing—original draft preparation, D.A.K.; writing—review and editing, D.A.K.; visualization, D.A.K.; supervision, D.A.K. and S.K.; project administration, D.A.K. and S.K. All authors have read and agreed to the published version of the manuscript.
Funding
This research was funded by the MUNIPALITY OF RETHIMNO, grant number 10835/23-4-2018, and the MUNICIPALITY OF HERAKLION, grant number 41480/16-5-2018.
Acknowledgments
Special thanks to the Technical Services of the Municipality of Rethimno and the Pancretan Stadium for the provided support and data on the existing system’s layout and the current energy consumption in the municipality building of Rethimno, the 1st High-School of Rethimno and the Pancretan Stadium, and particularly to Papagiannakis Manos, Petroulakis George, Vovos Nikos, Kalogerakis Vasilis, Konidakis Dimitris and Tsirakos Dimitris.
Conflicts of Interest
The authors declare no conflict of interest.
References
- Amitai, Y.; Yam, R.; Montagna, P.; Devoti, S.; Shemesh, A. Spatial and temporal variability in Mediterranean climate over the last millennium from vermetid isotope records and CMIP5/PMIP3 models. Glob. Planet. Chang. 2020, 189, 103159. [Google Scholar] [CrossRef]
- Pisano, A.; Marullo, S.; Artale, V.; Falcini, F.; Yang, C.; Leonelli, F.E.; Santoleri, R.; Nardelli, B.B. New Evidence of Mediterranean Climate Change and Variability from Sea Surface Temperature Observations. Remote. Sens. 2020, 12, 132. [Google Scholar] [CrossRef]
- Carnieletto, L.; Badenes, B.B.; Belliardi, M.; Bernardi, A.; Graci, S.; Emmi, G.; Urchueguia, J.F.; Zarrella, A.; Di Bella, A.; Santa, G.D.; et al. A European Database of Building Energy Profiles to Support the Design of Ground Source Heat Pumps. Energies 2019, 12, 2496. [Google Scholar] [CrossRef]
- De Carli, M.; Bernardi, A.; Cultrera, M.; Santa, G.D.; Di Bella, A.; Emmi, G.; Galgaro, A.; Graci, S.; Mendrinos, D.; Mezzasalma, G.; et al. A Database for Climatic Conditions around Europe for Promoting GSHP Solutions. Geosciences 2018, 8, 71. [Google Scholar] [CrossRef]
- Balaras, C.; Droutsa, K.; Dascalaki, E.; Kontoyiannidis, S. Heating energy consumption and resulting environmental impact of European apartment buildings. Energy Build. 2005, 37, 429–442. [Google Scholar] [CrossRef]
- Andreu, V.P.; Aparicio-Fernández, C.; Martínez-Ibernón, A.; Vivancos, J.-L. Impact of climate change on heating and cooling energy demand in a residential building in a Mediterranean climate. Energy 2018, 165, 63–74. [Google Scholar] [CrossRef]
- Gil-Baez, M.; Barrios-Padura, Á.; Molina-Huelva, M. Passive actions in the building envelope to enhance sustainability of schools in a Mediterranean climate. Energy 2019, 167, 144–158. [Google Scholar] [CrossRef]
- Barbosa, F.; De Freitas, V.; Almeida, M. School building experimental characterization in Mediterranean climate regarding comfort, indoor air quality and energy consumption. Energy Build. 2020, 212, 109782. [Google Scholar] [CrossRef]
- Katsaprakakis, D.A.; Zidianakis, G. Upgrading Energy Efficiency For School BuildingsIn Greece. Procedia Environ. Sci. 2017, 38, 248–255. [Google Scholar] [CrossRef]
- López-Ochoa, L.M.; Bobadilla-Martínez, D.; Las-Heras-Casas, J.; López-González, L.M. Towards nearly zero-energy educational buildings with the implementation of the Energy Performance of Buildings Directive via energy rehabilitation in cold Mediterranean zones: The case of Spain. Energy Rep. 2019, 5, 1488–1508. [Google Scholar] [CrossRef]
- Maiolo, M.; Pirouz, B.; Bruno, R.; Palermo, S.A.; Arcuri, N.; Piro, P. The Role of the Extensive Green Roofs on Decreasing Building Energy Consumption in the Mediterranean Climate. Sustainability 2020, 12, 359. [Google Scholar] [CrossRef]
- Ziogou, I.; Michopoulos, A.; Voulgari, V.; Zachariadis, T. Implementation of green roof technology in residential buildings and neighborhoods of Cyprus. Sustain. Cities Soc. 2018, 40, 233–243. [Google Scholar] [CrossRef]
- Cascone, S.; Catania, F.; Gagliano, A.; Sciuto, G. A comprehensive study on green roof performance for retrofitting existing buildings. Build. Environ. 2018, 136, 227–239. [Google Scholar] [CrossRef]
- Feijó-Muñoz, J.; Pardal, C.; Echarri-Iribarren, V.; Fernández-Agüera, J.; De Larriva, R.A.; Calderín, M.M.; Poza-Casado, I.; Padilla-Marcos, M.Á.; Meiss, A.; Jesús, F.-M.; et al. Energy impact of the air infiltration in residential buildings in the Mediterranean area of Spain and the Canary islands. Energy Build. 2019, 226–238. [Google Scholar] [CrossRef]
- Martinopoulos, G.; Papakostas, K.; Papadopoulos, A.M. Comparative analysis of various heating systems for residential buildings in Mediterranean climate. Energy Build. 2016, 124, 79–87. [Google Scholar] [CrossRef]
- Mudge, L.; Saman, W. The impact of air conditioning system upgrade on energy use and comfort in low income housing. Energy Procedia 2017, 121, 26–32. [Google Scholar] [CrossRef]
- Pinto, A.; Rodrigues, F.; Mota, A. Geothermal contribution on southern Europe climate for energy efficiency of university buildings. Winter season. Energy Procedia 2017, 134, 181–191. [Google Scholar] [CrossRef]
- Michopoulos, A.; Kyriakis, N. The influence of a vertical ground heat exchanger length on the electricity consumption of the heat pumps. Renew. Energy 2010, 35, 1403–1407. [Google Scholar] [CrossRef]
- Dalla Santa, G.; Galgaro, A.; Sassi, R.; Cultrera, M.; Scotton, P.; Mueller, J.; Bertermann, D.; Mendrinos, D.; Pasquali, R.; Perego, R.; et al. An updated ground thermal properties database for GSHP applications. Geothermics 2020, 85, 101758. [Google Scholar] [CrossRef]
- Barbato, M.; Cirillo, L.; Menditto, L.; Moretti, R.; Nardini, S. Feasibility study of a geothermal energy system for indoor swimming pool in Campi Flegrei area. Therm. Sci. Eng. Prog. 2018, 6, 421–425. [Google Scholar] [CrossRef]
- Katsaprakakis, D.A. Comparison of swimming pools alternative passive and active heating systems based on renewable energy sources in Southern Europe. Energy 2015, 81, 738–753. [Google Scholar] [CrossRef]
- Hashim, W.M.; Shomran, A.T.; Jurmut, H.A.; Gaaz, T.S.; Kadhum, A.A.H.; Al-Amiery, A.A. Case study on solar water heating for flat plate collector. Case Stud. Therm. Eng. 2018, 12, 666–671. [Google Scholar] [CrossRef]
- Katsaprakakis, D.A.; Zidianakis, G. Optimized Dimensioning and Operation Automation for a Solar-Combi System for Indoor Space Heating. A Case Study for a School Building in Crete. Energies 2019, 12, 177. [Google Scholar] [CrossRef]
- Kalder, J.; Annuk, A.; Allik, A.; Kokin, E. Increasing Solar Energy Usage for Dwelling Heating, Using Solar Collectors and Medium Sized Vacuum Insulated Storage Tank. Energies 2018, 11, 1832. [Google Scholar] [CrossRef]
- Kefalloniti, I.; Ampatzi, E. Building integration of domestic solar combi-systems: The importance of managing the distribution pipework. Energy Build. 2017, 142, 179–190. [Google Scholar] [CrossRef]
- Izadgoshasb, I.; Izadgoshasb, I.; Morrison, G.L.; White, S.D. Solar-powered absorption chillers: A comprehensive and critical review. Energy Convers. Manag. 2018, 171, 59–81. [Google Scholar] [CrossRef]
- Tyagi, V.; Kaushik, S.C.; Tyagi, S.K. Advancement in solar photovoltaic/thermal (PV/T) hybrid collector technology. Renew. Sustain. Energy Rev. 2012, 16, 1383–1398. [Google Scholar] [CrossRef]
- Abdelrazik, A.S.; Al-Sulaiman, F.; Saidur, R.; Ben-Mansour, R. A review on recent development for the design and packaging of hybrid photovoltaic/thermal (PV/T) solar systems. Renew. Sustain. Energy Rev. 2018, 95, 110–129. [Google Scholar] [CrossRef]
- Murugan, S.; Horák, B. A review of micro combined heat and power systems for residential applications. Renew. Sustain. Energy Rev. 2016, 64, 144–162. [Google Scholar] [CrossRef]
- Huang, Y.; McIlveen-Wright, D.R.; Rezvani, S.; Huang, M.J.; Wang, Y.D.; Roskilly, A.P.; Hewitt, N.J. Comparative techno-economic analysis of biomass fueled combined heat and power for commercial buildings. Appl. Energy 2013, 112, 518–525. [Google Scholar] [CrossRef]
- IEA. Daylighting and Electric Lighting Retrofit Solutions. 2016. Available online: http://dx.doi.org/10.14279/depositonce-5162 (accessed on 14 March 2020).
- Carletti, C.; Cellai, G.; Pierangioli, L.; Sciurpi, F.; Secchi, S. The influence of daylighting in buildings with parameters nZEB: Application to the case study for an office in Tuscany Mediterranean area. Energy Procedia 2017, 140, 339–350. [Google Scholar] [CrossRef]
- Kotarela, F.; Kyritsis, A.; Papanikolaou, N. On the Implementation of the Nearly Zero Energy Building Concept for Jointly Acting Renewables Self-Consumers in Mediterranean Climate Conditions. Energies 2020, 13, 1032. [Google Scholar] [CrossRef]
- Benavente-Peces, C. On the Energy Efficiency in the Next Generation of Smart Buildings—Supporting Technologies and Techniques. Energies 2019, 12, 4399. [Google Scholar] [CrossRef]
- Ozadowicz, A. A New Concept of Active Demand Side Management for Energy Efficient Prosumer Microgrids with Smart Building Technologies. Energies 2017, 10, 1771. [Google Scholar] [CrossRef]
- Directive on Buildings’ Energy Performance. Official Governmental Gazette 2367Β’/12-7-2017. Available online: http://tdm.tee.gr/wp-content/uploads/2017/07/fek_12_7_2017_egrisi_kenak.pdf (accessed on 14 March 2020).
- Katsaprakakis, D.A.; Georgila, K.; Zidianakis, G.; Michopoulos, A.; Psarras, N.; Christakis, D.G.; Condaxakis, C.; Kanouras, S. Energy upgrading of buildings. A holistic approach for the Natural History Museum of Crete, Greece. Renew. Energy 2017, 114, 1306–1332. [Google Scholar] [CrossRef]
- Katsaprakakis, D.A.; Dakanali, I.; Zidianakis, G.; Yiannakoudakis, Y.; Psarras, N.; Kanouras, S. Potential on Energy Performance Upgrade of National Stadiums: A Case Study for the Pancretan Stadium, Crete, Greece. Appl. Sci. 2019, 9, 1544. [Google Scholar] [CrossRef]
- Kreider, J.; Rabl, A.; Curtiss, P. Heating and Cooling of Buildings, 3rd ed.; CRC Press: Boca Raton, FL, USA, 2017. [Google Scholar]
- 2009 ASHRAE Handbook—Fundamentals, SI ed.; American Society of Heating, Refrigerating and Air-Conditioning Engineers, Inc.: Atlanta, GA, USA, 2009.


© 2020 by the authors. Licensee MDPI, Basel, Switzerland. This article is an open access article distributed under the terms and conditions of the Creative Commons Attribution (CC BY) license (http://creativecommons.org/licenses/by/4.0/).