Article

Hybrid Predictive Decision-Making Approach to Emission Reduction Policies for Sustainable Energy Industry

1
School of Business, Chongqing College of Electronic Engineering, Chongqing 401331, China
2
School of Economics and Business Administration, Chongqing University, Chongqing 400030, China
3
School of Economics and Management, Chongqing Normal University, Chongqing 401331, China
4
School of Geography and Tourism, Chongqing Normal University, Chongqing 401331, China
5
School of Business, Istanbul Medipol University, 34810 Istanbul, Turkey
*
Authors to whom correspondence should be addressed.
Energies 2020, 13(9), 2220; https://doi.org/10.3390/en13092220
Submission received: 1 April 2020 / Revised: 23 April 2020 / Accepted: 23 April 2020 / Published: 2 May 2020

Abstract

:
Carbon emissions are a prominent issue for sustainable energy production and management. Energy policies under the growing competitive environment could change the priorities of emission reduction and investment decisions. This paper aims to forecast carbon emissions from China and to rank the importance of carbon emissions with interval type 2 (IT2) fuzzy sets (FS) for sustainable energy investments. For this purpose, the quadratic model is applied to measuring emission trends and the Qualitative Flexible Multiple Criteria Method (QUALIFLEX) is used for measuring sustainable energy investment alternatives by the several emission levels. Forecasted values of 29 provinces in China are converted into the linguistic and fuzzy numbers based on IT2 FS respectively to measure the priorities of emission reduction for sustainable economies. The novelty of this paper is to propose a hybrid decision-making approach based on quadratic modeling and the QUALIFLEX method and to discuss the overall energy emission trend and policies for sustainable economic growth. The results demonstrate that emission reduction policies are the most important phenomenon and the environmental factors should be widely considered to construct sustainable energy investments and production.

1. Introduction

Today, due to the rapidly increasing population, energy consumption is going up dramatically as well. In parallel with this development, it has become necessary to increase energy production [1]. Otherwise, this increasing energy demand will be unmet which can cause many problems in the country. These issues increase the need for energy projects. Therefore, countries are developing new projects for energy investments [2]. As energy projects are high-cost investments, financing of these projects becomes very important. If the financing of the mentioned energy investments is not planned effectively, the continuity of these projects cannot be realized [3]. Another important issue in this process is the need to take environmental factors into account in these projects [4]. The main reason for this is that international environmental and social standards are important in the financing decisions of financial institutions [5].
Carbon emissions in the country is another factor that is effective in lending decisions of financial institutions’ energy projects [6]. Carbon emissions are a greenhouse gas produced by the combination of carbon and oxygen. Uncontrolled population growth, industrialization, and fossil fuel consumption are important issues that lead to an increase in the amount of emissions [7]. In the case of the higher population, carbon is used more in many different ways and it damages the atmosphere. Another important indicator of carbon emissions is industrialization. Companies create more carbon to increase their production amounts. This situation has an important impact on the emission of this gas [8]. As a result of the accumulation of this emission in the atmosphere, there are many problems such as climate change and global warming. In particular, international financial institutions attach importance to environmental sensitivity in the lending of energy projects. In this context, if the countries have high carbon emissions, this will adversely affect the financing decisions of these institutions [9]. Within this framework, many different actions are generated by the countries to minimize this problem [10,11].
China has the largest population in the world. This situation leads to high energy demand in the country. Therefore, numerous energy investment projects are underway in China. However, the Chinese government is also providing significant support for the production of new energy projects. This situation will make a significant contribution both to meeting the energy needs of the country and economic development. Therefore, international financial institutions are expected to support these energy projects. However, carbon emission figures have a negative impact on China in this process [12]. Although Chinese carbon emissions increased during the period of 1960–2001, this increase was not large from data released by the World Bank. Compared to China, the increase in carbon emissions in the United States was slightly larger than that in the same period. But since 2001, carbon emissions have increased dramatically in China, and more specifically, exceeded the United States for the first time in 2005, becoming the country with the largest carbon emissions in the world. Moreover, carbon emissions were reached to 10.29 billion tons in 2014, which were nearly 5 billion tons more than the United States [12].
As the world’s largest country of carbon emissions, China is vigorously supporting its carbon emission reduction process. For instance, at the Copenhagen Climate Conference in 2009, the Chinese government proactively guaranteed that by 2020, the carbon emissions per unit of output will decrease by 40–45% based on 2005. Furthermore, the Chinese government promised at the Paris Climate Conference in 2015 that our government will reduce the carbon emissions per unit of output by 60–65% in 2005, and strive to attain carbon emissions peaking around 2030 and attempt to get the peak as early as possible [13]. To realize the international emission reduction commitments, China will intend to the reduction of carbon emissions per unit of GDP as a binding indicator as early as the “Twelfth Five-Year Plan” period. Through the elimination of backward production capacity, strengthening critical industries to save energy and reduce emissions. During the “Thirteenth Five-Year Plan” period, carbon emission reduction work was further strengthened in China. Particularly, energy efficiency improvement and optimizing energy structure have become the chief way to reduce carbon emissions in China. However, as Chinese industrialization has not yet been completed, urbanization is still swiftly advancing, and the task of development is still very heavy. Thus, the future reduction of carbon emissions will be under tremendous pressure [14].
In this study, we aimed to evaluate the sustainable energy investment policies in China by considering the different levels of emission reduction potential in the provinces. In this framework, a two-stage analysis is conducted. The first stage of the analysis is related to defining the net carbon emission trends emission reduction potential of every province. On the other side, the second stage focuses on constructing the decision matrix of high, moderate, and low emission reduction targets for the provinces of China. However, these complex decision-making issues are appropriate for fuzzy logic. Recently, interval type 2 (IT2) fuzzy sets (FS) are preferred for obtaining more accurate results. In this framework, calculated carbon emission target values are converted into fuzzy numbers. After that, three experts made evaluations about three different carbon emission policies of China which are low, medium, and high.
Moreover, the Qualitative Flexible Multiple Criteria Method (QUALIFLEX) is one of the best methods for ranking different alternatives under uncertain environment. The main advantage of this approach in comparison with similar methods is that it gives more coherent results while ranking the limited number of alternatives. Similarly, in this study, we aimed to rank three different carbon emission policies. Hence, it is believed that this approach is quite appropriate for this purpose. Another important point is that to use this method, evaluation scales should be taken into consideration. By looking at recent studies, it can be understood that QUALIFLEX methodology was mainly considered with fuzzy [15,16,17]. Moreover, IT2 fuzzy QUALIFLEX is used to understand sustainable investment policies with different levels of emission reduction targets. The main reason for using IT2 fuzzy logic is that it has a contributing effect to minimize the uncertainty of the FS. Thus, it is believed that this implementation improves the appropriateness of the analysis results.
This study has many original aspects of this study, such as including 29 provinces in China. Therefore, it can be understood that the analysis is very comprehensive. Hence, it can be said that the main novelty of this study is that the level of the emission reduction targets can be identified for China to make sustainable energy investments. In addition, two different stages of analysis were considered in the study. This increases the accuracy of the result. On the other hand, the IT2 fuzzy QUALIFLEX approach was accounted for energy investments. These issues are thought to increase the importance of the study.
This study consists of 5 different parts. First, general concepts related to the subject are explained. The second part of the study includes the analysis of similar studies in the literature. The third section provides information regarding carbon emissions in China. Later on, the details of the two-stage analysis are shared. In this context, firstly, future forecasts for carbon emission figures have been tried to be determined. Secondly, energy investment policies are listed. The results of the analysis are interpreted in the final part.

2. Literature Review

The issue of energy investments has been discussed by many researchers in the literature. Mainly, it is stated that customer satisfaction is essential to the success of energy investments. For example, Dinçer et al. [18] examined energy investment policies for European countries. In this study, the Quality Function Deployment approach was taken into consideration. As a result, it was emphasized that customer expectations should be met in a successful energy investment project. Similarly, Gamel et al. [19], Tang and Dinçer [20], and Say et al. [21] also considered different country groups in their study and underlined similar results. In some studies, it is stated that the financial performance of the project is important for the success of the energy investment. In this context, Zhang et al. [22] also focused on energy investments in China and defined that the cost-benefit analysis is vital. Ervural et al. [23] conducted an analysis for a different country and argued that the financial analysis of the project should be done effectively. In addition, Gliedt and Hoicka [24] and MacGregor [25] noted the importance of this issue.
Political stability in the country is also very important for the success of energy projects, according to many researchers. For example, Werner and Scholtens [26] examined energy projects in Germany and concluded that political problems in the country would affect energy investments. In parallel, Liu et al. [27], Ragosa and Warren [28], and Keeley and Ikeda [29] emphasized similar results in their studies. These authors also tried to understand which factors are important regarding the performance of the energy studies. In these studies, different methodologies are taken into consideration to reach this objective. They mainly argued that there should be political stability for the success of energy projects. Because political stability negatively affects the macroeconomic conditions of the country, energy investments will also be affected by this issue.
On the other hand, Li et al. [30] stated that volatility in the market will affect the success of energy investments. Energy investors become reluctant to make a new investment when there are uncertain conditions in the market. For instance, if the interest rate has uncertain trends, it is obvious that energy investments will be affected by this negative situation. Furthermore, Duan et al. [31], Liu and Zeng [32], and Peng et al. [33] argued that effective risk management will play an important role in this process. In this framework, they argue that first of all, all risks should be identified. After that, necessary actions should be determined for each risk defined in the first stage. In the next process, these actions should be taken to control the risks. With the help of decreasing negative impacts of uncertain conditions, energy investments can be encouraged.
A significant number of researchers have emphasized the importance of renewable energy projects in energy investments. For example, Kim et al. [34] conducted a study on emerging energy investments. As a result, it is concluded that renewable energy projects should be given more importance. Dvořák et al. [35] conducted similar studies for the European Union countries and emphasized the importance of the same issue. Dinçer and Yüksel [36,37] also argued that renewable energy projects are important.
In many studies, the problem of carbon emission is also a significant factor in the success of energy projects. In this context, Ahmad and Du [38] conducted a study to determine the relationship between energy investments and carbon emissions in Iran. In this study, an analysis was made using the ARDL method. According to the results, high carbon emission affects energy investments negatively. Jiang et al. [39] conducted a similar study on China and stated the importance of the same issue. Li et al. [40] and Zhang et al. [41] emphasized the need for sensitivity to environmental factors in energy investments. In this context, it is argued that countries should reduce carbon emissions. Famoso et al. [42] focused on the ozone concentration in Italy with the help of the regression analysis. They also reached similar results. Amini et al. [43] and Ma et al. [44] also considered the same methodology in their analyzes for different country groups and concluded that carbon emission problems should be minimized to make more effective energy investments.
Environmental economists have conducted considerable research on the calculation of carbon emissions and its affecting factors. For the calculation method of carbon emissions, the existing research primarily applies the material balance algorithm, life cycle method, emission coefficient method, and actual measurement method. Although every method has its limitations, it can direct the practical issues to a certain extent. The most popular methods are the material balance algorithm and the emission coefficient method [45]. The factors affecting carbon are also investigated. For instance, Chang et al. [46] and Bhattacharyya et al. [47] adopted factor decomposition to decompose carbon emissions and energy consumption analysis. Rhee et al. [48] conducted an input-output analysis to acquire the relationship between economic development and carbon emissions. Greening [49] utilized factor analysis to decompose and analyze the carbon intensity of related industries in some countries with the OECD.
Many scholars also discussed the relationship between economic growth and carbon emissions. For example, Hu [50] analyzed the Chinese provincial data from 2000 to 2012 to research the income gap and carbon emissions and found that excessive income disparities in urban and rural areas will bring more carbon emissions. Other people concluded that economic growth and carbon emissions, which were consistent with the environmental Kuznets inverted U-shaped curve [51,52]. However, some findings have attained the opposite conclusion and found through a large number of empirical studies that there was no environmental Kuznets curve between carbon emissions and economic growth [53,54,55].
It has been determined that the issue of energy investments is frequently discussed in the literature. In this context, it was understood that environmental factors should be given importance to ensure the continuity of energy investments. For this purpose, it is seen that the carbon emission problem of the countries should be solved. China is also one of the most important countries in this framework due to its high population. To make energy investments more efficient in China, there are many different strategies to solve the carbon emission problem. As a result, it is thought that a new study that deals with the relationship between energy investments and carbon emission in China with a different method will contribute to the literature. In this study, it is believed that the IT2 fuzzy QUALIFLEX method will be used for the first time in this analysis to eliminate the deficiency mentioned.

3. Materials and Methods

Internationally, the measuring methods in the calculation of carbon emission amount typically include material balance algorithms, model methods, life cycle methods, and decision tree methods. Six carbon calculation methods mentioned are commonly implemented in two forms [56]. The first is to divide all industries or sectors to calculate the total energy consumption and then calculate the carbon emissions. The second is to refine the energy structure into raw coal, crude oil, and natural gas. To obtain the entire carbon source, the carbon released by different energy sources is converted and the three energy sources are statistically summed. Although the two methods seem to be scientific, truly complicating simple problems, it is easier to introduce errors in the conversion process. Based on the definition of “total energy consumption (10,000 tons of standard coal)” by the National Bureau of Statistics, it refers to the sum of various energy sources consumed by various industries and residents throughout the country in a certain period of time, including raw coal and crude oil and its products, natural gas, electricity.
A simple carbon emission calculation method, namely the mass-energy conversion method, is applied in this paper. The “mass” gives the total amount of energy (standard coal) consumed by numerous industries and residents in the country during a certain period of time. For “energy” in the name, it means the carbon emitted by these standard coals when the energy is released. This conversion method is a combination of the emission factor method and the material balance algorithm commonly used internationally [57]. The method directly applies the “Regional Production Value (RMB 10,000)” and the “Energy consumption per unit of GDP (tons of standard coal)” in the “China Statistical Yearbook” to attain the total regional energy consumption, combined with the carbon emission coefficient (tons of carbon released from the combustion of standard coal) that can calculate the carbon emissions in the region, which can be expressed as in Equation (1).
E = E C × α
where E is the regional carbon emissions, EC is the total energy consumption of the region (tons of standard coal), and α is the carbon emission coefficient of 1 ton of standard coal. As the coefficient varies significantly from region to region, previous studies typically utilized the mean calculation, resulting in the existence of larger errors [58]. This paper completely reflects the difference in carbon emission coefficient, and various values are used in each region as depicted in Figure 1
The total energy consumption EC can be expressed as in Equation (2):
E C = G D P × β
where GDP is the regional GDP (million yuan), and β is the energy consumption per unit of GDP (tons of standard coal per 10,000 yuan).

3.1. Calculation Method for Net Carbon Emissions

In the past, the absorption of carbon by forests and green spaces was not considered in most research when studying carbon emissions. For instance, even if a region or province generates more carbon, if there is a lot of green vegetation such as forests in the area, they have a strong absorption effect on carbon, which can eliminate part of the carbon dioxide, resulting in a net amount of carbon emissions in the area. Therefore, the removal effect of carbon in the region should be considered in the study of carbon emissions, and the net carbon emissions should be used as the basic data to more precise results [59].
In this work, the following methods are used in calculating the net carbon emissions with the help of Equations (3) and (4):
N E = E A
A = ( A F + A G ) × γ
where NE is the net carbon emissions in the region, A gives the absorption of carbon by forests and green spaces, AF and AG represent the area of forests and urban green areas, respectively, and γ is the carbon absorption and conversion rate of forests and urban green spaces.
The first law of geography gives that geographical things or attributes are correlated to each other in spatial distribution. The spatial autocorrelation distribution analysis method is a typical method to learn the spatial distribution of things or attributes [60]. It can be used to calculate whether there are spatial correlation characteristics of these two phenomena. For instance, it needs to discover the phenomenon of diffusion, polarization, and random distribution of things or attributes. When phenomenon happens in a space where the height is high and the low surrounding is also low, it is called spatial positive correlation and is a diffusion phenomenon. If the high surrounding low or low surrounding height is called spatial negative correlation, it is a polarization phenomenon. If a random distribution occurs, the spatial correlation is not significant and is a random distribution phenomenon [61].
Global spatial autocorrelation is a description of the spatial characteristics of the entire region. While for local spatial autocorrelation, it is the same attribute dependency of spatial locations and their neighbors. The global spatial autocorrelation is measured by the usually used Moran’s I indicator and the Moran’s I indicator can be expressed as in the Equation (5) [62].
I = 1 S 2 i n j n W i j ( x i x ¯ ) ( x j x ¯ ) i n j n W i j
where, S 2 = 1 n i n ( x i x ¯ ) 2 , n is the total number of provinces (cities) included in the study area, x i is the measured value of the variable to be studied, and x ¯ is the average value of the variable. W i j is the geographical relationship between the regions i and j. If two regions are adjacent, it takes 1 and if it not adjacent, it will be 0 [63].
The Moran’s I index only mirrors the overall spatial autocorrelation property of things, and sometimes it is necessary to study the local spatial autocorrelation properties of things. The local index (LISA) is commonly applied to measure the local spatial autocorrelation properties of things. The local autocorrelation indicator LISA of a certain thing or phenomenon can be expressed by using Equation (6).
I i = Z i S 2 j n W i j Z j
where, Z i = x i x ¯ , Z j = x j x ¯ . The local autocorrelation indicator is to decompose the global indicator into each regional unit, and that is to study the spatial correlation characteristics inside each region [64].

3.2. Prediction Method

This work applies regression analysis to forecast the future development tendency of Chinese total carbon emissions. Regression analysis is based on the analysis of the relationship and variation of the independent and dependent variables and establishes the equation of the relationship between the independent variable and the dependent variable. The equation is typically called the regression equation, and then the equation is used as the predictive model. It will be given the future trend of the independent variable (the independent variable is the year), the regression equation (or prediction model) is used to calculate the future trend of the dependent variable.
Regression analysis and prediction method can be divided into one-way regression and multiple regression methods according to the number of independent variables. The unary regression contains only one independent variable, and the multiple regression method contains more than two independent variables. Based on the interdependence of independent variables and dependent variables, it can be divided into linear regression prediction and nonlinear regression prediction. Linear regression prediction refers to the linear relationship between the independent variable and the dependent variable. With the linear regression model, the change of the dependent variable can be known according to the change of the independent variable. Nonlinear regression analysis is an extension of linear regression analysis. In practical applications, there is not a simple linear relationship between many dependent variables and independent variables. At the moment, nonlinear regression is applied. Nonlinear regression methods can occasionally be converted to linear regression methods by variable substitution.
However, the estimation process of emission reduction potential in various provinces in China given below:
(1) Absolute emission reduction potential model. In theory and in the long term, Chinese provinces enable the intensity of carbon emissions in all regions more consistent through technical exchanges, personnel turnover, and structural adjustment, which means that the intensity of carbon emissions in various regions has a convergence effect. This is an absolute convergence, but this goal cannot be achieved in the short term. The carbon emission reduction potential of each province and city can be expressed as in Equation (7):
P a = ( 1 E m i n E i ) × 100
where P a is the absolute emission reduction potential, E m i n is the province with the lowest carbon emission intensity, and E i gives the carbon emission intensity of a certain province.
(2) Relative emission reduction potential model
Because of diverse factors including resource endowment and technological development level in various regions, the absolute emission reduction potential formula is an ideal situation and a long-term effect. At this period, only this value can be applied as a reference. If the country is divided into six regions according to North China, Northeast China, Central China, Southeast, Southwest, and Northwest, the differences between different provinces in different regions will be greatly reduced. The potential for emission reduction can be achieved first in different regions, and it is easier to realize at the current level of Chinese economic development. Last, this work also introduces a formula for the relative potential of CO2 emission reduction in each province by using Equation (8):
P r = ( 1 E r m i n E i ) × 100
where P r is the relative emission reduction potential, and E r m i n is the province with the lowest carbon emission intensity in a certain area.

3.3. IT2 Fuzzy QUALIFLEX Method

Zadeh [65] introduced the FS in the 1960s to analyze the multi-criteria decision-making (MCDM) issues under the uncertainty. In the literature, there are several extensions on the FS. In this scope, the IT2 fuzzy logic is one of the most appealing contributions to the [66]. By using this approach, it can be more possible to minimize uncertainty in this complex environment. Hence, in this study, we propose to extend the IT2 FS by using the QUALIFLEX method accordingly.
The QUALIFLEX is a kind of flexible MCDM. This methodology was developed by Paelinck in 1976. By using the correct treatment of cardinal and ordinal information, flexibility can be provided. In addition to this situation, the preferences with the concordance results are taken into consideration in this process [67,68]. Fuzzy logic was also accounted for in different examinations [69]. On the other side, there are also a few studies in which the QUALIFLEX method was used with IT2 FS [70].
In the first step of this approach, the decision matrix is constructed with the help of averaged values of expert evaluations. This matrix is demonstrated in Equations (9) and (10):
 X1   X2   X3    Xn
D = A 1 A 2 A 3 A m [ A 11 A 12 A 13   A 1 n A 21 A 22 A 23   A 2 n A 31 A 32 A 33   A 3 n   A m 1 A m 2 A m 3   A m n ]
A i j = 1 k [ e = 1 k A i j e ]
In these Equations, Xn demonstrates different criteria and Am gives information about the alternatives. On the other side, the second step is related to the calculation of the signed distance d ( A i j , 0 ˜ ) with Equations (11) and (12).
d ( A i j , 0 ˜ ) = 1 8 ( a 1 i j L + a 2 i j L + a 3 i j L + a 4 i j L + 4 a 1 i j U + 2 a 2 i j U + 2 a 3 i j U + 4 a 4 i j U + 3 ( a 2 i j U + a 3 i j U a 1 i j U a 4 i j U ) h i j L h i j U )
A i j = [ A i j L , A i j U ] = [ ( a 1 i j L , a 2 i j L , a 3 i j L , a 4 i j L ; h i j L ) , ( a 1 i j U , a 2 i j U , a 3 i j U , a 4 i j U ; h i j U ) ]
Moreover, the next step includes the calculation of the concordance/discordance index ( I j l ). For this purpose, Equations (13)–(16) are taken into consideration.
I j l = A ρ , A β A I j l ( A ρ , A β ) = A ρ , A β A ( d ( A ρ j , 0 ˜ 1 ) d ( A β j , 0 ˜ 1 ) )
A ρ j = [ A ρ j L , A ρ j U ] = [ ( a 1 ρ j L , a 2 ρ j L , a 3 ρ j L , a 4 ρ j L ; h ρ j L ) , ( a 1 ρ j U , a 2 ρ j U , a 3 ρ j U , a 4 ρ j U ; h ρ j U ) ]
A β j = [ A β j L , A β j U ] = [ ( a 1 β j L , a 2 β j L , a 3 β j L , a 4 β j L ; h β j L ) , ( a 1 β j U , a 2 β j U , a 3 β j U , a 4 β j U ; h β j U ) ]
P l = ( , A ρ , , A β )   for   l = 1 , 2 , , m !
Additionally, the final step gives information about the calculation of the comprehensive concordance/discordance index. For this purpose, Equation (17) is considered.
I l = A ρ , A β A j = 1 n I j l ( A ρ , A β ) . W j = A ρ , A β A j = 1 n ( d ( A ρ j , 0 ˜ 1 ) d ( A β j , 0 ˜ 1 ) ) . W j

4. Results

This section includes the analysis results of this study. Under this section, firstly, trends of net carbon emissions are evaluated. After that, the global spatial correlation is calculated. Next, the analysis results of carbon net emissions for trend forecast and reduction potential are shared. Finally, sustainable energy investment alternatives are ranked with the help of IT2F QUALIFLEX.

4.1. Trends of Net Carbon Emissions

With the method above, this paper computes the net emissions of carbon in China from 2005 to 2017. The obtained results that net carbon emissions in China have increased year by year during 2005–2017 because energy is the foundation of national economic development and industrial development. All countries in the world consume substantial fossil energy in the process of industrial development. For instance, even in developed countries including the United States, energy consumption is still at a high level. The United States owns a population of 6% of the world, which consumes 30% of the energy used globally. The Chinese economy has grown at a high rate in recent years, with an average annual growth rate of around 7%, and economic growth will inevitably lead to a large consumption of energy. In the Chinese energy consumption structure, the dependence on coal is far greater than that of other developed countries. During the inspection period, coal consumption in Chinese energy consumption accounted for more than 60% of the total primary energy consumption. As coal affects the environment negatively relative to other energy sources, the coal-based energy structure is very detrimental to the Chinese development of a low-carbon economy. In addition, the population of China is huge, and population growth will inevitably bring more energy consumption, resulting in Chinese net carbon being at the forefront of the world. In addition, net carbon emissions increased significantly before 2008 in China, and the Chinese overall net carbon emissions growth rate declined after 2008, which may be due to the slowdown of Chinese economic growth after the 2008 world economic crisis. This has led to a decline in the growth rate of total carbon emissions.

4.2. Global Spatial Correlation

The global spatial autocorrelation index is calculated to acquire the spatial correlation of Chinese overall carbon emissions and apply the local autocorrelation indicators to compute the spatial correlation of net CO2 emissions in each province. In this framework, Equations (5) and (6) are taken into consideration. According to the global spatial autocorrelation calculation results of Chinese net carbon emissions in 2005–2017, it can be found that the global spatial autocorrelation Moran’s I indicator for Chinese net carbon emissions in 2005–2017 is expressively positive, gradually decreasing from near 0.35 in 2005 to less than 0.29 in 2017. As the Moran’s I indicator is positive, it gives that Chinese net carbon emissions have a certain spatial positive correlation. Briefly, Chinese net carbon emissions have a certain aggregation effect. This aggregation phenomenon and the economic and industrial belts or economic and industrial clusters formed by Chinese economic and industrial development in recent years, and the Chinese government have repeatedly proposed major decisions for each region. China has a vast territory and a large population and due to obvious differences in history, nature, economy and society, and regional imbalances, the Chinese government attaches great importance to this. It has successively introduced the strategy of developing the western region, revitalizing the strategy of the old industrial base in the northeast and the central region rise strategy. The introduction of these strategies has promoted the rapid development of the economy in the region. The implementation of each major strategy has led to the aggregation of spatial autocorrelation properties. Meanwhile, due to the successive implementation of these major decisions, the differences in the eastern, western, northeastern, and central regions of China have generally narrowed, and the global spatial autocorrelation indicators have gradually decreased, and they tend to be evenly distributed. With the above method, we calculated the net carbon emissions of provinces in China (due to the lack of data and does not include Xinjiang and Tibet) in 2005–2017.
The results indicate that for the five provinces in North China, the net carbon emissions increased largely before 2009. The net carbon emissions continued to grow after 2009, but the growth rate was very slow. It can also be found that net carbon emissions in Shanxi have been at a high level, because Shanxi Province is the main coal production base of China, and the leading industries are Talso dominated by the coal industry. The energy structure is also dominated by coal. Coal consumption accounts of Shanxi for more than 90% of all primary energy consumption, while coal is relative to other fossil energy sources, whose carbon emissions are much higher, leading to top carbon emissions in the entire North China region and even the country. In other aspects, Hebei and Shanxi are almost the same, Beijing and Tianjin are basically at a low level, while Inner Mongolia is in the middle of five provinces. Moreover, the difference in net carbon emissions between the five provinces in North China is very large. The higher Hebei and Shanxi are 6–8 times lower than those in Beijing and Tianjin, and the net carbon emissions vary greatly among provinces.
Additionally, it is defined that net carbon emissions of Liaoning Province have been at the top of the three provinces for the northeastern region. This is because Liaoning is not only a resource-based city but also a heavy industrial city. The heavy industry in the national economy is triple the light industry, higher than the national average. Besides, the forest vegetation area in Liaoning is lower than that in Jilin and Heilongjiang. The effect of eliminating carbon is not as good as that of Jilin and Heilongjiang, resulting in higher net carbon emissions, but it has shown a sharp decline since 2010. In 2005–2017, the net emissions of carbon in Heilongjiang and Jilin provinces indicated a gradually increasing trend.
It can be found that in East China, the net carbon emissions of all provinces have shown an overall increase. Shandong has the highest net carbon emissions, followed by Jiangsu, Zhejiang, Shanghai, Anhui, and Fujian, and the lowest is Jiangxi. Shandong’s industrial proportion is dominant in the national economy. The heavy-duty industry with high energy consumption in the industry has occupied a considerable proportion, and the scale of production has expanded over the years, leading to Shandong Province becoming an important source of carbon emissions in East China.
It is concluded that in the Central and South of China, Guangdong owns the largest net carbon emissions, mainly because Guangdong has the most developed economy in the six regions of Central and South China. Energy intensity of Guangdong is relatively low, due to the large economic aggregate, the final net carbon emissions far exceed other provinces. In 2010, the net carbon emissions in Henan showed a sharp decline, and Guangdong, Guangxi, and Hunan also experienced a certain decline. After that, they have shown a trend of rising shocks. Moreover, Hainan Province has the lowest carbon emissions in the six provinces and cities in Central and South China, about one-third of the highest in Guangdong Province, but it has upheld a momentum of sustained growth and should focus on this trend.
It can be found that Sichuan has the highest net carbon emissions in the four provinces of southwest China, chiefly because of the large population of Sichuan, which occupies nearly half of the total population of the four provinces in the southwest, followed by Guizhou and Yunnan. Chongqing has the lowest net carbon emissions. In the past four years, the net emissions of carbon in the four southwestern provinces have indicated an increasing trend year by year, which is inseparable from the rapid economic growth of the provinces in recent years.
It is identified that in the four northwestern provinces, Shaanxi owns the highest net carbon emissions, which is due to the highest secondary carbon emissions in Shaanxi Province, especially in the industrial heavy chemical industry, leading to the highest net carbon emissions, followed by Gansu and Ningxia. Qinghai has the lowest net carbon emissions in the northwestern region. This is because of three aspects: Qinghai Province has a relatively backward economy and a small population. Meanwhile, the vigorous development of solar energy is inseparable in Qinghai. The partial spatial autocorrelation of net carbon emissions from Chinese provinces was computed with Equation (6).
It is identified that the local autocorrelation indicators of CO2 emissions in Chinese provinces can be divided into three categories: the first category is the provinces with zero values, primarily Heilongjiang, Shanghai, Zhejiang, Hunan, and Hainan, indicating the spatial distribution of net CO2 emissions in these provinces is random. The second category is positive provinces, chiefly Shanxi, Hebei, Inner Mongolia, Liaoning, Jiangsu, Shandong, Henan, Chongqing, Sichuan, Guizhou, Yunnan, Gansu, Qinghai, and Ningxia, indicating that these provinces have positive local autocorrelation properties of carbon emissions. It indicates that the surrounding provinces of these provinces have similar characteristics to the province, of which Shandong Province is the most significant. This is since four of the five provinces bordering Shandong (Hebei, Shanxi, Henan, Jiangsu) are all major carbon emission provinces. Therefore, a strong agglomeration state has emerged, and the local spatial autocorrelation index is the highest. The remaining local spatial autocorrelation indicators for carbon emissions from Beijing, Tianjin, Jilin, Anhui, Fujian, Jiangxi, Guangxi, Guangdong, and Shaanxi are negative (belonging to the third category), suggesting that there are significant net CO2 emissions in these provinces and neighboring provinces. The polarization characteristic, in which Guangdong Province has the largest negative value, indicates that the polarization” characteristic is the most significant. This is because the net carbon emissions of the four provinces of Fujian, Jiangxi, Hunan, and Guangxi, which are bordered by Guangdong, are much lower than those of Guangdong. Therefore, the local spatial autocorrelation index is negative, and the value is large and appears a sever phenomenon of high and low considered as polarization.

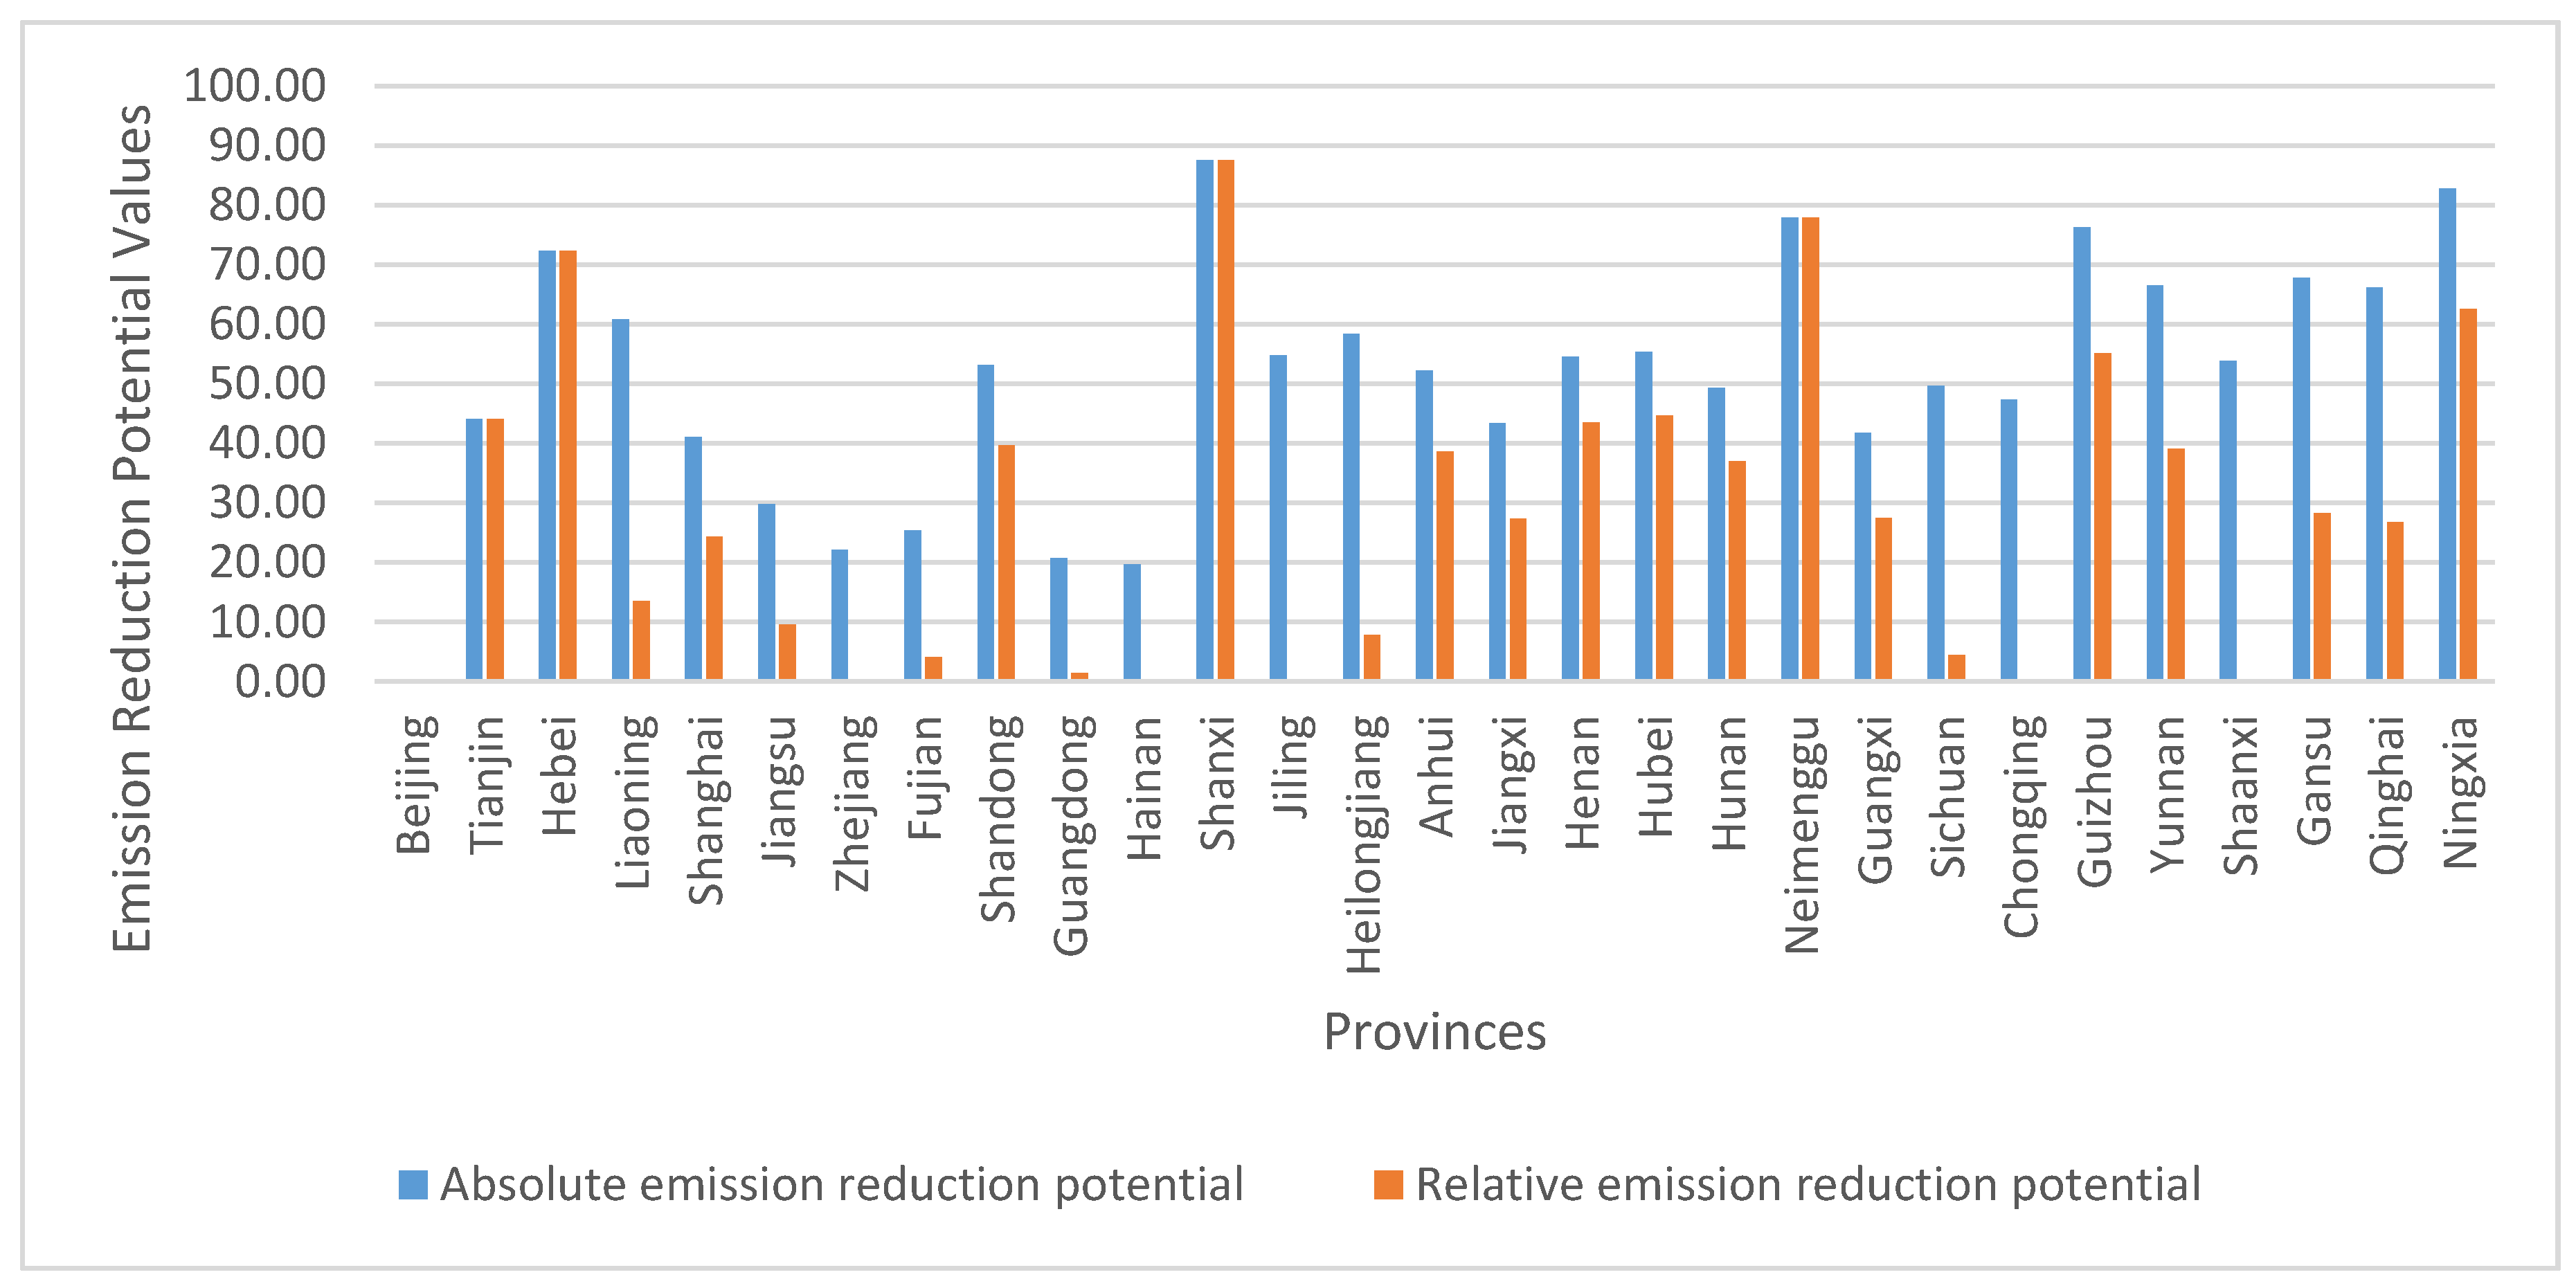
4.3. Analysis Results of Carbon Net Emissions for Trend Forecast and Reduction Potential

From the analysis of net carbon emissions data in China from 2005 to 2017, we can find that the relationship between independent variables and dependent variables may be a second power exponential relationship. Therefore, we apply the quadratic curve y = a x 2 + b x + c to fit, where the dependent variable y represents the net emission of carbon in China, the independent variable x represents the year, and the fitting result is found to be consistent with the actual value. It is defined that the values of the fitting parameters a, b, and c are obtained by fitting, a = −2362, b = 9633,312, and c = −9724,315,425.
To further confirm the accuracy of regression prediction, SPSS software is employed to carry out T-test on the sample, and the correlation coefficient of the sample is 0.99, the t value is 0.43, and the p-value of the two-sided test is 0.72, which proves that the prediction result is credible. Based on this prediction model (equation), we forecast Chinese net carbon emissions in the future (by 2030). It can be found from the trend forecast curve that Chinese net carbon emissions will peak in 2024, estimated at 16.3 billion tons.
If it is absolute convergence or relative convergence, the provinces and cities with the lowest carbon emission intensity have a constant emission reduction potential of 0, and other provinces have an emission reduction potential of between 0 and 100. When the value is closer to 100, it means the greater the carbon emission intensity of the province and the greater the potential for emission reduction. The future emission reduction potential of various provinces in China is shown in Figure 2.
In Figure 2, it is understood that Beijing has zero potential for absolute emission reduction potential. This table also shows that carbon emission intensity is the lowest among all provinces, municipalities and autonomous regions in China, while there is still considerable space for the absolute emission reduction potential of Hebei, Shanxi, and Inner Mongolia in North China. As the relative emission reduction potential is defined as the province with the lowest net carbon emission intensity in each region, it can be found that Beijing in North China, Jilin Province in Northeast China, Zhejiang Province in East China, Hainan Province in Central South China, Chongqing City in Southwest China, and Northwest China. The relative emission reduction potential of Shaanxi Province is relatively minor in the future.

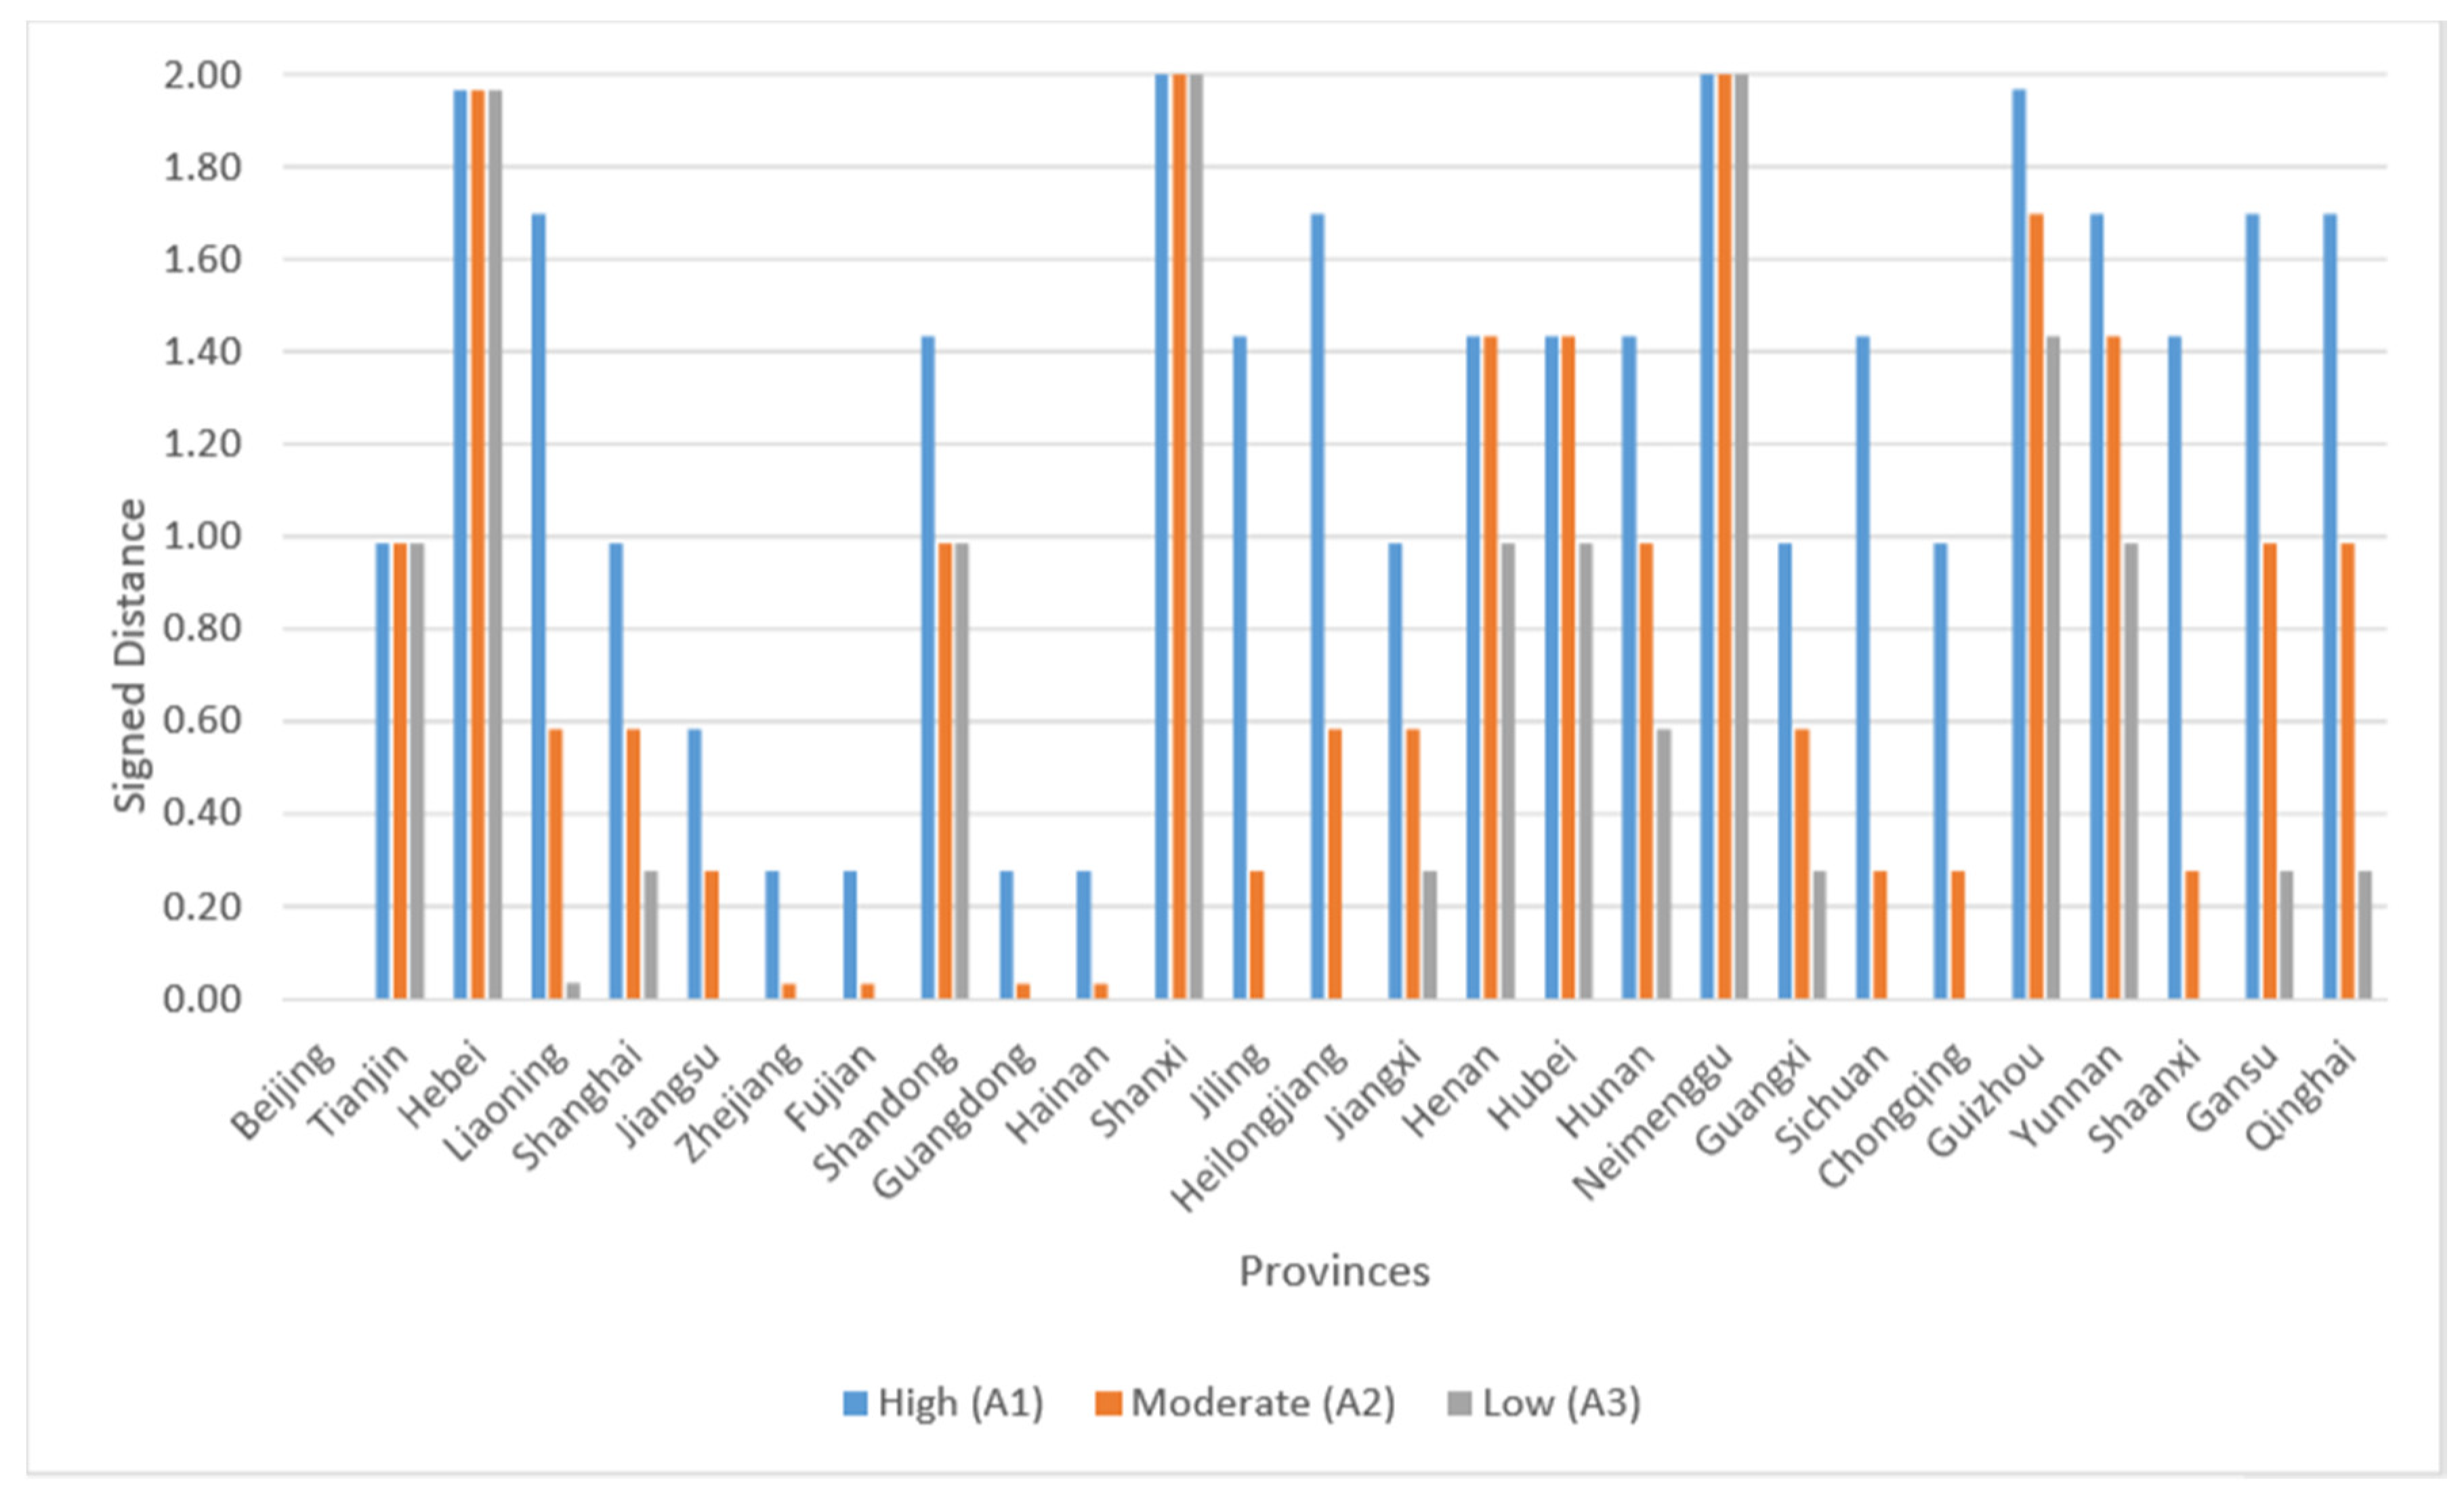
4.4. Analysis Results for Ranking Sustainable Energy Investment Alternatives

In this stage, the QUALIFLEX method with IT2 FS are applied for ranking the sustainable energy investment policies with respect to emission-reducing targets in China by the provinces. For this purpose, the absolute and relative emission reduction potential of 29 provinces in China are used to obtain the linguistic evaluations of the sustainable energy investments based on emission reduction targets of China. Three sustainable energy investments, entitled Low, Moderate, and High emission reduction targets, are defined by considering the different levels of emission policies.
Future emission reduction values of the provinces in China that are obtained from the first stage of analysis are converted to the linguistic scales. The absolute, relative, averaged values of emission reduction potential for each province in China are defined in 9-point evaluation scales and the linguistic results of the provinces by the low, moderate, and high emission reduction targets are given in Table 1 properly.
The evaluations are reconstructed in the IT2 fuzzy numbers and the signed distance for each emission reduction level are employed in Figure 3.
In the following process, 6 permutations of the emission reduction targets are defined as P 1 = ( A 1 , A 2 , A 3 ) , P 2 = ( A 1 , A 3 , A 2 ) , P 3 = ( A 2 , A 1 , A 3 ) , P 4 = ( A 2 , A 3 , A 1 ) , P 5 = ( A 3 , A 1 , A 2 ) , P 6 = ( A 3 , A 2 , A 1 ) [16]. So, the concordance/discordance index can be provided in Table 2.
The weights of the provinces are considered equally for constructing the weighted decision matrix and the comprehensive concordance/discordance index are obtained for ranking the sustainable energy investments based on the different level of emission reduction targets. The overall index results are computed as d ( I 1 , 0 ˜ 1 ) is 79.6, d ( I 2 , 0 ˜ 1 ) is 48.9, d ( I 3 , 0 ˜ 1 ) is 30.7, d ( I 4 , 0 ˜ 1 ) is −48.9, d ( I 5 , 0 ˜ 1 ) is −30.7, and d ( I 6 , 0 ˜ 1 ) is −79.6. According to the index results, permutation 1 P 1 = ( A 1 , A 2 , A 3 ) has the best for ranking the emission reduction target level with sustainable energy investments. So that, the high emission reduction targets are the most important factor for sustainable energy investments while the alternative of low emission reduction has the weakest priority in the sustainable energy policies with respect to the emission targets.

5. Discussion

To fulfill the emission reduction targets promised by China to the world at the 2015 Paris Climate Conference, China began implementing emission reduction targets in sub-steps, sub-regions, and provinces, developing a low-carbon economy. While ensuring rapid economic growth, further reduction of energy consumption and environmental pollution is the only way for China to accomplish sustainable economic, resource, and environmental development. Thus, more efforts should be completed in the following areas. Adjustment of the energy structure is one of the significant duties for China to develop a low-carbon economy and reduce carbon.
The purpose of this examination is to understand the sustainable energy investment policies in China with respect to the emission reduction potential. There are two different stages in the analysis process. First of all, the net carbon emission trend forecast and reduction potential are measured. In the second stage, the sustainable energy investment policies based on emission reduction targets are ranked by using IT2F QUALIFLEX. Within this framework, these calculated results of 29 different provinces are converted into the FS. Additionally, carbon emission policy is divided into three different categories which are low, medium, and high. By calculating with the IT2F QUALIFLEX, it is understood that the main future target of China with respect to the carbon emission.
The results demonstrate that high emission reduction targets are mainly considered in China for sustainable energy investments. In other words, it is concluded that China intends to reduce the future carbon emission problem. This is important for energy investment projects in China. It is possible to look at this from two different angles. First of all, it is important to prevent important problems such as carbon emissions, so that energy projects can find funding. The main reason for this is that international fund organizations pay attention to environmental factors in their lending decisions. In this context, in a country with high carbon emissions, it becomes very difficult for energy projects to find funding. China stands out as a country with high air pollution. Hence, it is thought that the high target of reducing carbon emissions in China decreases the risk of not finding funds for energy projects in the country. Many different authors identified a similar situation in their studies. However, the main novelty of this study is that the level of the emission reduction targets can be identified for different provinces of China to make sustainable energy investments. Therefore, by making this kind of detailed analysis, it is thought that this study becomes very different by comparing the similar ones in the literature. Additionally, most of the studies only focused on the significance of the carbon emission problem in the effectiveness of energy investment policies. Nevertheless, this study also measured the level of the targets that China should implement. In other words, this study examined how urgent the actions should be taken to solve the problems.
Herbohn et al. [71] aimed to understand whether banks consider carbon risk in their lending decisions. For this purpose, 120 different bank loans are taken into consideration regarding the period between 2009 and 2015. They underlined that banks give importance to the carbon risk to the lending process. Similarly, Zhou et al. [72] focused on the effect of carbon risk on the lending decisions of the financial institutions. They made a panel regression analysis on 191 Chinese companies for the years between 2011 and 2019. It is concluded that necessary actions should be taken to manage carbon emission risks for the companies to reach funds from the financial institutions easily.
This situation explained by many different studies in the literature. For instance, Shamsi et al. [73] created an optimization model and identified that emission reduction targets play a key role to minimize this problem. Kuriyama et al. [74] tried to make a similar analysis for Japan. They underlined that emission reduction targets should be designed to provide sustainable energy investments. Similarly, Qin et al. [75] and Pollitt et al. [76] are other studies that defined the importance of this situation as well. On the other side, there are also some studies in the literature which argue that low and medium emission levels should be mainly considered. For example, Wang et al. [77] focused on carbon emission reduction targets in China. They concluded that the areas with the highest carbon emission control target level have higher costs so that low and medium emission levels are more important for China’s sustainable development.
The second important aspect of this result is the increase in renewable energy investments as a result of being sensitive to the environment. When China generally has a carbon emission reduction target, this will allow for energy projects that do not cause environmental pollution. In other words, this will attract renewable energy investors. Renewable energies are the types of energy that originate from nature such as wind and sun. They do not emit carbon gas like non-renewable energy. Therefore, China’s goal of reducing carbon emissions will contribute to the increase in renewable energy investments in the country. This situation contributes to the sustainability of energy investments and economic size in the country. Lots of studies in the literature underlined the importance of this situation. For instance, Inglesi-Lotz [78] and Kahia et al. [79] also reached similar points by analyzing different regions, such as the EU and MENA. By considering the results of the analysis, it can be said that the acceleration of the optimization and adjustment of Chinese energy structure means reducing dependence on fossil fuels such as coal and oil and vigorously developing new and renewable energy sources.
(1)
Coal energy dependence reduction. It needs to rationally control domestic coal production and strengthen the overall planning and management of mining areas. It requires not only limiting the total annual production of coal enterprises, but also merging and reorganizing coal enterprises, integrate small coal enterprises, and implement coal quota management for large coal enterprises. Next, we will increase publicity and guidance, and encourage all industries and enterprises to use coal without gas, which can use oil without oil, and reduce coal consumption.
(2)
Stabilize the supply of petroleum energy. Chinese oil energy is half reliant on imports, and stable oil energy supply plays an important role in Chinese national energy security. Besides, it is necessary to increase the strategic reserve of domestic oil, encourage enterprises to increase the pace of oil exploration in areas such as the deep sea, and comprehensively promote the construction of national oil reserve projects. To encounter the domestic petroleum energy demand in the case of blocked international trade to increase trade cooperation between China, Russia, and Africa, we should make full use of Central Asia, China, and Russia and other pipelines to maximize the import of petroleum resources from abroad.
(3)
The proportion should be increased in energy supply and consumption of natural gas, wind energy, hydropower, solar energy, and nuclear energy. China should give priority to the development of hydropower. Hydropower is an economical, clean renewable energy source. The development of hydropower can also achieve comprehensive benefits such as flood control, irrigation, water supply, shipping, aquaculture, and tourism; compared with coal-fired power, hydropower per 1 kWh can reduce carbon emissions by about 1100 g. The Three Gorges Project is equivalent to seven 2.6 million kilowatts of thermal power plants, which can emit about 100 million tons of carbon per year. Thus, hydropower development is a vital choice for China to solve the problem of optimizing energy structure and reducing carbon emissions. Besides, natural gas, coal-bed methane, and shale gas should also be established; nuclear power should be energetically settled; wind energy construction should be supported; solar energy, biomass energy, and other renewable energy sources should be vigorously industrialized.
Currently, the industrial structure in China is not sensible. The basic status of production is unbalanced, the proportion of secondary production is too large, and it occupies half of the national economy. Heavy industry is exceptionally prominent. The proportion of tertiary production is relatively low, accounting for about 50% of the gross national product, which can be achieved by developed countries, without a high level. The status quo of the Chinese industrial structure is equivalent to the level of developed countries in the last century. The unreasonable industrial structure is even worse for reducing carbon emissions. Lastly, we need to (1) consolidate and strengthen the basic position of agriculture, promote the transition to modern agriculture, and strive to build low-carbon agriculture; (2) reduce the proportion of industry, especially heavy industry, and promote industrial restructuring, transformation, and upgrading; (3) rapidity and high-level development of the tertiary industry.
The development and utilization of low-carbon technologies can not only improve product quality and reduce energy consumption. At the same time, technological advances can shorten product production cycles and increase labor productivity. The development and investment of low-carbon technologies mainly include three technologies: carbon reduction technology, zero-carbon technology, and carbon removal technology. Taking enterprises as the main body, we can rely on the cooperation and development of universities, research institutes, industries, and enterprises to continuously promote the low-carbon technology innovation and the transformation of results in the combination of production, education, and research. On the one hand, we will use high-level talents from universities and research institutes to strengthen the development platform for low-carbon economic technologies, support the demonstration, application, and promotion of low-carbon technologies, and implement the policies of tax incentives and financial subsidies that encourage technological innovation to increase support for low-carbon industries and enterprises.
Since the carbon sources/carbon sink ratios in different regions and provinces and cities in China are not the same, it is imperative to build a carbon compensation system. China should create a diversified governance capital investment mechanism based on special environmental management funds, with efforts to promote the implementation of the environmental protection reserve fund system and improve the carbon purification and control mechanism of “who exceeds the standard and who manages.” The nation should gather environmental protection reserve funds from the provinces based on the estimated carbon emission reduction plans of various provinces and cities, particularly the heavy industrial provinces. After the unified transfer to the state treasury, the provinces and municipalities that have a respectable effect on the deduction of reserve funds and emission reductions according to the completion of each province and city. For the province where the fund is insufficient, the reserve fund will be doubled in the next year. If the emission reduction quota is not accomplished in the next year, the reserve for the emission reduction will be doubled to urge the provinces to mobilize the province to save energy and reduce emissions. The central government can also set up a special fund for carbon emission reduction, which will be compensated with awards and rewards for leading provinces and cities and leading enterprises in energy conservation and emission reduction.
The industrial sector, the construction sector, and the transportation sector are the focus of Chinese energy conservation and emission reduction, while the industrial sector is the top priority in those sectors. To attain energy conservation and emission reduction in the industrial sector, we should start from the aspects of technological advancement and industrial restructuring, determine energy management information systems and implement performance contracts and other policy measures. The critical points are the steel industry, thermal power industry, petrochemical industry, non-ferrous metal industry, building materials department, and high-energy-consuming industries such as petrochemicals. Moreover, we should circumvent blind investment and redundant construction, curb excessive growth of production capacity, eliminate backward production capacity, accelerate the merger and reorganization of iron and steel enterprises, and vigorously carry out technological transformation and innovation in the steel industry. The elimination of small thermal power and other backward production capacities could lead to the development of high-efficiency units based on supercritical thermal power units for the thermal power industry. The conversion efficiency of coal-fired energy should be enhanced, and energy efficiency should be improved by building cogeneration. While for the petrochemical industry, it is stimulated to establish low-energy fine chemicals and new chemical materials, further adjust the refining and chemical integration process, to progress the lighter weight of heavy oil, and properly deliberate importing or increasing the proportion of imports for high-energy-consuming raw materials.

6. Conclusions

This study aims to propose a two-stage analysis for analyzing the sustainable energy investment policies in China by considering the different levels of emission reduction potential in the provinces. To achieve this objective, Chinese overall data and provincial data are taken into consideration for the periods between 2005 and 2017. Hence, the future trends of absolute and relative emission targets can be obtained. Because of a data availability problem, the data in 2018 cannot be considered. However, because a large period is included in the analysis, it is believed that this evaluation is consistent and represents the current situation. In the second stage of the analysis, calculated future carbon emission targets are converted into linguistic variables. After that, the decision matrix of high, moderate, and low emission reduction targets for the provinces of China is constructed by using IT2 fuzzy QUALIFLEX. The main advantage of selecting this method is that it is very successful to rank three different alternatives. Additionally, it is also seen that the QUALIFLEX methodology was mainly preferred with fuzzy logic especially in recent studies. Hence, in the second part of the analysis process, expert opinions are accounted for. It is thought that this situation also increases the quality of the analysis.

Author Contributions

Conceptualization, P.Z., S.Y. and H.D.; methodology, P.Z., S.Y. and H.D.; software, P.Z., S.Y. and H.D.; validation, P.Z., S.Y. and H.D.; formal analysis, C.Z., D.L. and J.L.; investigation, C.Z., D.L. and J.L.; resources, C.Z., J.L.; data curation, C.Z., D.L. and J.L.; writing—original draft preparation, P.Z., S.Y. and H.D.; writing—review and editing, P.Z., S.Y. and H.D.; visualization, C.Z., D.L. and J.L.; supervision, P.Z., S.Y. and H.D.; project administration, P.Z., S.Y. and H.D.; funding acquisition, P.Z. All authors have read and agreed to the published version of the manuscript.

Funding

This work was sponsored in part by the National Social Science Foundation of China (19XMZ095).

Conflicts of Interest

The authors declare no conflict of interest.

Nomenclature

EUEuropean Union
FSFuzzy Sets
IT2Interval type 2
QUALIFLEXQualitative Flexible Multiple Criteria Method

References

  1. Minchala-Avila, L.I.; Palacio-Baus, K.; Ortiz, J.P.; Valladolid, J.D.; Ortega, J. Comparison of the performance and energy consumption index of model-based controllers. In Proceedings of the 2016 IEEE Ecuador Technical Chapters Meeting (ETCM), Guayaquil, Ecuador, 12–14 October 2016; pp. 1–6. [Google Scholar]
  2. Bhattacharya, M.; Paramati, S.R.; Ozturk, I.; Bhattacharya, S. The effect of renewable energy consumption on economic growth: Evidence from top 38 countries. Appl. Energy 2016, 162, 733–741. [Google Scholar] [CrossRef]
  3. Lam, P.T.; Law, A.O. Crowdfunding for renewable and sustainable energy projects: An exploratory case study approach. Renew. Sustain. Energy Rev. 2016, 60, 11–20. [Google Scholar] [CrossRef] [Green Version]
  4. Grágeda, M.; Escudero, M.; Alavia, W.; Ushak, S.; Fthenakis, V. Review and multi-criteria assessment of solar energy projects in Chile. Renew. Sustain. Energy Rev. 2016, 59, 583–596. [Google Scholar] [CrossRef]
  5. Kalkbrenner, B.J.; Roosen, J. Citizens’ willingness to participate in local renewable energy projects: The role of community and trust in Germany. Energy Res. Soc. Sci. 2016, 13, 60–70. [Google Scholar] [CrossRef]
  6. Alshehry, A.S.; Belloumi, M. Energy consumption, carbon dioxide emissions and economic growth: The case of Saudi Arabia. Renew. Sustain. Energy Rev. 2015, 41, 237–247. [Google Scholar] [CrossRef]
  7. Green, F.; Stern, N. China’s changing economy: Implications for its carbon dioxide emissions. Clim. Policy 2017, 17, 423–442. [Google Scholar] [CrossRef] [Green Version]
  8. Liu, K.H.; Chang, S.F.; Huang, W.H.; Lu, I.C. The Framework of the Integration of Carbon Footprint and Blockchain: Using Blockchain as a Carbon Emission Management Tool. In Technologies and Eco-Innovation towards Sustainability I; Springer: Singapore, 2019; pp. 15–22. [Google Scholar]
  9. Chen, S.; Liu, Z.; Chen, B.; Zhu, F.; Fath, B.D.; Liang, S.; Su, M.; Yang, J. Dynamic carbon emission linkages across boundaries. Earth’s Future 2019, 7, 197–209. [Google Scholar] [CrossRef] [Green Version]
  10. Abagnale, C.; Cardone, M.; Iodice, P.; Strano, S.; Terzo, M.; Vorraro, G. Power requirements and environmental impact of a pedelec. A case study based on real-life applications. Environ. Impact Assess. Rev. 2015, 53, 1–7. [Google Scholar] [CrossRef] [Green Version]
  11. Iodice, P.; D’Accadia, M.D.; Abagnale, C.; Cardone, M. Energy, economic and environmental performance appraisal of a trigeneration power plant for a new district: Advantages of using a renewable fuel. Appl. Therm. Eng. 2016, 95, 330–338. [Google Scholar] [CrossRef]
  12. Xu, B.; Lin, B. Carbon dioxide emissions reduction in China’s transport sector: A dynamic VAR (vector autoregression) approach. Energy 2015, 83, 486–495. [Google Scholar] [CrossRef]
  13. Zaman, K.; Abd-el Moemen, M. Energy consumption, carbon dioxide emissions and economic development: Evaluating alternative and plausible environmental hypothesis for sustainable growth. Renew. Sustain. Energy Rev. 2017, 74, 1119–1130. [Google Scholar] [CrossRef]
  14. Nie, Y.; Li, Q.; Wang, E.; Zhang, T. Study of the nonlinear relations between economic growth and carbon dioxide emissions in the Eastern, Central and Western regions of China. J. Clean. Prod. 2019, 219, 713–722. [Google Scholar] [CrossRef]
  15. Zhang, X.; Xu, Z. Hesitant fuzzy QUALIFLEX approach with a signed distance-based comparison method for multiple criteria decision analysis. Expert Syst. Appl. 2015, 42, 873–884. [Google Scholar] [CrossRef]
  16. Dincer, H.; Yuksel, S. IT2-based fuzzy hybrid decision making approach to soft computing. IEEE Access 2019, 7, 15932–15944. [Google Scholar] [CrossRef]
  17. Banerjee, D.; Guha, D.; Kouchakinejad, F. Ranking Alternatives Using QUALIFLEX Method by Computing All Spanning Trees from Pairwise Judgements. In Soft Computing for Problem Solving; Springer: Singapore, 2019. [Google Scholar]
  18. Dincer, H.; Yüksel, S.; Martinez, L. Balanced scorecard-based Analysis about European Energy Investment Policies: A hybrid hesitant fuzzy decision-making approach with Quality Function Deployment. Expert Syst. Appl. 2019, 115, 152–171. [Google Scholar] [CrossRef]
  19. Gamel, J.; Menrad, K.; Decker, T. Is it really all about the return on investment? Exploring private wind energy investors’ preferences. Energy Res. Soc. Sci. 2016, 14, 22–32. [Google Scholar] [CrossRef]
  20. Tang, Z.; Dinçer, H. Selecting the House-of-Quality-Based Energy Investment Policies for the Sustainable Emerging Economies. Sustainability 2019, 11, 3514. [Google Scholar] [CrossRef] [Green Version]
  21. Say, K.; John, M.; Dargaville, R.; Wills, R.T. The coming disruption: The movement towards the customer renewable energy transition. Energy Policy 2018, 123, 737–748. [Google Scholar] [CrossRef]
  22. Zhang, D.; Cao, H.; Zou, P. Exuberance in China’s renewable energy investment: Rationality, capital structure and implications with firm level evidence. Energy Policy 2016, 95, 468–478. [Google Scholar] [CrossRef] [Green Version]
  23. Ervural, B.C.; Evren, R.; Delen, D. A multi-objective decision-making approach for sustainable energy investment planning. Renew. Energy 2018, 126, 387–402. [Google Scholar] [CrossRef]
  24. Gliedt, T.; Hoicka, C.E. Energy upgrades as financial or strategic investment? Energy Star property owners and managers improving building energy performance. Appl. Energy 2015, 147, 430–443. [Google Scholar] [CrossRef]
  25. MacGregor, J. Determining an optimal strategy for energy investment in Kazakhstan. Energy Policy 2017, 107, 210–224. [Google Scholar] [CrossRef]
  26. Werner, L.; Scholtens, B. Firm Type, Feed-in Tariff, and Wind Energy Investment in Germany: An Investigation of Decision Making Factors of Energy Producers Regarding Investing in Wind Energy Capacity. J. Ind. Ecol. 2017, 21, 402–411. [Google Scholar] [CrossRef] [Green Version]
  27. Liu, J.; Zhang, D.; Cai, J.; Davenport, J. Legal systems, national governance and renewable energy investment: Evidence from around the world. Br. J. Manag. 2019. [Google Scholar] [CrossRef] [Green Version]
  28. Ragosa, G.; Warren, P. Unpacking the determinants of cross-border private investment in renewable energy in developing countries. J. Clean. Prod. 2019, 235, 854–865. [Google Scholar] [CrossRef]
  29. Keeley, A.R.; Ikeda, Y. Determinants of foreign direct investment in wind energy in developing countries. J. Clean. Prod. 2017, 161, 1451–1458. [Google Scholar] [CrossRef]
  30. Li, H.; An, H.; Fang, W.; Wang, Y.; Zhong, W.; Yan, L. Global energy investment structure from the energy stock market perspective based on a Heterogeneous Complex Network Model. Appl. Energy 2017, 194, 648–657. [Google Scholar] [CrossRef]
  31. Duan, F.; Ji, Q.; Liu, B.Y.; Fan, Y. Energy investment risk assessment for nations along China’s Belt & Road Initiative. J. Clean. Prod. 2018, 170, 535–547. [Google Scholar]
  32. Liu, X.; Zeng, M. Renewable energy investment risk evaluation model based on system dynamics. Renew. Sustain. Energy Rev. 2017, 73, 782–788. [Google Scholar] [CrossRef]
  33. Peng, H.G.; Shen, K.W.; He, S.S.; Zhang, H.Y.; Wang, J.Q. Investment risk evaluation for new energy resources: An integrated decision support model based on regret theory and ELECTRE III. Energy Convers. Manag. 2019, 183, 332–348. [Google Scholar] [CrossRef]
  34. Kim, K.; Park, H.; Kim, H. Real options analysis for renewable energy investment decisions in developing countries. Renew. Sustain. Energy Rev. 2017, 75, 918–926. [Google Scholar] [CrossRef]
  35. Dvořák, P.; Martinát, S.; Van der Horst, D.; Frantál, B.; Turečková, K. Renewable energy investment and job creation; a cross-sectoral assessment for the Czech Republic with reference to EU benchmarks. Renew. Sustain. Energy Rev. 2017, 69, 360–368. [Google Scholar] [CrossRef] [Green Version]
  36. Dinçer, H.; Yüksel, S. Multidimensional evaluation of global investments on the renewable energy with the integrated fuzzy decision-making model under the hesitancy. Int. J. Energy Res. 2019, 43, 1775–1784. [Google Scholar] [CrossRef]
  37. Dincer, H.; Yuksel, S. Balanced scorecard-based analysis of investment decisions for the renewable energy alternatives: A comparative analysis based on the hybrid fuzzy decision-making approach. Energy 2019, 175, 1259–1270. [Google Scholar] [CrossRef]
  38. Ahmad, N.; Du, L. Effects of energy production and CO2 emissions on economic growth in Iran: ARDL approach. Energy 2017, 123, 521–537. [Google Scholar] [CrossRef]
  39. Jiang, S.; Yang, C.; Guo, J.; Ding, Z.; Tian, L.; Zhang, J. Uncovering the Driving Factors of Carbon Emissions in an Investment Allocation Model of China’s High-Carbon and Low-Carbon Energy. Sustainability 2017, 9, 1021. [Google Scholar] [CrossRef] [Green Version]
  40. Li, Y.; Wu, M.; Li, Z. A real options analysis for renewable energy investment decisions under China carbon trading market. Energies 2018, 11, 1817. [Google Scholar] [CrossRef] [Green Version]
  41. Zhang, Y.J.; Sun, Y.F.; Huang, J. Energy efficiency, carbon emission performance, and technology gaps: Evidence from CDM project investment. Energy Policy 2018, 115, 119–130. [Google Scholar] [CrossRef]
  42. Famoso, F.; Wilson, J.; Monforte, P.; Brusca, S.; Lulla, V. Measurement and modeling of ground-level ozone concentration in Catania, Italy using biophysical remote sensing and GIS. Int. J. Appl. Eng. Res. 2017, 12, 10551–10562. [Google Scholar]
  43. Amini, H.; Taghavi-Shahri, S.M.; Henderson, S.B.; Naddafi, K.; Nabizadeh, R.; Yunesian, M. Land use regression models to estimate the annual and seasonal spatial variability of sulfur dioxide and particulate matter in Tehran, Iran. Sci. Total Environ. 2014, 488, 343–353. [Google Scholar] [CrossRef]
  44. Ma, X.; Longley, I.; Gao, J.; Kachhara, A.; Salmond, J. A site-optimised multi-scale GIS based land use regression model for simulating local scale patterns in air pollution. Sci. Total Environ. 2019, 685, 134–149. [Google Scholar] [CrossRef] [PubMed]
  45. Ju, Y.; Fujikawa, K. Modeling the cost transmission mechanism of the emission trading scheme in China. Appl. Energy 2019, 236, 172–182. [Google Scholar] [CrossRef]
  46. Chang, Y.F.; Lin, S.J. Structural decomposition of industrial CO2 emission in Taiwan: An input-output approach. Energy Policy 1998, 26, 5–12. [Google Scholar] [CrossRef]
  47. Bhattacharyya, S.C.; Ussanarassamee, A. Decomposition of energy and CO2 intensities of Thai industry between 1981 and 2000. Energy Econ. 2004, 26, 765–781. [Google Scholar] [CrossRef]
  48. Rhee, H.C.; Chung, H.S. Change in CO2 emission and its transmissions between Korea and Japan using international input–output analysis. Ecol. Econ. 2006, 58, 788–800. [Google Scholar] [CrossRef]
  49. Greening, L.A. Effects of human behavior on aggregate carbon intensity of personal transportation: Comparison of 10 OECD countries for the period 1970–1993. Energy Econ. 2004, 26, 1–30. [Google Scholar] [CrossRef]
  50. Hu, L. Would Urban–Rural Income Gap Affect Carbon Dioxide Emissions? Empirical Research Based on the Extended IPAT Model. Chin. J. Urban Environ. Stud. 2016, 4, 1650014. [Google Scholar] [CrossRef]
  51. Selden, T.M.; Song, D. Environmental quality and development: Is there a Kuznets curve for air pollution emissions? J. Environ. Econ. Manag. 1994, 27, 147–162. [Google Scholar] [CrossRef]
  52. Park, S.; Lee, Y. Regional model of EKC for air pollution: Evidence from the Republic of Korea. Energy Policy 2011, 39, 5840–5849. [Google Scholar] [CrossRef]
  53. Agras, J.; Chapman, D. A dynamic approach to the Environmental Kuznets Curve hypothesis. Ecol. Econ. 1999, 28, 267–277. [Google Scholar] [CrossRef]
  54. Richmond, A.K.; Kaufmann, R.K. Is there a turning point in the relationship between income and energy use and/or carbon emissions? Ecol. Econ. 2006, 56, 176–189. [Google Scholar] [CrossRef]
  55. He, J.; Richard, P. Environmental Kuznets curve for CO2 in Canada. Ecol. Econ. 2010, 69, 1083–1093. [Google Scholar] [CrossRef] [Green Version]
  56. De Wolf, C.; Pomponi, F.; Moncaster, A. Measuring embodied carbon dioxide equivalent of buildings: A review and critique of current industry practice. Energy Build. 2017, 140, 68–80. [Google Scholar] [CrossRef]
  57. Gao, T.; Shen, L.; Shen, M.; Chen, F.; Liu, L.; Gao, L. Analysis on differences of carbon dioxide emission from cement production and their major determinants. J. Clean. Prod. 2015, 103, 160–170. [Google Scholar] [CrossRef]
  58. Song, M.; Guo, X.; Wu, K.; Wang, G. Driving effect analysis of energy-consumption carbon emissions in the Yangtze River Delta region. J. Clean. Prod. 2015, 103, 620–628. [Google Scholar] [CrossRef]
  59. Esso, L.J.; Keho, Y. Energy consumption, economic growth and carbon emissions: Cointegration and causality evidence from selected African countries. Energy 2016, 114, 492–497. [Google Scholar] [CrossRef]
  60. Samimi, M.K.; Sun, S.; Rappaport, T.S. MIMO channel modeling and capacity analysis for 5G millimeter-wave wireless systems. In Proceedings of the 2016 10th European Conference on Antennas and Propagation (EuCAP), Davos, Switzerland, 10–15 April 2016; pp. 1–5. [Google Scholar]
  61. Islam, A.R.M.T.; Ahmed, N.; Bodrud-Doza, M.; Chu, R. Characterizing groundwater quality ranks for drinking purposes in Sylhet district, Bangladesh, using entropy method, spatial autocorrelation index, and geostatistics. Environ. Sci. Pollut. Res. 2017, 24, 26350–26374. [Google Scholar] [CrossRef]
  62. GHaedrahmati, S.; Khademalhoosini, A.; Tahmasebi, F. Spatial analysis of social justice in city of Isfahan, Iran. Ann. GIS 2018, 24, 59–69. [Google Scholar] [CrossRef] [Green Version]
  63. Zhang, H.Y.; Ji, Q.; Fan, Y. What drives the formation of global oil trade patterns? Energy Econ. 2015, 49, 639–648. [Google Scholar] [CrossRef]
  64. Gutiérrez, A.; Domènech, A. The mortgage crisis and evictions in Barcelona: Identifying the determinants of the spatial clustering of foreclosures. Eur. Plan. Stud. 2018, 26, 1939–1960. [Google Scholar] [CrossRef]
  65. Zadeh, L.A. Fuzzy sets. Inf. Control. 1965, 8, 338–353. [Google Scholar] [CrossRef] [Green Version]
  66. Zhu, Y.; Wang, Z.; Pang, L.; Wang, L.; Zou, X. Simulation on China’s economy and prediction on energy consumption and carbon emission under optimal growth path. Acta Geogr. Sin. 2009, 64, 935–944. [Google Scholar]
  67. Zhang, X. Multicriteria Pythagorean fuzzy decision analysis: A hierarchical QUALIFLEX approach with the closeness index-based ranking methods. Inf. Sci. 2016, 330, 104–124. [Google Scholar] [CrossRef]
  68. Li, J.; Wang, J.Q. An extended QUALIFLEX method under probability hesitant fuzzy environment for selecting green suppliers. Int. J. Fuzzy Syst. 2017, 19, 1866–1879. [Google Scholar] [CrossRef]
  69. Ji, P.; Zhang, H.Y.; Wang, J.Q. Fuzzy decision-making framework for treatment selection based on the combined QUALIFLEX–TODIM method. Int. J. Syst. Sci. 2017, 48, 3072–3086. [Google Scholar] [CrossRef]
  70. Liang, W.; Dai, B.; Zhao, G.; Wu, H. Assessing the Performance of Green Mines via a Hesitant Fuzzy ORESTE–QUALIFLEX Method. Mathematics 2019, 7, 788. [Google Scholar] [CrossRef] [Green Version]
  71. Herbohn, K.; Gao, R.; Clarkson, P. Evidence on whether banks consider carbon risk in their lending decisions. J. Bus. Ethics 2019, 158, 155–175. [Google Scholar] [CrossRef]
  72. Zhou, Z.; Zhang, T.; Wen, K.; Zeng, H.; Chen, X. Carbon risk, cost of debt financing and the moderation effect of media attention: Evidence from Chinese companies operating in high-carbon industries. Bus. Strategy Environ. 2018, 27, 1131–1144. [Google Scholar] [CrossRef]
  73. Shamsi, H.; Haghi, E.; Raahemifar, K.; Fowler, M. Five-year technology selection optimization to achieve specific CO2 emission reduction targets. Int. J. Hydrog. Energy 2019, 44, 3966–3984. [Google Scholar] [CrossRef]
  74. Kuriyama, A.; Tamura, K.; Kuramochi, T. Can Japan enhance its 2030 greenhouse gas emission reduction targets? Assessment of economic and energy-related assumptions in Japan’s NDC. Energy Policy 2019, 130, 328–340. [Google Scholar] [CrossRef]
  75. Qin, C.; Wang, J.; Ge, C.; Su, J. Simulating the cost-effectiveness of China’s green transition based on emission reduction targets during the 12th five-year plan period. J. Clean. Prod. 2019, 208, 19–34. [Google Scholar] [CrossRef]
  76. Pollitt, H.; Chewpreecha, U.; Lee, S.; Lee, T.Y.; Mercure, J.F. Policy 5 emission mixes reduction to meet targets CO2 in all sectors of the economy in East Asia. In Energy, Environmental and Economic Sustainability in East Asia: Policies and Institutional Reforms; Routledge: Abingdon-on-Thames, UK, 2019. [Google Scholar]
  77. Wang, Z.; Chen, H.; Huo, R.; Wang, B.; Zhang, B. Marginal abatement cost under the constraint of carbon emission reduction targets: An empirical analysis for different regions in China. J. Clean. Prod. 2020, 249, 119362. [Google Scholar] [CrossRef]
  78. Inglesi-Lotz, R. The impact of renewable energy consumption to economic growth: A panel data application. Energy Econ. 2016, 53, 58–63. [Google Scholar] [CrossRef]
  79. Kahia, M.; Aïssa, M.S.B.; Lanouar, C. Renewable and non-renewable energy use-economic growth nexus: The case of MENA Net Oil Importing Countries. Renew. Sustain. Energy Rev. 2017, 71, 127–140. [Google Scholar] [CrossRef]
Figure 1. Carbon emission factors of provinces in China.
Energies 13 02220 g001
Figure 2. The future emission reduction potential of various provinces in China.
Energies 13 02220 g002
Figure 3. Signed distance d ( A i j , 0 ˜ 1 ) .
Energies 13 02220 g003
Table 1. Linguistic decision matrix for the different levels of emission reduction targets by the provinces in China.
Emission Reduction Level/ProvincesHigh (A1)Moderate (A2)Low (A3)Emission Reduction Level/ProvincesHigh (A1)Moderate (A2)Low (A3)
BeijingAPAPAPJiangxiFMPP
TianjinFFFHenanMGMGF
HebeiVGVGVGHubeiMGMGF
LiaoningGMPVPHunanMGFMP
ShanghaiFMPPNeimengguAGAGAG
JiangsuMPPAPGuangxiFMPP
ZhejiangPVPAPSichuanMGPAP
FujianPVPAPChongqingFPAP
ShandongMGFFGuizhouVGGMG
GuangdongPVPAPYunnanGMGF
HainanPVPAPShaanxiMGPAP
ShanxiAGAGAGGansuGFP
JilingMGPAPQinghaiGFP
HeilongjiangGMPAP
VP: very poor; P: poor; MP: medium poor; F: fair; MG: medium good; G: good; VG: very good.
Table 2. Concordance/discordance index I j l ( A ρ , A β ) .
Permutations/Provinces I j 1 ( A 1 , A 2 ) I j 1 ( A 1 , A 3 ) I j 1 ( A 2 , A 3 ) I j 2 ( A 1 , A 3 ) I j 2 ( A 1 , A 2 ) I j 2 ( A 3 , A 2 ) I j 3 ( A 2 , A 1 ) I j 3 ( A 2 , A 3 ) I j 3 ( A 1 , A 3 )
Beijing0.0000.0000.0000.0000.0000.0000.0000.0000.000
Tianjin0.0000.0000.0000.0000.0000.0000.0000.0000.000
Hebei0.0000.0000.0000.0000.0000.0000.0000.0000.000
Liaoning1.1141.6610.5481.6611.114−0.548−1.1140.5481.661
Shanghai0.4000.7070.3070.7070.400−0.307−0.4000.3070.707
Jiangsu0.3070.5830.2770.5830.307−0.277−0.3070.2770.583
Zhejiang0.2440.2770.0330.2770.244−0.033−0.2440.0330.277
Fujian0.2440.2770.0330.2770.244−0.033−0.2440.0330.277
Shandong0.4480.4480.0000.4480.4480.000−0.4480.0000.448
Guangdong0.2450.2770.0320.2770.245−0.032−0.2450.0320.277
Hainan0.2450.2770.0320.2770.245−0.032−0.2450.0320.277
Shanxi0.0000.0000.0000.0000.0000.0000.0000.0000.000
Jiling1.1551.4330.2771.4331.155−0.277−1.1550.2771.433
Heilongjiang1.1151.6970.5831.6971.115−0.583−1.1150.5831.697
Anhui0.4480.8500.4020.8500.448−0.402−0.4480.4020.850
Jiangxi0.4020.7070.3050.7070.402−0.305−0.4020.3050.707
Henan0.0000.4480.4480.4480.000−0.4480.0000.4480.448
Hubei0.0000.4480.4480.4480.000−0.4480.0000.4480.448
Hunan0.4480.8500.4020.8500.448−0.402−0.4480.4020.850
Neimenggu0.0000.0000.0000.0000.0000.0000.0000.0000.000
Guangxi0.4020.7070.3050.7070.402−0.305−0.4020.3050.707
Sichuan1.1551.4330.2771.4331.155−0.277−1.1550.2771.433
Chongqing0.7070.9850.2770.9850.707−0.277−0.7070.2770.985
Guizhou0.2710.5360.2650.5360.271−0.265−0.2710.2650.536
Yunnan0.2650.7130.4480.7130.265−0.448−0.2650.4480.713
Shaanxi1.1551.4330.2771.4331.155−0.277−1.1550.2771.433
Gansu0.7131.4200.7071.4200.713−0.707−0.7130.7071.420
Qinghai0.7131.4200.7071.4200.713−0.707−0.7130.7071.420
Ningxia0.0320.3030.2710.3030.032−0.271−0.0320.2710.303
Permutations/Provinces I j 4 ( A 2 , A 3 ) I j 4 ( A 2 , A 1 ) I j 4 ( A 3 , A 1 ) I j 5 ( A 3 , A 1 ) I j 5 ( A 3 , A 2 ) I j 5 ( A 1 , A 2 ) I j 6 ( A 3 , A 2 ) I j 6 ( A 3 , A 1 ) I j 6 ( A 2 , A 1 )
Beijing0.0000.0000.0000.0000.0000.0000.0000.0000.000
Tianjin0.0000.0000.0000.0000.0000.0000.0000.0000.000
Hebei0.0000.0000.0000.0000.0000.0000.0000.0000.000
Liaoning0.548−1.114−1.661−1.661−0.5481.114−0.548−1.661−1.114
Shanghai0.307−0.400−0.707−0.707−0.3070.400−0.307−0.707−0.400
Jiangsu0.277−0.307−0.583−0.583−0.2770.307−0.277−0.583−0.307
Zhejiang0.033−0.244−0.277−0.277−0.0330.244−0.033−0.277−0.244
Fujian0.033−0.244−0.277−0.277−0.0330.244−0.033−0.277−0.244
Shandong0.000−0.448−0.448−0.4480.0000.4480.000−0.448−0.448
Guangdong0.032−0.245−0.277−0.277−0.0320.245−0.032−0.277−0.245
Hainan0.032−0.245−0.277−0.277−0.0320.245−0.032−0.277−0.245
Shanxi0.0000.0000.0000.0000.0000.0000.0000.0000.000
Jiling0.277−1.155−1.433−1.433−0.2771.155−0.277−1.433−1.155
Heilongjiang0.583−1.115−1.697−1.697−0.5831.115−0.583−1.697−1.115
Anhui0.402−0.448−0.850−0.850−0.4020.448−0.402−0.850−0.448
Jiangxi0.305−0.402−0.707−0.707−0.3050.402−0.305−0.707−0.402
Henan0.4480.000−0.448−0.448−0.4480.000−0.448−0.4480.000
Hubei0.4480.000−0.448−0.448−0.4480.000−0.448−0.4480.000
Hunan0.402−0.448−0.850−0.850−0.4020.448−0.402−0.850−0.448
Neimenggu0.0000.0000.0000.0000.0000.0000.0000.0000.000
Guangxi0.305−0.402−0.707−0.707−0.3050.402−0.305−0.707−0.402
Sichuan0.277−1.155−1.433−1.433−0.2771.155−0.277−1.433−1.155
Chongqing0.277−0.707−0.985−0.985−0.2770.707−0.277−0.985−0.707
Guizhou0.265−0.271−0.536−0.536−0.2650.271−0.265−0.536−0.271
Yunnan0.448−0.265−0.713−0.713−0.4480.265−0.448−0.713−0.265
Shaanxi0.277−1.155−1.433−1.433−0.2771.155−0.277−1.433−1.155
Gansu0.707−0.713−1.420−1.420−0.7070.713−0.707−1.420−0.713
Qinghai0.707−0.713−1.420−1.420−0.7070.713−0.707−1.420−0.713
Ningxia0.271−0.032−0.303−0.303−0.2710.032−0.271−0.303−0.032

