Abstract
A significant amount of conventional power plants in the European power system is anticipated to be replaced by solar and wind power in the future. This may require alternative sources for inertia support. The purpose of the paper is to learn about the consequences on the frequency deviation after a fault in the European power system when more wind and solar are introduced and when wind is considered as a possible provider of inertia. This study quantifies the expected maximum requirement for additional inertia in the future European power system up to 2050. Furthermore, we investigated the possibility of wind power to meet this additional need by providing emulated inertia. The European power system of the EU-28 countries has been clustered to the five synchronous grids, UCTE, Nordic, UK, Baltic and Irish. The future European energy mix is simulated considering twelve different scenarios. Production units are dispatched according to their expected environmental impacts, which closely follow the minimum natural contribution of inertia, in descending order. The available capacity for all the types of production is considered the same as the installed. For all the simulated scenarios the worst case is examined, which means that a sudden disconnection of the largest production unit of the dispatched types is considered. Case study results reveal that, in most cases, additional inertia will be required but wind power may fully cover this need for up to 84% of all simulated horizons among all the scenarios on the UCTE grid, and for up to 98%, 86%, 99% and 86% on the Nordic, UK, Baltic and Irish grids, respectively.
1. Introduction
Leaders of the G8 and the European Union members stated that they should limit greenhouse gas emissions to at least 80% percent below 1990 levels, before 2050. A requirement that the European power sector would contribute even more to these goals [1]. In order to achieve these goals, a considerable amount of Renewable Energy Sources (RES) need to replace conventional power plants. A transition into a renewable energy supported power system can be done in multiple path-ways, e.g., as proposed in [1,2,3] which are all extensive studies that include important aspects of the transition but not focusing on the impact during disturbances.
Today, wind represents a significant amount, among RES, with 168.7 GW total net installed capacity. It is the second largest type of the installed power generation capacity in Europe and is similar to the installed generation capacity from gas installations [4]. The growth in the installed wind and solar power generation capacity and the subsequent reduction of the conventional power plants (i.e., thermal production units) has already created serious concerns about stability and frequency regulation in the system [5,6]. Synchronous generators resist changes in frequency to support the system by releasing kinetic energy into the grid from their mechanical inertia. Nevertheless, wind power plants consist of generators that are connected to the power system through power electronic converters. These converters often deploy control algorithms that isolate the generators’ operation from the system. Consequently, they are not able to offer natural inertia, resulting in a reduction in the system’s inertia.
The challenges with low inertia are well discussed in the literature [7,8] but they are seldom quantified. There are several approaches to this problem, where the traditional one is to address the nadir frequency [9] since that often determines the actions in the grid due to underfrequency. Grid stability is an upcoming challenge due to low levels of inertia in a power system [8].
The inertia has already started to decrease in Europe, around 20% in the last two decades [10]. In Denmark inertia has decreased below 50% compared with the inertia presented in 1996. The origin of this can be explained by the massive introduction of wind power. However, wind power can also be a source of inertia [10]. The authors show that wind power has the potential to cover up to half of the lost inertia in Denmark.
In [11], the French situation has been studied in detail. It has been found that there is a risk for the French system to fall out of boundary sometimes between 2020 and 2040 and can only be recovered with the massive introduction of nuclear power. In [12] it is shown that already in 2025 the lack of inertia will cause a curtailment in the Nordic system even if the impact only will be minor. The need for inertia in the Nordic system has also been studied in [9], where it was also found that additional inertia will be needed. In some extreme cases, the system inertia needs to be five times as high as it would be during business as usual. The author in [9] also identified that during low load situations there will be an extra challenge, which probably cannot be met by the current system. In [13] ENTSO-E provides guidance for national implementation, on emulated inertia aspects in power systems with high penetration of RES. Particularly, it focuses on the performance requirements of the emulated inertia from a functional perspective, regarding two major objectives, the limitation of the system’s initial rate of change of frequency (RoCoF) and the limitation of the lower/higher nadir of the frequency.
Several other studies have highlighted the situation [7,14,15,16]. Consequently, different solutions have been proposed to be able to achieve a 100% renewable electricity production. In [7,15], market based solutions are proposed and in [16] the concept of Virtual Synchronous Generator (VSG) is further developed. If VSG is properly introduced, it can support conversion to a 100% power electronic generation [16]. An economic comparison between alternative inertia providers has shown that flywheel storage is the least costly solution for inertia support among storage technologies including batteries and supercapacitors [17]. Furthermore, in [18], an overview of different types of battery energy storage system (BESS) technologies and their potential to provide emulated inertia in the power system is presented. In a similar context, the study presented in [19] has investigated the requirements of BESS for participation in frequency and RoCoF services, verifying their positive effect on these services. Most of the technologies mentioned above are connected to the grid through power converters. An inclusive review of conventional and emerging inertia optimization techniques of power converters is shown in [20]. Finally, the authors in [21] propose and evaluate a synthetic inertia control scheme that utilizes the energy stored in the DC link capacitors of the VSC-HVDC systems, verifying its contribution to reducing the nadir. The interest and the potential for these technologies are great but not yet mature [8] and therefore are not considered in this paper.
However, having sufficient inertia in the system is not enough [22] as also the location is important to avoid inter-area oscillations.
The aim of this paper is to get a quantified overview of the maximum requirement for additional inertia in the European power system up to 2050 and to investigate the theoretical potential of wind power as a provider of that additional inertia need. Twelve different scenarios of future electricity production mix in Europe, by three different providers, are considered [1,2,3]. For each scenario, the frequency deviation is examined in the worst case, not to risk to underestimate the need. The use of smaller contributors of inertia such as wind turbines will have a damping effect [22] but is not addressed further in this paper. The key assumptions that have been considered in the study are summarized below:
- The future response time of the European grid should match with the current one and the frequency should not deviate more than 1% of the nominal value (50 Hz) as is set by the ENTSO-E.
- The units are considered dispatched according to their sustainability, which was in a high degree relevant to the minimum natural contribution of the inertia, in descending order and the available power output for all the forms of production is equal to the corresponding installed capacities. Specifically, the assumed units’ dispatch order, in descending order of priority, is solar, wind, biomass, hydro, nuclear, gas and fossil. Moreover, a loss of the largest dispatched production unit is assumed as the worst case.
- Each one of the European synchronous grids such as UCTE, Nordic, UK, Baltic and Irish are simulated using a hydropower system model, although the future systems’ characteristics may differ. The study focuses on the requirement for additional inertia in order to keep the frequency within the acceptable limits, ignoring the response time and the rest of the dynamic parameters. Furthermore, the approximation of the future synchronous grids’ models lies a complex computational procedure requiring additional data.
- Solar variation has been implemented according to the seasonal and daily limitations of each region. A geographical location has been assumed for each grid on its southernmost part. When the sun is above the horizon, solar production is taken equal to the installed capacity. These assumptions reflect the purpose of the study, which is to investigate the maximum requirement for additional inertia in worst case.
The need for additional inertia to keep the frequency response stable and within its limits is found for all the scenarios and afterward, the theoretical contribution of wind power to this additional need is calculated. The paper is organized as follows: Section 2 presents the related theory of, power systems’ inertia, the emulated inertia of wind turbines and the astronomical part of the model. In Section 3, the case study is described in detail, and in Section 4, the relevant results are presented and discussed. Finally, conclusions are drawn in Section 5.
2. Theoretical Background
2.1. Inertia in Power Systems
The dynamic behavior of a synchronous machine i is described using the motion Equation (1).
where Hi is the inertia constant of the machine i and is given by (2).
In the above formulas, fi is the frequency, Pmi is the mechanical power of the turbine, Sni is the nominal apparent power, Pei is the electrical power of generator i, fn (ωn) is the nominal frequency (rotational speed) and Ji is the moment of inertia of the generator.
Power systems normally contain a huge number of production units, hence it is common for stability studies to use a reference transformation, a so called Center of Inertia (COI), where all the generators of the system are represented by one theoretical equivalent generator rotating with speed. In a power system with N generators, the motion equation is expressed by (3) [23].
where Hsys is the power system’s total inertia and is defined as:
Instead of expressing power system’s inertia in seconds, it is more useful to calculate the kinetic energy stored in the rotating masses of the system (Ek,sys) in gigawatt seconds (GWs). Therefore, (4) can be written as:
2.2. Synthetic Inertia of Wind Turbines
The potential of synthetic inertia capabilities of wind power turbines has been investigated thoroughly during the last years. Plenty of synthetic inertia control schemes for the different types of wind turbines, such as fixed speed wind turbines (FSWTs) and variable speed wind turbines (VSWTs) have been proposed and designed by both industry and academia [24,25,26,27,28,29].
In VSWTs the conversion of the mechanical input power to the output electrical power is regulated by the power electronic converter’s controller. This controller varies the generator’s real power output independently from any other parameter. The deviation between the input power and the output power is stored as kinetic energy in the rotor, varying the rotor’s speed.
To support inertia emulation, the controller needs to adopt a different control philosophy. Since a VSWT distributes power, according to a predefined power set point that is set in its controller, an increase in the power output requires an appropriate adaptation in the power set point. The extra energy would be “borrowed” by the rotor’s stored kinetic energy like a synchronous generator during a frequency disturbance [29].
2.3. Astronomical Part of the Model
Solar power has a regular behavior that is taken into consideration by making the dispatch during night hours not possible. This has been implemented by considering the astronomical effects [30], regarding the earth rotation around the sun and the rotation of the earth around its axis. The angle between the equatorial plane and a line linking the centers of the Sun and the Earth is called the declination angle (δ). The declination angle expresses the seasonal effects and can be calculated approximately by (6).
where, δ is the declination angle in radians and n is the day number, so that n = 1 on the 1st January. The solar altitude angle describes the daily variations and is given by (7).
where, α is the altitude angle of the sun, φ is the observer’s latitude and Hr is the hour angle and can be calculated for every hour of the day by (8).
3. Case Study Setup
The European Power System of the EU-28 countries has been partitioned to the five synchronous grids, UCTE, Nordic, UK, Baltic and Irish, that are illustrated in Figure 1.
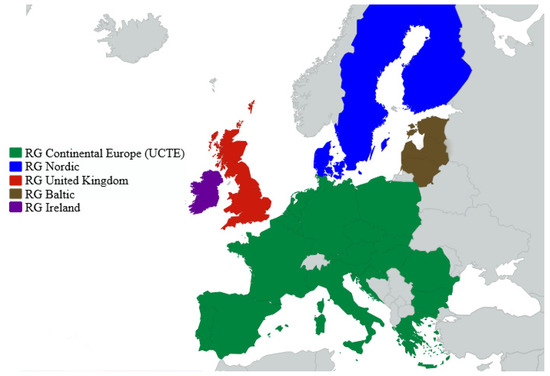
Figure 1.
European Synchronous Power Systems.
UCTE is composed of Luxembourg, Croatia, Slovenia, Slovakia, Hungary, Austria, Belgium, Netherlands, Czech Republic, Greece, Bulgaria, Germany, France, Malta, Italy, Romania, Portugal, Poland, Spain, and Cyprus. The Nordic grid includes Sweden, Denmark, and Finland. Although Western Denmark is part of the UCTE grid, it is assumed that both western and eastern parts of Denmark are included in the Nordic grid and Norway is also excluded, since it is not part of the EU-28 countries. UK grid covers Great Britain, the Baltic grid is composed of Lithuania, Latvia, and Estonia and the Irish grid includes Ireland. Each of these is simulated utilizing the model developed in [31], which was also used in [9], and is shown in Figure 2.
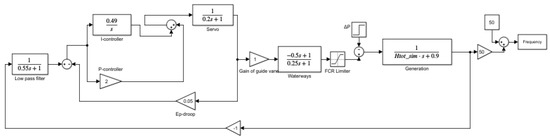
Figure 2.
Synchronous grids’ dynamic Simulink model.
The power system model is simulated as a system with hydropower characteristics, which is in line with the direction of the ENTSO-E desire for the whole European system. The grid was not considered since the paper addresses an overview question about the need of the system. The exclusion of grid impact is in agreement with the evaluated scenarios from [1,2,3] Grid limitations would, of course, impact the results negatively, but would likely have a similar effect on the realization of the different scenarios.
Moreover, the scenarios that the study is based on, do not specify the location of the new production, which makes it less relevant to consider grid impacts. Authors in [31] tuned the model’s parameters relying on historical measurements of the Nordic grid’s frequency response. In our case study, it is assumed that in the future all the five synchronous grids would have the same frequency response with Nordic’s current one, therefore the values of the parameters are the same. In Figure 2, Htot_sim is the system’s inertia parameter and ΔP represents the unit’s power which is considered as disconnected.
Twelve scenarios has been obtained from three different providers, the McKinsey and Company, the European Commission and the DNV-GL [1,2,3]. Two scenarios (EU2030 and EU2050) have been provided by the European Commission in the context of EU Reference Scenario 2016, regarding the trend projections of the EU energy system, transportation and greenhouse gas (GHG) emissions up to 2050. The Green and Clean scenarios have been prepared by McKinsey and Company and they focus on prospective developments of the European energy sector for the years 2020 up to 2050. The rest of the scenarios (1, 1-DG, 1a, 1a-DG, 1b, 1b-DG, 2, 3) have been developed by the DNV-GL aiming to analyze how Europe can decarbonize its electricity sector until 2030. The scenarios are selected for comparison reasons and to give also a possibility to study the different combinations of production units and a different system’s total size. In Table 1, the installed capacities per type of production, as well as the total annual generation of the EU-28 countries are illustrated for each scenario separately, as they have been obtained from the three aforementioned providers.

Table 1.
Installed capacities and annual generation for each scenario.
The hourly consumption time series has been obtained from the ENTSO-E [32] for the year 2017. Moreover, the proportions of the annual consumption and the installed capacities per type of production, each of the considered synchronous grids, in the total European power system, have been obtained from [2] and are presented in Figure 3. Afterwards, the consumption was scaled up for each synchronous grid, according to the total annual production as defined by the different scenarios (Table 1).
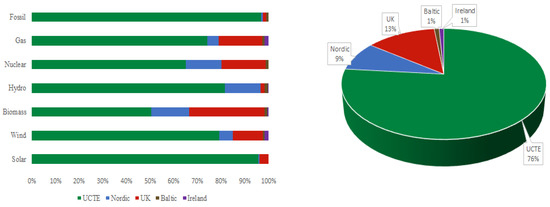
Figure 3.
The proportions of the installed capacities per type of production for each of the synchronous grids in the total European power system (on the left) and the fraction of the annual consumptions in the total (on the right).
It can be seen that solar and fossil fuel installations are more frequent in the UCTE grid than in the other grids. In the Nordic grid, nuclear, biomass and hydro are the dominant generation units, while wind power amounts to 6% of the total EU-28 wind power production. The grids’ frequency response is simulated hourly for the whole year after a disturbance caused by a disconnection of the largest dispatched production unit.
The capacities of the largest generation units have been taken from the ENTSO-E transparency platform and are illustrated in Figure 4, [32]. The need for additional inertia to keep the frequency stable and within the acceptable limits, as set by the ENTSO-E (i.e., 49.5–50.5 Hz), is calculated for all the synchronous grids and for each scenario. The algorithm runs iteratively checking the value of the frequency nadir and the response time of the system. Whenever the response time deviates from certain limits, that are set according to the hydropower model as was described above, or the frequency nadir falls below 49.5 Hz, wind turbine’s emulated inertia (Hwind) is increased by a discrete value and system’s inertia (Htot_sim) is calculated again. This discrete value defines the algorithm’s accuracy as well as its running time and has been set to 0.1. It should be mentioned that initially Hwind is set to 0. The extra inertia added to the parameter Hwind corresponds to the requirement for additional inertia due to the high penetration of renewable energy resources, in accordance with (4). The overall computational procedure is illustrated in Figure 5.
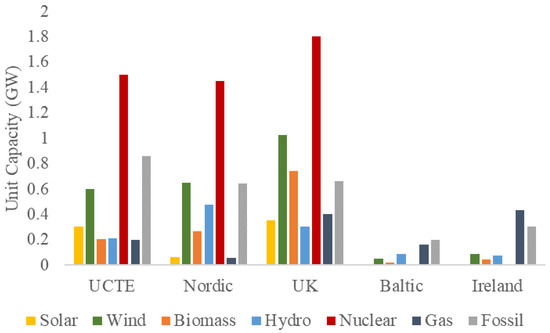
Figure 4.
Largest production units in each area of the different type of production.
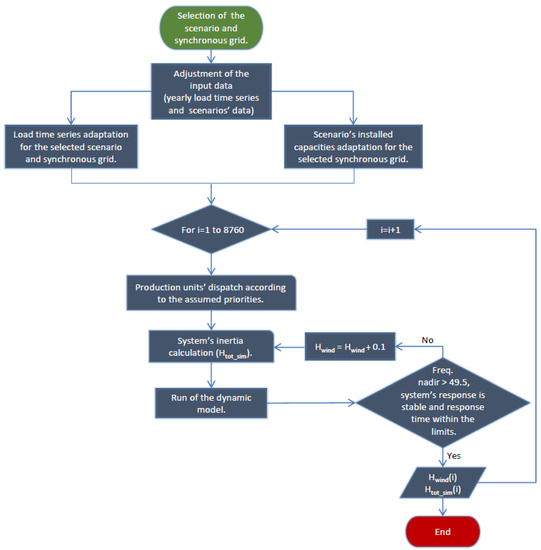
Figure 5.
Flowchart diagram of the computational procedure.
In Table 2, the considered inertia constants for the production units are presented, where 0 is set for wind and solar as they do not provide a natural inertia contribution. Other constants are in line with [33]. There is a wide span of data proposed in the literature, but lower levels are selected for a conservative approach. It is also worth mentioning that the operating power output is identical to the installed capacities and the units are dispatched according to their sustainability. For solar limitation, the seasonal and daily variations of each region have been taken into account. Five latitudes have been considered, on the southernmost parts of each grid, to find the most conservative approach since that is expected to be the maximum solar power in the system. When the sun is above the horizon, solar production is assumed to be the maximum available, reflecting the aim of the paper to investigate the maximum need for additional inertia (worst case) since solar power does not contribute to inertia but rather pushes away inertia contributing sources.
Table 2.
Inertia constants.
Thence, the percentage of the additional inertia which wind power could provide to the grid is calculated. As it was mentioned above, wind turbines can provide emulated inertia to the grid through the power converters they are connected to, utilizing appropriate control schemes.
According to [34,35,36], typical values of the inertia constant H for variable speed wind turbines are between 2–6 s. However, if only a part of the wind turbines is utilized for support, lower levels of contributions can be achieved on a system level. Our study is based on these values (0–6 s) to estimate the proportion of wind power contribution to the total requirement for additional inertia.
4. Results and Discussion
4.1. Requirement for Additional Inertia until 2050
The need for additional inertia, which has been calculated for each simulated hour, has been estimated in GWs according to (5). Furthermore, the range, mean and standard deviation, among the whole simulated horizon and for each scenario have been computed and are presented below. In Figure 6a, UCTE grid’s requirement for additional inertia is illustrated. As can be observed, the maximum need ranges between the values 365–636 GWs, with the Green scenario presenting the highest value, while the minimum value varies between 0 and 206 GWs. The mean values depend on the scenario, with an average between all of them, lying around to 262 GWs. In most of the scenarios, the requirement is to be observed highly dispersed during the year. Nonetheless, there are simulated hours, where the need is double the mean value, indicating the worst cases during the year.
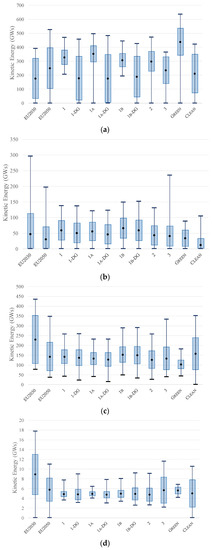
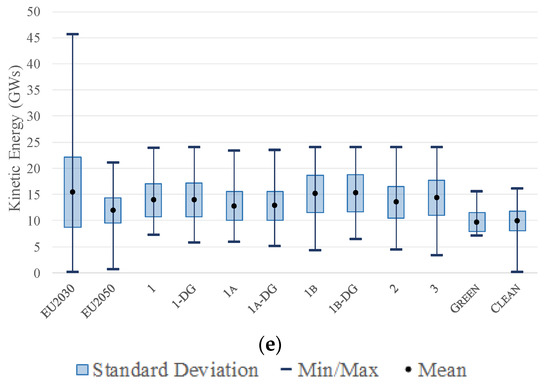
Figure 6.
Requirement for additional inertia in the (a) UCTE, (b) Nordic, (c) UK, (d) Baltic and (e) Irish synchronous grids.
The Nordic grid’s maximum need for additional inertia varies between the values 88 and 295 GWs and the minimum requirement is zero in all the scenarios which is in line with what was found in [9] and can be seen in Figure 6b. In this grid, the need is less dispersed, and all the scenarios show a mean value of about 45 GWs.
In the UK grid, the maximum additional requirement for inertia ranges between the values 182 and 435 GWs and the minimum requirement between 0 and 78 GWs, as illustrated in Figure 6c. The average among all the scenarios is 145 GWs. Compared to the other scenarios, the EU2030 scenario shows a very high standard deviation.
Figure 6d depicts the maximum and minimum need for additional inertia in the Baltic synchronous grid. The maximum requirement varies between the values 6.4 and 17.7 GWs and the minimum need between the values 0 and 4.1 GWs. The projected wind and solar penetration in the Baltic countries in the coming years is moderated, thus the conventional plants could provide a part of the requirement. In most of the scenarios, the requirement is low dispersed during the year and the grand average between the scenarios lies to 5 GWs.
Finally, the Irish grid’s maximum additional need for inertia ranges between 15.5 and 45.5 GWs, with the EU2030 scenario showing a considerably higher maximum need. The minimum value varies between 0 and 7.1 GWs, depending on the scenario, see Figure 6e. The mean and the standard deviation are in accordance among all the scenarios and the total average of the requirement is about 13 GWs.
4.2. Wind Power Contribution on Inertia Support
As previously mentioned, a maximum value of 6 s has been considered for wind power’s inertia constant. As it can be seen in Figure 7a wind power could completely fulfill the demand for additional inertia in the UCTE grid for up to 84% (Full support), which has been computed between all the scenarios and simulated hours. It should be mentioned that, when the need for inertia exceeds wind power’s capability for inertia support, videlicet Hwind variable’s value exceeds the limit of 6 s, then the wind power could only partially cover the requirement (Partially support). Also, when the wind power is not dispatched at all, inertia support is not possible (No support). In scenarios with higher solar installed capacities and less annual generation (1-DG, 1a-DG, 1b-DG), where solar production may almost fulfill the energy demand, full inertia support of wind power is limited. For instance, UCTE’s solar and wind power installed capacities correspond approximately to 95% and 80%, respectively, of the EU-28 countries’ total solar and wind power installed capacities. Therefore, there are cases where the considered solar production could cover the demand and wind power would not be dispatched, therefore inertia support is no possible.
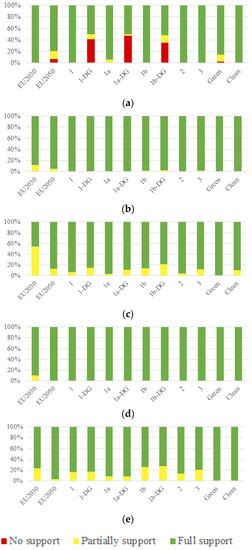
Figure 7.
Wind power contribution on inertia support for the (a) UCTE, (b) Nordic, (c) UK, (d) Baltic and (e) Irish synchronous grids.
It can be concluded from Figure 7b,c that for the Nordic and UK grids, full inertia support is possible for up to 98%, 86%, respectively. In the Nordic grid, the installed solar and wind power capacities represent 0.3% and 6% of the total, respectively, while in the UK grid the proportions of solar and wind power capacities are 3.8% and 11% of the total, correspondingly. Consequently, in most cases wind power sources are dispatched and could offer emulated inertia into the grids.
In the Baltic grid, wind power could provide full inertia support up to 99%. The solar and wind power installed capacities correspond to 0.03% and 0.96% of the EU-28 countries’ total installed capacities. As was mentioned before the projected wind and solar penetration in the Baltic countries is limited, hence conventional plants are dispatched and cover partially the need for inertia, reflecting the low values in Figure 6d. Finally, in the Irish grid wind power may provide up to 86% full inertia support. Although the wind penetration in Ireland is high, the fractions of the solar and wind power installed capacities are approximately 0.02% and 1.5%, respectively. Moreover, relative to its size the maximum need for inertia is quite high as can be seen in Figure 6e.
From Table 1 and Figure 7, it can be observed that an increase in the annual consumption and/or in the wind power installed capacity, influences positively the proportion of the wind power’s full inertia support, while an increase in the solar installed capacity acts negatively. The system implications of wind turbines providing inertia are in focus in this study, but the long-term effects on the wind turbines are not yet fully understood [37]. This is a necessity for the full-scale introduction. Another area, where development is needed, is the deployment of new business models to make it financially interesting for wind power owners to participate in inertia support.
Even though there is a great potential for the wind power to cover the majority of the requirement, there is also a need to constantly study each synchronous area individually, to be able to take local circumstances into account, e.g., grid capacity and the distribution of the providers [22].
During the transition between the current system and the system described in the scenarios, there might be a temporary need for additional inertia but that is not discussed in this study. However, since the need is temporary, measures to handle it might be different due to the relatively short time horizon.
Overall, the study quantified the expected maximum need for additional inertia in the future European power system up to 2050 and the potential contribution of wind power to this need was estimated. Nonetheless, the applied methodology was based on some key limitations and assumptions, which have been mentioned before and are summarized below. First of all, the five European synchronous grids have been simulated using a tailormade model developed for the Nordic grid and the dynamics of each grid have an impact on the result. The other four grids have currently different dynamics and, all the five grids’ dynamic characteristics may change considerably up to 2050. This does not make it possible to make more detailed studies so far ahead, but the aim of the study is only to get an overview.
An essential assumption is the implementation of a simplified dispatch order, that corresponds to the minimum natural contribution of the inertia. A more realistic units’ dispatch requires an in-detail knowledge of the hourly expected planning of all the EU-28 countries. Even though the implementation of a more analytical dispatch would lead to more probable results, the followed approach reflects the worst-case, which is examined in the study. In the same way, the grids’ solar variation has been implemented according to the seasonal and daily limitations of each region, assuming a geographical location on their southernmost part, neglecting, a detail allocation of the solar power units, the hourly solar irradiance and the rest of the parameters, which constraint and influence the hourly solar power generation in the countries.
Improvements in the results could be achieved by developing the future power systems’ dynamics more accurately, as well as by the implementation of a more realistic expected hourly dispatch in all the considered national grids. Finally, since the scenarios might change, there could be a need for an update of the study to continue getting up-to-date overviews for the future additional need for inertia in the European power system.
5. Conclusions
In this paper, the need for additional inertia in the European Power Systems was quantified. From the results, it can be concluded that although wind power may be the main source of emulated inertia, alternative options should be employed to cover fully the requirement for additional inertia. By using other types of providers of emulated inertia, they might be able to contribute in another way, like lowering the RoCoF. Some of these options, as already mentioned in the literature review, could be the different storage technologies, as well as the VSC-HVDC systems.
It is also shown that, for some grids, it is highly dependent on how the conversion to a 100% renewable is achieved. This seems to be a larger challenge for the UTCE grid than in the Nordic countries and the UK, since the UTCE is expected to be more dependent on solar power, while the Nordic countries and the UK rely more on wind power.
Author Contributions
Both authors contributed substantially to the work leading up to this article. By: conceptualization, J.E. methodology, J.E.; software, C.A.; validation, J.E.; formal analysis, J.E.; investigation, C.A.; resources, J.E.; Data curation, C.A.; writing—original draft preparation, C.A. and J.E.; visualization, C.A. and J.E.; project administration J.E.; funding acquisition, J.E. All authors have read and agreed to the published version of the manuscript.
Funding
This research has received funding in the framework of the joint programming initiative ERA-Net Smart Grids Plus, with support from the European Union’s Horizon 2020 research and innovation programme.
Acknowledgments
We would like to thank Stergios Statharas from Energy-Economy-Environment Modelling Laboratory (E3MLab) at the National Technical University of Athens for his fruitful scientific support during the study.
Conflicts of Interest
The authors declare no conflict of interest. The funders had no role in the design of the study; in the collection, analyses, or interpretation of data; in the writing of the manuscript, or in the decision to publish the results.
References
- McKinsey&Company. Transformation of Europe’s Power System Until 2050, for Germany, Electric Power and Natural Gas Practice. 2010. Available online: https://www.mckinsey.com/~/media/mckinsey/dotcom/client_service/epng/pdfs/transformation_of_europes_power_system.ashx (accessed on 7 February 2020).
- European Commission. EU Reference Scenario 2016 Energy, Transport and GHG Emissions Trends to 2050; European Commission: Brussels, Belgium, 2016. [Google Scholar]
- DNV-GL. Integration of Renewable Energy in Europe, ENER/C1/427-2010. 2014. Available online: https://www.dnvgl.com/publications/integration-of-renewable-energy-in-europe-103268 (accessed on 7 February 2020).
- Wind Europe. Wind in Power 2017 Annual Combined onShore and Offshore Wind Energy Statistics. 2018. Available online: https://windeurope.org/wp-content/uploads/files/about-wind/statistics/WindEurope-Annual-Statistics-2017.pdf (accessed on 7 February 2020).
- Doherty, R.; Mullane, A.; Nolan, G.; Burke, D.J.; Bryson, A.; O’Malley, M. An Assessment of the Impact of Wind Generation on System Frequency Control. IEEE Trans. Power Syst. 2010, 25, 452–460. [Google Scholar] [CrossRef]
- Wang, Y.; Delille, G.; Bayem, H.; Guillaud, X.; Francois, B. High Wind Power Penetration in Isolated Power Systems—Assessment of Wind Inertial and Primary Frequency Responses. IEEE Trans. Power Syst. 2013, 28, 2412–2420. [Google Scholar] [CrossRef]
- Hartmann, B.; Vokony, I.; Táczi, I. Effects of decreasing synchronous inertia on power system dynamics—Overview of recent experiences and marketisation of services. Int. Trans. Electr. Energy Syst. 2019, 29, e12128. [Google Scholar] [CrossRef]
- Johnson, S.C.; Papageorgiou, D.J.; Mallapragada, D.S.; Deetjen, T.A.; Rhodes, J.D.; Webber, M.E. Evaluating rotational inertia as a component of grid reliability with high penetrations of variable renewable energy. Energy 2019, 180, 258–271. [Google Scholar] [CrossRef]
- Nesje, B. The Need for Inertia in the Nordic Power System. Master’s Thesis, Norwegian University of Science and Technology, Trondheim, Norway, 2015. [Google Scholar]
- Fernández-Guillamón, A.; Gómez-Lázaro, E.; Muljadi, E.; Molina-García, Á. Power systems with high renewable energy sources: A review of inertia and frequency control strategies over time. Renew. Sustain. Energy Rev. 2019, 115, 109369. [Google Scholar] [CrossRef]
- Seck, G.S.; Krakowski, V.; Assoumou, E.; Maïzi, N.; Mazauric, V. Embedding power system’s reliability within a long-term Energy System Optimization Model: Linking high renewable energy integration and future grid stability for France by 2050. Appl. Energy 2020, 257, 114037. [Google Scholar] [CrossRef]
- Nycander, E.; Söder, L.; Olauson, J.; Eriksson, R. Curtailment analysis for the Nordic power system considering transmission capacity, inertia limits and generation flexibility. Renew. Energy 2020, 152, 942–960. [Google Scholar] [CrossRef]
- ENTSO-E. Need for Synthetic Inertia (SI) for Frequency Regulation; ENTSO-E: Brussels, Belgium, 2017. [Google Scholar]
- van Zuijlen, B.; Zappa, W.; Turkenburg, W.; van der Schrier, G.; van den Broek, M. Cost-optimal reliable power generation in a deep decarbonisation future. Appl. Energy 2019, 253, 113587. [Google Scholar] [CrossRef]
- Akrami, A.; Doostizadeh, M.; Aminifar, F. Power system flexibility: An overview of emergence to evolution. J. Mod. Power Syst. Clean Energy 2019, 7, 987–1007. [Google Scholar] [CrossRef]
- Chen, J.; Liu, M.; O’Donnell, T. Replacement of Synchronous Generator by Virtual Synchronous Generator in the Conventional Power System. In Proceedings of the 2019 IEEE Power & Energy Society General Meeting (PESGM), Atlanta, GA, USA, 4–8 August 2019; pp. 1–5. [Google Scholar]
- Gloe, A.; Jauch, C.; Craciun, B.; Winkelmann, J. Continuous provision of synthetic inertia with wind turbines: Implications for the wind turbine and for the grid. IET Renew. Power Gener. 2019, 13, 668–675. [Google Scholar] [CrossRef]
- Divya, K.C.; Østergaard, J. Battery energy storage technology for power systems—An overview. Electr. Power Syst. Res. 2009, 79, 511–520. [Google Scholar] [CrossRef]
- Brogan, P.V.; Best, R.J.; Morrow, D.J.; McKinley, K.; Kubik, M.L. Effect of BESS Response on Frequency and RoCoF During Underfrequency Transients. IEEE Trans. Power Syst. 2019, 34, 575–583. [Google Scholar] [CrossRef]
- Fang, J.; Tang, Y.; Li, H.; Blaabjerg, F. The Role of Power Electronics in Future Low Inertia Power Systems. In Proceedings of the 2018 IEEE International Power Electronics and Application Conference and Exposition (PEAC), Shenzhen, China, 4–7 November 2018; pp. 1–6. [Google Scholar]
- Zhu, J.; Booth, C.D.; Adam, G.P.; Roscoe, A.J.; Bright, C.G. Inertia Emulation Control Strategy for VSC-HVDC Transmission Systems. IEEE Trans. Power Syst. 2013, 28, 1277–1287. [Google Scholar] [CrossRef]
- Osbouei, B.A.; Taylor, G.A.; Bronckart, O.; Maricq, J.; Bradley, M. Impact of Inertia Distribution on Power System Stability and Operation. In Proceedings of the 2019 IEEE Milan Power Tech, Milan, Italy, 23–27 June 2019; pp. 1–6. [Google Scholar]
- Machowski, J.; Bialek, J.; Bumby, J. Power System Dynamics, Stability and Control, 2nd ed.; John Wiley&Sons, Ltd.: Hoboken, NJ, USA, 2008. [Google Scholar]
- Zeng, X.; Liu, T.; Wang, S.; Dong, Y.; Chen, Z. Comprehensive Coordinated Control Strategy of PMSG-Based Wind Turbine for Providing Frequency Regulation Services. IEEE Access 2019, 7, 63944–63953. [Google Scholar] [CrossRef]
- Miller, N.W.; Clark, K. Advanced controls enable wind plants to provide ancillary services. In Proceedings of the IEEE PES General Meeting, Providence, RI, USA, 25–29 July 2010; pp. 1–6. [Google Scholar]
- Lalor, G.; Mullane, A.; O’Malley, M. Frequency control and wind turbine technologies. IEEE Trans. Power Syst. 2005, 20, 1905–1913. [Google Scholar] [CrossRef]
- Gao, W.; Wu, Z.; Wang, J.; Gu, S. A review of inertia and frequency control technologies for variable speed wind turbines. In Proceedings of the 2013 25th Chinese Control and Decision Conference (CCDC), Guiyang, China, 25–27 May 2013; pp. 2527–2533. [Google Scholar]
- Loukarakis, E.; Margaris, I.; Moutis, P. Frequency control support and participation methods provided by wind generation. In Proceedings of the 2009 IEEE Electrical Power & Energy Conference (EPEC), Montreal, QC, Canada, 22–23 October 2009; pp. 1–6. [Google Scholar]
- Wickramasinghe, A.; Meegahapola, L.; Agalgaonkar, A.P.; Perera, S. Design considerations for inertia emulating controllers used in variable speed wind turbines. In Proceedings of the 2014 IEEE PES General Meeting|Conference & Exposition, National Harbor, MD, USA, 27–31 July 2014; pp. 1–5. [Google Scholar]
- Masters, G. Renewable and Efficient Electric Power Systems, 2nd ed.; Wiley-IEEE Press: Hoboken, NJ, USA, 2013. [Google Scholar]
- Ørum, E.; Kuivaniemi, M.; Laasonen, M.; Bruseth, A.I.; Jansson, E.A.; Danell, A.; Elkington, K.; Modig, N. ENTSOE Report: Future System Inertia; ENTSOE: Brussels, Belgium, 2017. [Google Scholar]
- ENTSO-E. ENTSO-E Transparency Platform; ENTSO-E: Brussels, Belgium, 2017. [Google Scholar]
- Kundur, P. Power System Stability and Control, 1st ed.; McGraw-Hill: New York, NY, USA.
- Persson, M.; Chen, P. Frequency control by variable speed wind turbines in islanded power systems with various generation mix. IET Renew. Power Gener. 2017, 11, 1101–1109. [Google Scholar] [CrossRef]
- Ackermann, T. (Ed.) Wind Power in Power Systems; John Wiley&Sons, Ltd.: Hoboken, NJ, USA, 2005. [Google Scholar]
- Morren, J.; de Haan, S.W.H.; Kling, W.L.; Ferreira, J.A. Wind turbines emulating inertia and supporting primary frequency control. IEEE Trans. Power Syst. 2006, 21, 433–434. [Google Scholar] [CrossRef]
- Wang, X.; Gao, D.W.; Wang, J.; Yan, W.; Gao, W.; Muljadi, E.; Gevorgian, V. Implementations and Evaluations of Wind Turbine Inertial Controls With FAST and Digital Real-Time Simulations. IEEE Trans. Energy Convers. 2018, 33, 1805–1814. [Google Scholar] [CrossRef]


© 2020 by the authors. Licensee MDPI, Basel, Switzerland. This article is an open access article distributed under the terms and conditions of the Creative Commons Attribution (CC BY) license (http://creativecommons.org/licenses/by/4.0/).