Abstract
We have developed an energy-saving operations system featuring remote operation of central monitoring equipment installed in a building. This system applies robotic process automation to remote operation to automatically perform energy-saving operations on behalf of the operations manager. Furthermore, as another feature, the system requires only a local area network to connect to the central monitoring equipment enabling automatic operation to be performed regardless of the specifications of the central monitoring equipment. The items targeted for energy-saving operation by this system are the optimal operation of a heat source system, setting of the supply water temperature of heat source equipment, setting of room temperature, and setting of outside-air intake volume. At present, the operations manager has the role of performing these energy-saving operations, but finding the optimal value for each of these operations is a difficult task. An operations manager, moreover, is responsible for tasks other than facility operations such as maintenance management, so changing optimal settings accurately at regular intervals on an ongoing basis can be quite a burden. This system uses robotic process automation technology, so it is capable of performing all energy-saving operations that can be executed by the central monitoring equipment. We installed this system in a large-scale shopping mall and performed energy-saving operations on outside-air processing units. In this trial, we achieved a 44% reduction in the amount of energy required for outside-air processing and a 47% reduction in CO2 emissions.
1. Introduction
There are concerns that the present increase in worldwide energy consumption will lead to a depletion of energy resources and facilitate global warming owing to an increase in CO2 emissions. It has been reported that the ratio of energy consumed by residential homes and commercial buildings in developed countries has reached 20% to 40% of total energy consumption surpassing that in the industry and transport sectors [1]. In Japan, meanwhile, energy-saving initiatives driven by energy-saving laws and regional regulations resulted in a 15% reduction in the amount of energy used during the one-year period from April 2017 to March 2018 relative to that of the one-year period from April 2000 to March 2001 [2]. On the other hand, achieving the reduction target for CO2 emissions established for Japan [3] at COP25 (Conference of the Parties, 2019 United Nations Climate Change Conference) will require further promotion of energy-saving measures. Energy-saving initiatives are mainly centered on a reduction in energy demand (excluding waste), improvements in the form of high-efficiency equipment and systems, and introduction of renewable energy.
In Japan, progress is being made in the deployment of energy-saving equipment based on various types of subsidies. At the same time, energy-saving measures that call for continuous high-efficiency operation of existing facilities (referred to below as “optimal operation measures”) are being recommended as an effective approach [4]. Here, “optimal operation” refers to actions that attempt to make optimal settings with respect to the operation of equipment, devices, and systems and control values. It includes optimal operation of heat source equipment and adjustment of its supply water temperature, adjustment of outside-air intake volume for air conditioning use, and adjustment of air conditioning (room) temperature. In Japan, such operations are called “energy-saving tuning,” which is being widely promoted together with the provision of tools for estimating energy-saving potential [5].
However, effective energy-saving laws are not actively being enacted in Japan. The reason given for this is that facility equipment and systems are advanced and complex making it difficult for operations managers to find optimal values (referred to below as “optimal operation values”) for running facility equipment and systems with high efficiency. In addition, the targets of optimal operation are wide-ranging including heat source equipment and air conditioning equipment, which, it is said, would make it impossible for an operations manager to continuously achieve optimal operation from hour to hour.
A variety of simulation methods that deal with this difficulty of finding optimal operation values have been proposed [6,7]. It is also possible to execute facility operations without any actions by an operations manager by setting optimal operation values in automatic control equipment. For example, manufacturers have proposed automatic multiple-units operation control and supply water temperature control [8] in the operation of heat-source equipment and minimum-outside-air intake control [8] with respect to outside-air intake volume. However, since optimal operation values can change from hour to hour, it would be desirable in terms of high-efficiency operation to have those values set in automatic control equipment at all times, but there are currently no proposals for a general-purpose method that can automatically set optimal operation values in control equipment.
There is still much room in energy-saving measures to achieve further reductions in energy consumption and CO2 emissions going forward. On the other hand, whether optimal operation measures can be achieved despite the view that they are difficult for humans to handle is an issue that should be addressed.
In response to this issue, we developed a system for automatically performing optimal operations on an hourly basis through the remote control of central monitoring equipment installed in a building. In this paper, we outline this system and report the results of installing the system in a shopping mall and performing optimal operation by hourly adjustment of outside-air intake volume.
2. System Overview
2.1. System Configuration
System configuration is shown in Figure 1. This is an onsite system installed within a building. The system connects to central monitoring equipment via a local area network (LAN) and automatically performs optimal operations of facility equipment (referred to below as “automatic energy-saving operations”) through remote control of the central monitoring equipment. Here, “central monitoring equipment” is equivalent to a building automation system (BAS) that collects and displays various types of data such as building energy data and disaster-prevention data and that starts/stops facility equipment, sets room temperature, etc. In a conventional setup, the operations manager operates BAS and puts appropriate facility equipment into operation.
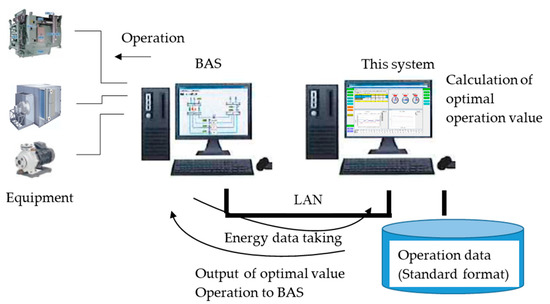
Figure 1.
System configuration.
The system first obtains energy data from BAS via LAN every hour. These energy data include energy consumption of heat source equipment, output energy, supply water temperature, and pump pressure. The system converts the units and arrangement sequences of these data into a standard format and stores the data in a database. This standard format covers various types of equipment that differ according to building scale. In this format, data storage order refers to a standard order for arranging the energy management items of facility equipment. Table 1 shows an example of the correspondence between the standard format of data items and energy management items in relation to an absorption chiller. The energy management items of an absorption chiller are the Coefficient of Performance (COP) of the heat source equipment, load ratio, supply water temperature, cooling water temperature, and air ratio. In this example, data used for evaluating each energy management item are numbered from 564 to 579.

Table 1.
Example of the standard format of data items.
This system sets 2940 items of standard data targeting various types of heat source equipment, pumps, air conditioning equipment, etc. The use of this standard format makes it possible to handle data in a general-purpose manner by storing data in a uniform format even though the units and output order of energy data may differ for each BAS specification.
Next, the system calculates optimal operation values using the energy data obtained from BAS and outputs these calculated operation values back to BAS to start/stop facility equipment, change system control settings, etc. The system connects to BAS via a remote desktop function to achieve remote control and controls BAS using robotic process automation (RPA) technology. As a result, there is no need for installing special hardware or software in BAS and there is no dependency on BAS specifications or the BAS manufacturer, which means that this system can be easily connected and installed with respect to existing BAS products.
2.2. Automatic Energy-Saving Operation Items
To investigate automatic operation items to be targeted by our system, we set up a table divided into energy use categories, energy consumption rates, and energy-saving methods for any one building (Table 2).
Table 2.
Energy use categories, energy consumption rates, and energy-saving methods for any one building.
Here, energy-saving methods were further divided into facility updating measures and optimal operation measures. The energy consumption rates given in the table are values established for office buildings in Japan [9], but they nevertheless reflect how consumption rates in the air conditioning category are high and how optimal operation measures for air conditioning are of various types. Air conditioning, in particular, can vary hourly in an unsteady manner due to outside-air temperature, room usage conditions, etc., so finding optimal values for energy-saving operations is difficult.
The proposed system can remotely operate all BAS operation functions as automatic operation items. However, considering that our main objective here is to reduce energy consumption related to air conditioning, we set the following four energy-saving automatic operation items as items to be controlled by this system: (1) optimal operation of heat source equipment, (2) setting of supply water temperature, (3) setting of outside-air intake volume for air conditioning use, and (4) adjustment of room temperature. As shown in Table 2, energy consumption rate in relation to air conditioning is also large in other countries reaching about 50% of a building’s energy consumption in the United States [1]. It was reported that energy for air conditioning purposes in the United States increased while energy for heating decreased in 2012 compared with 2003 [10]. In Spain, a survey found that energy for air conditioning made up 36% of overall building energy [11]. These figures indicate that a reduction effect through automatic energy-saving operations of air conditioning facilities is potentially large.
2.3. System Software Configuration
The software configuration of this system is shown in Figure 2. This software consists of a program for obtaining energy data from BAS and storing that data in a standard-format database, simulation tools for calculating optimal operation values, a program for comparing optimal operation values and current operation values, an automatic operation program for controlling BAS remotely based on optimal operation values, and a program for displaying operation messages.
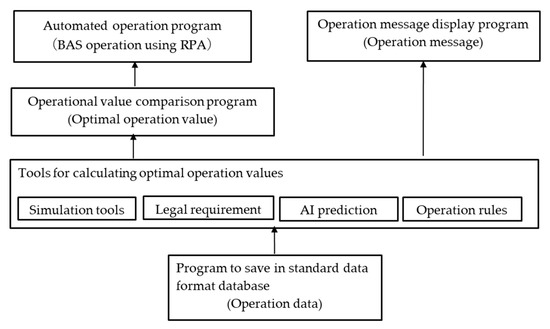
Figure 2.
Software configuration.
The system calculates optimal operation values using a variety of simulation tools taking legally required standard values into consideration. For example, a calculation method using linear programming has been proposed as a method for optimally operating heat source equipment [6,7]. In addition, the optimal supply water temperature of heat source equipment can be calculated by simulation using a heat transfer coefficient formula for the air conditioning coil [12]. The system obtains the data needed for such simulation calculations from the database. The optimal operation value for outside-air intake volume, meanwhile, is set to the legal standard for indoor CO2 concentration. In Japan, the upper legal limit for CO2 concentration is 1000 ppm. A method has also been proposed for calculating optimal operation values for room temperature [13,14] using artificial intelligence (AI).
The system now outputs the calculated optimal operation values to the program that compares them with current operation values. If the current operation values should differ from the optimal operation values, the comparison program outputs information on changing the start/stop status of the heat source equipment, the supply water temperature of heat source equipment, the start/stop status of outside-air processing units, and room temperature to the automatic operation program so that operation values become optimum.
In addition to automatic energy-saving operation through remote control of BAS, this system includes operation items for which no automatic operation is performed or for which automatic operation is not necessary. For these items, the system is equipped with a function for presenting optimal operation values and operation procedures as messages. Such messages are retrieved from a previously constructed operation-procedure rule base whenever any current operation values differ from the calculated optimal operation values.
Here, items not requiring automatic operation are those related to maintenance inspections. In the case of a cooling tower, for example, the system executes a simulation of cooling water temperature [15] based on obtained energy data, and if the current cooling water temperature is higher than the simulation value, a message will be displayed advising that the cooling tower be checked for any damage, filler gunk, cooling water clogging, etc., so that maintenance can be performed as needed.
The automatic operation program was constructed using RPA technology. RPA consists of software that identifies applications or system windows on the screen and performs operations the same as human operators. It has found use in various types of work such as accounting-related processing and registration of personnel information [16]. The use of RPA has been expanding in recent years and various types of RPA software for business processing have been put on the market [17,18].
However, while methods for controlling the operation of individual units of facility equipment in relation to energy-efficient operation have been proposed [19], there have been no reports on equipment operation by remote control of BAS or on the use of RPA in the remote operation of BAS. Consequently, given the difficulty of flexibly reflecting energy-related operations in a program when using commercial software, we developed RPA using spreadsheet software. Specifically, we developed our system using Microsoft Excel [20].
The basic functions of the developed RPA are the image detection function, keyboard operation functions (move cursor, ENTER, etc.), mouse operation functions (move mouse, click, etc.) and character/numeric input functions. The image detection function can be used to obtain information on the presence of any image or icon on the BAS screen. Additionally, if a target image is present, it can be clicked on by obtaining its position on the screen and applying keyboard operation functions, etc. This mechanism makes it possible to activate a target menu button, close a window, and input a numeric value at a target position. The method used here for detecting images is to register desired images in the system beforehand as bitmap images and perform RGB matching of registered images against images displayed on BAS. Here, “RGB matching” means judging the sameness of two images by performing a color comparison against each bit of those images. If the RGB information is judged to be the same for all bits, the RPA program concludes that a previously registered image is present. The keyboard operation functions and mouse operation functions basically employ reserved instruction words of the spreadsheet.
To execute RPA, we prepare operation scenarios on the spreadsheet in combination with the basic program and execute these scenarios in order while referring to the optimal operation values output to the spreadsheet from the comparison program. Constructing RPA on a spreadsheet in this manner simplifies the creation of scenarios that branch according to the particular operating conditions of a building and makes it easy to enter adjustment values on the spreadsheet given optimal operation values. For example, in the case of heat source equipment that cannot keep running during maintenance, a branching scenario that works around the stopping and restarting of such equipment can be created. Additionally, if a special type of room usage has been scheduled, a scenario that adjusts the calculated room temperature can be added. In this way, RPA can deal flexibly with energy operations unique to the target building.
2.4. Operation Flow
System operation flow is shown in Figure 3. The system performs a sequence of operations from obtaining energy data from BAS to controlling BAS by RPA as basic operations every hour. The time required for completing these basic operations ranges from about 21 minutes depending on the number of optimal operation items.
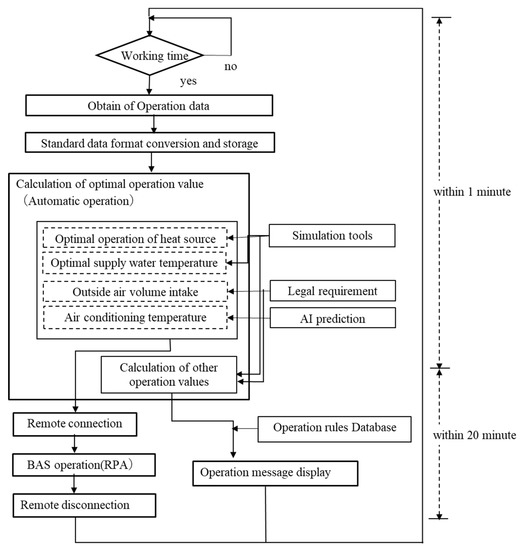
Figure 3.
Operation flow.
The energy data obtained from BAS is stored in a BAS file folder in comma-separated values (CSV) file format. This file folder is shared with the system. In the operation flow, the system obtains the energy data from that file folder by ordinary file transfer every hour on the hour. The system then converts the energy data obtained in this way into a standard format and stores the converted data in a database. After this, the system calculates optimal operation values based on simulation calculations and legal standards. Next, the system outputs the optimal operation values to the automatic operation program, performs a remote connection with BAS, starts up RPA, and performs remote operation of BAS with respect to the four energy-saving automatic operation items described above. Here, remote operation is skipped for any item whose current operation value is the same as its optimal operation value. Furthermore, for an item not targeted for automatic operation but whose current operation value is not the same as its optimal operation value, the system displays the optimal operation value and the procedure for changing that item to the optimal operation value. Once the operation flow for automatically operating BAS has been completed, the system releases the remote connection with BAS and enters into a standby state until operation time in the next hour.
It must be pointed out here that the system monopolizes BAS during the remote operation period, which prevents the operations manager from using BAS at this time. However, an ordinary BAS can add on consoles, so adding BAS functions within the proposed system eliminates the need for targeting the BAS used by the operations manager.
3. Application to Shopping Mall
3.1. Equipment Targeted by Automatic Energy-Saving Operation
We installed the proposed system in a shopping mall and performed energy-saving operations through automatic operation of outside-air processing units. An energy-saving approach at a large retail shopping center as an energy-intensive building by optimal design and operation of distributed energy resources has been reported [21]. The shopping mall that we targeted for installing our system is a large commercial building with a total floor space of 80,770 m2 having more than 100 stores selling food, products, etc. It is located in a Tokyo suburb and opened for business in May 2017. This is an energy-intensive building, having energy consumption of approximately 101 TJ/year and CO2 emissions of 5000t-CO2/year. The unit energy consumption of this building is 0.0322 kl/m2 (kl signifies the crude oil equivalent value in kiloliters), which indicates a standard building when compared with the benchmark target value for shopping centers in Japan of 0.0305 kl/m2 [22].
The outside-air processing equipment targeted here for automatic energy-saving operation consists of 13 units. The cooling water and heating water for these outside-air processing units are supplied by dedicated heat source equipment. In this building, there are no concerns about the generation of pollutants, fine particles, offensive odors, etc., so outside-air intake volume can be adjusted solely on the basis of CO2 concentration.
This heat source equipment for outside-air processing consists of four units of a gas-engine heat pump chiller using city gas (GHP) and one unit of an air-cooled heat pump chiller using electricity (EHP) for a total of five units. The energy consumption of these heat source units is 8400 GJ/year(1400t-CO2/year) accounting for 8% of total building energy consumption. The month-by-month unit cost of energy differs between city gas and purchased power, so we operated the GHP units from July to October and prioritized EHP operation in the other months. Specifications of the outside-air processing units are listed in Table 3 and a system configuration diagram of the heat source system for outside-air processing is shown in Figure 4.
Table 3.
Specifications of outside-air processing units targeted for automatic energy-saving operation.
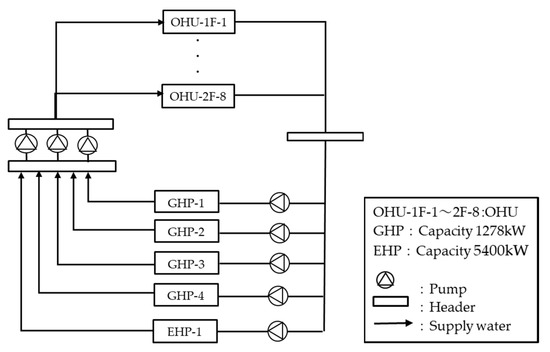
Figure 4.
Configuration of heat source system.
The system obtains energy data from BAS as well as current CO2 concentrations directly from the BAS screen (Figure 5) for comparison with legal standards. If a current value is less than the legal standard value, the corresponding outside-air processing unit is halted and the amount of outside-air intake is reduced. Conversely, if a current value exceeds the legal standard value, the corresponding outside-air processing unit is activated and outside-air is drawn into the building.
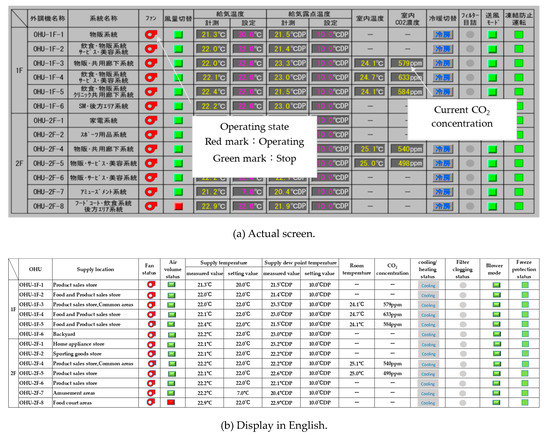
Figure 5.
BAS (Building automation System) screenshot.
Making appropriate adjustments to the intake of outside-air is an effective means of reducing the amount of energy used by air conditioning and is applied in many buildings for this reason. However, the frequency of such operations is generally no more than once or twice a year. The reason for this is that the operations manager is responsible for other types of work such as maintenance and inspection, renovating, etc., in addition to operations management, which leaves no spare time for executing energy-saving operation measures with high frequency. The proposed system, however, can perform such energy-saving operations every hour on an ongoing basis making it possible to achieve genuine reductions in energy usage.
This system adds the following three items to the automatic operation procedure as advanced operation of outside-air processing units.
- (1)
- If the outside-air dew-point temperature should exceed 20 °CDP, the outside-air processing unit for the entrance will be activated regardless of CO2 concentration to prevent condensation near the entrance.
- (2)
- If the outside-air specific enthalpy should drop below the indoor specific enthalpy during the air conditioning period, the outside-air processing units will be activated regardless of CO2 concentration to perform air conditioning using outside air.
- (3)
- If the outside-air temperature should drop to 5 °C or less, the outside-air processing unit for the entrance will be activated regardless of CO2 concentration to mitigate cold air penetration near the entrance.
Adding this special operation procedure to a building makes it possible to achieve both energy savings and indoor environmental maintenance.
3.2. Energy Reduction Evaluation
System operation began on August 20, 2018 and automatic energy-saving operations continue to this day. Table 4 and Figure 6 show the energy consumption of heat source equipment and the energy consumption of supply fans plus total energy consumption of outside-air processing for heat source equipment and supply fans combined before and after system installation (where “before” indicates the period up to February 2019). Here, energy consumption was calculated assuming caloric values of 45 MJ/m3 and 9.76 MJ/kWh for city gas and electric power, respectively. The average CO2 concentration of each outside-air processing system before system installation improved from 567 ppm to 600 ppm through automatic operation by the proposed system. This CO2 improvement of 33 ppm corresponds to a 13% reduction of outside-air intake volume (outside-air CO2 concentration: 350 ppm).
Table 4.
Energy consumption before and after system installation.
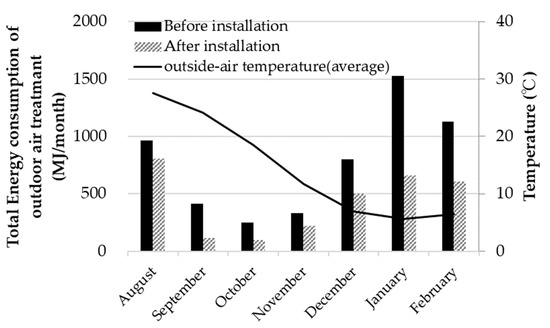
Figure 6.
Energy consumption before and after installation. Note: Outside-air temperature values are for August 2019–February 2020.
It can be seen from the total energy consumption figures in Table 4b that the amount of energy saved by installing the system came to 2403 GJ for that operation period resulting in a reduction rate of 44% with respect to the energy consumption of outside-air processing before system installation. The CO2 reduction amount was 400t-CO2 for that operation period (city gas: 0.0138 t-C/GJ; electric power: 0.489 t-C/kWh) resulting in a reduction rate of 47%.
Figure 7 shows correlation diagrams between outside-air specific enthalpy and total energy for outside-air processing as conditions for adjusting outside-air intake volume by the proposed system. Since the system halts an outside-air processing unit when CO2 concentration falls below the legal standard, operation time during the operation period was reduced (reduction rate: 53%). In addition, when many people (arround 3500 or more) were in the building and CO2 concentration was high, no difference could be observed in the energy consumption of outside-air processing before and after system installation. However, when there were few people (arround 2000 or less) in the building, the CO2 concentration dropped resulting in a reduction in energy consumption by halting the operation of outside-air processing units.
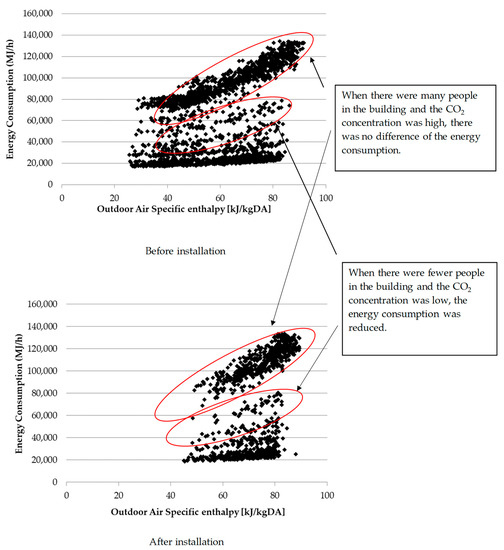
Figure 7.
Correlation diagrams between outside-air specific enthalpy and total energy for outside-air processing.
4. Conclusions
We developed a system that remotely operates BAS and automatically and continuously performs energy-saving operations. This system currently performs four automatic energy-saving operations: optimal operation of heat source equipment, setting of heat-source supply water temperature, adjustment of outside-air intake volume, and setting of room temperature. However, being that the system controls BAS using RPA, it is also capable of controlling all BAS functions.
We installed this system in a shopping mall and performed energy-saving operations by adjusting the outside-air intake volume. Although one year has yet to pass after installing this system(at the time of this writing), total energy savings for seven months of operation came to 2403 GJ resulting in an energy reduction rate of 44% for outside-air processing and a CO2 reduction rate of 47%. From these figures, we can estimate annual energy reduction to be 5000 GJ/year and annual CO2 reduction to be 1000 t-CO2/year.
The system operated stably and continuously over a period of seven months.
From here on, we plan to add automatic operation functions and assess the superiority of this system over existing control technologies by setting the following milestones.
- (1)
- Evaluate energy consumption with respect to the optimal operation of heat source equipment for outside-air processing by performing calculations using hourly simulations [6,7] of the optimal operation method of the heat-source system and by performing start/stop operation of heat source equipment from the central monitoring equipment.
- (2)
- Evaluate energy consumption with respect to heat-source supply water temperature by developing a simulator using a heat transfer coefficient formula for the air conditioning coil and by setting the heat-source supply water temperature hourly from the central monitoring equipment.
- (3)
- Evaluate energy consumption with respect to supply-fan temperature of outside-air processing units by making AI-based predictions [13,14] and setting room temperature hourly from the central monitoring equipment.
In future studies, we plan to apply optimal operation of heat source equipment for outside-air processing, setting of heat-source supply water temperature, and adjustment of supply-fan temperature of outside-air processing units as automatic energy-saving operations. In the current development, the targets of automatic energy-saving operations were air conditioning-related equipment, but energy-saving operations using various types of sensors unrelated to air conditioning have been reported [23]. Going forward, we plan to link up with such technology and expand energy-saving operations by remote control of BAS to the powering of lighting, ventilation, etc. Additionally, considering that existing BAS products are relatively easy to install, we would like to install our system in other types of energy-intensive buildings such as hotels and hospitals with the aim of contributing to a reduction in energy consumption and CO2 emissions.
Author Contributions
Methodology, formal analyses and writing, T.Y.; review and editing, H.H.; T.H. and T.M. All authors have read and agreed to the published version of the manuscript.
Funding
This work was supported by JSPS KAKENHI (Research representative: Hirofumi Hayama, Grant number: 18H0159109).
Conflicts of Interest
The authors declare no conflict of interest.
References
- Pérez-Lombard, L.; Ortiz, J.; Pout, C. A review on buildings energy consumption information. Energy Build. 2008, 40, 394–398. [Google Scholar] [CrossRef]
- General Energy Statistics. Agency for Natural Resources and Energy Home Page. Available online: https://www.enecho.meti.go.jp/statistics/total_energy/results.html#headline2 (accessed on 15 March 2020).
- Ministry of the Environment Government of Japan Home Page. Available online: http://www.env.go.jp/earth/%EF%BD%922050%20Zero%20Carbon%20Cities%20in%20JAPAN.pdf (accessed on 15 March 2020).
- The Energy Conservation Center, Japan Home Page. Available online: https://eco-hint.tokyo-cci.or.jp/practicalguide2/g2-8 (accessed on 15 March 2020).
- The Energy Conservation Center, Japan Home Page. Available online: https://www.meti.go.jp/shingikai/enecho/shoene_shinene/sho_energy/kojo_handan/pdf/2019_003_01_02.pdf (accessed on 15 March 2020).
- Cao, K.; von Krbek, K.; Wetzel, M.; Cebulla, F.; Schreck, S. Classification and Evaluation of Concepts for Improving the Performance of Applied Energy System Optimization Models. Energies 2019, 12, 4656. [Google Scholar] [CrossRef]
- Eisenhower, B.; O’Neill, Z.; Narayanan, S.; Fonoberov, V.A.; Mezic’, I. A methodology for meta-model based optimization in building energy models. Energy Build. 2012, 47, 292–301. [Google Scholar] [CrossRef]
- Automatic Control Device Catalog, Manufacturer Home Page. Available online: https://www.azbil.com/jp/product/building/system/building-automation-system/savic-net-G5/application.html (accessed on 17 April 2020).
- The Energy Conservation Center, Japan Website. Available online: https://www.eccj.or.jp/office_bldg/01.html (accessed on 15 March 2020).
- U.S. Energy Information Administration, Commercial Building Energy Consumption Survey. Available online: https://www.eia.gov/consumption/commercial (accessed on 15 March 2020).
- Rey-Hernández, J.M.; Velasco-Gómez, E.; José-Alonso, S.; Julio, F.; Tejero-González, A.; González-González, S.L.; Rey-Martínez, F.J. Monitoring Data Study of the Performance of Renewable Energy Systems in a Near Zero Energy Building in Spain: A Case Study. Energies 2018, 11, 2979. [Google Scholar] [CrossRef]
- SHASE. The Society of Heating, Air-Conditioning and Sanitary Engineers of Japan, 14th ed.; Hand Book; SHASE: Tokyo, Japan, 2010; pp. 140–142. [Google Scholar]
- Ngrambe, J.; Yun, G.Y.; Santamouris, M. The use of artificial intelligence (AI) methods in the prediction of thermal comfort in buildings: Energy implications of AI-based thermal comfort controls. Energy Build. 2020, 211. [Google Scholar] [CrossRef]
- Zamora-Martínez, F.; Romeu, P.; Botella-Rocamora, P.; Pardo, J. On-line learning of indoor temperature forecasting models towards energy efficiency. Energy Build. 2014, 83, 162–172. [Google Scholar] [CrossRef]
- Yamamoto, T.; Hayama, H.; Hayashi, T. Formulation of Coefficient of Performance Characteristics of Water-cooled Chillers and Evaluation of Composite COP for Combined Chiller. Energies 2020, 13, 1182. [Google Scholar] [CrossRef]
- Taulli, T. The Robotic Process Automation Handbook; Apress: Berkeley, CA, USA, 2020; ISBN 978-1-4842-5728-9. [Google Scholar] [CrossRef]
- Manufacturer Home Page. Available online: https://www.abbyy-flexicapture.com/rpa-ocr/?keyword=robotic%20process%20automation%20software&campaignid=333782971&adgroupid=1285329340281015&Network=o&phone=248-447-0100&msclkid=158a9f59fae41570ae2cc134771a05b1&utm_source=bing&utm_medium=cpc&utm_campaign=ABBYY%20FlexiCapture%20RPA%20Imported%20from%20GA&utm_term=robotic%20process%20automation%20software&utm_content=RPA%20OCRRPA (accessed on 15 March 2020).
- Manufacturer Home Page. Available online: https://www.airslate.com/?msclkid=a839053f41f61d4d3b1a5b52cf3db505&utm_source=bing&utm_medium=cpc&utm_campaign=main-page&utm_term=rpa%20software&utm_content=robotics%20process%20automation (accessed on 15 March 2020).
- Escrivá-Escrivá, G.; Segura-Heras, I.; lAlcázar-Ortega, M. Application of an energy management and control system to assess the potential of different control strategies in HVAC systems. Energy Build. 2010, 42, 2258–2267. [Google Scholar] [CrossRef]
- MicrosoftⓇExcelⓇ2016 MSO 32bit. Available online: https://microsoft-excel-2016.softonic.jp/ (accessed on 17 April 2020).
- Braslavsky, J.H.; Wall, J.R.; Reedman, L.J. Optimal distributed energy resources and the cost of reduced greenhouse gas emissions in a large retail shopping centre. Appl. Energy 2015, 155, 120–130. [Google Scholar] [CrossRef]
- Benchmark Indicators. Agency for Natural Resources and Energy Home Page. Available online: https://www.enecho.meti.go.jp/category/saving_and_new/saving/enterprise/overview/institution/index.html (accessed on 17 April 2020).
- Newsham, G.R.; Xue, H.; Arsenault, C.; Valdes, G.J.; Scarlett, B.E.; Kruithof, S.G.; Shen, W. Testing the accuracy of low-cost data streams for determining single-person office occupancy and their use for energy reduction of building services. Energy Build. 2017, 135, 137–147. [Google Scholar] [CrossRef]


© 2020 by the authors. Licensee MDPI, Basel, Switzerland. This article is an open access article distributed under the terms and conditions of the Creative Commons Attribution (CC BY) license (http://creativecommons.org/licenses/by/4.0/).