Abstract
Work safety can be a component of the broadly understood sustainable enterprise approach that goes beyond the idea of sustainable development. Sustainability in an unpredictable and turbulent environment has many constellations, many aspects and many fields of the enterprise’s activity and it complements the rationality of the business. The aim is to understand the sustainability of safety, because this is the term we have adopted for rationality in occupational safety management, in the context of the analysis of work accidents in the Polish steel industry, with particular emphasis on the methodology of forecast assessment in the studied area, proposed by us. The realized forecasts were used for the creation of a combined model which formed the basis for formulating conclusions from the analysis. The publication presents the modeling of the victims of work accidents in the steel sector in Poland. Based on the research of the forecasts obtained, a downward trend is recorded in the number of persons injured in accidents at work in the steel sector. In order to select the optimal model, it was proposed to set combined forecasts. In order to select the optimal model, it was proposed to set combined forecasts. The obtained values of ex-ante forecasts in the combined model also confirmed the forecasted trends determined within the adaptation models. The study is a proposal to extend the combined forecasting methods used to assess occupational safety. We consciously chose to include the methodology of combined forecasting of the number of people injured in accidents in the interpretation of sustainability, because we see the possibility of interpreting accident rates in sustainable business in the future. In the publication, we propose the framework of the sustainable safety model as an element of work safety management in an enterprise. We are trying to answer the question about the place of accident prediction in sustainable safety.
1. Introduction
The issue of ensuring the safety of workers at work is one of the key elements for the functioning of modern enterprises. Providing workers with safe working conditions positively affects their health and performance at work. The importance safety at work in the current economic reality is demonstrated by the fact that it is governed both by international (conventions of the International Labour Organization, EU directives) and national legal regulations. The legal provisions define the requirements for employers and work standards. Highly developed countries attach great importance to the issues of work safety, and building on best practices, enterprises enlarge the scope of their activities aimed at improving safety in the enterprise. These activities include, among others: ongoing control of the manufacturing process, the adaptation of machines to the physical and mental characteristics of workers [1], bonuses for workers for accident-free work, encouragement of workers to continually improve their behavior in the workplace, provision of appropriate rest and refreshment facilities for workers, use of a formula devised by Japanese companies where meetings are held to discuss issues of work safety (e.g., quality control circles—QCC) [2] enhancement of skills of workers through training [3], assessment of the effects of improvement of working conditions in terms of the relationship between working conditions and the accidents at work, or examination of the impact of workers’ attitudes and behavior in the workplace on performance and safety. As implied by one of the pillars of World Class Manufacturing (WCM), employers must endeavor to build safe conditions and minimize the accidents (direction: “zero accidents”) [4]. The development of safety at work is a multi-step process in the management of an enterprise that has strong behavioral aspects. The key success factors leading to the development of work safety are in accordance with standard: ISO 45001:2018 [5].
The study by [6] highlights the strong commitment of the management to activities aimed at the improvement of safety at work, including reduction of accidents at work. It should be noted that top management of enterprises that record a significant number of accidents at work tends to demonstrate little commitment to actions related to occupational safety. In cases where low accident rates are reported, commitment to routine activities concerning occupational safety is clearly visible. A research of the issue of accidents at work must include consideration of safety culture [7]. Other sources [8,9] point to attitudes, beliefs, perceptions, norms and values, personal responsibility, as well as the manners of action and reaction regarding the risks occurring in the workplace. Employers should build workers’ awareness of the impact of dangerous behavior on accidents at work and address modern threats. As indicated by [3], one of the basic issues to be addressed by modern enterprises is workplace stress management. Moreover, staff development and its impact on the improvement of work safety is becoming a key element in terms of human resources management [10,11]. In the context of work safety, account is also taken of the impact of other conditions and phenomena, as well as relationships between people defined as the “climate” of safe work [12,13,14,15,16,17].
The definition of the accident differs across the countries. The occurring discrepancies relate to the damage, injury and loss. The arising discrepancies essentially come down to three variants in which: the accident is identified with the injury, the accident is the injury alongside its preceding situation, and finally, the injury is one of the possible consequences of the accident [18,19]. The concept of accident is specified in Polish law in the Act of 2002 [20] pursuant to which, an occupational accident shall mean a sudden externally caused event related to the performed work resulting in injury or death of a worker.
The current economy is sustainable, although with different levels of advancement of solutions implemented within the framework of the idea of sustainable development. Sustainable development is most often identified with the policy of states for environmental protection. Interpretation, the sustainability has been expanded to include ever wider areas of activity of governments, enterprises, organizations etc. in pursuit of social, economic and environmental balance in the world [21]. The integrated social, economic and environmental activity of many entities has gained a new face. New arrangements, relationships and ties between various stakeholder groups are emerging in building sustainability at the level of entire economies, regions and companies. The pillars of sustainable development: the social aspect, the economic aspect, the ecological aspect from the global policy level are transferred to the pillars of an sustainable energy. The ways (paths) of transferring the assumptions of sustainability to the level of the enterprise are different and concern building various aspects of sustainability, through sustainable innovation [22,23], sustainable energy [24], sustainable consumption [25] with sustainable marketing [26] etc. Sustainability in manufacturing is a requirement as it has become apparent that production, solely focused on profits, leads to e.g., unequal distribution of resources, intensive use of resources and overexploitation of the them. Sustainability (or rather, companies striving for sustainability) can be confirmed in many areas, processes, trends, etc. [27,28]. One of the areas is sustainable safety, which aims at accident-free production through the integration of financial, material and human capital. The concept of sustainable safety (very generally speaking) is made up of the assumptions of sustainable development, with particular emphasis on building safe working conditions and work safety management (or rather, a work safety management system operating at the enterprise level). Increasing the quality of working conditions through the integration of financial, physical and human capital is the main goal of the generally understood sustainability security. The implemented sustainability policy in the enterprise must be flexible (“sustainability of tomorrow”), i.e., adapted to the constantly changing conditions of the enterprise’s operation [29,30,31]. The concept of the enterprise of the future requires the implementation of proactive, preventive measures in the area of the company’s efforts to ensure employee safety and environmental safety. Assuming flexibility in sustainability, one should consider the significance of predictions at the level of managing a specific area, process in the enterprise.
2. Literature Review
This part of paper was made on the basis of available bibliometric databases. The basic scope of the literature review concerned the issues of occupational safety and accident in industry in connection with the concept of sustainability. Searching databases for the availability of publications on accident analysis in industry or industry sectors using quantitative (econometric) methods was of particular importance. Such databases we use in the analysis: Web of Science, Scopus, Google Scholar, Research gate. This process of literature review was realized according to the steps were presented in Figure 1.
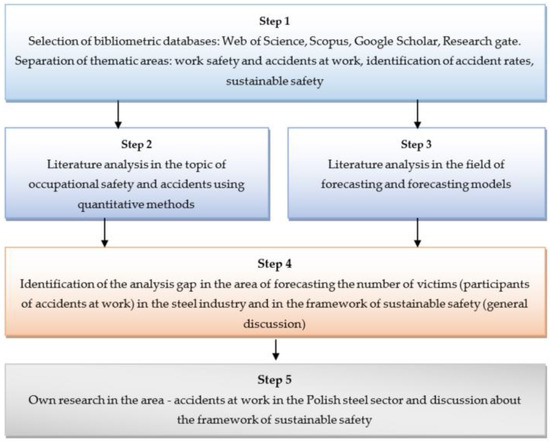
Figure 1.
From literature retrieval process (own study).
The issue of work safety is the subject of numerous studies employing quantitative analyses based on historical data and methods of forecasting changes in the studied phenomena. The accident rate is an area of interest of many authors worldwide. Their studies explore the accident rate in various countries and sectors of the economy, presenting the issue of accident rates and determining the accident rates which allow for the comparison of accident rates between countries, industries and enterprises (most frequently within a given capital group). The literature review showed that [32] presented the issue of accident rate in sectors with a high frequency of accidents. The analysis concentrated on Turkey and mainly involved fatal accidents in the following sectors: mining, metal, and construction. The analysis was conducted using accident indicators, as was the case with the analysis performed by [33], which focused on industry in Poland. The author presented accident indicators for accidents related to the usage of machines [33]. In contrast [34], applied designated indicators to the analysis of accidents in the steel sector in Poland, with particular emphasis on the biggest capital group comprising the largest steelworks with a production capacity of 70% of the total market potential in the country. Other authors employed statistical methods for the accident rate analysis, e.g., Chi-Square test, frequency analysis, etc. [35]. Mention must also be made of [36] who set out a methodology for the analysis and evaluation of the number of accidents at work in Poland in the construction industry. An important element of the analysis lies also in the study of the causes of accidents in the following system: technical causes, organizational causes, personal causes [37,38] and determination of the consequences of accidents using the basic indicators [33]. In addition to building predictive models, single analysis tools are also used in the accident analysis in the steel industry, e.g., the Pareto-Lorenz chart [39]. Exploratory analysis in the area of safety behavior was carried out by Cooper and Phillips [40]. Further, the network analysis was used for the study of safety management systems [30]. In contrast, econometric models are used to establish the relationship between the categories of selected variables as dependent and independent in the models. The literature review showed that several segments (areas) of research are explored within the context of work safety. While conducting a literature review [40,41,42,43,44,45,46,47,48,49,50,51,52] regarding Safety Predictive Models, compiled 11 relationships under investigation: accident rates and safety management strategies, ‘percent safe’ behavior and safety climate, severity of accidents and perceived safety climate, demands on the job market, decision latitudes, and coworker support for coworker, safety risk and training, supervision, and preplanning, safety behavior and safety training, safety climate and personal characteristics, safety risk and construction trades, lost workdays and safety climate, safety risk and formwork activities, safety risk and loss-of-control events, safety risk profiles and highway reconstruction. Safety climate was also an area of prediction of results related to, among others, accidents at work, occupational injuries and behavior in the field of safety investigated by Ghahramani [53]. The set of tools applied to forecasting safety in industry was also subjected to analysis in terms of their usefulness for risk assessment. This research area was explored by Lee and Halpin [46]. Overall, it must be stated that there is no single method of analysis that is optimal for every prognostic situation in the research on occupational accidents. Selected econometric methods can be used in various areas of analysis [53]. Prognostic assessments are used in addition to retrospective analyses. Prognostic models can surely be used for constructing forecasts, but more importantly, they enable a statistical analysis of accidents both in the past (ex post forecasts) and in the future (ex ante forecasts). Advanced econometric (multi-parameter) models make it possible to evaluate the impact of individual factors on the accident rate (e.g., impact of technical, organizational and human factors on accidents), as well as to assess the relationship between the studied variables in prognostic models in future. Table 1 contains a summary of the literature review prepared by the authors.

Table 1.
A collective summary of research in the field of occupational safety presented in the literature (own study).
Literature analysis carried out in the subject of occupational safety and accidents in the enterprise as well as forecasting and the possibility of using prognostic models for occupational safety analyzes has led the authors to develop their own methodology for forecasting the number of participants in accidents in the steel sector using the forecasting models used, but the result is a combined forecast. The application of the combined forecasting methodology for the steel industry in Poland presented in this study supplemented the research gap which is the possibility of using adaptive models to forecast the number of participants in accidents at work.
3. Materials and Methods
3.1. Research Subject Matter—Characteristics of the Steel Sector and Accident Rate in Poland
Metallurgical enterprises (steelworks) are in a group of enterprises with an increased risk of accidents. Steel production is carried out in particularly dangerous conditions. Factors that increase the risk include: high temperature (high-temperature process) [54], noise, vibrations generated by industrial machinery and equipment [55], dust and gases [56], as well as fumes and vapors, gas installations and equipment, size of the processed materials, surfaces on which workers may fall (platforms, steps, bridges), working machines and equipment (blast furnace, converters or electric arc furnaces, vats, ingot molds, tapping spouts, rolling mills, drawing machines, etc.), moving semi-finished products (wagons for transporting liquid metal and slag), moving parts of technical equipment (cranes, tipplers, sinter belts) [57].
The steel industry in Poland has over the years been one the sectors with a high accident rate. Accident statistics from before the economic transformation in Poland in 1989 were not generally available. In the 1990s, the number of accidents in the steel industry was high, but it followed a downward trend due to a radical reduction in employment in the sector. Steelworks in Poland employed 147,000 workers in 1990 and that number dropped to a mere 39,000 workers ten years later and to 25,000 workers twenty years later [58]. The restructuring process of the steel industry in Poland included the liquidation of unprofitable steelworks, spin-off of activities not directly related to steel production and products (e.g., repair services, supply of raw materials, transport, distribution of products), and privatization of state-owned enterprises (the largest steelworks in Poland were purchased by foreign investors) [59], while newly established enterprises saw an improvement of working conditions and development of safety in management system. Steelworks obtained the first safety system certificates: PN-N 18001:2004 [60] standard in the first years of this century (in Poland, the first edition of the standard appeared in 1999, and in 2004 an amendment was issued by the Polish Committee for Standardization). The nearest equivalent to the Polish standard was BS OHSAS 18001 [61], to be obtained after the ISO 9001 [62] quality management system certification, which Polish steelworks achieved as early as the 1990s, and the ISO 14001 [63] environmental management system certification, which the first Polish steelworks achieved in the late 1990s [64]. On the whole, both the legal regulations [65] and additional activities within the framework of building a work safety management system improved working conditions and contributed to a decline in accidents at work.
The empirical data released by Statistics Poland indicate that the number of people injured in accidents at work is liable to fluctuate and follows a decreasing trend (Figure 2). The largest number of persons injured in accidents in the steel market in Poland was recorded in 2011 (1127 workers), whereas the smallest number of injured workers (876) was reported in 2016. In the years 2009–2011, the steel industry recorded over 1000 victims of accidents in total.
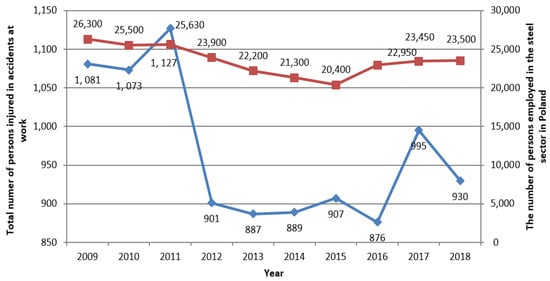
Figure 2.
Persons injured and employed in the steel industry in Poland in 2009–2018 [66,67].
The analysis of the number of workers shows that the largest number of persons employed in the steel industry (workforce of 26,300) was recorded in 2009 (Figure 2). Since 2012, a distinctive decrease in the workforce may be observed (fall by 6.7% as compared to 2011), which is reflected in a corresponding decline in the number of persons injured in accidents by 20%. Since 2012, there has been a decline in the workforce numbers and a drop in the number of workers involved in accidents at work. An exception to the above relationship (the impact of the decrease in the number of workers on a decrease in accident participants/victims) was in 2015 when the observed downward trend in the number of persons in the steel enterprises in Polish market was not reflected in a corresponding fall in the number of accident participants. The year 2015 saw an increase in the number of accident participants (victims) to 907 people. This may be due to the favorable situation in the steel market, as 9,198,000 tonnes of crude steel were produced that year, i.e., 658,000 tonnes more than in the previous year (2018)—Table 2. Since 2015, an increase in the workforce numbers may be observed. In 2015, the steel industry in Poland employed 20,400 persons and that number grew to 22,950 workers in 2016. Changes in the employment structure from 2015 were reflected in a drop in the number of accident participants in 2016 (876 were reported). Within in the analyzed years 2016–2018, an increase in the number of workers injured in occupational accidents was recorded in comparison to the years 2012–2016, with an increase observed in the workforce numbers in the steel industry.
Table 2.
Key information about Polish steel production (own study based on [66,67]).
3.2. Research Methodology
Own research are realized by using forecast. Based on the empirical data contained in Table 2 regarding the total number of persons injured in accidents at work in total in the steel industry in Poland, in the period from 2009 to 2018 forecasts were determined using the following models [68,69,70,71,72,73]:
- −
- the naive model in an additive approach;
- −
- the simple moving average model;
- −
- Holt’s square model;
- −
- Holt’s model for a smoothed trend in an additive formula;
- −
- Holt’s model for the smoothed trend of the multiplicative formula;
- −
- Brown’s double exponential smoothing model;
- −
- Winters’ model with additive trend and additive seasonality;
- −
- Winters’ model with a multiplicative trend and additive seasonality;
- −
- Winters’ model with the multiplicative trend and multiplicative seasonality.
The accuracy of quantitative forecasts is primarily determined by ex post error measures. Combination forecasting method consists of a variety of forecasting methods in order to receive a better range of projected value range [74]. A shift from single forecasts to combined forecasts in the area of safety in the steel industry increases the reliability of the presented results in comparison to analyses of selected, single, exemplary forecasts. The implementation of the algorithms, the presented models and related calculations was carried out in an Excel spreadsheet using built-in functions, data analysis tools and the Solver optimization tool.
The used methodology of own research was divided into three key stages (Figure 3).
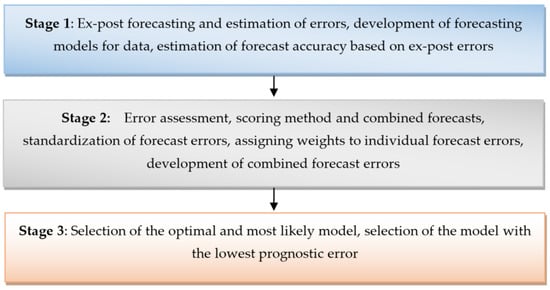
Figure 3.
Methodology of own research (own elaboration).
The following ex-post forecast errors (Table 3) were determined to estimate the level of forecast admissibility [68,69,70,71,72,73,74,75,76,77,78,79]. The designated forecast errors were also assessed in terms of their admissibility. The following assumptions were made as a condition for the admissibility of forecasts for error [70,71]:
Table 3.
Ex post forecast errors and mathematical dependence [68,69,70,71,72,73,75,76,77,78,79].
- −
- <3%—very good;
- −
- 3% and 5%—good;
- −
- 5% and 10%—permissible;
- −
- >10%—impermissible.
- −
- For the coefficient of residual variation Ve conventional ranges were adopted [71,80]:
- −
- <25%—little volatility;
- −
- (25%; 45%)—average volatility;
- −
- (45%; 100%)—strong volatility;
- −
- >100%—very strong volatility.
If Ve is less than 20% then the model is considered good. In the case of the Rot Mean Square error [81] the forecasts are considered satisfactory when the Rot Mean Square error (RMSE) ≤ Se − Se is the standard deviation of the model residuals and is determined on the basis of the dependence (1):
where:
—forecasts value;
—empirical data;
n—sample size.
In the case of adjusted ex post average relative error Θ, projections considered acceptable when the error values fall within the range [0% to 200%] [69]. On the other hand, for MAE it is assumed that it concerns small (rare) errors, unlike the RMSE—it is assigned a great importance to large errors in forecasts If mean absolute error and Rot Mean Square error are used together to diagnose error variability in a prediction set (as in this analysis), the Rot Mean Square error is assumed to always be greater than or equal to mean absolute error; the greater the difference between them, the greater the variance of individual errors in the sample. If Rot Mean Square error = mean absolute error, all errors are of the same magnitude. Both the mean absolute error and Rot Mean Square error can range from 0 to ∞. They are negatively-oriented scores, i.e., lower values are better. The significance of the RMSE error in the assessment of forecasts is greater than that of the MAE (due to the assessment of the assessed errors: large in the RMSE, small in the MAE. For all analyzed errors, the authors of this publication apply the minimization principle, i.e., they analyze the accuracy of forecasts for the time series by selecting those forecasts that have the smallest ex post errors.
4. Results
4.1. Forecasts and Error Values of Ex Post Forecasts
The applied prognostic models presented in Section 3.2. allowed for the forecasting of the number of people injured in accidents at work (Table 4) and the determined basic characteristics of descriptive statistics are market with colors (line 12a–15):
Table 4.
Obtained forecasts for analyzed Polish steel sector (own elaboration).
- for 2019 using the naive method (point forecast) and a simple moving average;
- for 2019–2022 the following forecasting models were used: Holt’s, Winters’ and Brown’s (the double exponential smoothing model).
For the designated forecasts for 2019–2022, their trend was presented (Figure 4). Based on the analysis of forecast trends, it can be predicted that in 2020 there will be a decrease in the number of person injured in accidents at work in steel industry in Poland (the downward trends for this year were obtained for forecasts determined using the following models: M3, M4, M6, M7, M8, M9, M10, M11). In 2021, compared to 2020, an increase in the number of people injured in accidents at work in the analyzed sector can be expected. A slight decrease in the number of person injured in accidents during steel production in Poland can be expected in 2022.
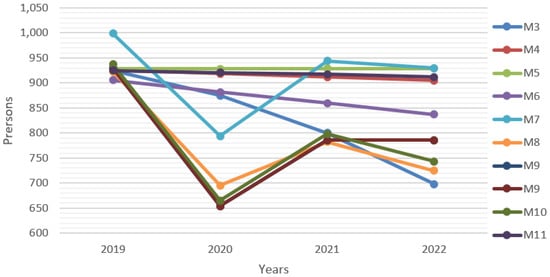
Figure 4.
Forecasts of the number of victims of accidents at work in the steel industry in Poland in 2019–2022 for M3–M11 forecasting model.
Forecast errors for the year 2019 were established for the determined forecasts using prognostic models M1–M11. The compiled error values were subjected to analysis focusing on their qualitative assessment. On the basis of the assumptions listed in Section 3.2, an assessment of forecasts was made, i.e., their acceptability (plus “+”) or non-acceptability (minus “−“). In determining the acceptability, the ranges recognized as acceptable for individual errors were applied, in compliance with the assumptions discussed in Section 3.2.
The conducted analysis (Table 5) allowed the conclusion that unacceptable values of ex post forecast errors are recorded only for the mean relative error of expired forecasts. These values were recorded for two developed models, i.e., Winters model with an additive trend and multiplicative seasonality, and Winters model with an additive trend and additive seasonality. The error values were ψ = 11.6% and ψ = 12.9% respectively, allowing for the classification of the forecasts under the assumptions set out in Section 3.2 as unacceptable. The analysis of the remaining forecast errors led to the conclusion that they are acceptable, therefore the developed models were subjected to further analysis. The developed models for which the value of one of the errors exceeded 10% were not rejected in the research process, as the values of the remaining errors allowed for the classification of the forecasts as acceptable. However, they were given special attention during the process of assigning ranks.
Table 5.
Estimated values of errors in ex post forecasts for realized analysis (own study) (plus—the forecast is considered acceptable; minus—the forecast was found unacceptable).
The determined values of ex post forecast errors and the coefficient of residual variation were standardized, which allowed to determine by how much ex post forecast errors differ from the result of the average ex post forecast error for individual models. The use of standardization allowed for the transformation of forecast errors into statistically comparable measures. The standardization of errors also allowed for the determination of outliers—in line with the principle of minimizing errors in ex post forecasts. The obtained results are summarized in Table 6. The smallest errors for individual models are marked in color (Table 6).
where:
Table 6.
Standardization of ex post forecast errors for the number of participants in accidents in the steel sector in Poland (own study).
S—standardization;
x—non-standardized variable;
μ—average;
σ—standard deviation.
Forecasting models with the smallest errors were selected based on the value of ex-post forecast errors after standardization. In the case of errors in ex-post forecasts: ψ, RMSE, Θ, Ve the lowest values of these errors for forecasts with a trend were obtained by the Winters model with a multiplicative trend and multiplicative seasonality (M7) (Figure 5). Using the rank system (from 1 to 3)—the Holt’s models are also useful for forecasting the number of participants of work accidents in the steel sector in Poland: with the effect of extinguishing the trend in the multiplicative formula (M6) and with the multiplicative trend (M4) (Figure 5). When selecting these models for further analysis, the number of indications (ranks) for the first three places in the group of 11 analyzed models was taken into account, therefore the models: M1, M2 and M3, were not included in the further analysis.
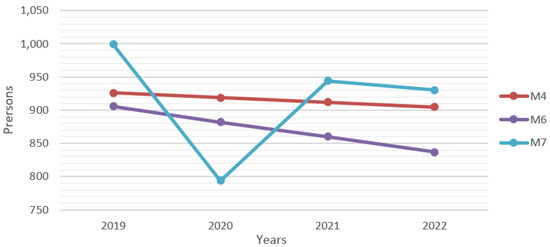
Figure 5.
Accident at work forecasts for M4, M6 and M7 models.
Based on the obtained forecasts, the following conclusions were drawn:
- −
- all models used to forecast the number of people injured in accidents in total in the steel sector in Poland in 2019–2022 are models with a multiplicative trend;
- −
- in the case of M7, seasonal fluctuations were taken into account, hence the course of this trend (blue in Figure 5) differs from the trends of the forecasts of models 4 and 6; If only the M4 and M6 models were to be discarded and only the M4 and M6 models were analyzed, the trend of forecasting the number of people injured in accidents at work in the steel sector in Poland in 2019–2022 is decreasing, which is important information in the field of occupational health and safety issues.
4.2. Combined Forecasting Models Based on the Evaluation of Ex Post Forecast Errors
Combined forecasts were established on the basis of the assessment of the designated errors of ex-post forecasts after their standardization. Weights were used to evaluate the six analyzed errors: ψ, RMSE, Θ, Ve, MAE. Many combinations of weights assigned to individual errors in ex post forecasts were tested. As a result, two variants of the assessment were adopted (Table 7). The assessment of the models was made on the basis of the mathematical relationship (3), which is defined as the product of the error after standardization and the weight value , adjusted individually to each of the estimated errors:
where:
Table 7.
Error assessment values with weights included—Option 1 and Option 2.
Eiwi—weight of errors in ex-post forecasts;
Ei—ex-post forecast error after standardization—i = 1, …, 5;
—forecast error weight—i = 1,2…,5 (number of analyzed errors), where Σ.
The values of weights were selected on the basis of the importance of particular errors in ex post forecasts for determining the reliability of forecasts. In carrying out the literature review, it was found that:
- −
- the error fulfilling both the symmetry and standardization condition is the adjusted average relative error of ex post forecasts Θ, for this error the highest weights were established: w3 = 0.35 (option 2—W2) and w3 = 0.30 (option 1—W1);
- −
- the error meeting only the symmetry condition is the average relative error of expired forecast Ψ with are assigned weights: W1: w1 = 0.25; W2: w1 = 0.30. This error is most often determined in forecasting the studied phenomena [52,53];
- −
- the Ve index is also often used in the assessment of prognostic models and is easily determined, it has the following weights: W1: w4 = 0.15; W2: w4 = 0.2.
- −
- the error satisfying the symmetry condition is the RMSE error. This error also indicates the occurrence of large errors in forecasting models, which are particularly undesirable in the built model. Compared to the significance of the error of expired forecasts, the MAE is more important (MAE indicates the occurrence of rare errors). Therefore, higher weights were assigned to RMSE than to MAE:
- −
- for RMSE: W1: w2 = 0.2; W2: w2 = 0.1;
- −
- for MAE: W1: w2 = 0.1; W2: w2 = 0.05.
- −
- Then, for each developed model, taking into account weights, the total error value was determined. The choice of the forecasting model was determined by the lowest value of the sum of ex post forecast errors for the developed forecasting models. For the developed models, the determined values of the error assessment with the weights included are summarized in Table 7.
The forecasts with the smallest errors were selected based on the analysis of the error value assessment for individual models (Table 7), calculated as the sum of the error product (after standardization) and the weight value. The lowest value of the ex post forecast error assessment was obtained for the Winters (M7)—a model with a multiplicative trend and multiplicative seasonality for both variants: W1 and W2. Also useful for further analysis is the Holt’s model (M6): A model with the effect of extinguishing the trend in a multiplicative formula. M1 models were used for the point forecast—the forecast was determined using the naive method. The forecast of the number of workers injured in accidents in the steel industry in Poland in 2019 (using this method) is 930 persons. The results of the selected models (M6 and M7) are shown in Figure 6.
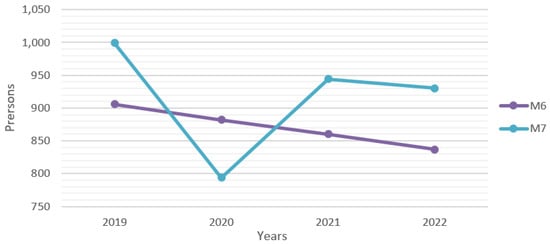
Figure 6.
Models useful for combined forecasts (own elaboration).
On the basis of the conducted research, forecasts were determined. Evaluating errors of the obtained forecasts after their standardization with the use of weights was carried out. Models for combined forecasts were also selected, which will be subject to further expert assessment (qualitative assessment). Based on the analyzes, it was established that:
- −
- useful models for determining the forecasts of victims in the steel sector in Poland based on empirical data for 2009–2018 were: the Winters’ model with a multiplicative trend and multiplicative seasonality and the Holt’s model with the effect of extinguishing the trend in a multiplicative formula;
- −
- using the M6 model, a trend with forecasts was obtained, a decrease by 69 people in 2022 compared to the forecasts in 2019;
- −
- using the Winters’ model (M7), which is a trend with seasonal fluctuations, the forecast number of victims decreased also by 69 persons compared to the forecast in 2019;
- −
- according to the Winters’ model (M7), a significant decrease in the number of people injured in accidents in the analyzed sector can be expected in 2020, a decrease compared to the forecast in 2019 by 205 persons, but with an upward trend in the following years (2021–2022).
5. Discussion
The realized analysis carried out belongs to the area of safety management in a sustainable enterprise. In security management, there are two types of management: reactive and proactive. Prediction is connected with proactive management. A sustainable business must survive various circumstances in a dynamic environment. Business processes must be flexible and based on the principles of balance in the impact of business in three areas: economy, society and ecology. Prediction with proactive type of management in safety is better than reactive (post-accident) activities. Each sustainable enterprise requires constant access to information and forward-thinking. “Entering the future” is a feature of a sustainable economy [82]. It is assumed that companies create the future [83], and if so, they must use tools to predict the future. Sustainability is based on the principles of a holistic, constantly evolving view of reality [84], also in the area of sustainability. Sustainability is based on the principles of a holistic, constantly evolving view of reality [84], also in the area of sustainability.
The analyzed area of research—safety at work—is an element of the company’s sustainability model. Accidents at work disrupt this sustainability. Therefore, their causes should be detected and different types of risk levels should be established in managing safety in an enterprise [85]. Sustainable safety at the enterprise level is a concept based on sustainable development and occupational safety management. The framework for work safety in the enterprise is created by the sustainable development strategy. Its implementation is based on the principles of integrated social, economic and environmental efficiency. Within this framework—the sustainable development strategy at the enterprise level, there is an occupational safety management system, which is the basic pillar of building sustainable safety at the operational level of the enterprise, along with management tools. At the enterprise level, sustainable safety takes into account the well-being of employees, work safety, favorable working conditions, as well as institutional solutions and legal conditions in the area of health and life protection of employees. Data on safety at work, health and life protection of employees are analyzed and reported within the area of social sustainability. In analyzing and reporting data on occupational safety, more and more often attention is paid to thinking “one step” ahead of an accident at work. Sustainable safety at the enterprise level is supported by the policies implemented at the local economy, national economy and global level. In sustainable safety, the protection of the health and life of employees (people) translates into society through social effects. In turn, the resources used in the company (e.g., replacing black energy with green energy) and the method of their processing (eco-technology), up to the produced good and product life cycle, have an impact on the natural environment. The scope of activities included in the concept of sustainable security at the enterprise level is constantly being expanded. This concept begins with the occupational safety policy, through the improvement of the occupational safety management system and also includes: revision and tightening of controls aimed at improving work safety, building employees’ awareness of the importance of legal provisions and safe work rules, investments and purchases improving working conditions, modern IT systems supporting occupational safety management and its reporting, employee training programs (mandatory and additional training in the area of occupational safety), introducing new requirements for suppliers of raw materials/materials in the field of security of supply, assistance in providing health care for employees, helping employees with building balance between work and life (including education and health care for non-employees); adopting international rules for building occupational safety, cooperating to improve safety in the entire supply chain, etc. In conclusion, Figure 7 presents the framework of the sustainable safety model at the enterprise level with reference to the environment, and Figure 8 details the safety level, indicating the place of accident analysis and the link with the concept of sustainable safety at energy.
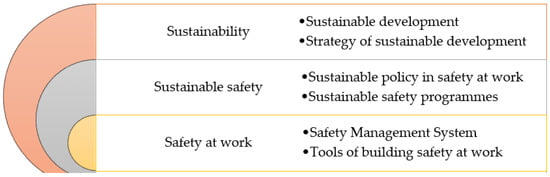
Figure 7.
General levels of framework for sustainable safety in an enterprise.
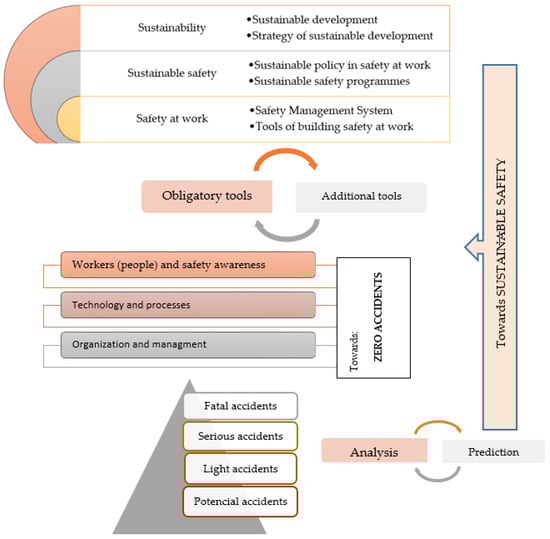
Figure 8.
Place of work accidents analysis in sustainable safety in an enterprise.
The future of sustainable development and sustainable safety is connected with technology 4.0. According to the Boston Consulting Group’s 2015 report on Industry 4.0, there are specifically nine technological advances, which have created the new industry: learning machines and robots, simulation, cloud computing, integration in Cyber Physical System (CPS), the Internet of Things, cybersecurity, additive manufacturing, augmented reality, big data and analytics [86]. With the increased capabilities of collecting vast amounts of data and even more than that—analyzing it in faster and smarter ways, big data and analytics pave the way for higher and higher safety at work. Both historical data and real-time physical data (accident data and working conditions) well as predictions provide information for proactive management [87].
Now, real-time physical data from machines is used in factories like vibrations, noise levels and pressure with historical data about accident at work like number of accidents, type of accidents, accident indicators, number of persons injured in accidents, causes of accidents, etc. can increase the decision-making area in enterprises. Moreover, the all archives based on data from particular enterprises belong the same branches in industry can be used to build safety model, that is typical for the branch. In new reality, the exchange of information is becoming easier, with companies exchanging data and making it available under social responsibility (SR). In Industry 4.0, new solutions like the computer cloud increase the chances of enterprises in building security models. The cloud technologies, lower costs and provide wider accessibility, while making many processes, related to improving capacity, easier, faster, and significantly more effective [88]. In that way, smart technologies create staggering opportunities for the effective and efficient achievement of the sustainable development. One aspect of performance is the decrease in accidents. The fewer accidents, the fewer interruptions in production continuity. And although more robots may work in Industry 4.0, the role of human beings is significant here [89,90,91]. Not to be missed is also the role of predictive data about work accident in enterprise management. Based on the predictive analyses, managers can improve safety in factories. Technology machine learning (AI) with tracking of employee movements and their physical and mental characteristics creates new conditions for improving safety in factories.
The use of intelligent production systems is also becoming an important element. Intelligent Manufacturing System (HCPS) is made up of people, cyber systems, and physical systems. Intelligent manufacturing is constantly evolving with the development and integration of production and information technology [92]. Technological advances ensured the wider use of cyber-physical systems in production, but also contributed to the strengthening of Industry 4.0. As a result, operators are becoming part of intelligent production systems [93,94].
6. Conclusions
The organization of safe work is one of the key elements of the functioning of industrial enterprises in the metallurgical industry. The implemented preventive solutions contribute to the improvement of safety, which is indicated by the results of the research conducted in this study. The authors proposed the possibility of using forecasting methods to assess the trend of changes in the number of recorded accident events, which may be important information for management personnel, but also for OHS service employees.
The performed analysis may be useful for enterprises of the analyzed sector to plan activities for the improvement of safety in the work environment. The performed analysis can also be used for benchmarking work safety at the level of enterprises and sectors. On the other hand, the methodology presented and used in the work is a significant contribution to research on the forecasting of accidents in the work environment. The authors presented the possibility of using them in the forecasting process. The results of the conducted research allowed for the selection of the most probable model. The choice of the most probable model was possible thanks to the development of a combined model, which was a combination of quantitative and qualitative methods for predicting the number of victims.
Author Contributions
The main activities of the team of authors can be described as follows: Conceptualization, T.M. and B.G. (B.G.—framework of safety sustainable); methodology, T.M. and B.G. (B.G.—wages assumption of obtained forecasts for analysis of combined forecasts); software, T.M. and B.G.; validation, T.M. and B.G.; formal analysis, T.M. and B.G.; investigation, B.G. and B.G.; resources, B.G. and T.M.; data curation, T.M. and B.G.; writing—original draft preparation, T.M. and B.G.; writing—review and editing, B.G. and T.M.; visualization, B.G. and T.M.; supervision, B.G. and T.M.; funding acquisition, T.M. B.G (Silesian University of Technology). All authors have read and agreed to the published version of the manuscript.
Funding
This research received no external funding.
Acknowledgments
BK_11/990/BK_20/0074.
Conflicts of Interest
The authors declare no conflict of interest.
References
- Standard PN-EN ISO 12100:2012. In Safety of Machinery—General Principles for Design—Risk Assessment and Risk Reduction; ISO: Geneva, Switzerland, 2012.
- Chiarini, A. Japanese total quality control, TQM, Deming’s system of profound knowledge, BPR, Lean and Six Sigma: Comparison and discussion. Int. J. Lean Six Sigma 2011, 2, 332–355. [Google Scholar] [CrossRef]
- Armstrong, M. A Handbook of Human Resource Management Practice; Kogan Page: London, UK, 2006. [Google Scholar]
- Hendry, L. Applying world class manufacturing to make-to-order companies: Problems and solution. Int. J. Oper. Prod. Manag. 1998, 18, 1086–1100. [Google Scholar] [CrossRef]
- Standard PN-ISO 45001:2018. In Occupational Health and Safety Management Systems—Requirements with Guidance for Use; ISO: Geneva, Switzerland, 2018.
- Zohar, D. Safety climate in industrial organizations: Theoretical and applied implications. J. Appl. Psychol. 1980, 65, 96–102. [Google Scholar] [CrossRef] [PubMed]
- Cooper, M.D.; Phillips, R.A. Validation of safety climate measure. Ann. Occup. Psychol. Conf. Br. Psychol. Soc. 1994, 3, 3–5. [Google Scholar]
- Hale, A.R.; Hovden, J. Management and culture: The third age of safety. A review of approaches to organizational aspects of safety, health and environment. In Occupational Injury: Risk, Prevention and Investigation; Feyer, A.M., Williamson, A., Eds.; Taylor and Francis Publisher: London, UK, 1998. [Google Scholar]
- Glendon, A.I.; Stanton, N.A. Perspectives on safety culture. Saf. Sci. 2000, 34, 193–214. [Google Scholar] [CrossRef]
- Gembalska-Kwiecień, A. Proper organization of the work environment as one of the elements to improve work safety. Sci. Pap. Sil. Univ. Technol. Organ. Manag. Ser. 2015, 77, 75–84. [Google Scholar]
- Gwiazdowski, A.; Sibiński, J. Kształtowanie Zachowań Pracowników w Dziedzinie Bezpieczeństwa i Higieny Pracy; Instytut Medycyny Pracy im Prof. J. Nofera: Łódź, Poland, 1999. [Google Scholar]
- Badura, A. Self-efficacy: Toward a unifying theory of behavioral change. Psychol. Rev. 1977, 84, 191–215. [Google Scholar] [CrossRef]
- Geller, E.S. Behavior-based safety in industry. Realizing the large-scale potential of psychology to promote human welfare. Appl. Prev. Psychol. 2001, 10, 87–105. [Google Scholar]
- Coyle, I.R.; Sleeman, S.D.; Adams, N. Safety climate. J. Saf. Res. 1995, 26, 247–254. [Google Scholar] [CrossRef]
- Nowacki, K. The impact of implemented management systems on the safety culture of work in production. Multidiscip. Asp. Prod. Eng. 2019, 2, 243–252. [Google Scholar] [CrossRef][Green Version]
- Cox, S.; Cheyne, A.J.T. Assessing safety culture in offshore environments. Saf. Sci. 2000, 34, 111–129. [Google Scholar] [CrossRef]
- Nielsen, K.J. Improving safety culture through the health and safety organization: A case study. J. Saf. Res. 2017, 48, 7–17. [Google Scholar] [CrossRef] [PubMed]
- Małysa, T.; Nowacki, K.; Lis, T. The correlation between structure of employment and accident at work in metallurgical enterprises. 26th International Conference on Metallurgy and Materials. Metal 2017, 2017, 2244–2249. [Google Scholar]
- Szlązak, J.; Szlązak, N. Occupational Health and Safety; AGH Publisher: Cracow, Poland, 2012. [Google Scholar]
- Act of 30 October 2002 on Social Insurance in Respect of Accidents at Work and Occupational Diseases; ILO: Geneva, Switzerland, 2002.
- Robert, K.W.; Parris, T.M.; Leiserwitz, A.A. What is sustainable development? Goals, Indicator, Values and Practice. Environ. Sci. Policy Sustain. Dev. 2005, 47, 8–20. [Google Scholar] [CrossRef]
- Blattel-Mink, B. Innovation towards sustainable economy—The integration of economy end ecology in companies. Sustain. Dev. 1998, 6, 49–58. [Google Scholar] [CrossRef]
- Schaltegger, S.; Wagner, M. Sustainable entrepreneurship and sustainability innovation: Categories and interactions. Bus. Strategy Environ. 2011, 20, 222–237. [Google Scholar] [CrossRef]
- Chu, S.; Liu, N. The path towards sustainable energy. Nat. Mater. 2017, 16, 16–22. [Google Scholar] [CrossRef]
- Lorek, S.; Spangenberg, J.H. Sustainable consumption within a sustainable economy—Beyond green growth and green economies. J. Clean Prod. 2014, 63, 33–44. [Google Scholar] [CrossRef]
- Chhabra, D. Proposing a sustainable marketing. J. Sustain. Tour. 2009, 17, 303–320. [Google Scholar] [CrossRef]
- Gajdzik, B.; Grabowska, S.; Saniuk, S.; Wieczorek, T. Sustainable Development and Industry 4.0: A Bibliometric Analysis Identifying Key Scientific Problems of the Sustainable Industry 4.0. Energies 2020, 13, 4254. [Google Scholar] [CrossRef]
- Berger, R. Industry 4.0—The New Industrial Revolution—How Europe Will Succeed; TANGER: Berlin, Germany, 2014. [Google Scholar]
- Marczewska, M.; Kostrzewski, M. Sustainable Business Models: A Bibliometric Performance Analysis. Energies 2020, 13, 6062. [Google Scholar] [CrossRef]
- Porter, M.E. Competitive Advantage: Creating and Sustaining Superior Performance; Free Pass: New York, NY, USA, 2015. [Google Scholar]
- Bocken, N.M.P.; Short, S.W.; Rana, P.; Evans, S. A literature and practice review to develop sustainable business model archetypes. J. Clean. Prod. 2014, 65, 42–56. [Google Scholar] [CrossRef]
- Ceylan, H. Analysis of occupational accidents according to the sectors in Turkey. Gazi Univ. J. Sci. 2012, 25, 909–918. [Google Scholar]
- Małysa, T. Work safety during usage, repair and maintenance of machines—A review of work safety in the aspect of accident at work. New Trends Prod. Eng. 2019, 2, 151–161. [Google Scholar] [CrossRef][Green Version]
- Gajdzik, B.; Zwolińska, D.; Szymszal, J. Behavioural determinants of work accidents and absenteeism in a metallurgical enterprise. Metalurgija 2015, 54, 741–744. [Google Scholar]
- Zakaria, N.H.; Mansor, N.; Abdullah, Z. Workplace accident in Malaysia: Most common causes and solutions. Bus. Manag. Rev. 2012, 2, 75–88. [Google Scholar]
- Shao, B.; Hu, Z.; Liu, Q.; Chen, S.; He, W. Fatal accidents patterns of building construction activities in China. Saf. Sci. 2019, 111, 253–263. [Google Scholar] [CrossRef]
- Hoła, B.; Szóstak, M. Methodology of analysing the accident rate in the construction industry. Procedia Eng. 2017, 172, 355–362. [Google Scholar] [CrossRef]
- Węgrzyn, M. Data analysis considering the number of victim and causes of accidents happened in Poland in 2010–2015. Zesz. Nauk. SGPS 2017, 62, 187–201. [Google Scholar]
- Kardas, E. The analysis of accidents as an evaluation system of effectiveness of health and safety system in metallurgical company. Instiute Ferr. Metall. 2009, 61, 20–23. [Google Scholar]
- Cooper, M.D.; Phillips, R.A. Exploratory analysis of the safety climate and safety behavior relationship. J. Saf. Res. 2004, 35, 497–512. [Google Scholar] [CrossRef] [PubMed]
- Goh, Y.M.; Chua, D.K.H. Neutral Network of construction safety management systems: A case study in Singapore. Constr. Manag. Econ. 2013, 31, 460–470. [Google Scholar] [CrossRef]
- Bahzad, E.; Matthew, R.H.; Balaji, R. Attribute-based safety risk assessment. II: Predicting safety outcomes using generalized linear models. J. Constr. Eng. Manag. 2015, 141, 1–11. [Google Scholar]
- Tam, C.M.; Fung, I.W.H. Effectiveness of safety management strategies on safety performance in Hong Kong. J. Constr. Manag. Econ. 1998, 16, 49–55. [Google Scholar] [CrossRef]
- Glendon, A.I.; Litherland, D.K. Safety climate factors, group differences and safety behavior in road construction. Saf. Sci. 2001, 39, 157–188. [Google Scholar] [CrossRef]
- Gillen, M.; Maltz, D.; Gassel, M.; Jurcg, L.; Vaccaro, D. Perceived safety climate, job demands, and coworker support among union and nonunion injured construction workers. J. Saf. Res. 2002, 33, 33–51. [Google Scholar] [CrossRef]
- Lee, S.; Halpin, D. Predictive tool for estimating accident risk. J. Constr. Eng. Manag. 2003, 4, 431–436. [Google Scholar] [CrossRef]
- Fang, D.P.; Chen, Y.; Louisa, W. Safety climate in construction industry: A case study in Hong Kong. J. Constr. Eng. Manag. 2006, 6, 573–584. [Google Scholar] [CrossRef]
- Baradan, S.; Usmen, M.A. Comparative injury and fatality risk analysis of building trades. J. Constr. Eng. Manag. 2006, 5, 533–539. [Google Scholar] [CrossRef]
- Johnson, S.E. The predictive validity of safety climate. J. Saf. Res. 2007, 38, 511–521. [Google Scholar] [CrossRef]
- Hallowell, M.R.; Gambatese, J.A. Activity-based safety and health risk quantification for formwork construction. J. Constr. Eng. Manag. 2009, 135, 990–998. [Google Scholar] [CrossRef]
- Rosenthal, R. Meta-Analytic Procedures for Social Research; SAGE Publications: Thousand Oaks, CA, USA, 1991. [Google Scholar]
- Esmaelil, B.; Hallowell, M.R. Integration of safety risk data with highway construction schedules. J. Constr. Manag. Econ. 2013, 31, 528–541. [Google Scholar] [CrossRef]
- Ghahramani, A.; Khalkhali, H.R. Development and validation of safety climate scale form manufacturing industry. Saf. Health Work 2015, 6, 97–103. [Google Scholar] [CrossRef] [PubMed]
- Bartkowiak, G.; Marszałek, A. Obciążenie cieplne pracowników w gorącym środowisku pracy i sposoby jego redukcji. Bezp. Pracy 2012, 10, 28–32. [Google Scholar]
- Rajca, P. Analysis of hazards in the metallurgical industry on example of selected positions of steel works. Prace Nauk. Akad. Jana Długosza Częst. Tech. Inform. Inż. Bezp. 2017, 5, 53–65. [Google Scholar]
- Gawęda, E. Zagrożenia chemiczne i pyłowe w procesach produkcji wyrobów metalowych. Bezp. Pracy 2008, 4, 7–11. [Google Scholar]
- Act of 20 September 2001 on Occupational Health and Safety in Steel Industry; ILO: Geneva, Switzerland, 2001.
- Gajdzik, B. Restructuring of the Metallurgical Enterprises in Statistical Data and Empirical Approach; SUT Publisher: Gliwice, Poland, 2013. [Google Scholar]
- Gajdzik, B.; Sroka, W. Analytic study of the capital restructuring process in metallurgical enterprises around the world and in Poland. Metalurgija 2012, 51, 265–268. [Google Scholar]
- Standard PN-N 18001:2004. In Systemy Zarządzania Bezpieczeństwem i Higieną Pracy—Wymagania; ISO: Geneva, Switzerland, 2004.
- Standard BS OHSAS 18001:2007. In Occupational Health and Safety Management Systems. Requirements; ISO: Geneva, Switzerland, 2007.
- Standard PN-EN ISO 9001:2015. In Quality Management Systems—Requirements; ISO: Geneva, Switzerland, 2015.
- Standard PN-EN ISO 14001:2015. In Environmental Management Systems—Requirements with Guidance for Use; ISO: Geneva, Switzerland, 2015.
- Gajdzik, B.; Sitko, J. Steel mill product analysis using quality methods. Metalurgija 2016, 55, 807–810. [Google Scholar]
- Act of 1974 June 26 the Labor Code; ILO: Geneva, Switzerland, 1974.
- Polish Steel Industry. Report 2019; Polish Steel Association: Katowice, Poland, 2019; Available online: www.hiph.org.pl (accessed on 1 October 2020).
- Statistic Poland. Available online: www.stat.gov.pl (accessed on 10 October 2020).
- Dittmann, P. Forecasting in an Enterprise; Oficyna Ekonomiczna Publisher: Cracow, Poland, 2004. [Google Scholar]
- Cieślak, M. Prognozowanie Gospodarcze—Metody i Zastosowanie; PWN Publisher: Warsaw, Poland, 2001. [Google Scholar]
- Sobczyk, M. Prognozowanie—Teoria. Przykłady. Zadania; Placed Publisher: Warsaw, Poland, 2008. [Google Scholar]
- Zeliaś, A. Statistical Methods; PWE Publisher: Warsaw, Poland, 2000. [Google Scholar]
- Krawiec, S. Adaptacyjne Modele Wygładzania Wykładniczego Jako Instrument Prognozowania Krótkoterminowego Zjawisk Ilościowych; SUT Publisher: Gliwice, Poland, 2014. [Google Scholar]
- Holt, C.C. Forecasting seasonal and trends by exponentially weighted moving average. Int. J. Forecast. 2004, 20, 5–10. [Google Scholar] [CrossRef]
- Li, M.; Li, J.; Huang, M. Chinese Provincial Economics Competitiveness Evaluation and Prediction Research; Social Science Literature Press: Beijing, China, 2007. [Google Scholar]
- Czyżycki, R.; Klóska, R. Ekonometria i Prognozowanie Zjawisk Ekonomicznych w Przykładach i Zadaniach; Economicus Publisher: Szczecin, Poland, 2011. [Google Scholar]
- Czyżycki, R.; Hundert, M.; Klóska, R. Wybrane Zagadnienia z Prognozowania; Economicus Publisher: Szczecin, Poland, 2006. [Google Scholar]
- Welfe, A. Ekonometria; PWE Publisher: Warsaw, Poland, 2003. [Google Scholar]
- Witkowska, F. Attitudes of Econometrics and the Theory of Forecasting; Oficyna Ekonomiczna Publisher: Warsaw, Poland, 2005. [Google Scholar]
- Małysa, T. Use of Holt’s model for forecasting until 2023 occupational accidents in the metallurgical industry in Poland. Metalurgija 2020, 59, 578–580. [Google Scholar]
- Zimny, A. Statystyka Opisowa; Państwowa Wyższa Szkoła Zawodowa w Koninie Publisher: Konin, Poland, 2010. [Google Scholar]
- Snarska, A. Statistics, Econometrics, Forecasting. Exercises with Excel; Placet Publisher: Warsaw, Poland, 2005. [Google Scholar]
- Jackson, T. Societal transformations for a sustainable economy. Nat. Resour. Forum 2011, 35, 155–164. [Google Scholar] [CrossRef]
- Drucker, P.F. Zarządzanie w XXI Wieku; Muza: Warsaw, Poland, 2000. [Google Scholar]
- Wolfenden, P.J.; Welch, D.E. Business architecture: A holistic approach to defining the organization necessary to deliver a strategy. Knowl. Process Manag. 2000, 7, 97–106. [Google Scholar] [CrossRef]
- Lis, T.; Nowacki, K. Zarządzanie Bezpieczeństwem i Higieną Pracy w Zakładzie Przemysłowym; Pub. SUT: Gliwice, Poland, 2005. [Google Scholar]
- Rüßmann, M.; Lorenz, P.; Gerbert, P.; Waldner, M. Industry 4.0: The future of productivity and growth in manufacturing industries. Boston Consult. Group 2015, 9, 1–14. [Google Scholar]
- Lee, J.; Kao, H.-A.; Yang, S. Service innovation and smart analytics for Industry 4.0 and big data environment. 6th CIRP Conference on Industrial Product-Service Systems. Procedia CIRP 2014, 16, 3–8. [Google Scholar] [CrossRef]
- Oracle Cloud: Opening up the Road to Industry 4.0. Available online: www.orcale.com (accessed on 10 November 2020).
- Saniuk, S.; Grabowska, S.; Gajdzik, B. Social Expectations and Market Changes in the Context of Developing the Industry 4.0 Concept. Sustainability 2020, 12, 1362. [Google Scholar] [CrossRef]
- Saniuk, S.; Grabowska, S.; Gajdzik, B. Personalization of Products in the Industry 4.0 Concept and Its Impact on Achieving a Higher Level of Sustainable Consumption. Energies 2020, 13, 5895. [Google Scholar] [CrossRef]
- Afonasova, M.A.; Panfilova, E.E.; Galichkina, M.A.; Ślusarczyk, B. Digitalization in economy and innovation: The effect on social and economic processes. Pol. J. Manag. Stud. 2019, 19, 22–32. [Google Scholar]
- Ji, Z.; Yanhong, Z.; Baicun, W.; Jiyuan, Z. Human-Cyber-Physical Systems (HCPSs) in the context of new-generation intelligent manufacturing. Engineering 2019, 5, 624–636. [Google Scholar]
- Sun, S.; Zheng, X.; Gong, B.; Garcia Paredes, J.; Ordieres-Male, J. Healthy Operator 4.0: A Human Cyber—Physical System Architecture of Smart Workplaces. Sensors 2020, 20, 2011. [Google Scholar] [CrossRef]
- Gajdzik, B. Development of business models and their key components in the context of cyber-physical production systems in Industry 4.0. In Scalability and Sustainability of Business Models in Circular, Sharing and Networked Economies; Jabłoński, A., Jabłoński, M., Eds.; Cambridge Scholars Publishing: Newcastle upon Tyne, UK, 2020; Chapter 3; pp. 73–94. [Google Scholar]


Publisher’s Note: MDPI stays neutral with regard to jurisdictional claims in published maps and institutional affiliations. |
© 2020 by the authors. Licensee MDPI, Basel, Switzerland. This article is an open access article distributed under the terms and conditions of the Creative Commons Attribution (CC BY) license (http://creativecommons.org/licenses/by/4.0/).