Improved Procedure for Earth Fault Loop Impedance Measurement in TN Low-Voltage Network


Abstract
:1. Introduction
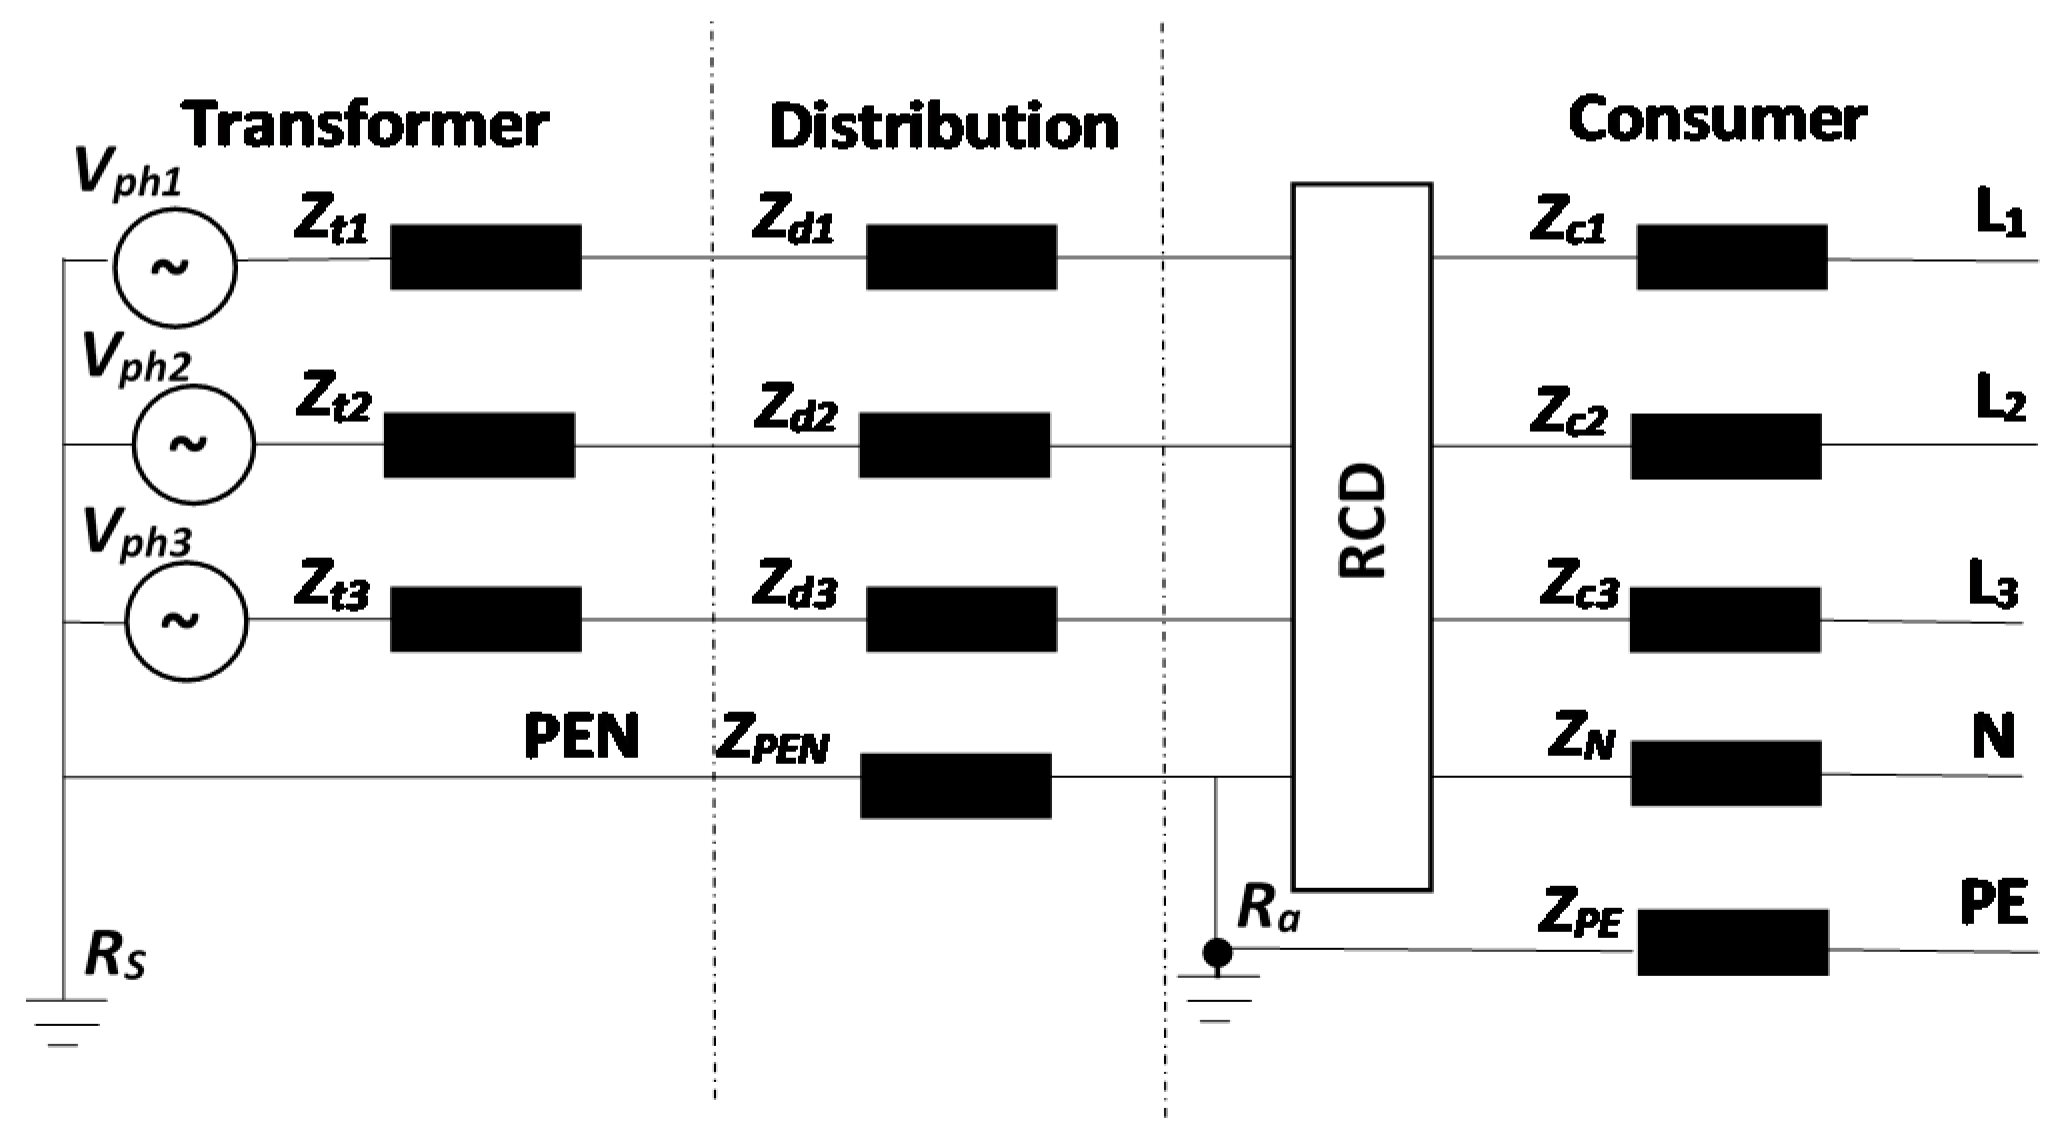
2. Source of Errors
3. Suggested Procedure
- To rule out problems associated with loads switching at the consumer’s side, or the influence of defect regimes, the next protocol of measurements must be applied: Repetitive measurement of the voltages: VclosedS, VopenS, VclosedS, … VopenS, VclosedS until the values of the voltage VclosedS of two successive measurements is the same (obviously within the limits of an imposed error).
- To avoid the error associated with the effects of measurement and calculations with effective quantities instead of phasors, the two required variables, VopenS and I or VopenS and VclosedS, must be measured as rms values but also the phase shift between them must be recorded.
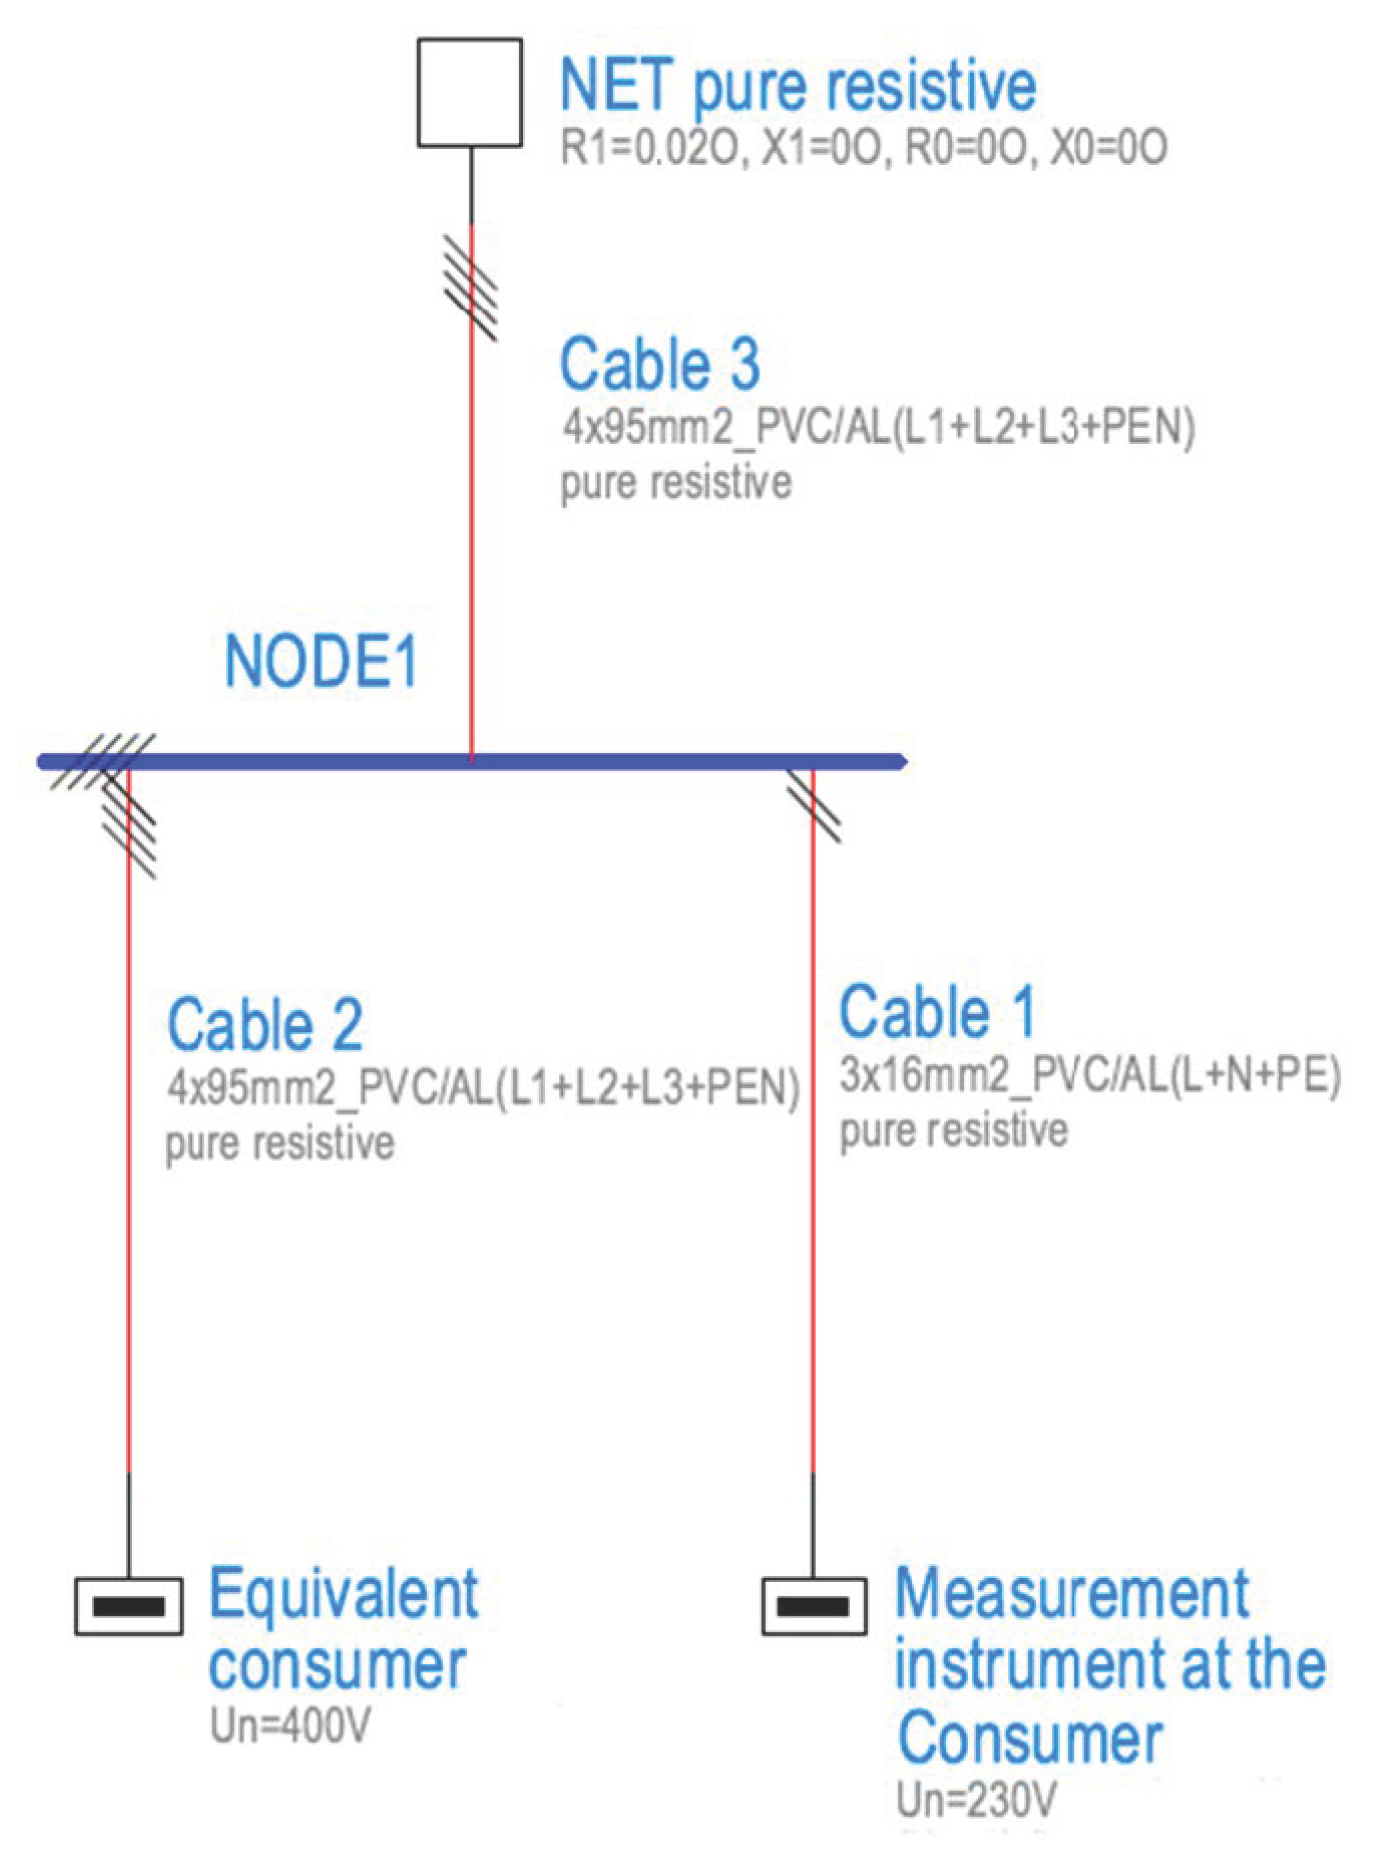
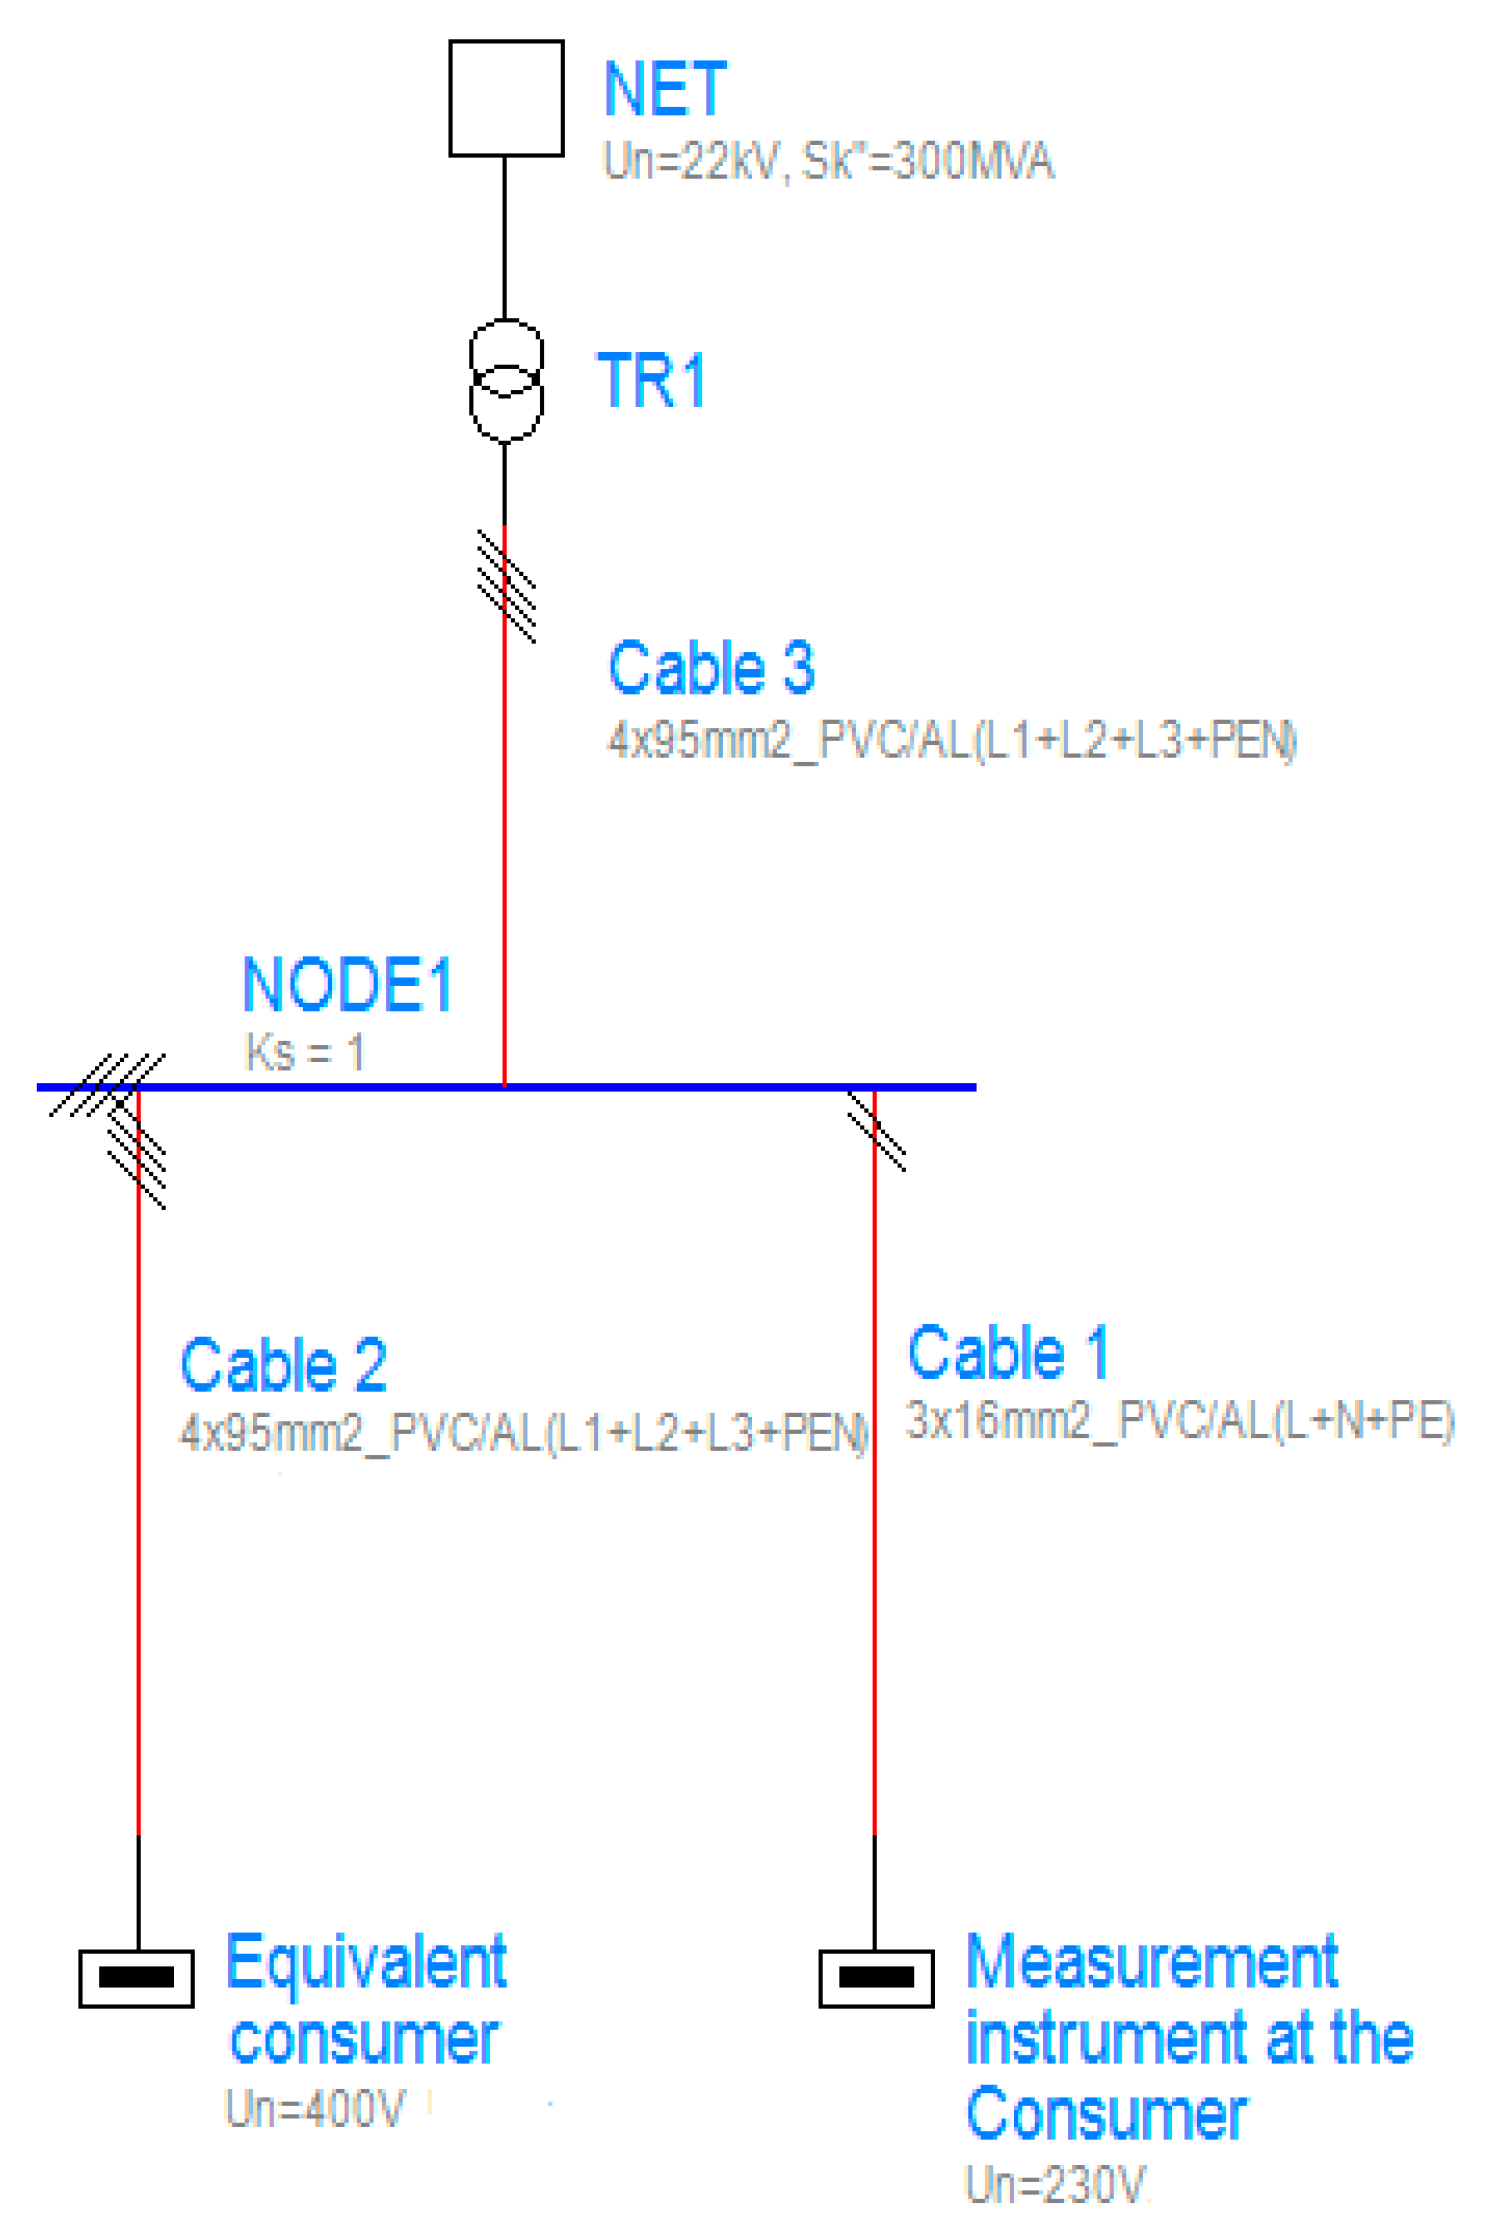
4. Validation
5. Conclusions
- The switching of loads at the consumer sides and/or the occurrence of fault regimes during measurements and
- The use of effective quantities instead of phasors, which becomes significant if the inductive reactance of the network components becomes comparable to their resistance.
- The next protocol must be applied: repetitive measurement of the voltages, VclosedS, VopenS, VclosedS, … VopenS, VclosedS, until the values of the voltage VclosedS of two successive measurements is the same (obviously within the limits of an imposed error). This first rule is mandatory because it avoids the huge errors that occur due to the switching of the loads during the measurement and, also, it is simple and cheap to implement in the measuring equipment.
- To avoid the error associated with the effects of measurement and calculations with effective quantities instead of phasors, the two required variables, VopenS and I or VopenS and VclosedS, must be measured as rms values but also the phase shift between them must be recorded. As seen in those presented in the paper, errors of over 30% occur in measurements near distribution transformers if they have low-rated powers. As the cost of implementing such an algorithm is higher, the solution may be unjustifiable at the usual measurements, i.e., far from the power transformers. Another comment has to be made here: We used a two-wire, high-current testing method [14] for analyzing measurement apparatus, but with a two- or three-wire “no trip” algorithm implemented [14], the errors will be greater than those presented here due to the external influences and the need for increased voltage measurement accuracy. In this case, using phasors can be reconsidered.
Author Contributions
Funding
Institutional Review Board Statement
Informed Consent Statement
Data Availability Statement
Conflicts of Interest
References
- Low-Voltage Electrical Installations—Part 6: Verification; HD 60364-6; IEC: Geneva, Switzerland, 2016.
- Electrical Safety in Low Voltage Distribution Systems up to 1000 V a.c. and 1500 V d.c. Equipment for Testing, Measuring or Monitoring of Protective Measures; EN 61557; IEC: Geneva, Switzerland, 2007–2008.
- Low-Voltage Electrical Installations—Part 4-41: Protection for Safety—Protection against Electric Shock; IEC 60364-4-41; IEC: Geneva, Switzerland, 2012.
- Neamt, L.; Balan, H.; Chiver, O.; Hotea, A. Considerations about Fault Loop Impedance Measurement in TN Low-Voltage Network. In Proceedings of the 8th International Conference on Modern Power Systems (MPS), Cluj Napoca, Romania, 21–23 May 2019; pp. 1–4. [Google Scholar]
- Roskosz, R.; Musial, E.; Czapp, S. A method of earth fault loop impedance measurement without unwanted tripping of RCDs. In Proceedings of the Progress in Applied Electrical Engineering (PAEE), Koscielisko, Poland, 18–22 June 2018; pp. 1–4. [Google Scholar]
- Mitolo, M.; Bajzek, T.J. Measuring the electrical safety in low-voltage distribution systems. In Proceedings of the IEEE/IAS 54th Industrial and Commercial Power Systems Technical Conference (I&CPS), Niagara Falls, ON, Canada, 7–10 May 2018; pp. 1–4. [Google Scholar]
- Liu, H.; Mitolo, M.; Qiu, J. Ground-Fault Loop Impedance Calculations in Low-Voltage Single-Phase Systems. IEEE Trans. Ind. Applic. 2014, 50, 1331–1337. [Google Scholar]
- Czapp, S. Fault Loop Impedance Measurement in Low Voltage Network with Residual Current Devices. Electron. Electr. Eng. 2012, 122, 109–112. [Google Scholar]
- Hadziefendic, N.; Kostic, N.; Trifunovic, J.; Kostic, M. Detection of Poor Contacts in Low-Voltage Electrical Installations. IEEE Trans. Comp. Pack. Man. Techn. 2019, 9, 129–137. [Google Scholar] [CrossRef]
- Mitolo, M.; Liu, H. Touch Voltage Analysis in Low-Voltage Power Systems Studies. IEEE Trans. Ind. Applic. 2016, 52, 556–559. [Google Scholar] [CrossRef]
- Mitolo, M.; Bajzek, T.J. New Generation Tester to Assess the Electrical Safety in Low-Voltage Distribution Systems. IEEE Trans. Ind. Applic. 2019, 55, 106–110. [Google Scholar] [CrossRef]
- Czapp, S. Method of earth fault loop impedance measurement without nuisance tripping of RCDs in 3-phase low-voltage circuits. Metrol. Meas. Syst. 2019, 26, 217–227. [Google Scholar]
- Eaton Industries (Austria) GmbH. xSpider Version 3.3, User’s Manual; Eaton: Wien, Austria, 2019. [Google Scholar]
- Megger. Earth Electrode and Earth Loop Impedance Testing. Theory and Applications. Available online: https://uk.megger.com/support/technical-library/application-notes/earth-electrode-and-earth-loop-impedance-testing-t (accessed on 1 November 2020).


| Rated Phase Voltage Vph Range (V) | Safe Disconnection Time (s) |
|---|---|
| (50; 120] | 0.8 |
| (120; 230] | 0.4 |
| (230; 400] | 0.2 |
| >400 | 0.1 |
| Rated Current (A) | ZloopMAX (Ω) | |||||
|---|---|---|---|---|---|---|
| CB Type B | CB Type C | gG Fuse | ||||
| Normal Operating Temperature | Unknown Operating Temperature | Normal Operating Temperature | Unknown Operating Temperature | Normal Operating Temperature | Unknown Operating Temperature | |
| 10 | 4.37 | 3.50 | 2.18 | 1.74 | 4.85 | 3.88 |
| 16 | 2.72 | 2.18 | 1.35 | 1.08 | 2.56 | 2.05 |
| 25 | 1.74 | 1.39 | 0.86 | 0.69 | 1.35 | 1.08 |
| 32 | 1.35 | 1.08 | 0.68 | 0.54 | 0.99 | 0.79 |
| 63 | 0.69 | 0.55 | 0.34 | 0.27 | 0.425 | 0.34 |
| 100 | 0.43 | 0.34 | 0.2 | 0.16 | 0.21 | 0.17 |
| Equivalent Consumer | Measurement Instrument Based on (7) | Zloop (Ω) Accurate Value | |||
|---|---|---|---|---|---|
| p (kW) | cosφ | VopenS (V) | VclosedS (V) | Zloop (Ω) | |
| 0 | 1 | 229.977 | 225.607 | 0.437 | 0.437 |
| 5 | 228.574 | 224.204 | 0.437 | ||
| 10 | 227.171 | 222.801 | 0.437 | ||
| 100 | 201.733 | 197.363 | 0.437 | ||
| Component | Parameter |
|---|---|
| NET | Short-circuit power (3-phase short-circuit), Sk3 p = 300 MVA |
| TR1 | Rated power Sr = 100 kVA, 22/0.4 kV, Yzn1, Short-circuit losses Pk = 2.15 kW, Short-circuit voltage uk = 4% and |
| Rated power Sr = 400 kVA, 22/0.4 kV, Dyn1, Short-circuit losses Pk = 6.265 kW, Short-circuit voltage uk = 6% | |
| Cable 1 | r1 = 1.935 mΩ/m, r0 = 7.74 mΩ/m, x1 = 0.082 mΩ/m, x0 = 0.2952 mΩ/m, L = 10 m |
| Cable 2 | r1 = 0.326 mΩ/m, r0 = 1.586618 mΩ/m, x1 = 0.082 mΩ/m, x0 = 0.2952 mΩ/m, L = 1 m |
| Cable 3 | r1 = 0.326 mΩ/m, r0 = 1.58618 mΩ/m, x1 = 0.082 mΩ/m, x0 = 0.2952 mΩ/m, L = 10 ÷ 500 m |
| Equivalent consumer | Pn = 0; 5; 10 and 100 kW, cosφ = 0.5; 0.75 and 1 |
| Measurement instrument | Pn = 0 and 2.3 kW |
| Equivalent Consumer | Measurement Instrument Based on (7) | Zloop (Ω) Accurate Value | |||
|---|---|---|---|---|---|
| p (kW) | cosφ | VopenS (V) | VclosedS (V) | Zloop (Ω) | |
| 0 | 1 | 230.000 | 229.448 | 0.0552 | 0.0845 = |0.0725 + j·0.0425| |
| 5 | 229.977 | 229.425 | 0.0552 | ||
| 10 | 229.954 | 229.402 | 0.0552 | ||
| 100 | 229.448 | 228.896 | 0.0552 | ||
| 0 | 0.75 | 230.000 | 229.448 | 0.0552 | |
| 5 | 229.977 | 229.425 | 0.0552 | ||
| 10 | 229.931 | 229.379 | 0.0552 | ||
| 100 | 229.333 | 228.781 | 0.0552 | ||
| 0 | 0.5 | 230.000 | 229.448 | 0.0552 | |
| 5 | 229.977 | 229.425 | 0.0552 | ||
| 10 | 229.931 | 229.379 | 0.0552 | ||
| 100 | 229.241 | 228.689 | 0.0552 | ||
| Equivalent Consumer | Measurement Instrument Based on (7) | Zloop (Ω) Accurate Value | |||
|---|---|---|---|---|---|
| p (kW) | cosφ | VopenS (V) | VclosedS (V) | Zloop (Ω) | |
| 0 | 1 | 229.977 | 225.607 | 0.437 | 0.464 = |0.449 + j·0.1175| |
| 5 | 228.574 | 224.204 | 0.437 | ||
| 10 | 227.171 | 222.801 | 0.437 | ||
| 100 | 201.756 | 197.386 | 0.437 | ||
| 0 | 0.75 | 229.977 | 225.607 | 0.437 | |
| 5 | 228.321 | 223.951 | 0.437 | ||
| 10 | 226.642 | 222.272 | 0.437 | ||
| 100 | 197.386 | 193.016 | 0.437 | ||
| 0 | 0.5 | 229.977 | 225.607 | 0.437 | |
| 5 | 228.068 | 223.698 | 0.437 | ||
| 10 | 226.159 | 221.789 | 0.437 | ||
| 100 | 196.190 | 191.820 | 0.437 | ||
| Equivalent Consumer | Measurement Instrument Based on (7) | Zloop (Ω) Accurate Value | |||
|---|---|---|---|---|---|
| p (kW) | cosφ | VopenS (V) | VclosedS (V) | Zloop (Ω) | |
| 0 | 1 | 230.000 | 229.448 | 0.0552 | 0.0585 = |0.0.053 + j·0.0235| |
| 5 | 229.977 | 229.425 | 0.0552 | ||
| 10 | 229.954 | 229.402 | 0.0552 | ||
| 100 | 229.448 | 228.896 | 0.0552 | ||
| 0 | 0.75 | 230.000 | 229.448 | 0.0552 | |
| 5 | 229.977 | 229.425 | 0.0552 | ||
| 10 | 229.931 | 229.379 | 0.0552 | ||
| 100 | 229.333 | 228.781 | 0.0552 | ||
| 0 | 0.5 | 230.000 | 229.448 | 0.0552 | |
| 5 | 229.977 | 229.425 | 0.0552 | ||
| 10 | 229.931 | 229.379 | 0.0552 | ||
| 100 | 229.241 | 228.689 | 0.0552 | ||
| Equivalent Consumer | Measurement Instrument Based on (7) | Zloop (Ω) Accurate Value | |||
|---|---|---|---|---|---|
| p (kW) | cosφ | VopenS (V) | VclosedS (V) | Zloop (Ω) | |
| 0 | 1 | 229.977 | 225.607 | 0.437 | 0.441 = |0.4295 + j·0.05| |
| 5 | 228.574 | 224.204 | 0.437 | ||
| 10 | 227.171 | 222.801 | 0.437 | ||
| 100 | 201.756 | 197.386 | 0.437 | ||
| 0 | 0.75 | 229.977 | 225.607 | 0.437 | |
| 5 | 228.321 | 223.951 | 0.437 | ||
| 10 | 226.642 | 222.272 | 0.437 | ||
| 100 | 197.386 | 193.016 | 0.437 | ||
| 0 | 0.5 | 229.977 | 225.607 | 0.437 | |
| 5 | 228.068 | 223.698 | 0.437 | ||
| 10 | 226.159 | 221.789 | 0.437 | ||
| 100 | 196.190 | 191.820 | 0.437 | ||
Publisher’s Note: MDPI stays neutral with regard to jurisdictional claims in published maps and institutional affiliations. |
© 2021 by the authors. Licensee MDPI, Basel, Switzerland. This article is an open access article distributed under the terms and conditions of the Creative Commons Attribution (CC BY) license (http://creativecommons.org/licenses/by/4.0/).
Share and Cite
Neamt, L.; Neamt, A.; Chiver, O. Improved Procedure for Earth Fault Loop Impedance Measurement in TN Low-Voltage Network. Energies 2021, 14, 205. https://doi.org/10.3390/en14010205
Neamt L, Neamt A, Chiver O. Improved Procedure for Earth Fault Loop Impedance Measurement in TN Low-Voltage Network. Energies. 2021; 14(1):205. https://doi.org/10.3390/en14010205
Chicago/Turabian StyleNeamt, Liviu, Alina Neamt, and Olivian Chiver. 2021. "Improved Procedure for Earth Fault Loop Impedance Measurement in TN Low-Voltage Network" Energies 14, no. 1: 205. https://doi.org/10.3390/en14010205
APA StyleNeamt, L., Neamt, A., & Chiver, O. (2021). Improved Procedure for Earth Fault Loop Impedance Measurement in TN Low-Voltage Network. Energies, 14(1), 205. https://doi.org/10.3390/en14010205