1. Introduction
Over the last three decades, the increased expectations for energy efficient buildings combined with greater thermal comfort has established significant differences between the interior and exterior environmental water vapor pressure. This has created the need to manage water vapor diffusion and moisture, and has led to an increased demand for appropriate hygrothermal assessment [
1]. Hygrothermal analysis is capable of calculating the dynamic transport of moisture, heat, and air in a building envelope. In most developed nations, this has become an essential part of the production of durable, healthy, comfortable, and energy-efficient buildings [
2,
3]. The presence of uncontrolled moisture above a critical limits can result in various degrees of deterioration which can include corrosion, rusting, freezing, and swelling of many materials used in the building [
2,
4]. The most concerning aspect of uncontrolled moisture in a building is the opportunity for mold to grow within interior spaces. This can have serious implications for the health of the occupants [
5,
6]. In addition, recent research has shown that high levels of moisture can impact the energy performance of a building and the quality of the indoor air [
7,
8,
9,
10].
In Australia, moisture problems have become apparent in many new buildings. Up to 50% of National Construction Code Class 1 and Class 2 buildings constructed in the last 15 years have a visible internal formation of condensation [
11]. The complexity involved in understanding water vapor transport through appropriate hygrothermal calculation is posing significant challenges to the design and construction professionals in Australia especially when considering moisture management and energy efficiency in buildings [
12,
13,
14].
While hygrothermal assessment, the key scientific approach to managing condensation and mold in buildings, has been deployed to address these challenges in many other developed nations, it is an emerging field in the Australia [
13]. This may be because there were no building regulations requiring insulation in building envelopes until 2003, and the first regulations regarding risk of condensation management only came into effect in 2019. The long-term impact of moisture accumulation on building durability and human health has now become a critical aspect of the Australian regulatory agenda for new buildings.
Across other developed nations, hygrothermal analysis has evolved from manual calculation methods to computer simulations [
15,
16,
17]. In the last two decades, this has moved from a limited focus on condensation risk analysis to a greater understanding of moisture accumulation, energy efficiency, and the drying capacity envelopes. Over the same period of time, the simulation method has advanced from steady state to transient simulation [
18,
19,
20].
Several elements need to be considered in choosing an appropriate approach to hygrothermal modeling. In addition to precision and accuracy, the flexibility to allow selection from a variety of climatic zones and the quality of the climatic data are important aspects [
21]. Other things to consider include the simulation runtime, the size of the material data library, and how the vapor diffusion and moisture absorption data have been sourced and validated. For instance, WUFI Pro [
15], which appears to be the most popularly used hygrothermal software in Europe and North America, has been considered to be reliable because of its ability to deliver a realistic transient calculation and also because all the construction materials in its data library have been well validated [
15,
22].
The most appropriate method to source and validate construction material’s vapor diffusion properties is to conduct measurements in the laboratory. For many nations, the laboratory measurement of water vapor diffusion characteristics of individual construction materials is evolving, and robust databases are being created. The internationally accepted method to represent vapor diffusion is material vapor resistivity. Due to Australia’s slower adoption of highly insulated envelopes and vapor resistivity material data has not been required. It is inappropriate to adopt internationally available data directly for use in Australia without appropriate empirical evaluation of their applicability to materials used in Australia’s envelope systems and the physical properties of Australian manufactured construction materials. As of 2019, the Australian National Construction Code requires hygrothermal calculations [
23,
24] in order for the design of new buildings to be approved. Early adopters are using non-Australian data from international material databases for hygrothermal modeling; however, these data may not provide a true representation of Australian construction materials. Without empirical information regarding the vapor diffusion properties of Australian construction materials, there is the potential that inappropriate decisions will be made.
Four types of laboratory-based test methods are internationally recognized for the quantification of the water vapor diffusion properties of materials. These include the electron-analytical, sweating guarded hot plate, dynamic moisture permeation cell test, and the gravimetric methods [
4,
25,
26,
27,
28,
29,
30,
31]. The testing process requires the establishment of two environments with different vapor pressures on each side of the material. Increasingly, the most preferred method for establishing the water vapor diffusion properties of most construction materials is the gravimetric method [
26,
32,
33,
34,
35,
36]. This involves the measurement of the mass of moisture that has resulted from water vapor diffusion into or out of a test dish assembly, often referred to as the wet-cup or dry-cup test method, respectively [
25,
32,
37]. Depending on whether it is a wet-cup or dry-cup test, salt solutions, distilled water or a desiccant are used to establish a predetermined relative humidity within the test dish. The material is cut and attached to the test dish and then placed in a temperature and humidity-controlled cabinet or room. The humidity outside the cup, in the room, or cabinet, is controlled so that the desired relative humidity condition outside is achieved [
37,
38]. The conditions created within the cabinet or test room are designed to replicate the hygrothermal conditions the material may expect to experience as a component of the built fabric. The focus of this paper centers on the establishment of an appropriately hygrothermally controlled test room required for gravimetric vapor diffusion testing.
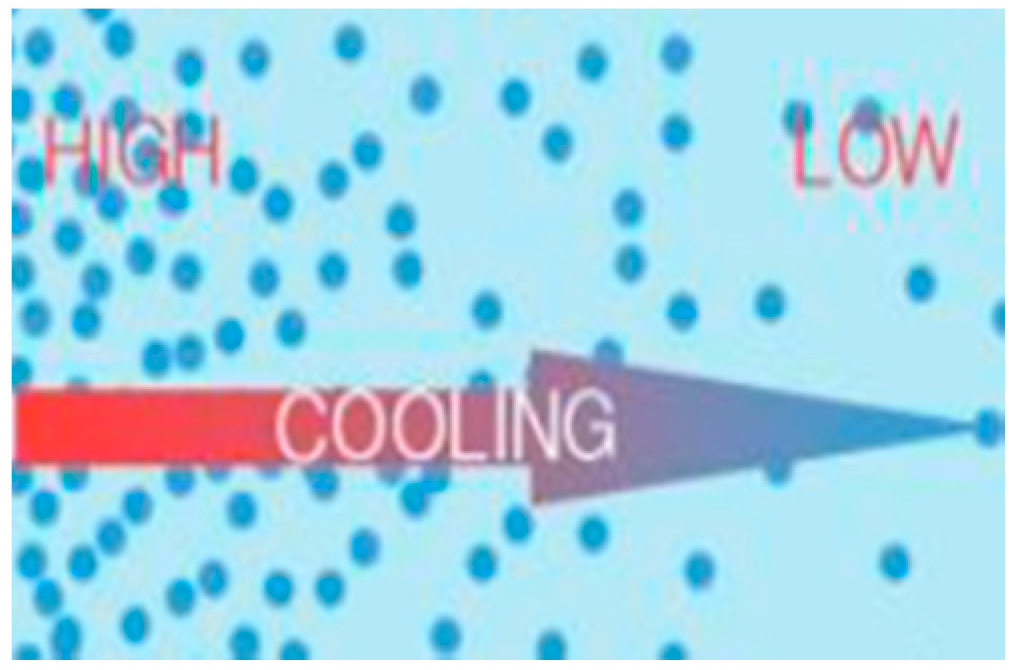
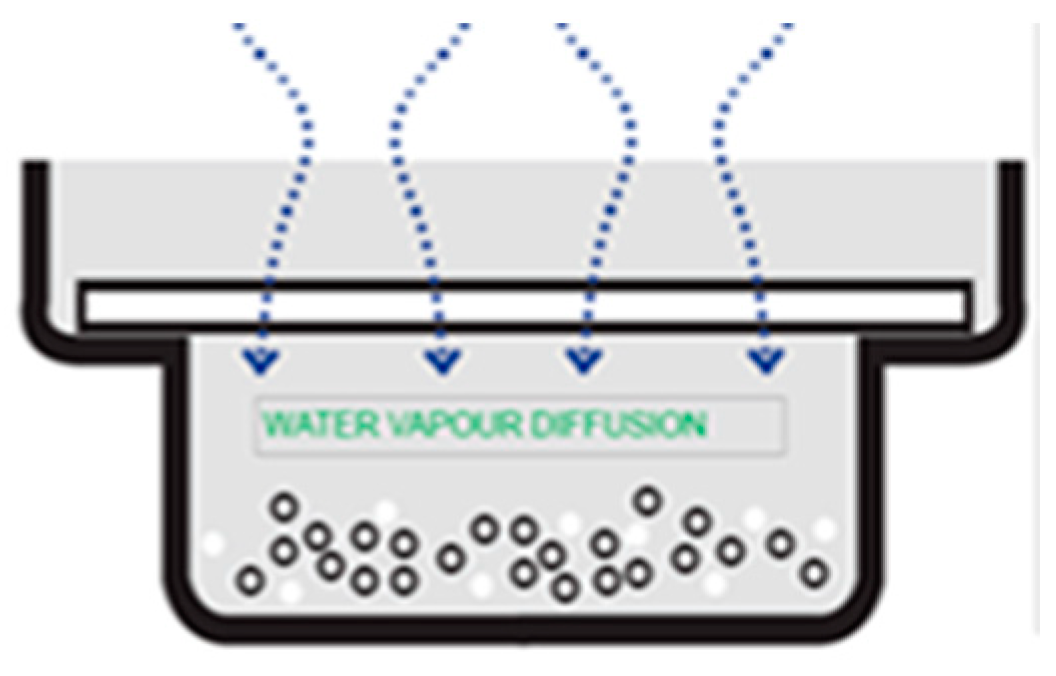
The general principle for the gravimetric method (shown in
Figure 1) is to create two environments with different vapor pressures, by establishing different relative humidities inside and outside the cup, while the temperature remains constant. During the test period, the dish is weighed at regular intervals until the mass does not change, indicating the vapor pressure of the test dish and the room have reached equilibrium. For wet cup gravimetric testing (shown in
Figure 2, the vapor flux is expected to go from the cup which has a higher RH through the material being tested to the environment which has a lower RH. The reverse is the case for dry cup gravimetric testing, shown in
Figure 3. The process is discontinued after a minimum of four consecutive weighing which shows no change in mass.
While many research papers have reported different procedures for quantifying the water vapor diffusion of construction materials using the gravimetric method in a climatic cabinet [
34,
39,
40], no research has reported the development of a hygrothermally controlled test room. However, the demand for more hygrothermally controlled test rooms will increase over the coming years both in Australia and internationally. This is because the demand for energy efficient buildings has increased in many jurisdictions as building codes have moved towards the requirement of near-zero energy consumption in buildings. Hence, the need to establish more hygrothermally suitable construction systems will increase and laboratory testing will be required to establish the hygrothermal properties of individual component materials.
The merits of a hygrothermally conditioned test room over the climatic cabinet is the elimination of experimental errors. During the gravimetric weighing, process errors may arise from opening, closing, and transporting test dishes from the cabinet. In a test room, all weighing activities occur within the climatically controlled space. Despite this distinct advantage, little or no research has reported the design, construction, installation of the equipment, and the operations of such a laboratory. This may be because the acquisition and installation of laboratories is not regarded as a research output. In addition, due to commercial reasons, those engineering firms that have built such rooms have never made available the details of the design, construction, and installation of such a facility. This paper describes the methods employed to develop Australia’s first hygrothermal laboratory for quantifying the diffusion properties of materials using common appliances, which included a round-robin test conducted between Fraunhofer Institute of Building Physics laboratory (IBP) Holzkirchen Germany, and this hygrothermal testing laboratory at the University of Tasmania (UTAS), Australia.
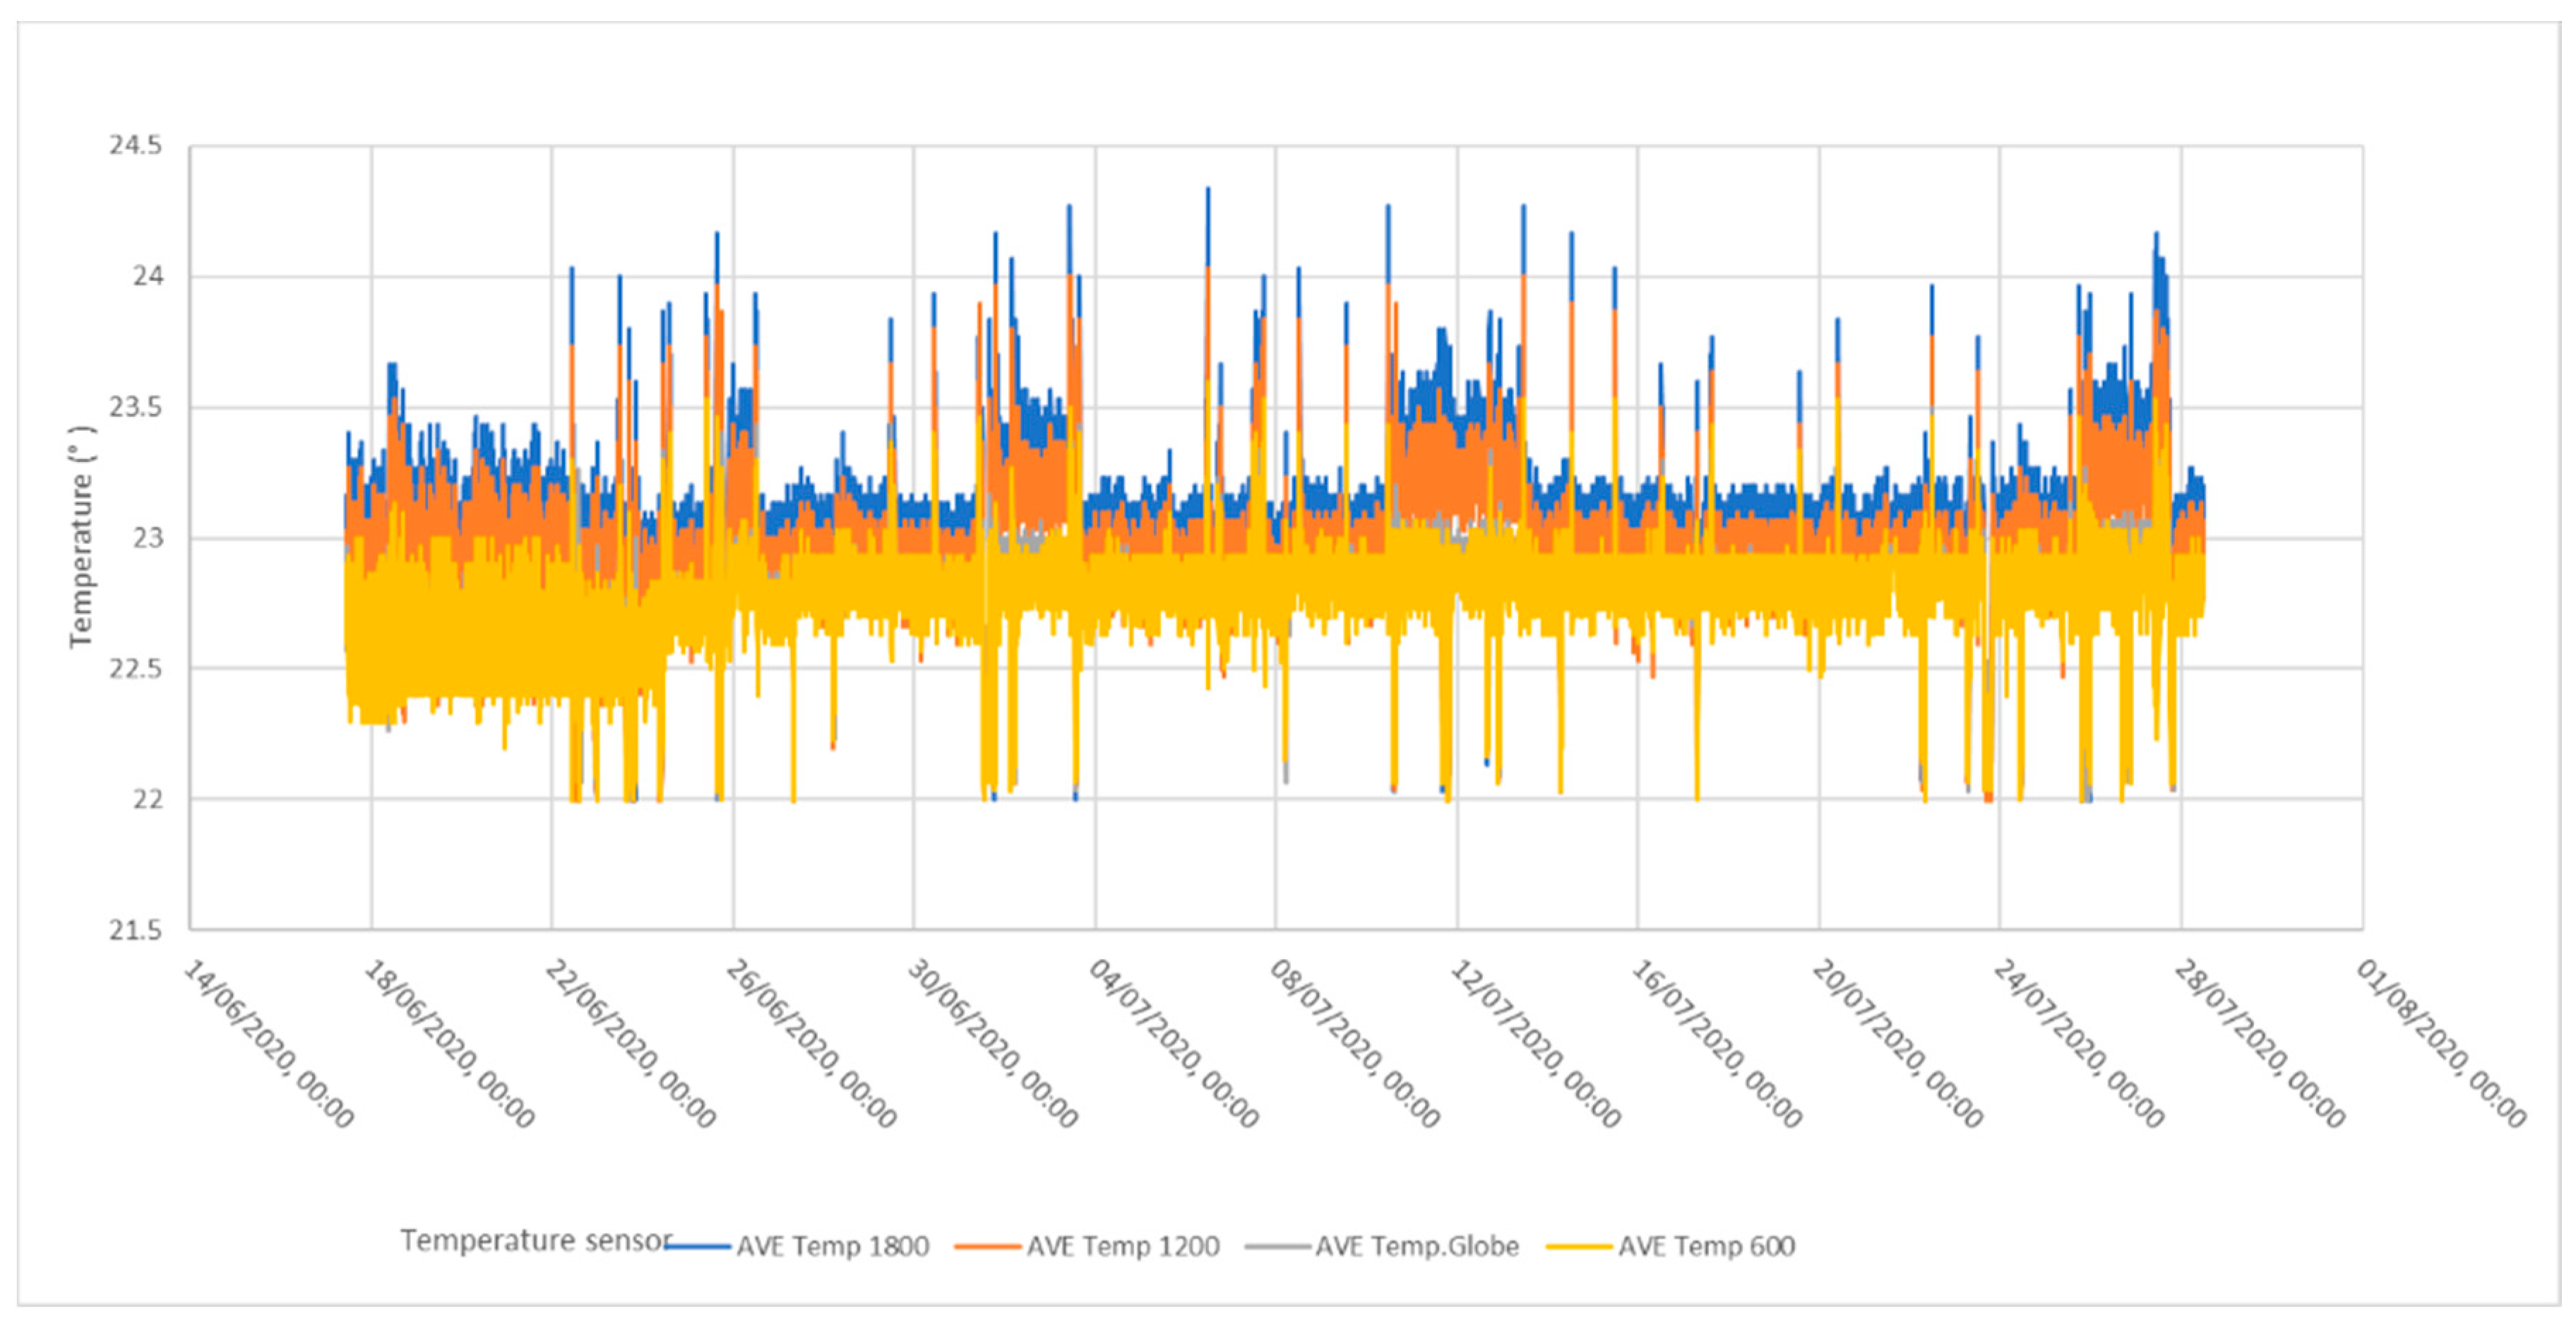
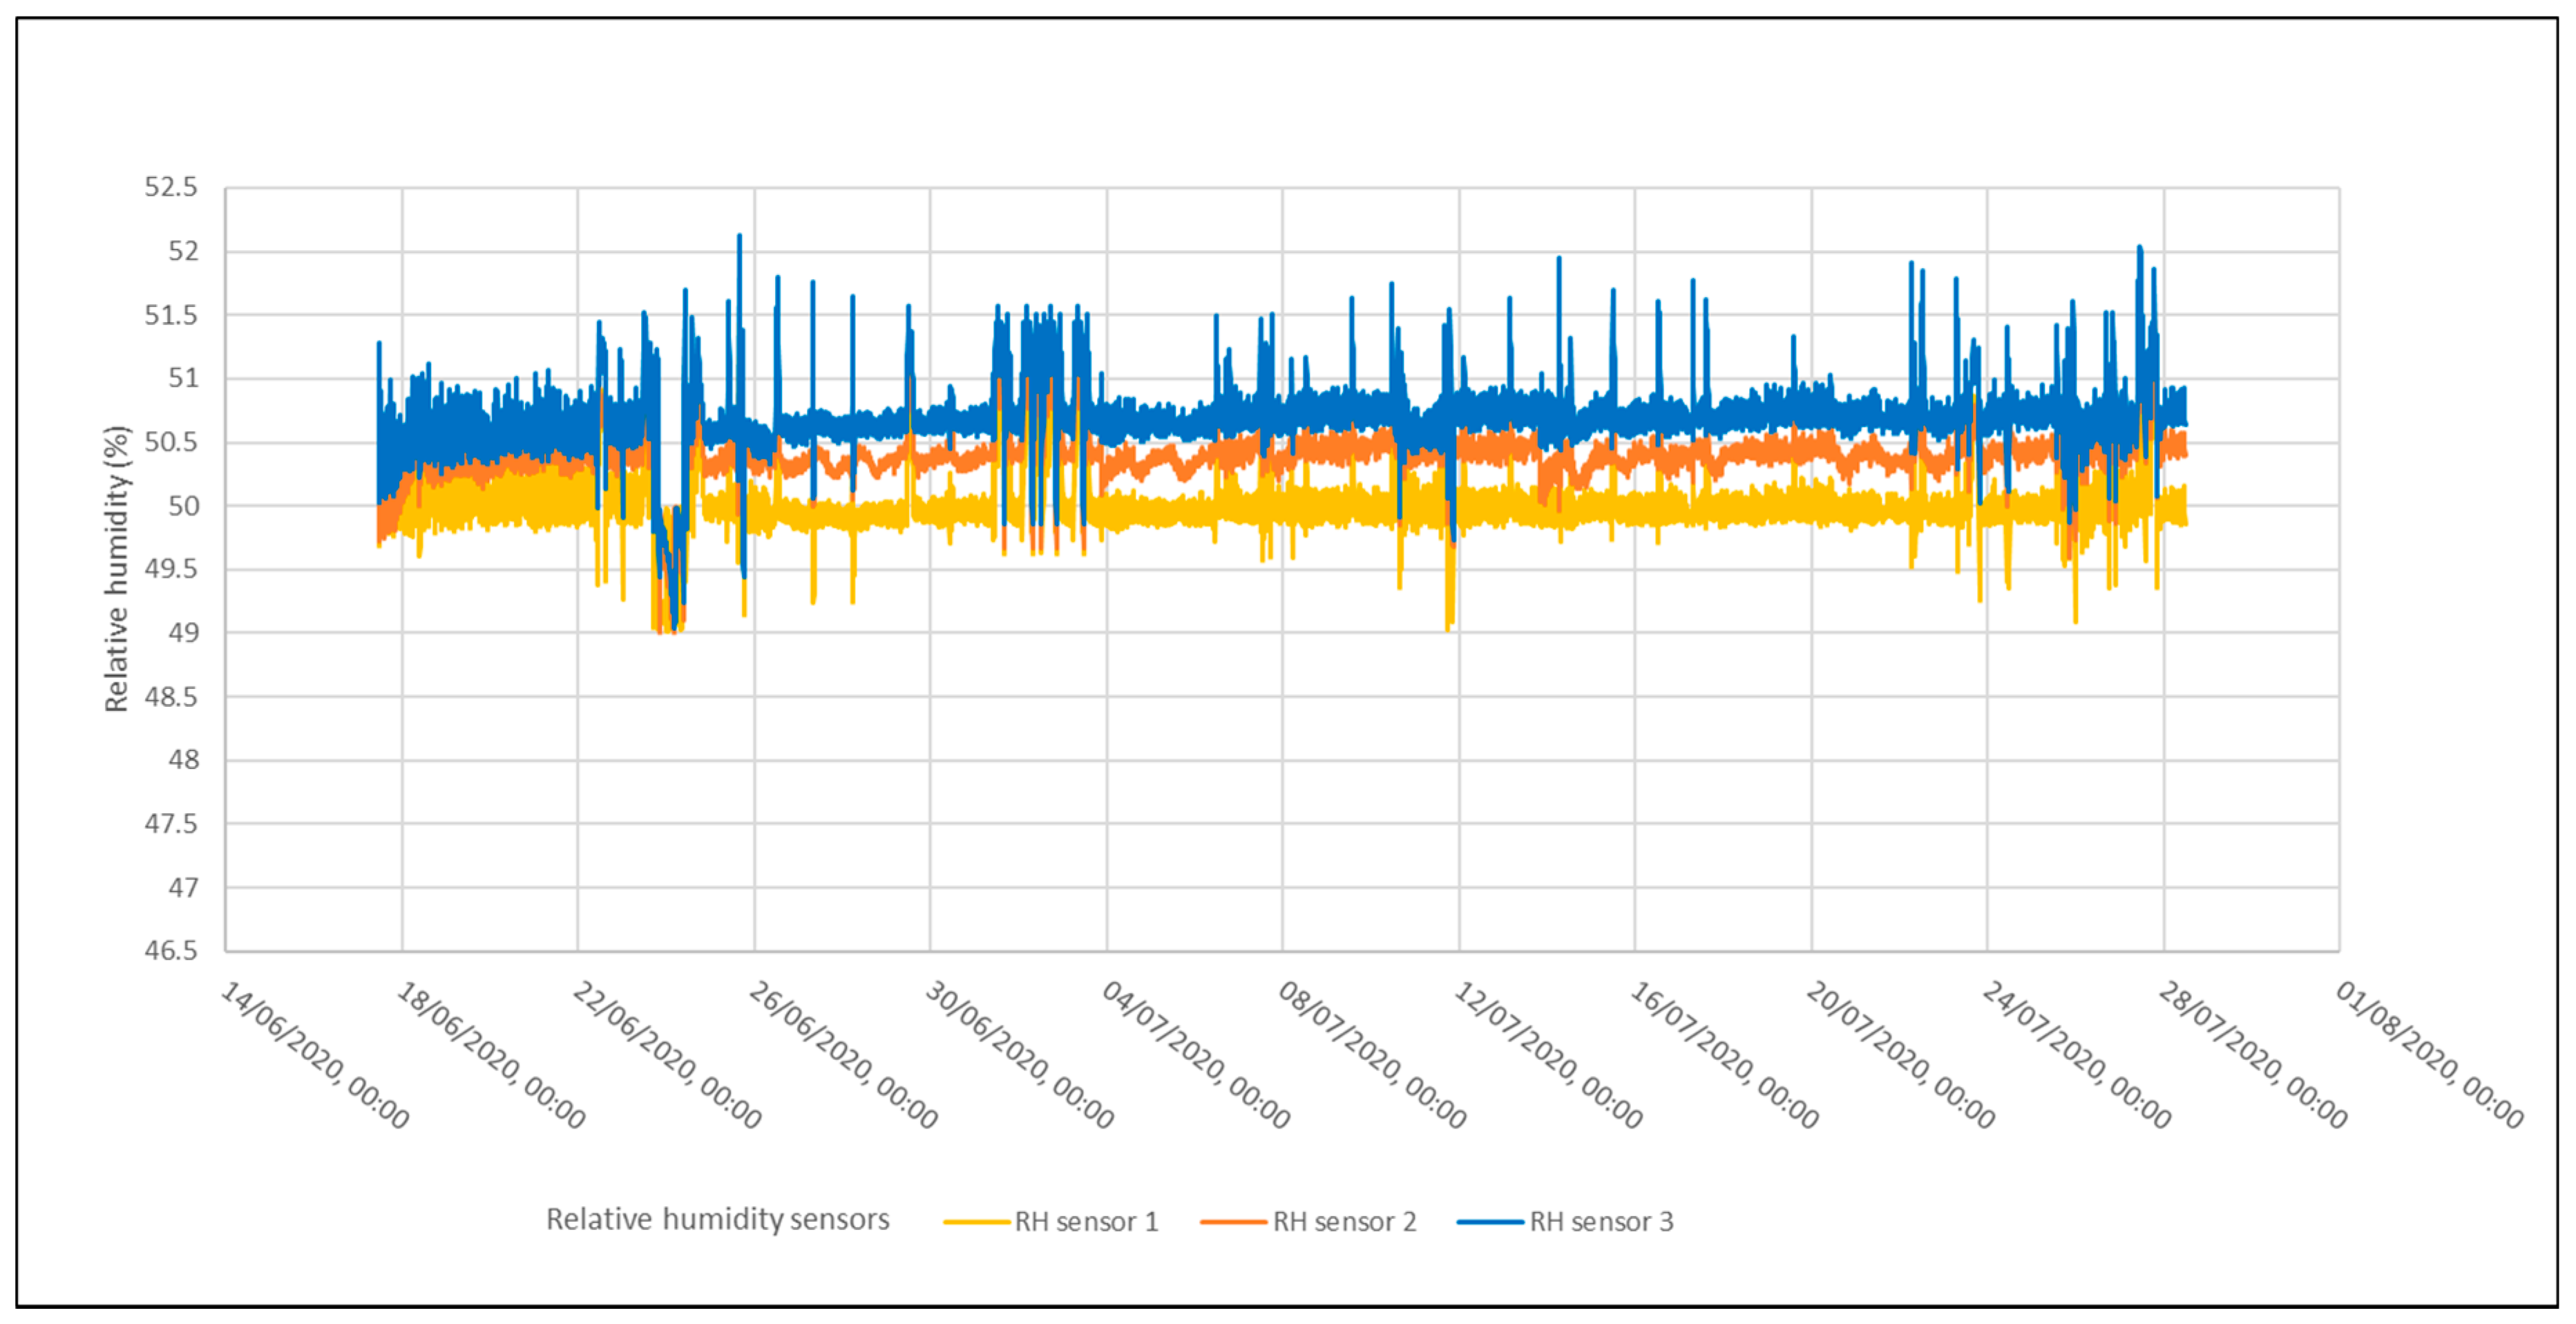
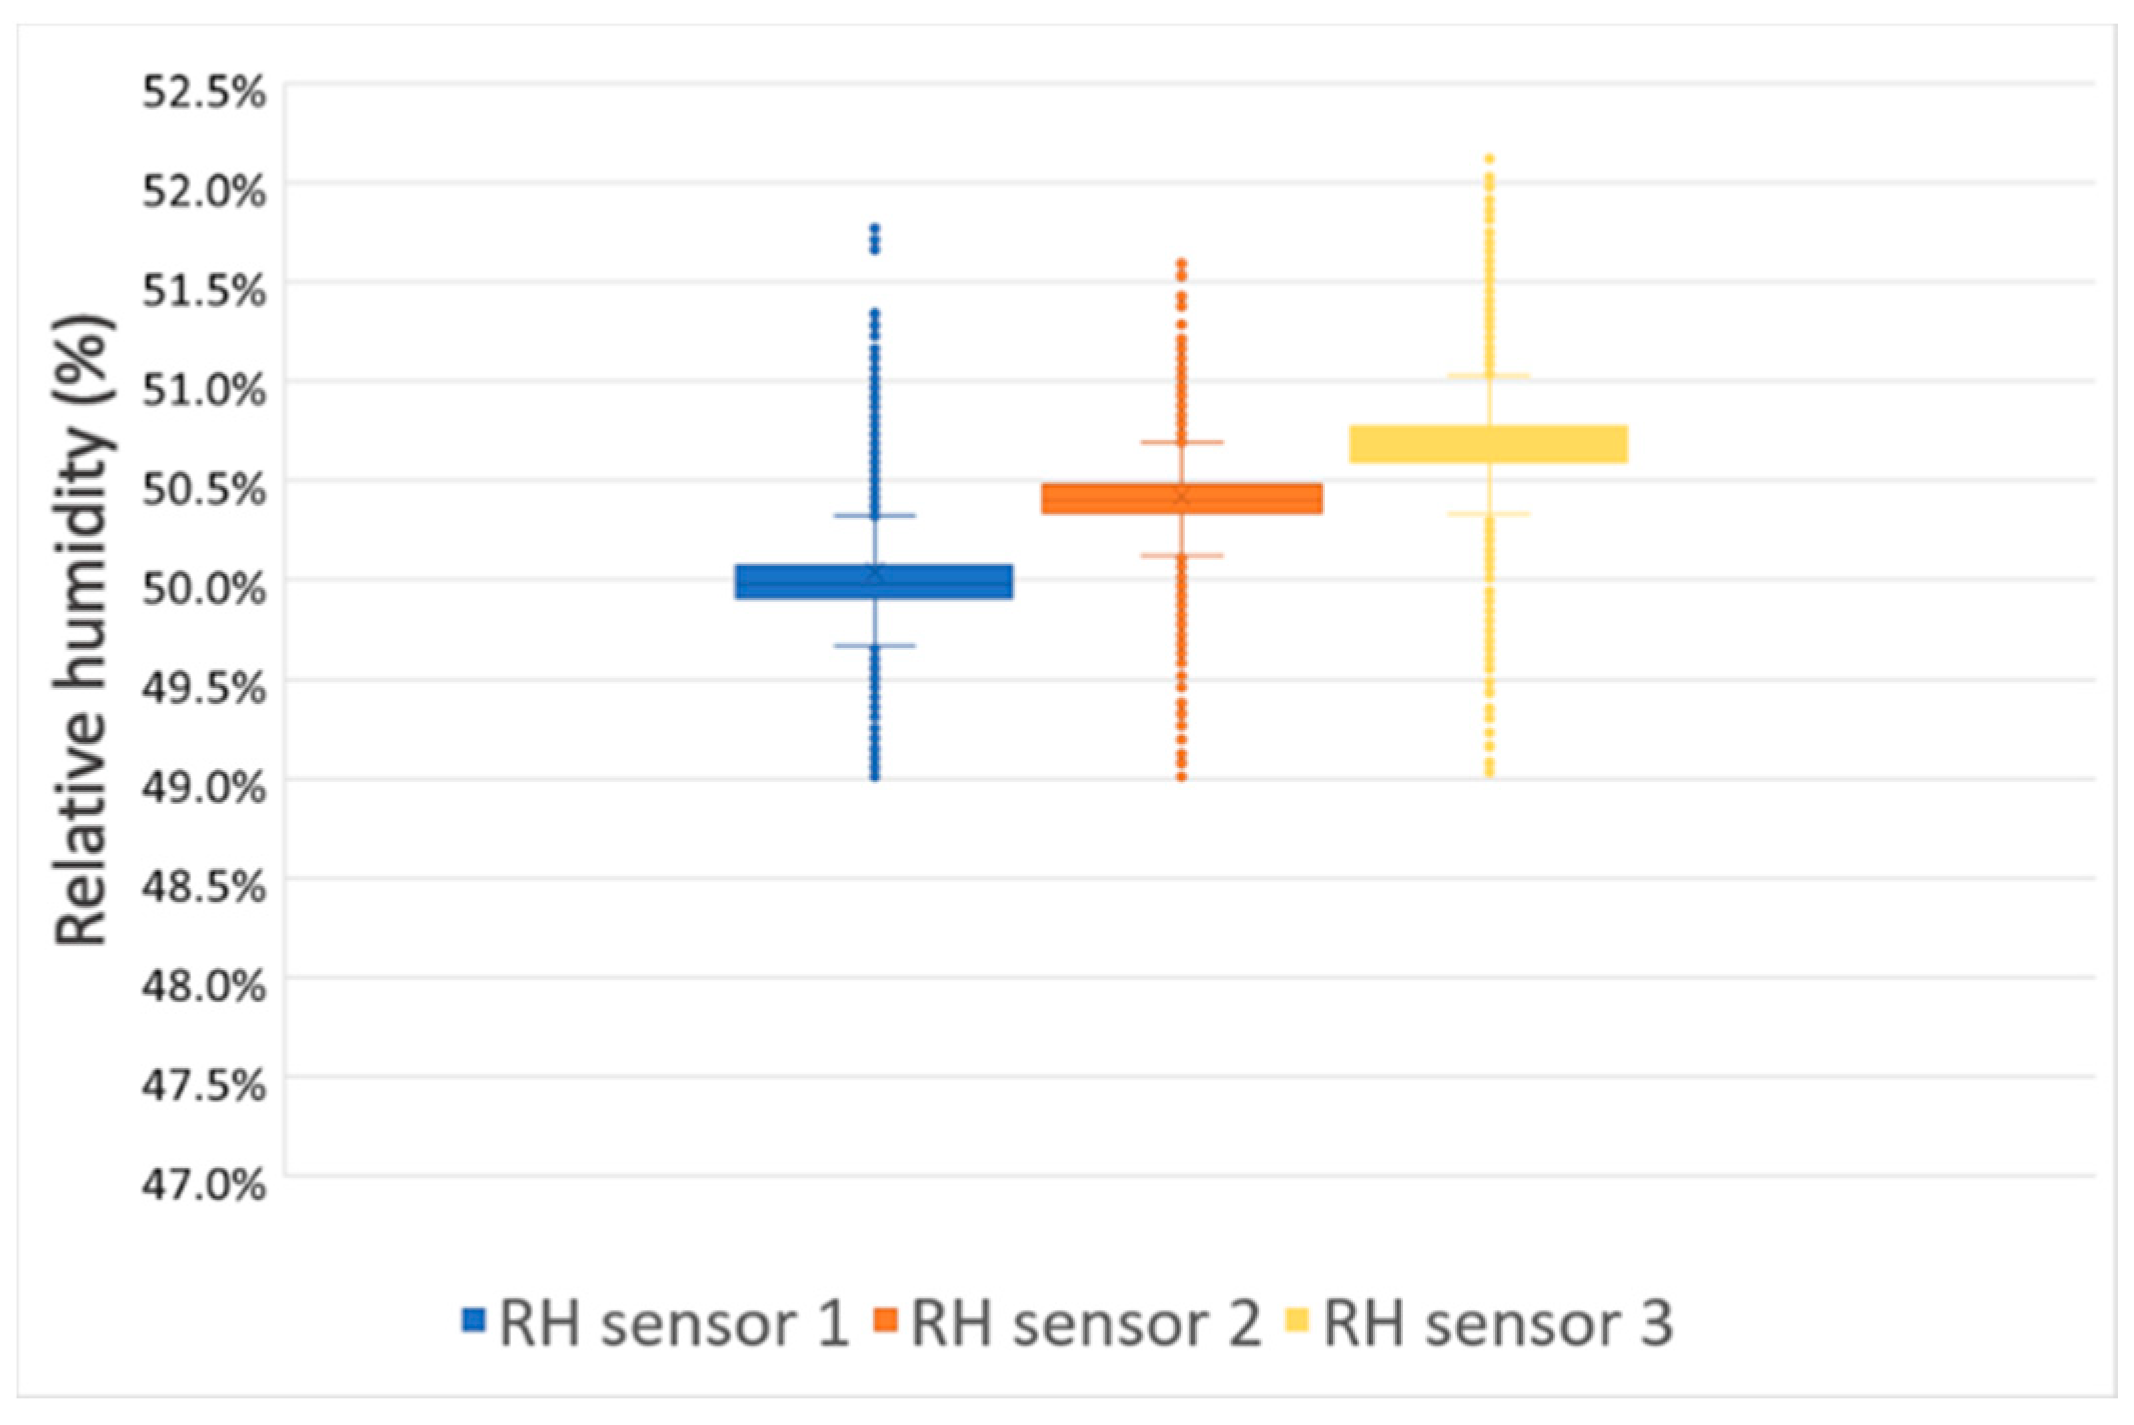
The approach employed included establishing a climatically controlled hygrothermal test room with an automatic integrated system which allows heating, cooling, humidifying, and de-humidifying as required. The data acquisition for this hygrothermal test room operates with the installation of environmental sensors connected to specific and responsive programming codes. The room reported here, has been used to successfully complete wet and dry cup vapor diffusion material testing for relative humidities RH between 50% with ±1%RH deviation and temperatures between 23 °C with ±1 °C fluctuation. The test results indicate that a hygrothermally controlled test room can successfully replace the more expensive climatic chamber.
2. Materials and Methods
To establish a conditioned hygrothermally controlled test room, it was necessary to design and install environmental equipment that controls the interior temperature and relative humidity within the conditioned room. The accurate control of temperature and relative humidity conditions, within the bandwidths prescribed in ISO 12572, is critical to enable gravimetric based testing of building material vapor resistivity properties. For this research, a test building located at the Newnham campus of the University of Tasmania, was reconfigured to enable the conditioned room to be dynamically controlled. The controls included heating, cooling, humidification, and dehumidification. The second stage involved a round-robin testing of the water vapor resistivity properties of a pliable membranes at Fraunhofer Institute of Building Physics laboratory Holzkirchen Germany, and at this hygrothermal testing laboratory. The following sections discuss the design, installation, operation, and the performance of test room, the inter-laboratory testing that was conducted to compare test facilities and results for measuring vapor resistivity properties.
2.1. Design and Description of the Thermal Test Building
The University of Tasmania has three thermal test buildings at the Newnham campus in Launceston. They include an unenclosed-perimeter platform-floored building, an enclosed-perimeter platform-floored building and a concrete slab-on-ground floored building. Previous research had established that the well-insulated concrete slab-on-ground floored test building demonstrated the most stable interior temperatures without any stratification in both conditioned and unconditioned modes of operation. This building has an internal floor area of 30.03 m
2 (5.48 m by 5.48 m), a ceiling height of 2.44 m and total volume of 73.3 m
3 and has no window, as shown in
Figure 4 and
Figure 5. The building, constructed in 2006, applied Australian best practice wall and ceiling insulation and air-tightness methods. The combination of the ground keyed concrete slab, external walls with R2.5 in-frame wall insulation, R4.2 ceiling insulation, and a well-installed air barrier system ensured a high-quality test building with minimal internal temperature variability.
2.2. Cabling and Installation of Integrated Data Acqusition System
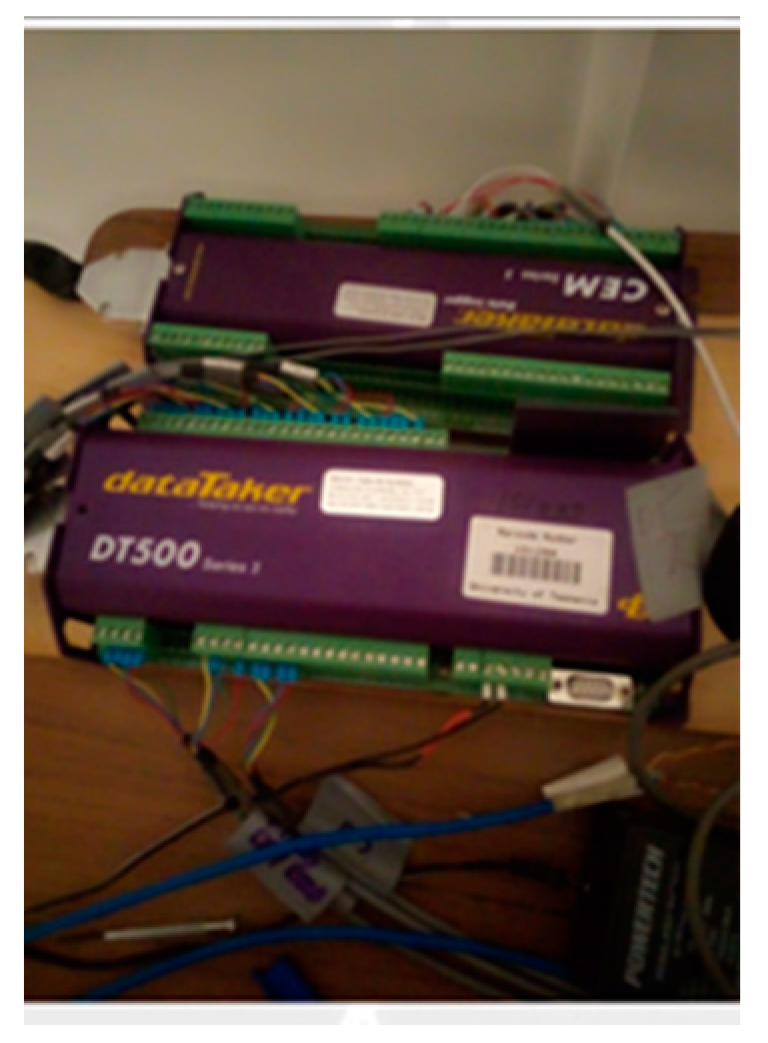
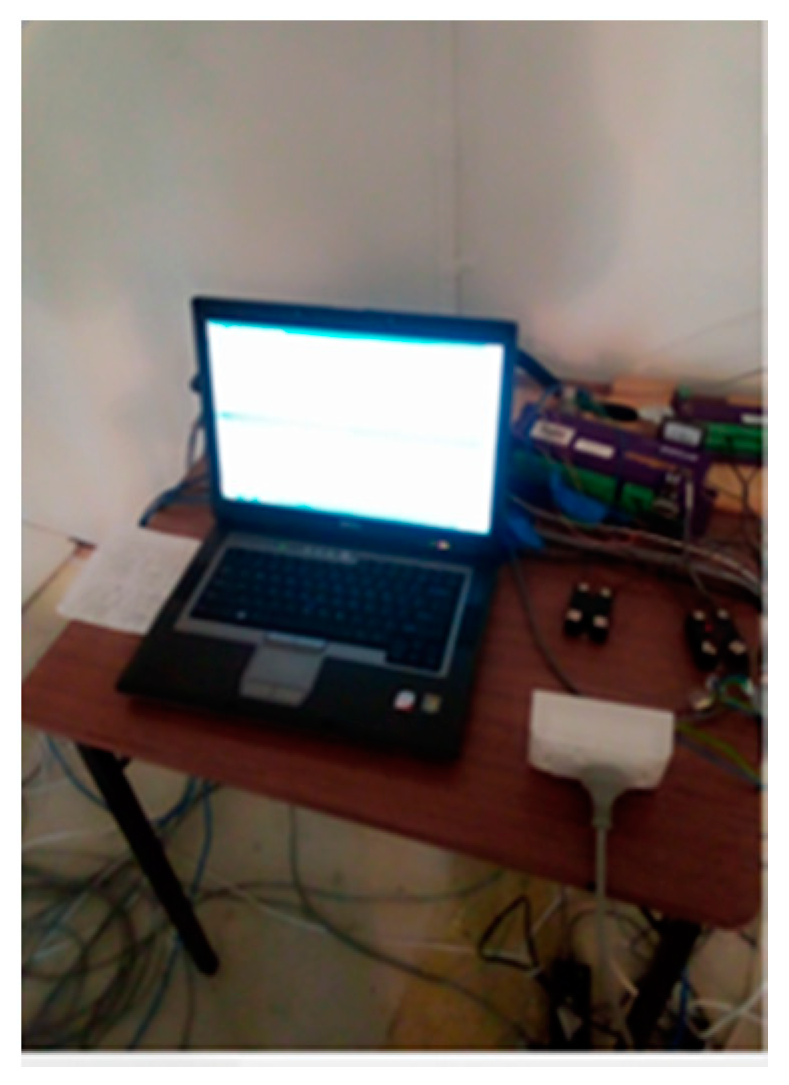
The control of air temperature and relative humidity are critical to the successful operation of a hygrothermally controlled test room. To enable accurate control of the test room interior a data acquisition system was used. Normally, data acquisition requires one or more transducers (sensors) to sense, process, and send signals from a measuring instrument to the system, the data acquired is then stored or logged into the central processing unit of a computer or external memory for later analysis. The data acquisition system generally includes: the sensors; a device that converts the primary signal from the sensors into a compactible form with the information processing systems; a computer by which the overall system is able to be managed and on which data from sensors are stored. For this research, DataTaker DT500 dataloggers with a channel extension module (CEM) (see
Figure 6) were used. Connection between the Datataker and Dell PC was established via a RS232 communication cable (
Figure 7). The De Transfer interface software was used for communication between the DT500 data logger and the Dell PC. Two DT 500 DataTaker data-loggers were used, one for temperature sensors and the second for the relative humidity sensors. An array of four wire PT100 sensors were used to measure temperature. An array of two wire Vaisala HMW40U relative humidity sensors were used to measure relative humidity. Due to the number of terminals required for the array of four wire PT100 sensors, they were connected to both the data-logger and the CEM. The second DT500 DataTaker was used to connect the array of relative humidity sensors used for this project. The primary sensor location was on a pole located in the center of the room (see
Figure 8). The need for at least three sensors in each location was based on previous research, which queried the reliability of single sensors and when two sensors had varied measured values [
41]. The sensors and other apparatus used to control the room are described in
Table 1.
2.3. Cooling and Heating System
Automated heating and cooling were essential for the control of this hygrothermally conditioned test room.
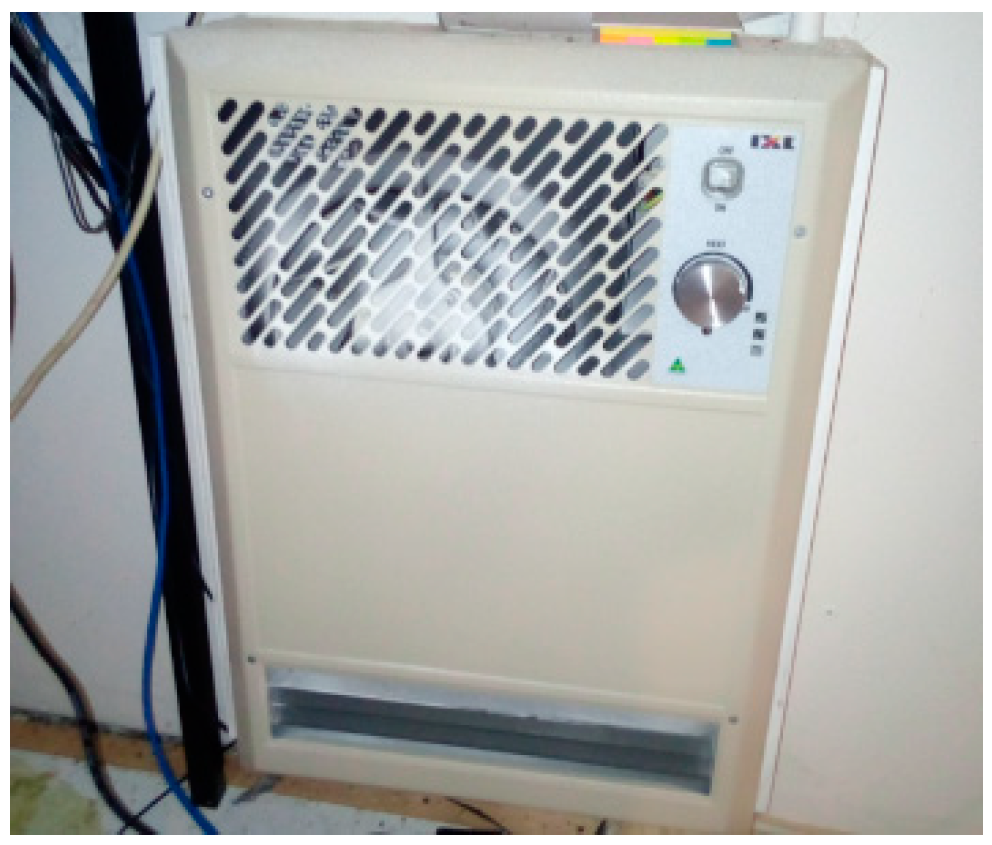
Figure 9 shows the position of the air-conditioner within the test room. This equipment is a reverse-cycle heat pump and can heat up to 30 °C. When heating above 30 °C was required for the room, the wall mounted electric heater shown in
Figure 10 was turned on. Silicone DC relays (
Figure 11) was used as the power switching interface between the data-logger and the appliances.
2.4. Humidity and Pressure Control System
The capability to control humidity was essential for this hygrothermally controlled room. For this research, this was achieved through the installation of humidity equipment which enabled water vapor to either be added or removed as required. The power switching for the humidity equipment utilized two solid-state relays shown in
Figure 12. The first method to add water vapor to the air was to use a fishpond with a water heater. However, after preliminary testing and discussions with other research collaborators, it was established that there would be a significant water vapor lag with this method. This led to an analysis of quick response humidifiers. This resulted in the selection of a 6 L Ultrasonic Cool Mist Steam Nebulizer Diffuser Purifier (shown in
Figure 13). This humidifier quickly demonstrated a very fast response to add extra water vapor to the room. Similarly, a Breville Smart dry de-humidifier (
Figure 14), was installed to remove excessive water vapor from the room. The power supply for the humidifier and dehumidifier was controlled by a solid-state relay, which in turn was controlled by the DT500 data-logger. In practical terms, when the relative humidity in the room was too high the programmed data logger alarm switched the relay, thus providing power to the dehumidifier. When the desired relative humidity value was achieved, the programmed data logger alarm switched the relay off. Conversely, when the relative humidity was too low, the data logger alarm switched the relay to provide power to the humidifier, thus adding water vapor into the room until the required relative humidity setpoint was reached.
Additionally, a household fan was installed to provide circulation of the air in the room to minimize water vapor stratification.
2.5. Calibration of the Environmental Instruments
Calibration of the temperature and relative humidity sensors was completed to avoid intrinsic error that may have existed in the devices or data logging equipment. In the first instance, all sensors were carefully chosen for their level of accuracy and long-term reliability. A diagnostic procedure was established to ensure that wiring from the data logger to each sensor did not cause errors in measurements. The on-site calibration utilized pre-calibrated NATA certified temperature and relative humidity sensors provided by Industrial Technik. The calibration of the temperature sensors included zero degrees, room temperature and near boiling temperature. This was to ensure that there were no linear or non-linear errors. Any sensor that had erroneous outputs was replaced. The output from the relative humidity sensors was compared to a certified and pre-calibrated sensor, whilst the relative humidity was increased and decreased
2.6. Monitoring and Controlling Environmental Conditions
As previously mentioned, the DataTaker DT500 data logger was used for data acquisition. This system relied on programming code for data acquisition from the sensors and to control the switching relays for the heating, cooling, humidifying, and de-humidifying appliances. The acquisition systems collected temperature and relative humidity data from the sensors and simultaneously stored the data in the memory of Datataker for later use.
Figure 15 shows a snapshot of an example of the programming code use to operate and collect temperature data from the PT100 sensors. This code was written according to the sensor type. Similarly, the programming code for acquiring the relative humidity data within the hygrothermal room is shown in
Figure 16. In this research, temperature and relative humidity data was collected every 10 min. The examples of the programing code also show alarm codes. The coding shows minimum and maximum values for temperature and relative humidity. The alarms required the data logger to continuously monitor the relative humidity and temperature conditions in the test room. The alarm-controlled power supply to the digital switches on the data loggers. In turn, the digital switches controlled the power supply to the silicone and solid-state relays, which controlled the appliances. The combination of continuous measurement and the control of the four appliances, enabled the room temperature and relative humidity to be adequately controlled by the heating, cooling, humidifying, and dehumidifying appliances.
2.7. Inter-Laboratory Testing of Wet-Cup and Dry-Cup Dishes
The procedure for the interlaboratory testing involved the selection of a pliable membrane classified as permeable material in clause AS 4200:1 and carrying out a standard test as referred to in ISO 12572. The independent testing of water vapor resistivity properties was completed on a pliable membrane commonly used in Australian external envelope construction systems. The same material was tested under the same climatic condition of 23 °C/50%RH at both the hygrothermal laboratory at Fraunhofer IBP Germany, and UTAS, Australia.
Table 2 shows the comparison of the important testing parameters that were used.
It was necessary to employ very similar round glass dishes with diameter of 200 mm. While the depth of the dishes at IBP is 80 mm, at UTAS, the dept is 60 mm. For accuracy, three dishes were used for wet-cup and another three were used for dry-cup gravimetric measurement both in Germany and in Australia. To achieve the desired humidity testing condition within wet-cup dishes, ammonium dihydrogen phosphate solution was placed in the dish, by both laboratories during the testing. This achieved a dish relative humidity of 93% (
Figure 17). Similarly, to achieve the desired testing humidity condition within the dry-cup test dishes, silica gel beads were used at both laboratories, as shown in
Figure 18. This achieved relative humidity of 3% within the dishes. Both laboratories employed a 20 mm air space between the top surface of the substrates and the bottom surface of the test specimen. The pliable membrane specimens were then glued to the top edge of the dishes. To avoid water vapor leakages between the dishes and test specimens, the edges between the materials were taped and sealed with molten paraffin wax at 100 °C. The dishes were then placed on shelving within these test rooms, as shown in
Figure 19 and
Figure 20.
Regular weighing measurements of the test dishes were taken every two hours until equilibrium was achieved. The measurements were in milligrams and all weighing data were recorded. The calculations of the water vapor resistivity properties were obtained mathematically (see
Table 3 and
Table 4). Microsoft Excel 365 was used to complete a statistical analysis of variance to establish if there was any significant difference between the result obtained from the laboratory at Fraunhofer IBP and UTAS.


