Impact of the Degree Days of the Heating Period on Economically and Ecologically Optimal Thermal Insulation Thickness
Abstract
1. Introduction
- at least 40% reduction in greenhouse gas emissions (compared to 1990),
- acquiring at least 27 percent of energy from renewable sources,
- at least 27% increase in energy efficiency.
2. Methods of Determining the Optimal Thickness of Thermal Insulation
2.1. Economic Analysis
- Km—cost of 1 m3 of thermal insulation material [PLN/m3],
- Kw—costs of performing thermal insulation of 1 m2 building wall surface [PLN/m2],
- d—thickness of the thermal insulation layer [m],—cumulative discount factor,
- N—number of years of thermal insulation use,
- r—real annual interest rate,
- s—real annual growth (in percentage) of heating costs,
- Kc—cost of generating heat for a given heat source and fuel [PLN/Wh],
- c—24 [h/day],
- DD—number of degree days of heating period [K·day/year],
- λ—thermal conductivity of the thermal insulation material [W/mK],
- U0—heat transfer coefficient of the wall without thermal insulation layer [W/m2K].
2.2. Ecological Analysis
- Kl—LCA analysis result for 1 m3 of thermal insulation material [Pt/m3],
- Ke—LCA analysis result of obtaining 1 Wh of thermal energy for a given heat source [Pt/Wh],
- other—as defined earlier.
2.3. Use of LCA for Ecological Assessment
3. Performed Analyses
3.1. Description of the Analysed Residential Building
3.2. Data Accepted for Analysis
3.3. The Results of the Economic Analysis
3.4. The Results of the Ecological Analysis
4. Discussion
5. Conclusions
Author Contributions
Funding
Institutional Review Board Statement
Informed Consent Statement
Data Availability Statement
Conflicts of Interest
References
- Syngros, G.; Balaras, C.B.; Koubogiannis, D.G. Embodied CO2 Emissions in Building Construction Materials of Hellenic Dwellings. International Conference on Sustainable Synergies from Buildings to the Urban Scale, SBE16. Procedia Environ. Sci. 2017, 38, 500–508. [Google Scholar] [CrossRef]
- Hong, J.; Shen, G.Q.; Feng, Y.; Lau, W.S.; Mao, C. Greenhouse gas emission during the construction phase of a building: A case study in China. J. Clean. Prod. 2015, 103, 249–259. [Google Scholar] [CrossRef]
- Energy in Figures. Statistical Pocketbook 2016 Edition; European Commission: Brussels, Belgium, 2016. [Google Scholar]
- OECD/IEA. Transition to Sustainable Buildings, Strategies and Opportunities to 2050. Int. Energy Agency. 2013. Available online: https://www.oecd-ilibrary.org/energy/transition-to-sustainable-buildings_9789264202955-en (accessed on 5 June 2020).
- European Council. European Council (23 and 24 October 2014)—Conclusions; EUCO: Brussels, Belgium, 2014. [Google Scholar]
- European Wind Energy Association. EU Energy Policy to 2050. Achieving 80–95% Emissions Reductions; EWEA: Brussels, Belgium, 2011. [Google Scholar]
- Eurostat. 2020. Available online: http://appsso.eurostat.ec.europa.eu/nui/show.do?dataset=nrg_chdd_a&lang=en (accessed on 5 June 2020).
- Hasan, A. Optimizing insulation thickness for buildings using life cycle cost. Appl. Energy. 1999, 63, 115–124. [Google Scholar] [CrossRef]
- Kaynakli, O. A review of the economical and optimum thermal insulation thickness for building applications. Renew. Sustain. Energy Rev. 2012, 16, 415–425. [Google Scholar] [CrossRef]
- Ozel, M. Cost analysis for optimum thicknesses and environmental impacts of different insulation materials. Energy Build. 2012, 49, 552–559. [Google Scholar] [CrossRef]
- Dylewski, R.; Adamczyk, J. Economic and environmental benefits of thermal insulation of building external walls. Build. Environ. 2011, 46, 2615–2623. [Google Scholar] [CrossRef]
- Dylewski, R. Optimal Thermal Insulation Thicknesses of External Walls Based on Economic and Ecological Heating Cost. Energies 2019, 12, 3415. [Google Scholar] [CrossRef]
- Duman, Ö.; Koca, A.; Acet, R.C.; Çetin, M.G.; Gemici, Z. A study on optimum insulation thickness in walls and energy savings based on degree day approach for three different demo sites in Europe. In Proceedings of the International Conference CISBAT 2015 Future Buildings and Districts Sustainability from Nano to Urban Scale, Lausanne, Switzerland, 9–11 September 2015. [Google Scholar]
- Dylewski, R.; Adamczyk, J. Optimum Thickness of the Thermal Insulation Layer from the Economic and Ecological Perspective. In Proceedings of the 4th International Conference On Building Energy, Environment, Melbourne, Australia, 5–9 February 2018. [Google Scholar]
- ISO 14040 Environmental Management-Life Cycle Assessment-Principles and Framework; European Committee for Standardisation: Brussels, Belgium, 2006.
- ISO 14044 Environmental Management-Life Cycle Assessment-Requirements and Guidelines; European Committee for Standardisation: Brussels, Belgium, 2006.
- Volkart, K.; Bauer, C.; Boulet, C. Life cycle assessment of carbon capture and storagein power generation and industry in Europe. Int. J. Greenh. Gas Control 2013, 16, 91–106. [Google Scholar] [CrossRef]
- Singh, B.; Strømman, A.H.; Hertwich, E.G. Life cycle assessment of natural gas combined cycle power plant with post-combustion carbon capture, transport and storage. Int. J. Greenh. Gas Control 2011, 5, 457–466. [Google Scholar] [CrossRef]
- Singh, B.; Strømman, A.H.; Hertwich, E.G. Comparative life cycle environmental assessment of CCS technologies. Int. J. Greenh. Gas Control 2011, 5, 911–921. [Google Scholar] [CrossRef]
- Sternberg, A.; Bardow, A. Power-to-what?–environmental assessment of energy storage systems. Energy Environ. Sci 2015, 8, 389–400. [Google Scholar] [CrossRef]
- Dekker, E.; Zijp, M.C.; van de Kamp, M.E.; Temme, E.H.M.; van Zelm, R. A taste of the new ReCiPe for life cycle assessment: Consequences of the updated impact assessment method on food product LCAs. Int. J. Life Cycle Assess. 2019. [Google Scholar] [CrossRef]
- Stavropoulosa, P.; Giannoulisa, C.; Papacharalampopoulosa, A.; Foteinopoulosa, P.; Chryssolouris, G. Life cycle analysis: Comparison between different methods and optimization challenges. Procedia CIRP 2016, 41, 626–631. [Google Scholar] [CrossRef]
- GUS. Budownictwo w 2019 roku. Available online: https://stat.gov.pl/obszary-tematyczne/przemysl-budownictwo-srodki-trwale/budownictwo/budownictwo-w-2019-roku,13,5.html (accessed on 16 December 2020). (In Polish)
- Egospodarka.pl. 2020. Available online: http://www.nieruchomosci.egospodarka.pl/art/galeria/55914,Kolektor-sloneczny-na-dachu-budynku,2,79,1.html (accessed on 5 June 2020).
- Adamczyk, J.; Dylewski, R. Changes in heat transfer coefficients in Poland and their impact on energy demand—An environmental and economic assessment. Renew. Sustain. Energy Rev. 2017, 78, 530–538. [Google Scholar] [CrossRef]
- Dzikuć, M.; Kułyk, P.; Dzikuć, M.; Urban, S.; Piwowar, A. Outline of Ecological and Economic Problems Associated with the Low Emission Reductions in the Lubuskie Voivodeship (Poland). Pol. J. Environ. Stud. 2019, 28, 65–72. [Google Scholar] [CrossRef]


| Year | 2008 | 2009 | 2010 | 2011 | 2012 | 2013 | 2014 | 2015 | 2016 | 2017 | 2018 |
|---|---|---|---|---|---|---|---|---|---|---|---|
| Degree days | 3176 | 3449 | 3920 | 3315 | 3550 | 3504 | 3094 | 3113 | 3286 | 3290 | 3125 |
| Construction Material | Cellular Concrete 400 (P1) | Lime and Sand BlocksSILKA E (P2) | Ceramic Hollow Blocks Max (P3) |
| Thickness of walls [m] | 0.36 | 0.24 | 0.29 |
| Thermal conductivity λ [W/mK] | 0.11 | 0.55 | 0.19 |
| Heat transfer coefficient Uo [W/m2K] | 0.29 | 1.65 | 0.59 |
| Thermal Insulation Material | Mineral Wool (I1) | Polystyrene EPS (I2) | Polystyrene XPS (I3) |
| Thermal conductivity λ [W/mK] | 0.039 | 0.040 | 0.032 |
| Km [PLN/m3] | 226.60 | 143.00 | 502.00 |
| Kw [PLN/m2] | 40.00 | 35.00 | 35.00 |
| Heat Source | Coal Boiler (S1) | Condensing Gas Boiler (S2) | Electricity Boiler (S3) |
| Efficiency | 82% | 94% | 99% |
| Kc [PLN/kWh] | 0.144 | 0.245 | 0.556 |
| Thermal Insulation Material | I1 | I2 | I3 |
| Kl [Pt/m3] | 19.10 | 6.77 | 31.90 |
| Heat Source | S1 | S2 | S3 |
| Ke [Pt/kWh] | 0.124 | 0.027 | 0.107 |
| Degree Days DD [K·day/year] | |
|---|---|
| Poland | 3 387 |
| Region | |
| Zachodniopomorskie (zone I) | 3 272 |
| Lubuskie (zone II) | 3 075 |
| Mazowieckie (zone III) | 3 448 |
| Podlaskie (zone IV) | 3 734 |
| Region\Heat Source | S1 | S2 | S3 |
|---|---|---|---|
| Poland | 11.705 | 19.916 | 45.196 |
| I | 11.308 | 19.239 | 43.662 |
| II | 10.627 | 18.081 | 41.033 |
| III | 11.916 | 20.274 | 46.010 |
| IV | 12.905 | 21.956 | 49.826 |
| Constr. Material | Region | Heat Source—Thermal Insulation Material | ||||||||
|---|---|---|---|---|---|---|---|---|---|---|
| S1-I1 | S1-I2 | S1-I3 | S2-I1 | S2-I2 | S2-I3 | S3-I1 | S3-I2 | S3-I3 | ||
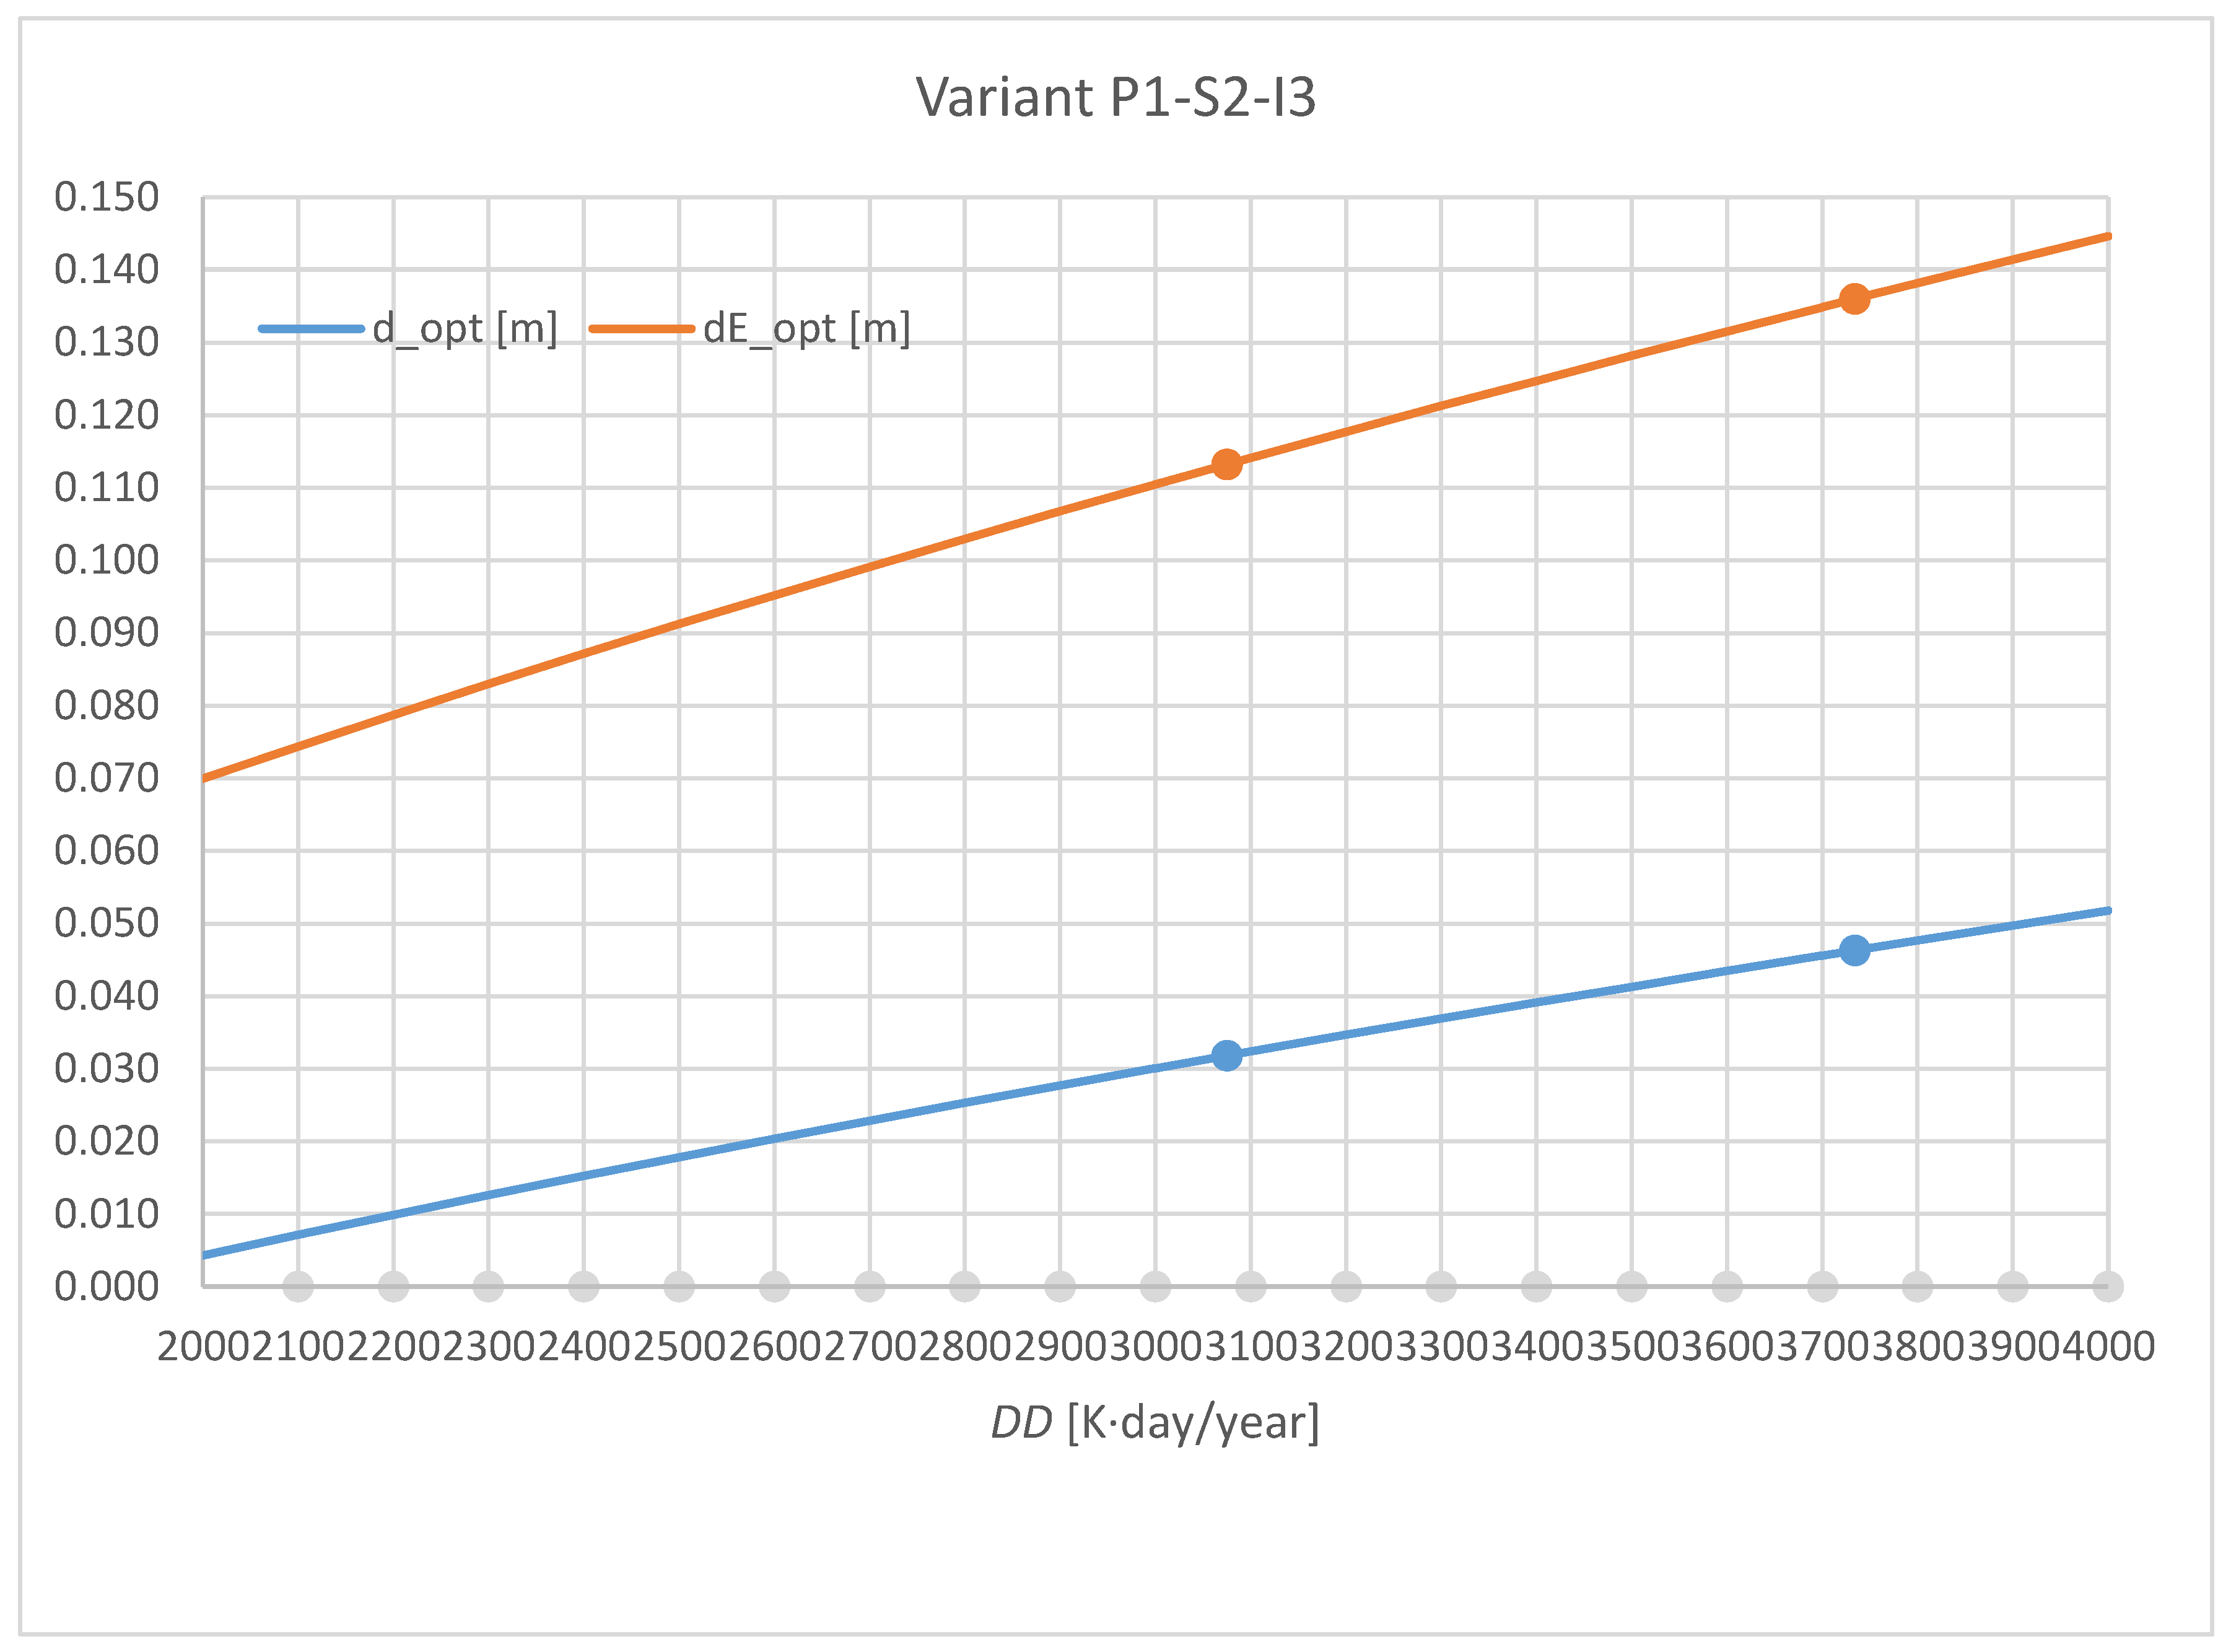
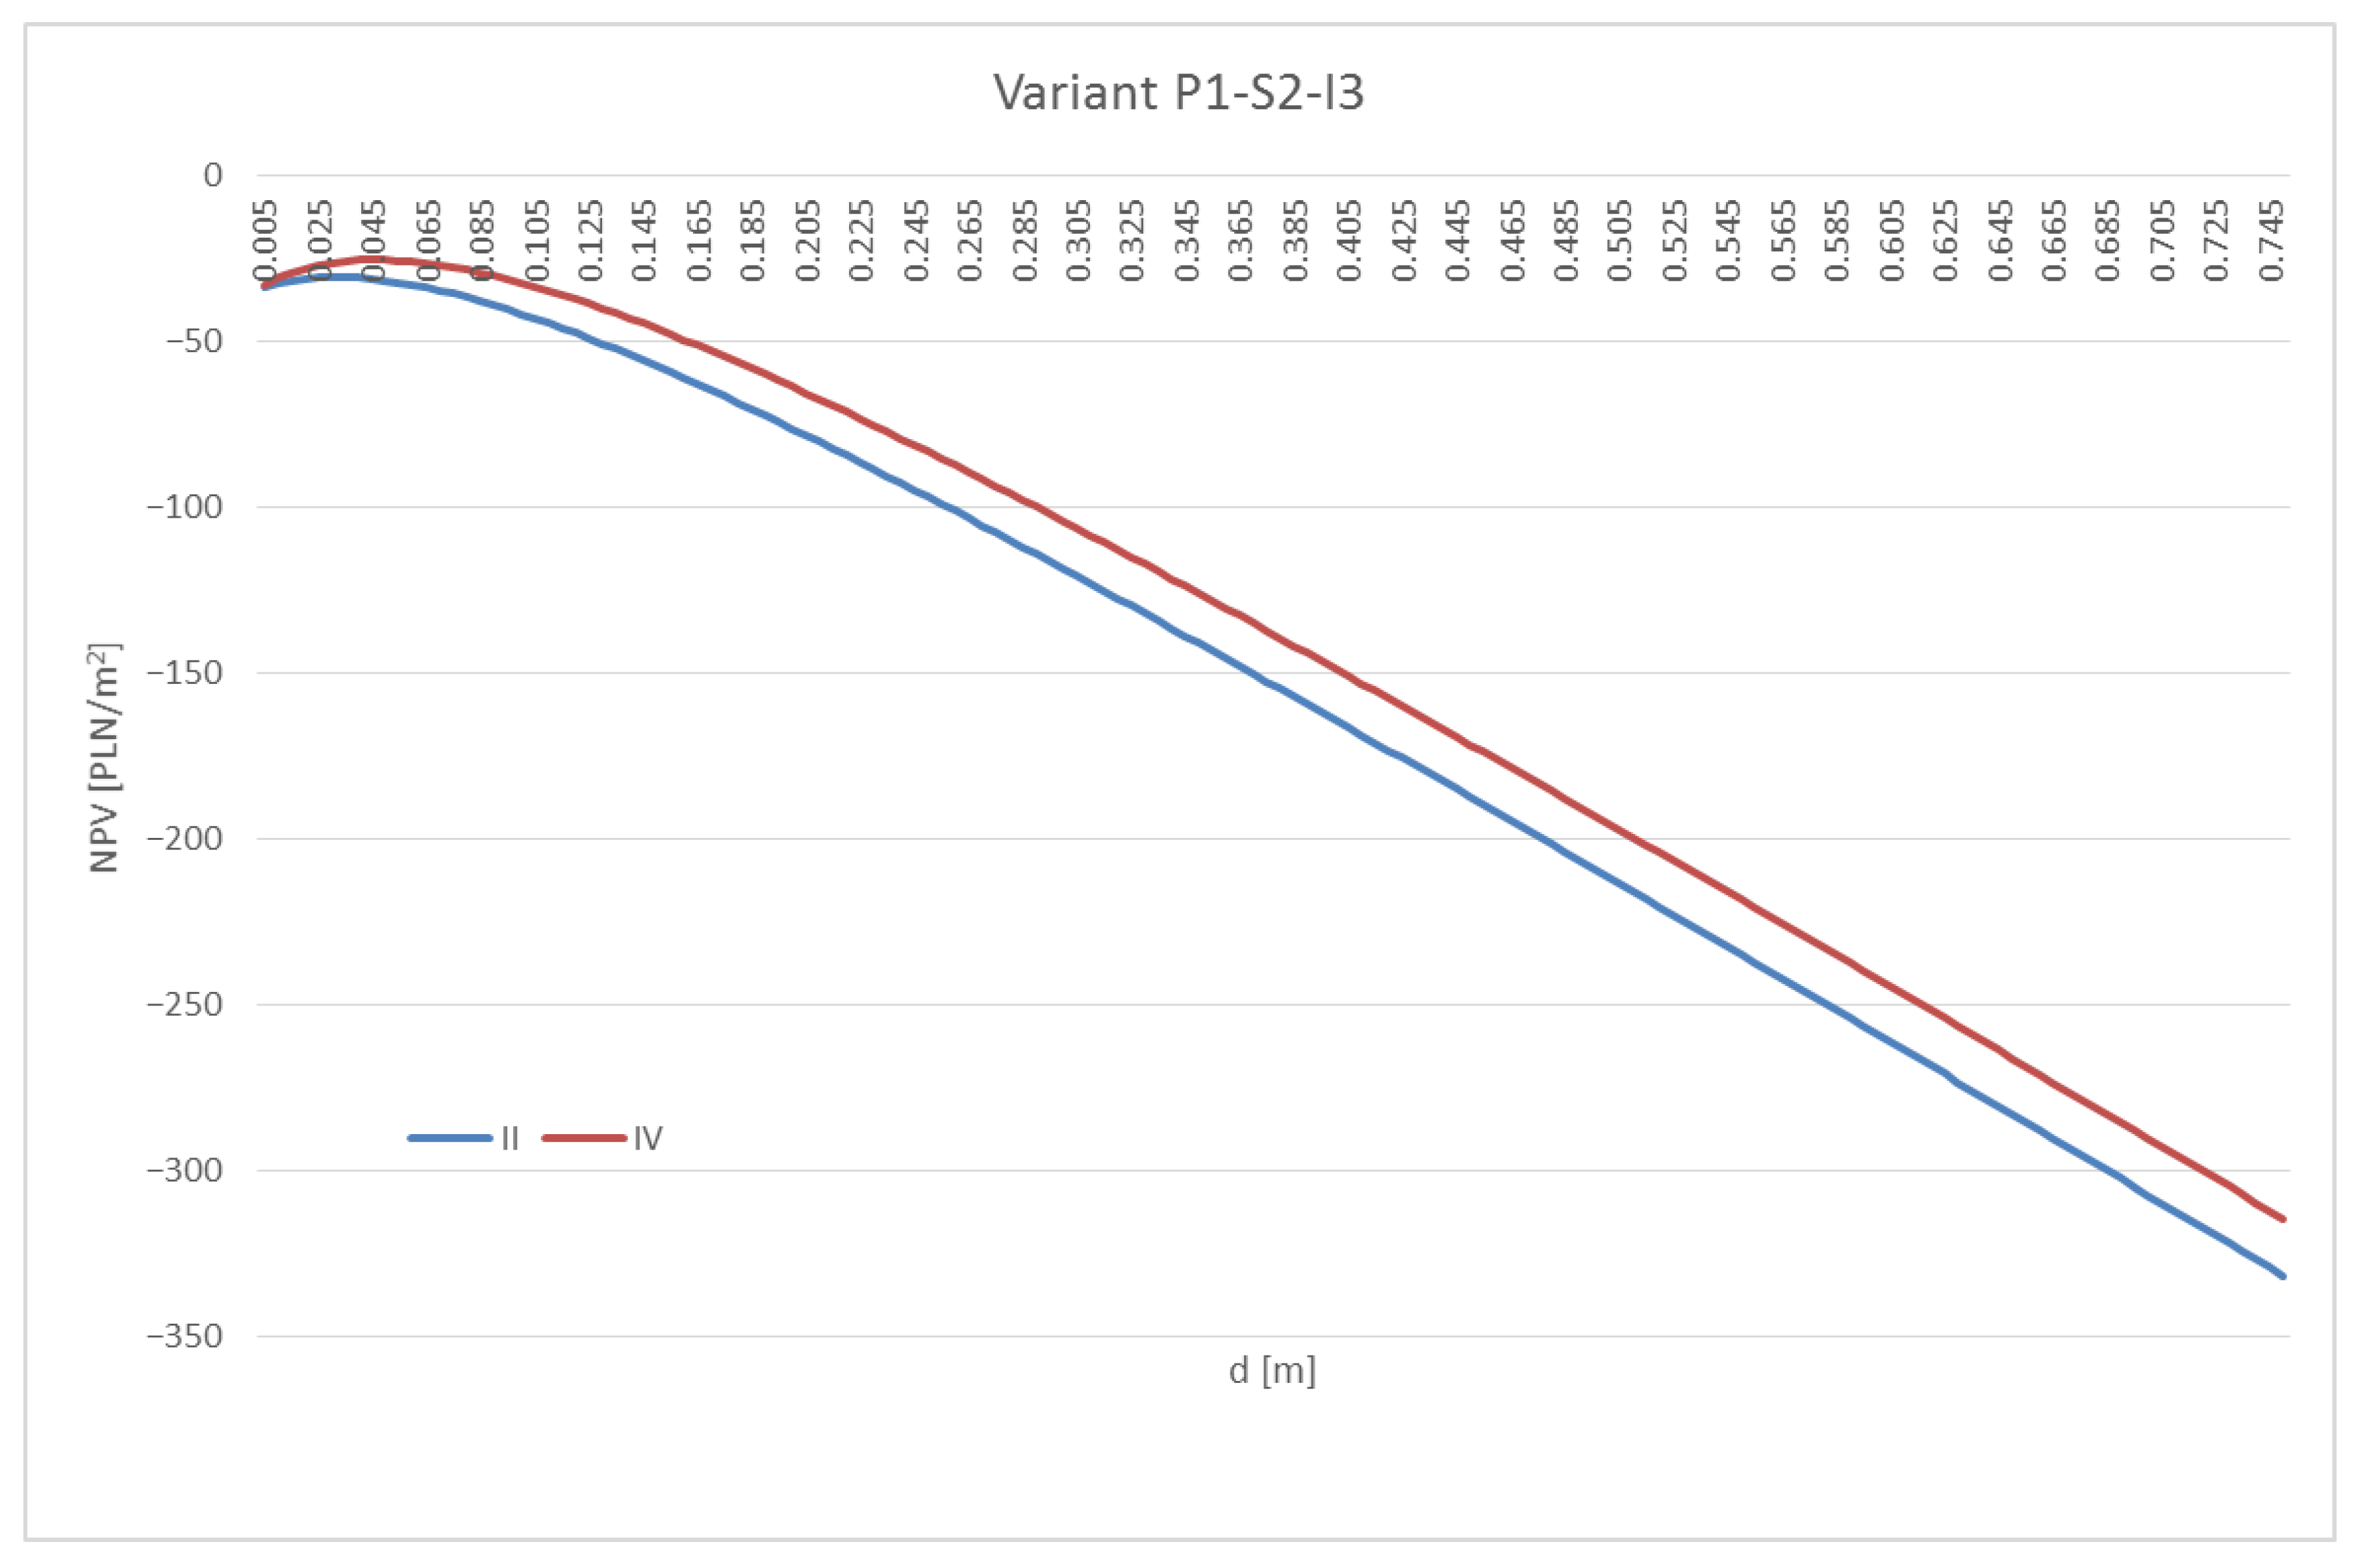
| P1 | II | 0.045 | 0.090 | 0.000 | 0.099 | 0.160 | 0.032 | 0.217 | 0.311 | 0.104 |
| Pol. | 0.053 | 0.102 | 0.004 | 0.111 | 0.175 | 0.039 | 0.235 | 0.333 | 0.114 | |
| IV | 0.063 | 0.114 | 0.010 | 0.123 | 0.190 | 0.046 | 0.253 | 0.356 | 0.126 | |
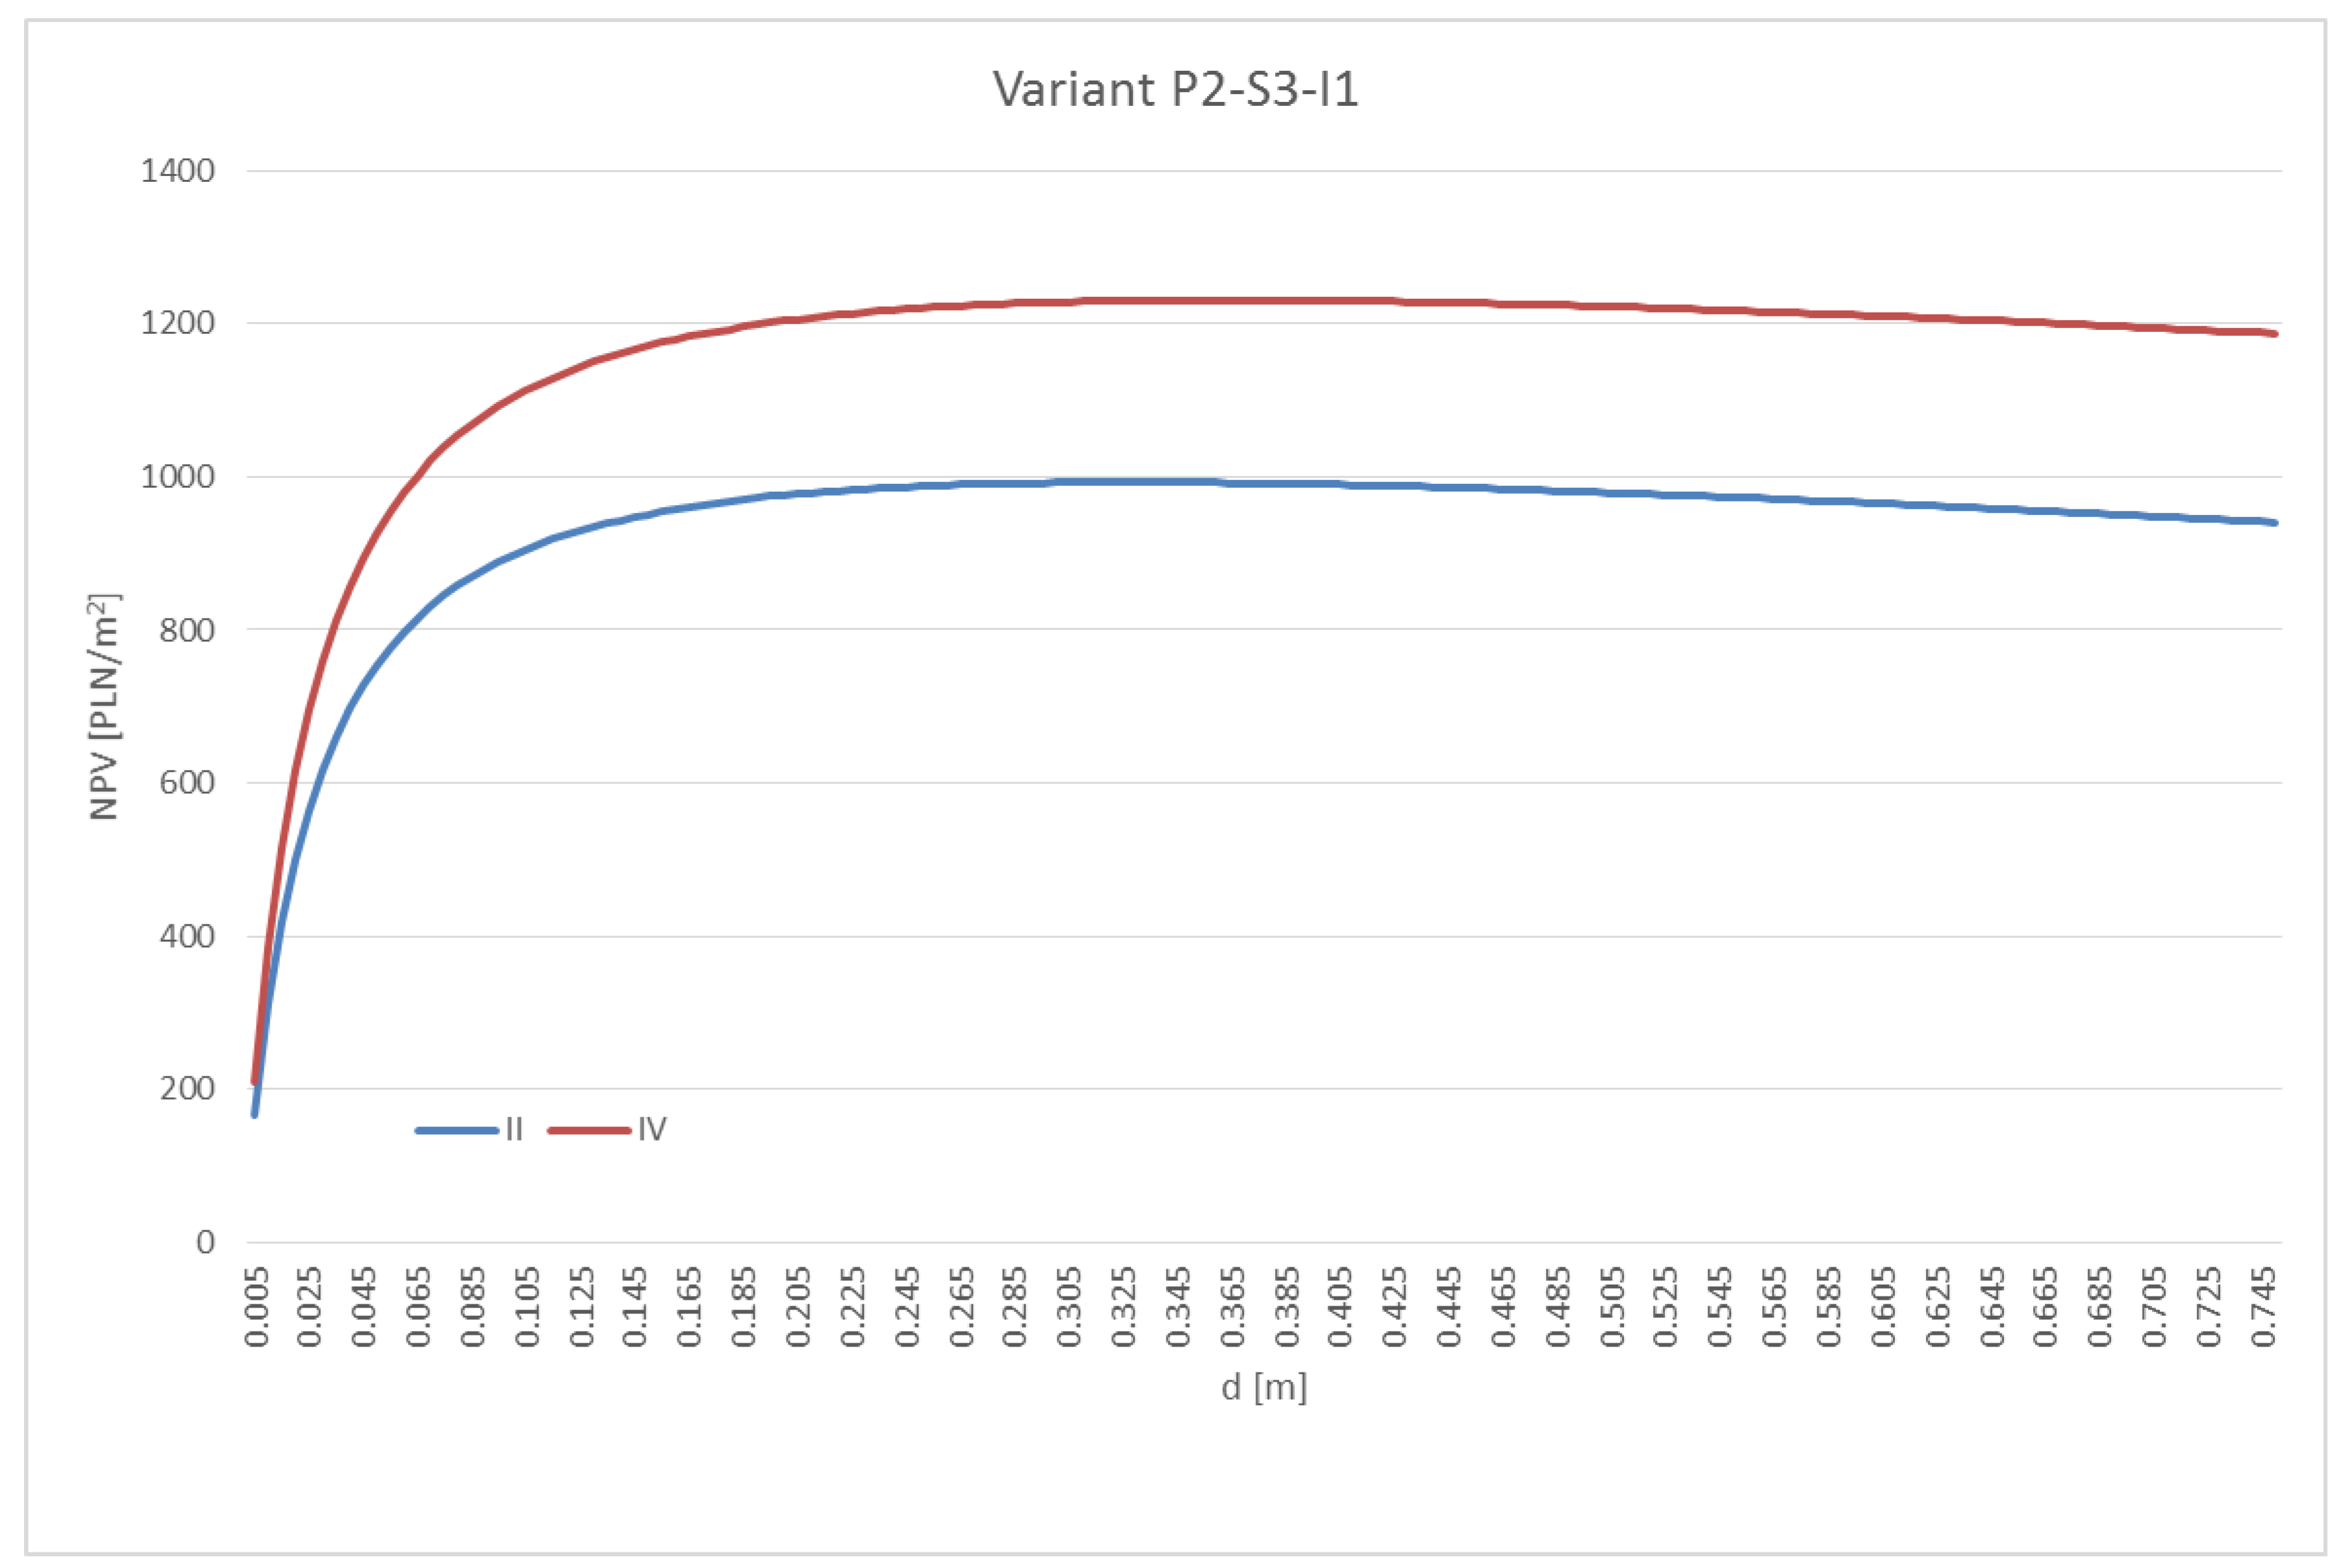
| P2 | II | 0.155 | 0.204 | 0.090 | 0.210 | 0.273 | 0.123 | 0.328 | 0.424 | 0.195 |
| Pol. | 0.164 | 0.215 | 0.095 | 0.221 | 0.288 | 0.130 | 0.346 | 0.446 | 0.205 | |
| IV | 0.174 | 0.227 | 0.101 | 0.234 | 0.304 | 0.137 | 0.364 | 0.470 | 0.217 | |
| P3 | II | 0.113 | 0.160 | 0.055 | 0.167 | 0.230 | 0.088 | 0.286 | 0.381 | 0.160 |
| Pol. | 0.122 | 0.172 | 0.060 | 0.179 | 0.245 | 0.095 | 0.303 | 0.403 | 0.170 | |
| IV | 0.131 | 0.184 | 0.066 | 0.191 | 0.260 | 0.102 | 0.322 | 0.426 | 0.182 | |
| Region\Heat Source | S1 | S2 | S3 |
|---|---|---|---|
| Poland | 10.080 | 2.195 | 8.698 |
| I | 9.737 | 2.120 | 8.402 |
| II | 9.151 | 1.993 | 7.897 |
| III | 10.261 | 2.234 | 8.854 |
| IV | 11.112 | 2.420 | 9.589 |
| Constr. Material. | Region | Heat Source—Thermal Insulation Material | ||||||||
|---|---|---|---|---|---|---|---|---|---|---|
| S1-I1 | S1-I2 | S1-I3 | S2-I1 | S2-I2 | S2-I3 | S3-I1 | S3-I2 | S3-I3 | ||
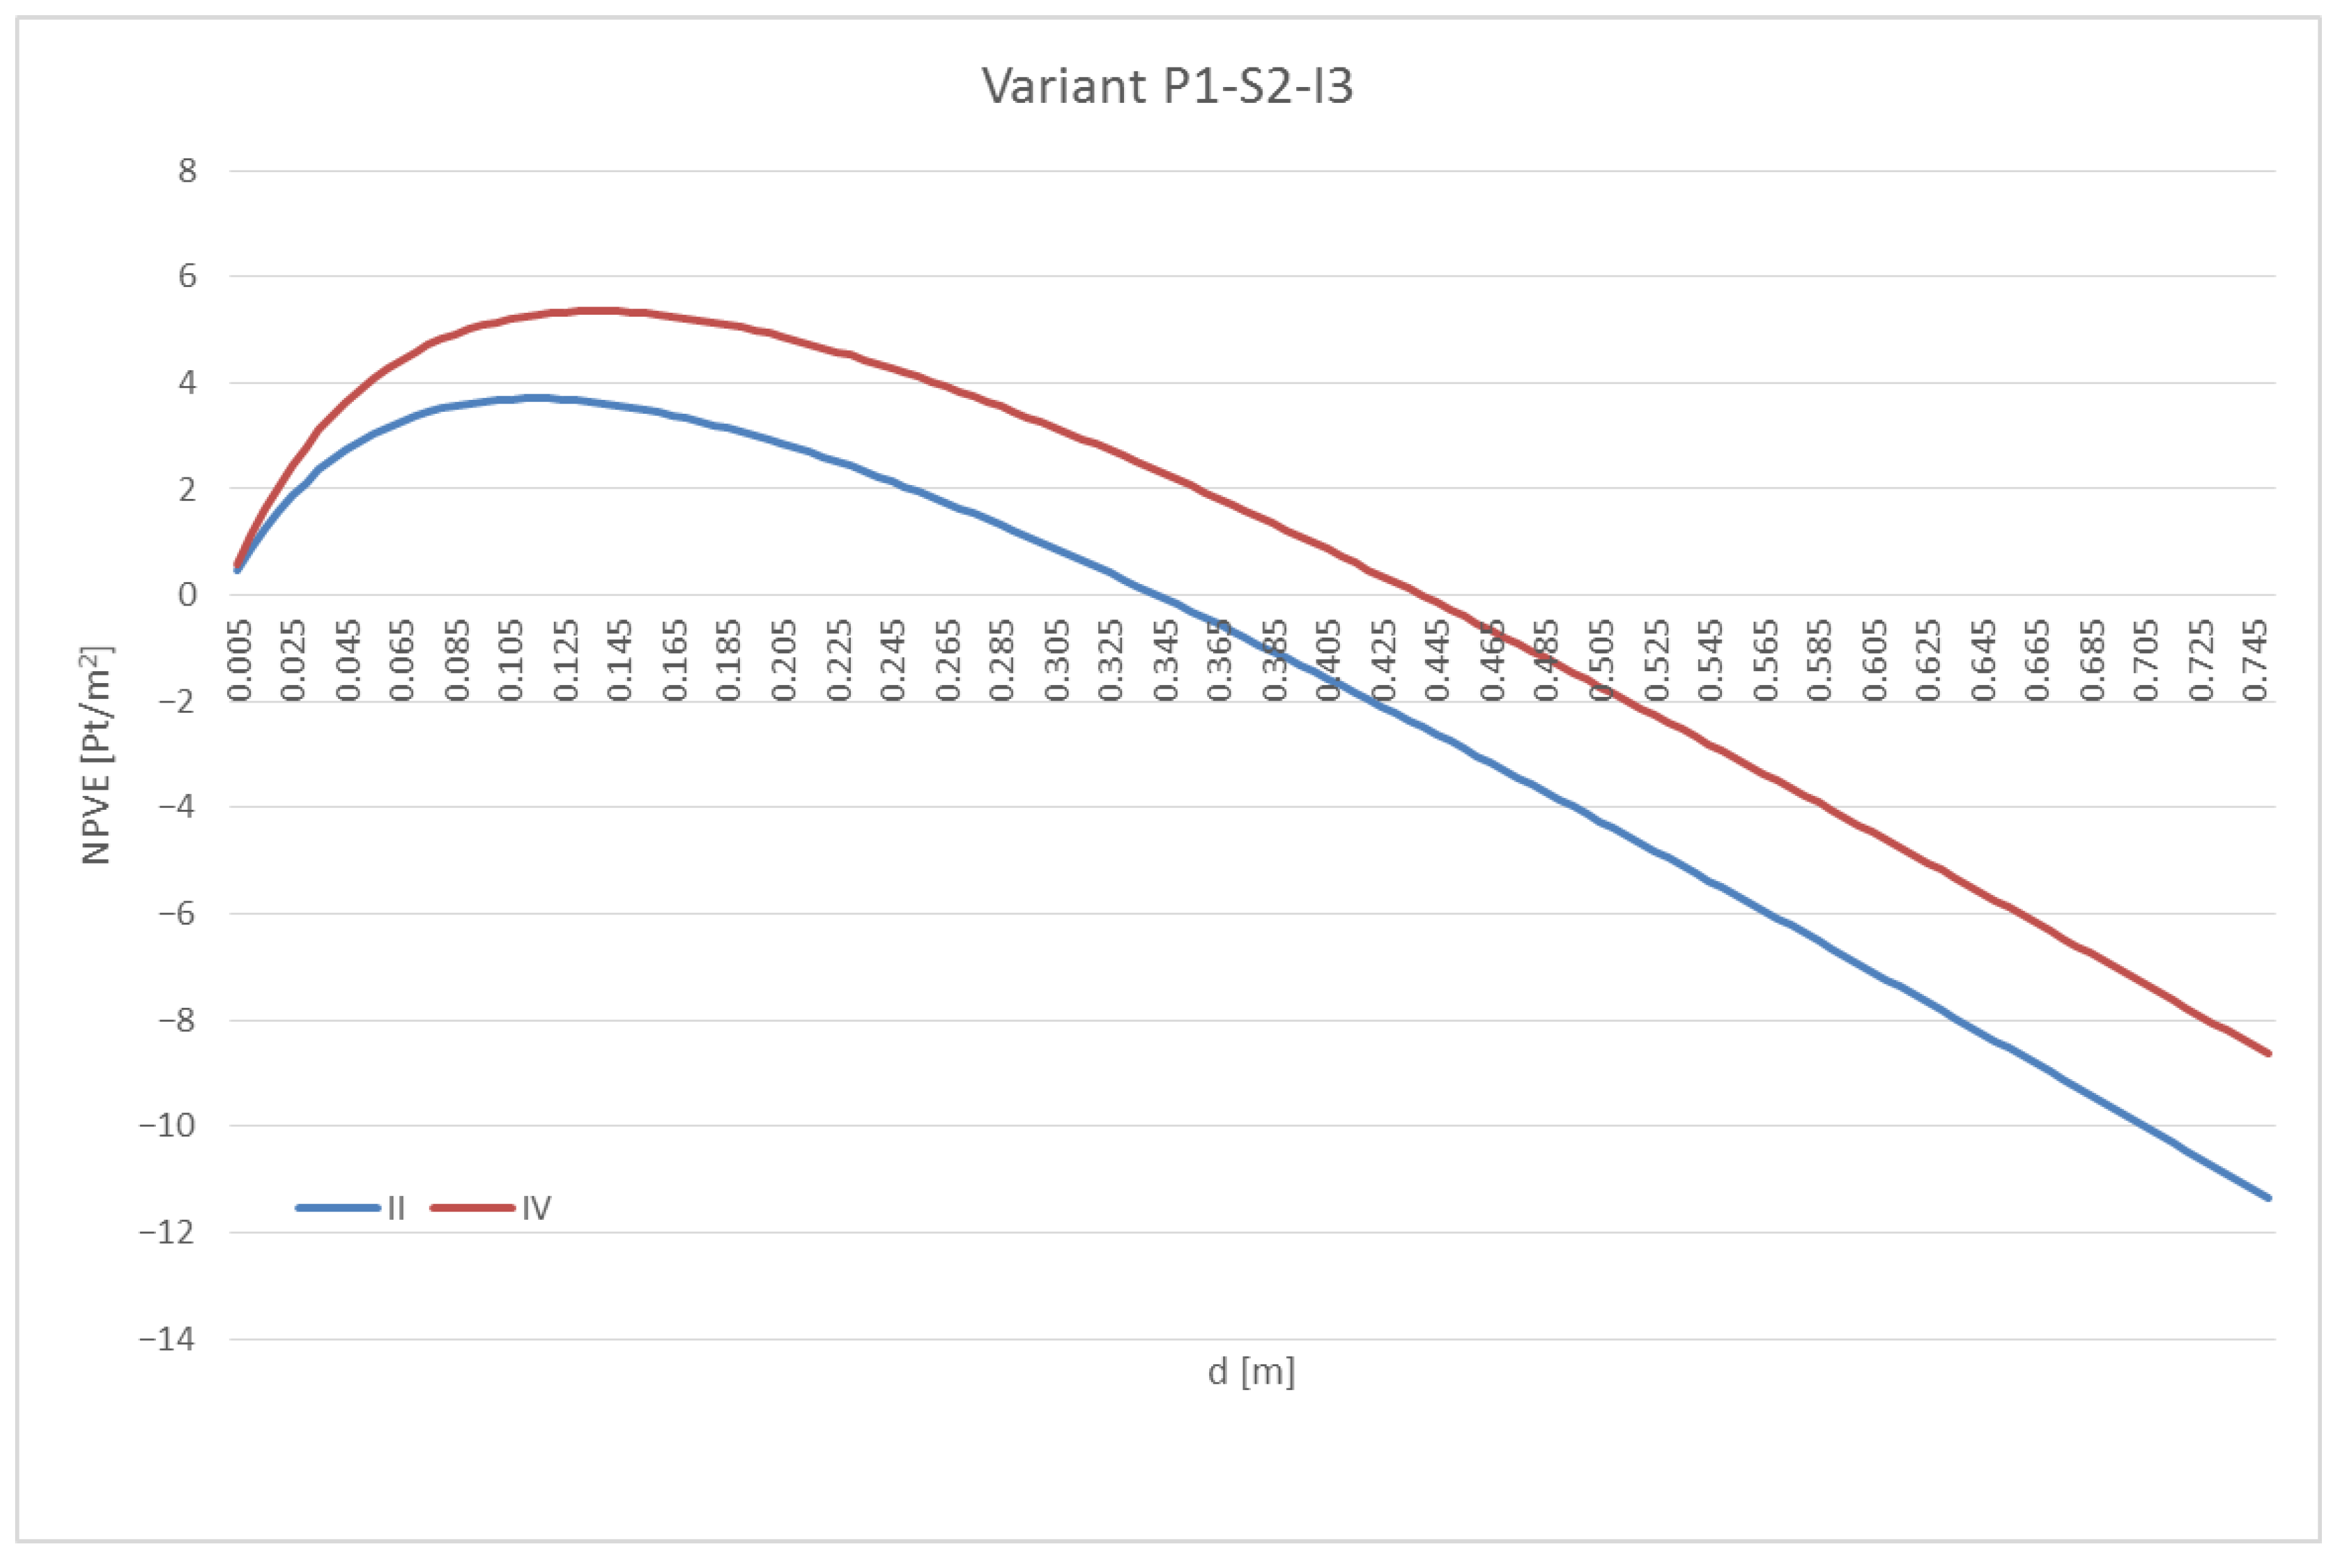
| P1 | II | 0.549 | 1.025 | 0.369 | 0.184 | 0.405 | 0.113 | 0.500 | 0.942 | 0.335 |
| Pol. | 0.583 | 1.082 | 0.392 | 0.200 | 0.431 | 0.124 | 0.532 | 0.996 | 0.357 | |
| IV | 0.619 | 1.143 | 0.418 | 0.217 | 0.460 | 0.136 | 0.565 | 1.052 | 0.380 | |
| P2 | II | 0.660 | 1.138 | 0.460 | 0.295 | 0.518 | 0.204 | 0.611 | 1.056 | 0.426 |
| Pol. | 0.694 | 1.196 | 0.483 | 0.311 | 0.545 | 0.215 | 0.643 | 1.109 | 0.448 | |
| IV | 0.730 | 1.257 | 0.509 | 0.328 | 0.574 | 0.227 | 0.676 | 1.166 | 0.471 | |
| P3 | II | 0.617 | 1.095 | 0.425 | 0.253 | 0.475 | 0.169 | 0.569 | 1.012 | 0.391 |
| Pol. | 0.651 | 1.152 | 0.449 | 0.269 | 0.502 | 0.180 | 0.600 | 1.066 | 0.413 | |
| IV | 0.687 | 1.213 | 0.474 | 0.285 | 0.530 | 0.192 | 0.634 | 1.122 | 0.436 | |
Publisher’s Note: MDPI stays neutral with regard to jurisdictional claims in published maps and institutional affiliations. |
© 2020 by the authors. Licensee MDPI, Basel, Switzerland. This article is an open access article distributed under the terms and conditions of the Creative Commons Attribution (CC BY) license (http://creativecommons.org/licenses/by/4.0/).
Share and Cite
Dylewski, R.; Adamczyk, J. Impact of the Degree Days of the Heating Period on Economically and Ecologically Optimal Thermal Insulation Thickness. Energies 2021, 14, 97. https://doi.org/10.3390/en14010097
Dylewski R, Adamczyk J. Impact of the Degree Days of the Heating Period on Economically and Ecologically Optimal Thermal Insulation Thickness. Energies. 2021; 14(1):97. https://doi.org/10.3390/en14010097
Chicago/Turabian StyleDylewski, Robert, and Janusz Adamczyk. 2021. "Impact of the Degree Days of the Heating Period on Economically and Ecologically Optimal Thermal Insulation Thickness" Energies 14, no. 1: 97. https://doi.org/10.3390/en14010097
APA StyleDylewski, R., & Adamczyk, J. (2021). Impact of the Degree Days of the Heating Period on Economically and Ecologically Optimal Thermal Insulation Thickness. Energies, 14(1), 97. https://doi.org/10.3390/en14010097


