Article

Distributed Energy-Resource Design Method to Improve Energy Security in Critical Facilities †

by
Petros Siritoglou
1,
Giovanna Oriti
2,* and
Douglas L. Van Bossuyt
3,*
1
Hellenic Navy, Athens, 18648 Attica, Greece
2
Department of Electrical Engineering, Naval Postgraduate School, Monterey, CA 93943, USA
3
Department of Systems Engineering, Naval Postgraduate School, Monterey, CA 93943, USA
*
Authors to whom correspondence should be addressed.
This paper is an extended version of our paper published in 2020 IEEE International Conference on Environment and Electrical Engineering and 2020 IEEE Industrial and Commercial Power Systems Europe (EEEIC/I&CPS Europe), 9–12 June 2020; pp. 1–6.
Energies 2021, 14(10), 2773; https://doi.org/10.3390/en14102773
Submission received: 1 March 2021 / Revised: 29 April 2021 / Accepted: 1 May 2021 / Published: 12 May 2021
(This article belongs to the Section A1: Smart Grids and Microgrids)

Abstract

:
This paper presents a user-friendly design method for accurately sizing the distributed energy resources of a stand-alone microgrid to meet the critical load demands of a military, commercial, industrial, or residential facility when utility power is not available. The microgrid combines renewable resources such as photovoltaics (PV) with an energy-storage system to increase energy security for facilities with critical loads. The design method’s novelty complies with IEEE Standards 1562 and 1013, and addresses resilience, which is not taken into account in existing design methods. Several case studies simulated with a physics-based model validate the proposed design method and demonstrate how resilience can be included in the design process. Additionally, the design and the simulations were validated by 24 h laboratory experiments conducted on a microgrid assembled using commercial off-the-shelf components.

1. Introduction

Energy security is of great strategic importance for facilities where critical loads are present. When the utility grid suddenly malfunctions, the energy security of a facility is threatened, and the use of microgrids with distributed energy resources (DERs) can improve the situation [1,2]. According to [3], “a succinct way to approach energy security is through the four As: availability, affordability, accessibility (to all), and acceptability (from a sustainability standpoint)”. Back-up diesel generators are typically available in critical facilities and are generally turned on to power critical loads when the utility power grid is down. However, diesel generators are not sufficient to ensure the resilience of a critical facility because the diesel-fuel supply may not be guaranteed for the time, for instance, during which critical loads must be powered. To further improve the resilience of a critical facility, a back-up microgrid including at least one renewable-energy source and energy storage is proposed in this paper.
The U.S. Department of Defence (DOD) relies on energy in the age of network-centric warfare to carry out critical missions at military bases in the USA and around the world [4,5]. Outages of grid-supplied energy to bases are a major concern to DOD and have caused significant losses in mission capability in some instances [6]. While high-level guidance exists related to how long a load that is critical to mission success must continue to be powered after the start of a grid outage (between 7 and 14 days depending on military service branch guidance) [7], there is a gap in providing sufficient direction and tools to properly size a stand-alone microgrid for events of specific concern to the DOD [8]. Further, there is a gap in the DOD understanding of events that may cause some or all of a stand-alone microgrid’s generation capacity to become unavailable. For instance, a hurricane may cause initial grid outage, followed by another hurricane several days later, which can damage a PV array, thus reducing its generation capacity [9]. Because of the criticality of national defence to a country’s well-being, a design process to account for such “one-two punches” to mission critical power supplies is needed.
This paper proposes a design methodology that follows the guidelines in IEEE Standards 1562 [10] and 1013 [11] to size the combination of a renewable-energy source, such as a photovoltaic (PV) array, and energy storage to develop a microgrid. The microgrid is explicitly a secondary or redundant microgrid that has the goals of (1) improving the resilience of a critical facility, and (2) boosting energy security to allow for full-time mission support when the utility grid is down and fuel delivery is interrupted.

1.1. Literature Review

Optimal sizing of DER, including PV and batteries, is addressed in many papers, such as [12,13,14,15,16,17], and a comparison of optimization algorithms is presented in [18]. While these papers propose several complex methods and algorithms to optimize for cost when introducing renewable-energy sources into a microgrid, none of the proposed design methods allows for design to maximize resilience. Furthermore, the vast majority of papers focuses on optimizing battery sizing to reduce some costs, with most papers analyzing grid-connected microgrids, and fewer studying stand-alone microgrids with PV [16,19,20,21]. An optimization-parameter alternative to cost is the environmental impact of hybrid and grid-connected microgrids, as presented in [13], where CO2 minimization was one of the goals.
Reliability and resilience were very recently addressed in the microgrid literature [22,23,24,25] with complex iterative sizing and energy-management methodologies that require much time and operator knowledge to yield the promised results. A thorough review of the literature on microgrid resilience up to 2018 was presented in [22], in which the authors indicated that recovery, scheduling, and operational solutions were the focus of previous work, and that a gap existed on DER sizing when unplanned islanding occurs. Their paper focused on the islanding time window, proposing a complex model and numerical method to minimize cost without providing experimental validation of the model. In [23], batteries were sized to limit load shedding in islanded microgrids in the event of cyber attacks; however, PV sources were not included. The novelty of [24] is in the new definitions that the authors introduce to estimate resilience in power systems such as capacity accessibility and capacity adequacy. Although the paper presents several numerical examples, no physics-based modeling or experimental validation was included to support their claims. In the most recent paper [25], another extensive literature review was presented where the authors first identified a gap in sizing PV and batteries to improve the resilience of a household; the focus on resilience from utility-grid failure did not account for other possible damage types to the diesel generator or other DERs.
Many design programs are available to size, optimize, and run sensitivity and economic analyses of DERs. The most popular are the hybrid optimization model for electric renewables (HOMER) [26], the system advisor model (SAM) created by the National Renewable Energy Laboratory (NREL) [27], the microgrid design toolkit (MDT) developed by Sandia National Laboratories (SNL) [28], and Xendee [29]. A recent report by the International Energy Agency [30] presented a comprehensive lists of all available tools that were mostly focused on designing grid-tied power systems with emphasis on cost minimization. Although some tools can be used to design stand-alone microgrids, several require a significant amount of time to run due to multiple iterations and sensitivity analyses implemented in their algorithms; they also require that users have a detailed knowledge of microgrids and their components. Most importantly, all of these tools aim at sizing for cost or the most efficient use of solar resources.
The above literature review identified a few gaps when looking for early-design sizing methodology with focus on resilience. One gap is DER sizing to support critical loads for the required 14 days to ensure the resilience of a military operation, as defined by the facility’s energy manager. A second gap is DER design in compliance with IEEE guidelines [10,11], but extends beyond lead-acid batteries to encompass other technologies (e.g., lithium and ion). Furthermore, these authors could not find in the literature a design procedure validated by a physics-based model and by experimental measurements on a generic commercial off-the-shelf (COTS) microgrid.

1.2. Novel Contribution and Paper Organization

This paper fills the above-identified gaps by presenting a design methodology for sizing the DERs of a stand-alone microgrid, including PV arrays as a power source and batteries as energy storage. This novel design method can assist energy managers in the early design stages of back-up microgrids to improve the energy resilience of their facilities, as it is a method based on worst-case analysis rather than an optimization method. Among other features, the design method allows for the designer to verify that the sizing of energy storage is sufficient based on potential PV failures in the context of improving the resilience of a microgrid to a variety of disruptions. Additionally, the design method was implemented on a MATLAB-based experimentally validated software platform featuring a user-friendly interface and less than 1 s processing time. The software could run in manual or automated mode, allowing for use with no knowledge of DER components’ datasheets and performance.
The paper is organized as follows: in Section 2, the design methodology is presented, including all equations and assumptions, with emphasis on the key parameters on which an energy manager should focus for resilience. Five design examples are presented in Section 3 to demonstrate the functionality of the proposed method and software using a scaled 24 h load profile. In each case, load power requirements were met by the microgrid with DERs sized by the proposed tool. In Section 4, the design equations and physics-based model are validated by experimental measurements on a microgrid setup with commercial off-the-shelf (COTS) components.

2. DER Design Methodology and Software Implementation

The design method is first described in this section through a series of equations that have user preferences as inputs, and the sizes of PV panels and batteries as outputs. The equations were adapted from IEEE Standards 1562 [10] and 1013 [11]. The method and equations were implemented in a software tool by reading the user’s inputs from a graphic user interface (GUI) and then solving the equations.

2.1. Design Methodology and Equations

The first step in the proposed design methodology is to calculate the appropriate battery capacity, which was computed with Equations (1) and (2), given the critical AC Load power demand in MWh/day, the inverter’s efficiency, and the DC bus voltage V b u s .
D C L o a d [ MWh / day ] = A C L o a d I n v e r t e r s E f f i c i e n c y
L o a d [ Ah / day at DC Bus ] = D C L o a d V b u s
To further enhance the resilience of the critical loads, an autonomy period is taken into account. This is the number of days when the critical load must be entirely supported by the fully charged battery bank without receiving power from the PV array. The most important out of many considerations that should be made to determine the autonomy are the criticality of the load application, system availability, and solar-irradiance variations of the area of interest throughout the day or season. This feature allows for an energy manager to account for the performance requirement of critical loads when using this design tool to size the batteries. The unadjusted battery capacity is given by multiplying the load demand at the DC bus (Ah/day) by the autonomy period (days) in Equation (3).
U n a d j u s t e d B a t t C a p a c i t y [ Ah ] = L o a d · A u t o n o m y
In addition to the battery voltage (Vbat) and its capacity (Capacity) in Ah, and depending on the selection of type of battery (deep cycle lead acid or Li–Ion), maximal depth of discharge (MDOD), battery efficiency, and multicell recharge voltage are determined. One of the factors that the design algorithm also considers is temperature since it affects available battery capacity. Battery capacity is adjusted by specific temperature-correction factors (TCFs) for lead acid [19] and Li–Ion batteries [31]. For lead acid batteries, the TCF drops with temperature, going from 1 at 25 C (and higher) to 0.95 at 15 C, and down to 0.65 at −20 C. For Li–Ion batteries, the TCF is 1 for temperatures down to 5 C, and then drops to 0.95 at −5 C and 0.77 at −20 C [1] as the capacity of Li–Ion batteries is less impacted by temperature than the capacity of lead acid batteries is.
Battery capacity is further adjusted for the MDOD, which is a parameter that should be selected from resilience-oriented life-cycle cost analysis. A design margin (M) of 10% (M = 1.1) is also taken into consideration to maintain system availability, and for uncertainties in load determination, as in Equation (4).
N o m i n a l B a t t e r y C a p a c i t y [ Ah ] = M · U n a d j u s t e d B a t t e r y C a p a c i t y M D O D · T C F
In order to size the batteries, IEEE standard 1562–2007 refers to the system voltage range, mentioning that it should be accordingly defined [11]. Specifically, the standard defines V m a x as the lowest maximal voltage and V m i n as the highest minimal voltage between which all loads operate properly. According to [11], the number of series-connected batteries is determined by
B a t t s e r i e s ( rounded down ) = V m a x V m u l t i c e l l
where the multicell charging voltage ( V m u l t i c e l l ) is given by the product of the voltage of the individual cell and the number of cells in the battery, as is shown in Equation (6), with the number of cells computed in Equation (7) for lead acid and Li-Ion batteries.
V m u l t i c e l l [ V ] = V c e l l · N c e l l s
N c e l l s = V b a t 2 , for Lead Acid Batteries a n d N c e l l s = V b a t 3 , for Li - Ion Batteries .
An alternative to Equation (5) was introduced for two reasons: (i) the difficulty of recording the maximal and minimal voltages at which each DC load is operating, and (ii) determining the number of series-connected batteries using the recharge voltage in some cases results in lower voltage during the periods when the batteries are mostly depleted. On the other hand, using nominal battery voltage is straightforward; therefore, the number of series-connected batteries is determined by Equation (8) in the proposed design tool.
B a t s e r i e s ( rounded up ) = V b u s V b a t
The number of batteries connected in parallel is readily given by
B a t p a r a l l e l ( rounded up ) = N o m i n a l B a t t e r y C a p a c i t y B a t t e r y ( u n i t ) C a p a c i t y
The PV array was designed next. To properly design a sufficient stand-alone power system, it is recommended to use the peak sun hours (PSH) in kWh/m2 of the month with the lowest solar radiation for the desired location. This is a conservative assumption to improve microgrid resilience. PSH data are available from the NREL’s national solar-radiation database [32] including 25 years of solar-radiation data and several other factors such as wind and temperature.
System losses (SL) that should be taken into consideration include battery efficiency, wire losses, dust, aging of the PV array, and other parasitic losses. A fair assumption of 15% total system losses was considered to be the default value in the design tool, and this is updated by adding the complement of the round-trip battery efficiency (battery round-trip losses):
S L = 0.15 + ( 1 B a t e f f )
Considering that the PV array was designed to recharge the batteries that are supplying power to the load, the output voltage of the PV array should be greater than the battery-bank recharge voltage. The equation that is proposed by IEEE Standard [11] is taken a step further by determining the number of PV modules that should be connected in series by Equation (11), where the V m p is the voltage at the maximal power point of the used PV module.
MPPT charge controllers are often used to improve the PV efficiency. The use or absence of MPPT controllers is a choice for the user in the input window of the proposed design tool. The design tool accounts for a derating voltage factor of 80% when the PV array is directly connected to the battery bank to ensure that the knee of the maximal power point is well above the battery-recharge voltage. On the other hand, if MPPT controllers are used, the derating factor is set to 95% to account for any variations of high ambient temperatures and power-conversion losses of the MPPT. A specific temperature-correction factor was not included in Equation (11), and will be included in future version of the design tool.
P V s e r i e s ( rounded up ) = V m u l t i c e l l · B a t s e r i e s V m p · ( D e r a t i n g V o l t a g e F a c t o r )
An additional considered parameter for the determination of the number of PV panels that should be connected in parallel is the PV array-to-load ratio ( A : L ) . The user can select the desired A:L according to their location and the loads’ performance requirements, which is typically 1.1 to 1.2 for noncritical loads and areas with high and consistent solar radiation, and 1.3 to 1.4 for critical loads or areas with low solar radiation. The number of PV modules that should be connected in parallel is determined by Equation (12), where I m p is the current at the maximal power point of the used PV module.
P V p a r a l l e l ( rounded up ) = L o a d [ Ah / day ] · ( A : L ) ( 1 S L ) · I m p · P S H

2.2. Design Software

The above method and equations were used to create design software with a user-friendly GUI in MATLAB, where the user could either select manual mode and input the PV characteristics and batteries that they choose or select automatic mode and pick among a variety of commercially available DERs. The window with the inputs in manual mode is shown in Figure 1. The window in automatic mode (not shown) has several pull-down menus in the “Parameters of the Elements Used” section for users who do not have PV and battery data sheets available, and want to use those available in the preloaded database of the software tool. The window with the outputs is shown in Figure 2 for design example 1, presented in Section 2. These outputs were obtained when the inputs were as shown in Figure 1.
The peak power consumption of critical AC loads and DC loads (if there are any) is the first input to the design tool, which is used by the software to compute Equations (1) and (2). “Required Usable Storage” is assigned to the A u t o n o m y variable in Equation (3), P S H is used to compute Equation (12). The rest of the inputs can mostly be obtained from data sheets, except the array-to-load-ratio, which is a parameter that affects resilience as described in the previous subsection.
Additional details on the software implementation of the design method, including the GUI and commercial DERs used in automatic mode, can be found in [1].

3. Design Examples and Simulated Outputs

The proposed methodology implemented in the design software described in the previous section feeds its outputs into a physics-based model, so that the designed microgrid’s power flow can be verified through simulations. In this section, we present five examples to demonstrate the functionality of the proposed design methodology. The physics-based model was implemented in Simulink/MATLAB for a microgrid architecture including PV arrays, energy storage, and equivalent DC load. The architecture of the microgrid is shown in Figure 3, which is also the circuit schematics of the COTS microgrid assembled in the laboratory for experimental validation. This architecture was chosen for two reasons: (1) it is simple to assemble with the use of widely available COTS components, and (2) it is more reliable than more complex architectures are because it requires a minimal number of components.
The physics-based model uses the PV and battery ratings determined by the design tool, as is shown in Figure 2, with the 24 h load profile [33] shown in Figure 4. The area of the load profile over the 24 h period is DC load in Ah/day. The software scales the load-demand curve on the basis of the user’s input data. The design examples presented here demonstrate that the proposed design tool allows for the user to size the DERs of a microgrid for resilience, and simulate hours, days, or months of stand-alone operation to verify that the critical load is serviced at all times in different scenarios.

3.1. Design Example 1: 24 h Autonomy without Sunlight

In this example, we designed the energy-storage component to support the critical loads for 24 h without receiving power from the PV array. The inputs to the design tool are shown in Figure 1, including Li–Ion batteries Relion RB48V200 [34] and SunPower X22-360-COM PV panels [35]. With these inputs, the output of the design tool is shown in Figure 2, in which the “Run Simulation” button is visible that could be clicked to run the time-domain simulation for this design example. The simulated results in Figure 4 and Figure 5 show that the batteries supplied the total load current demand, since the output of the PV array was zero, simulating a failure of the PV or a cloudy day. The key result of this design example is shown in Figure 5, which indicates that the batteries were not depleted at the end of the 24 h. This confirmed that the energy-storage system could support the system load without receiving power from the PV array for the period of autonomy set by the user. The SOC never dropped lower than the complement of the MDOD of the batteries.

3.2. Design Example 2: 24 h Autonomy with Sunlight

With the same inputs as that in Example 1, in this scenario, the PV output in Ah was simulated using a step profile imitating a parabola to approach hourly solar irradiance [36]. This profile was scaled according to the output of the PV array that was calculated by the design tool, as is shown in Figure 2.
The simulated PV current profile is shown in Figure 6. With this PV current, and with the input parameters in Figure 1, the plots shown in Figure 6, Figure 7 and Figure 8 were obtained in which the PV array output current supplied power to the load from 06:00 until 21:00. Up until 08:00, load demand was higher than the output of the PV array; thus, the battery current was still positive and delivered most of the power to the load. Beginning at 08:00, when the PV array output became higher than the load demand, it charged the batteries until about 14:30, when they were fully charged. Lastly, at 19:00, when the solar irradiation was significantly reduced, the batteries supported the load until the end of the day, at which point they reached an SOC of 93.79%.

3.3. Design Example 3: Impact of A:L Parameter

A variation on the design example shown above is presented here to show the influence of the A:L ratio on the microgrid design. The user inputs were identical to those in the previous scenarios except for the A:L ratio, which was increased from 1.1 to 1.3. The output of the design tool was unchanged for the batteries; however, the number of PV panels changed from 3591 to 4239. The plots in Figure 9 show that the increased A:L resulted in approximately 30% faster battery charging. This scenario also resulted in PV array output that was 20% higher, as expected. This example demonstrates that this tool could assist in the fine-tuning of the DER sizing to improve energy security. The fifth design example expands on this concept.

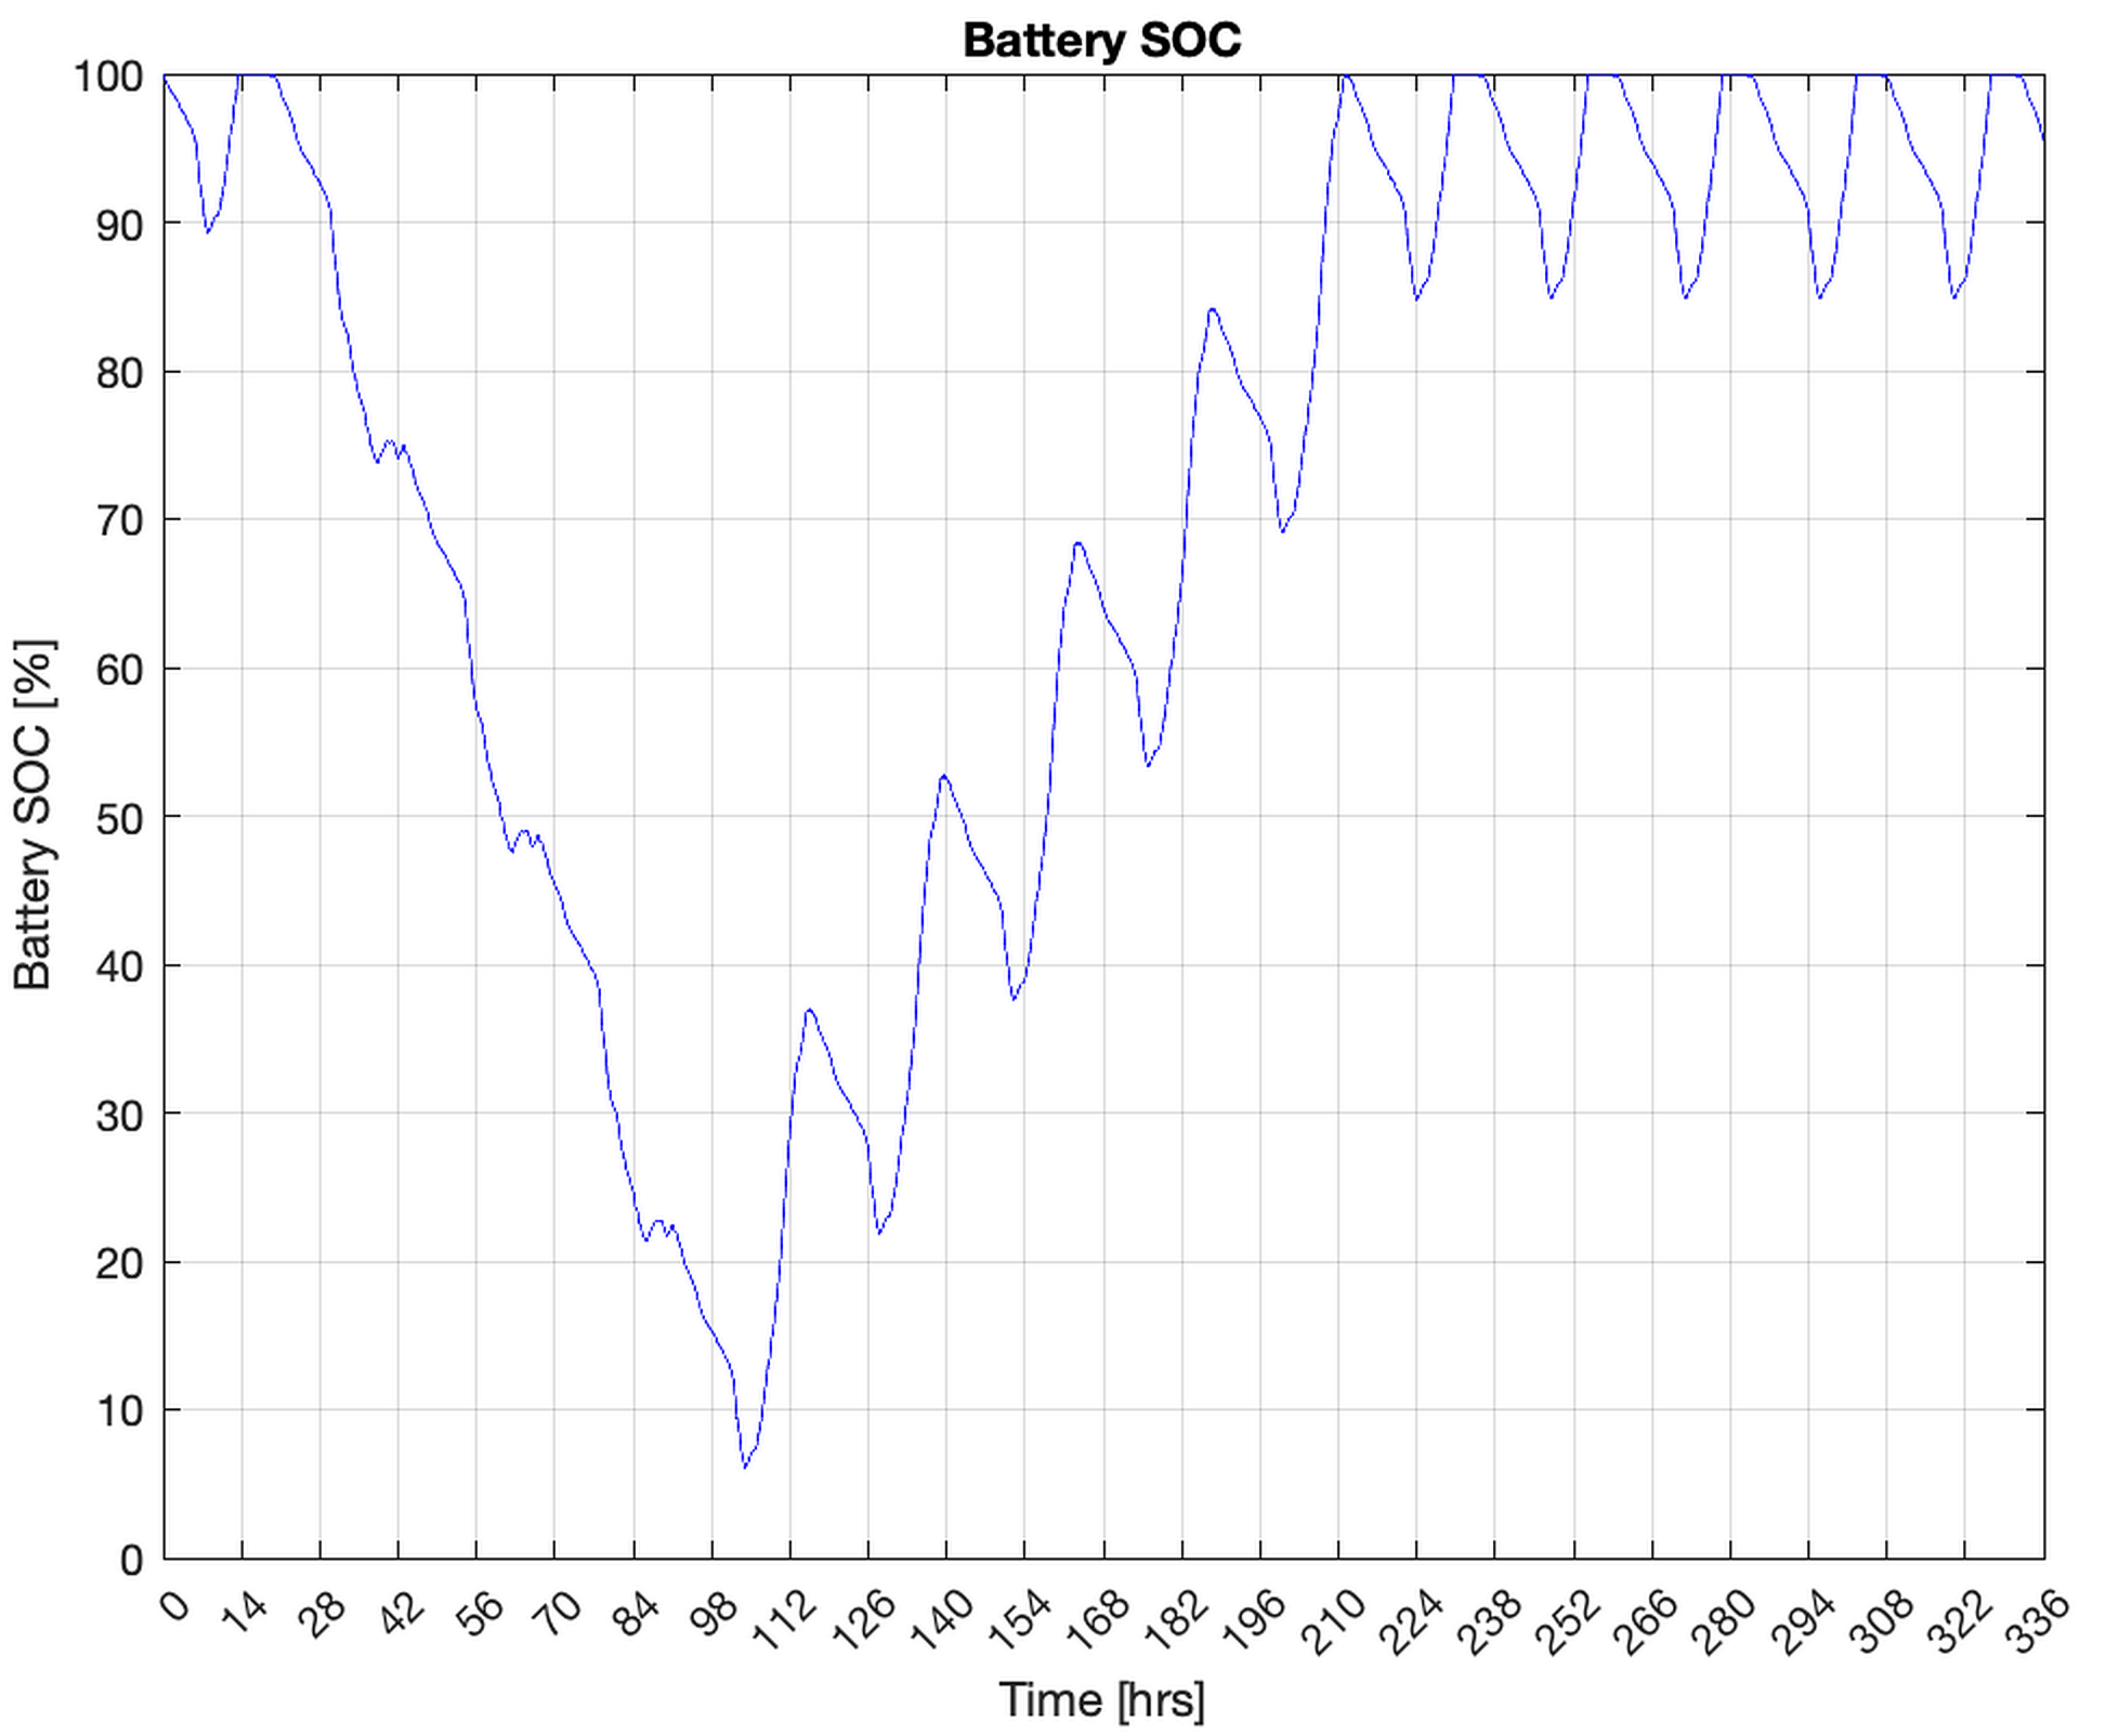
3.4. Design Example 4: 14 Day Autonomy with Prolonged Partial PV Disruption

Analysis up to this point considered a microgrid that must sustain itself over 24 h either with or without PV generation through adequate energy storage. However, microgrids may encounter generation disruptions lasting longer than 24 h or partial disruptions in generation that could result in insufficient energy storage and dropped critical loads. For instance, storms may damage PV installations [37], attacks on power infrastructure may occur [38], or equipment failures may happen [39]. We focus on PV disruption to investigate battery and PV array sizing from the perspective of sustaining the load throughout the disruption.
While many definitions and measures of resilience exist across many domains, we consider resilience to be the ability of the system to continue to function against a disturbance [40]. Within the resilience framework that Madni and Jackson proposed [41], microgrid design elements over which we can have influence correspond to (1) withstand—have sufficient battery capacity to ride through a PV disruption—and (2) recover from a disruption—time to recharge battery before next potential disruption. Most resilience measures focus on the duration of a disruption and the ensuing recovery, and on the consequence of a disruption [37,42] with a wide variety of variations in formulations and various aspects of the involved systems taken into account. In the instance of the microgrid in the second design example, it is most useful to evaluate (1) if the battery-charge state reaches zero, which represents withstanding a disruption, and (2) the time it takes to return to a full charge state, which represents recovering from a disruption. In the above scenarios, we demonstrated battery sizing based on 100% PV loss over a 24 h period. We now extend our modeling efforts to investigate (1) PV disruptions that are not complete (e.g., losing part of a PV array due to storm damage or debris coverage), and (2) the restoration of PV capacity after a maintenance and repair window, and the resulting battery recharge.
Using the same microgrid system as that in the second design example, we induced a failure of 50% of the PV capacity into a 14 day analysis period, which represents required days of autonomy of some military microgrids when offsite power is lost. The 50% PV capacity reduction could represent, for example, storm damage. After 3 days, full recovery to 100% PV capacity was achieved. The battery sized for one day of full autonomy was sufficient to ride out the disruption caused by the reduced PV capacity. It took 4.6 days to return to a nominal battery charge state. Figure 10 shows the battery state of charge over the 14 day analysis period.
While many simple and complex measures of resilience exist in the literature, it is sufficient for this level of design and analysis to simply simulate a variety of potential disruptions and verify that the microgrid design is sufficient to (1) withstand the disruption and (2) recover from the disruption in an acceptable period of time. Sizing a battery for the expected duration of a partial PV disruption requires a system designer to hypothesize about the types of disruptions that may occur. For instance, the initial disruption that disconnects a critical load from grid-connected power and disrupts fuel availability for a backup diesel generator, which in turn initiates usage of the microgrid, could be caused by a hurricane disrupting grid-scale energy generation and transmission 100 km away. The hurricane may then impact the microgrid some hours or days later, causing partial disruption of the PV array either through damage to panels or damage to cabling and other associated components. In such a situation, and where the critical load is sufficiently important, a standby reserve of PV panels and other requisite hardware may be available to be installed to bring the PV array back to full capacity. The process of repairing a PV array may take several days to complete.

3.5. Design Example 5: 14 Day Autonomy with Prolonged Partial PV Disruption and Increased A:L Ratio

The recovery time to a fully recharged battery from initial microgrid disruption includes both the time to repair and bring the PV array back to full capacity, and the time to recharge the battery once the PV array is fully restored. The amount of time it takes to return to a predisruption charge state is important if the hypothesized disruption could occur more than once in a relatively short period of time. For instance, the 2017 Atlantic hurricane season had both Hurricane Irma and Hurricane Maria spaced two weeks apart, which impacted the US Virgin Islands [9]. Other similar disruptive weather events such as intense thunderstorms and tornadoes in the Midwest of the United States can occur with regularity. While the 8.6 day recovery time from initial disruption to a full charge state (4 days of 50% PV capacity and 4.6 days of recharge time) shown in Figure 10 may be sufficient, a shorter period may be desired, in which case a large PV array is required. Increasing the A:L ratio to 1.4 produces a recovery time from initial disruption to fully recharged battery of 5.8 days, as shown in Figure 11.
Oversizing the PV array from the original A:L = 1.1 to A:L = 1.4 decreased recovery time in this scenario by 3 days. In certain scenarios, a 3 day reduction in recovery time may make a significant difference in the ability of a critical load to be maintained through a second disruption event during a 14 day grid power outage and diesel-fuel interruption. Resilience can be further improved by increasing battery size and/or PV array size on the basis of scenarios that a facility reasonably expects to encounter.

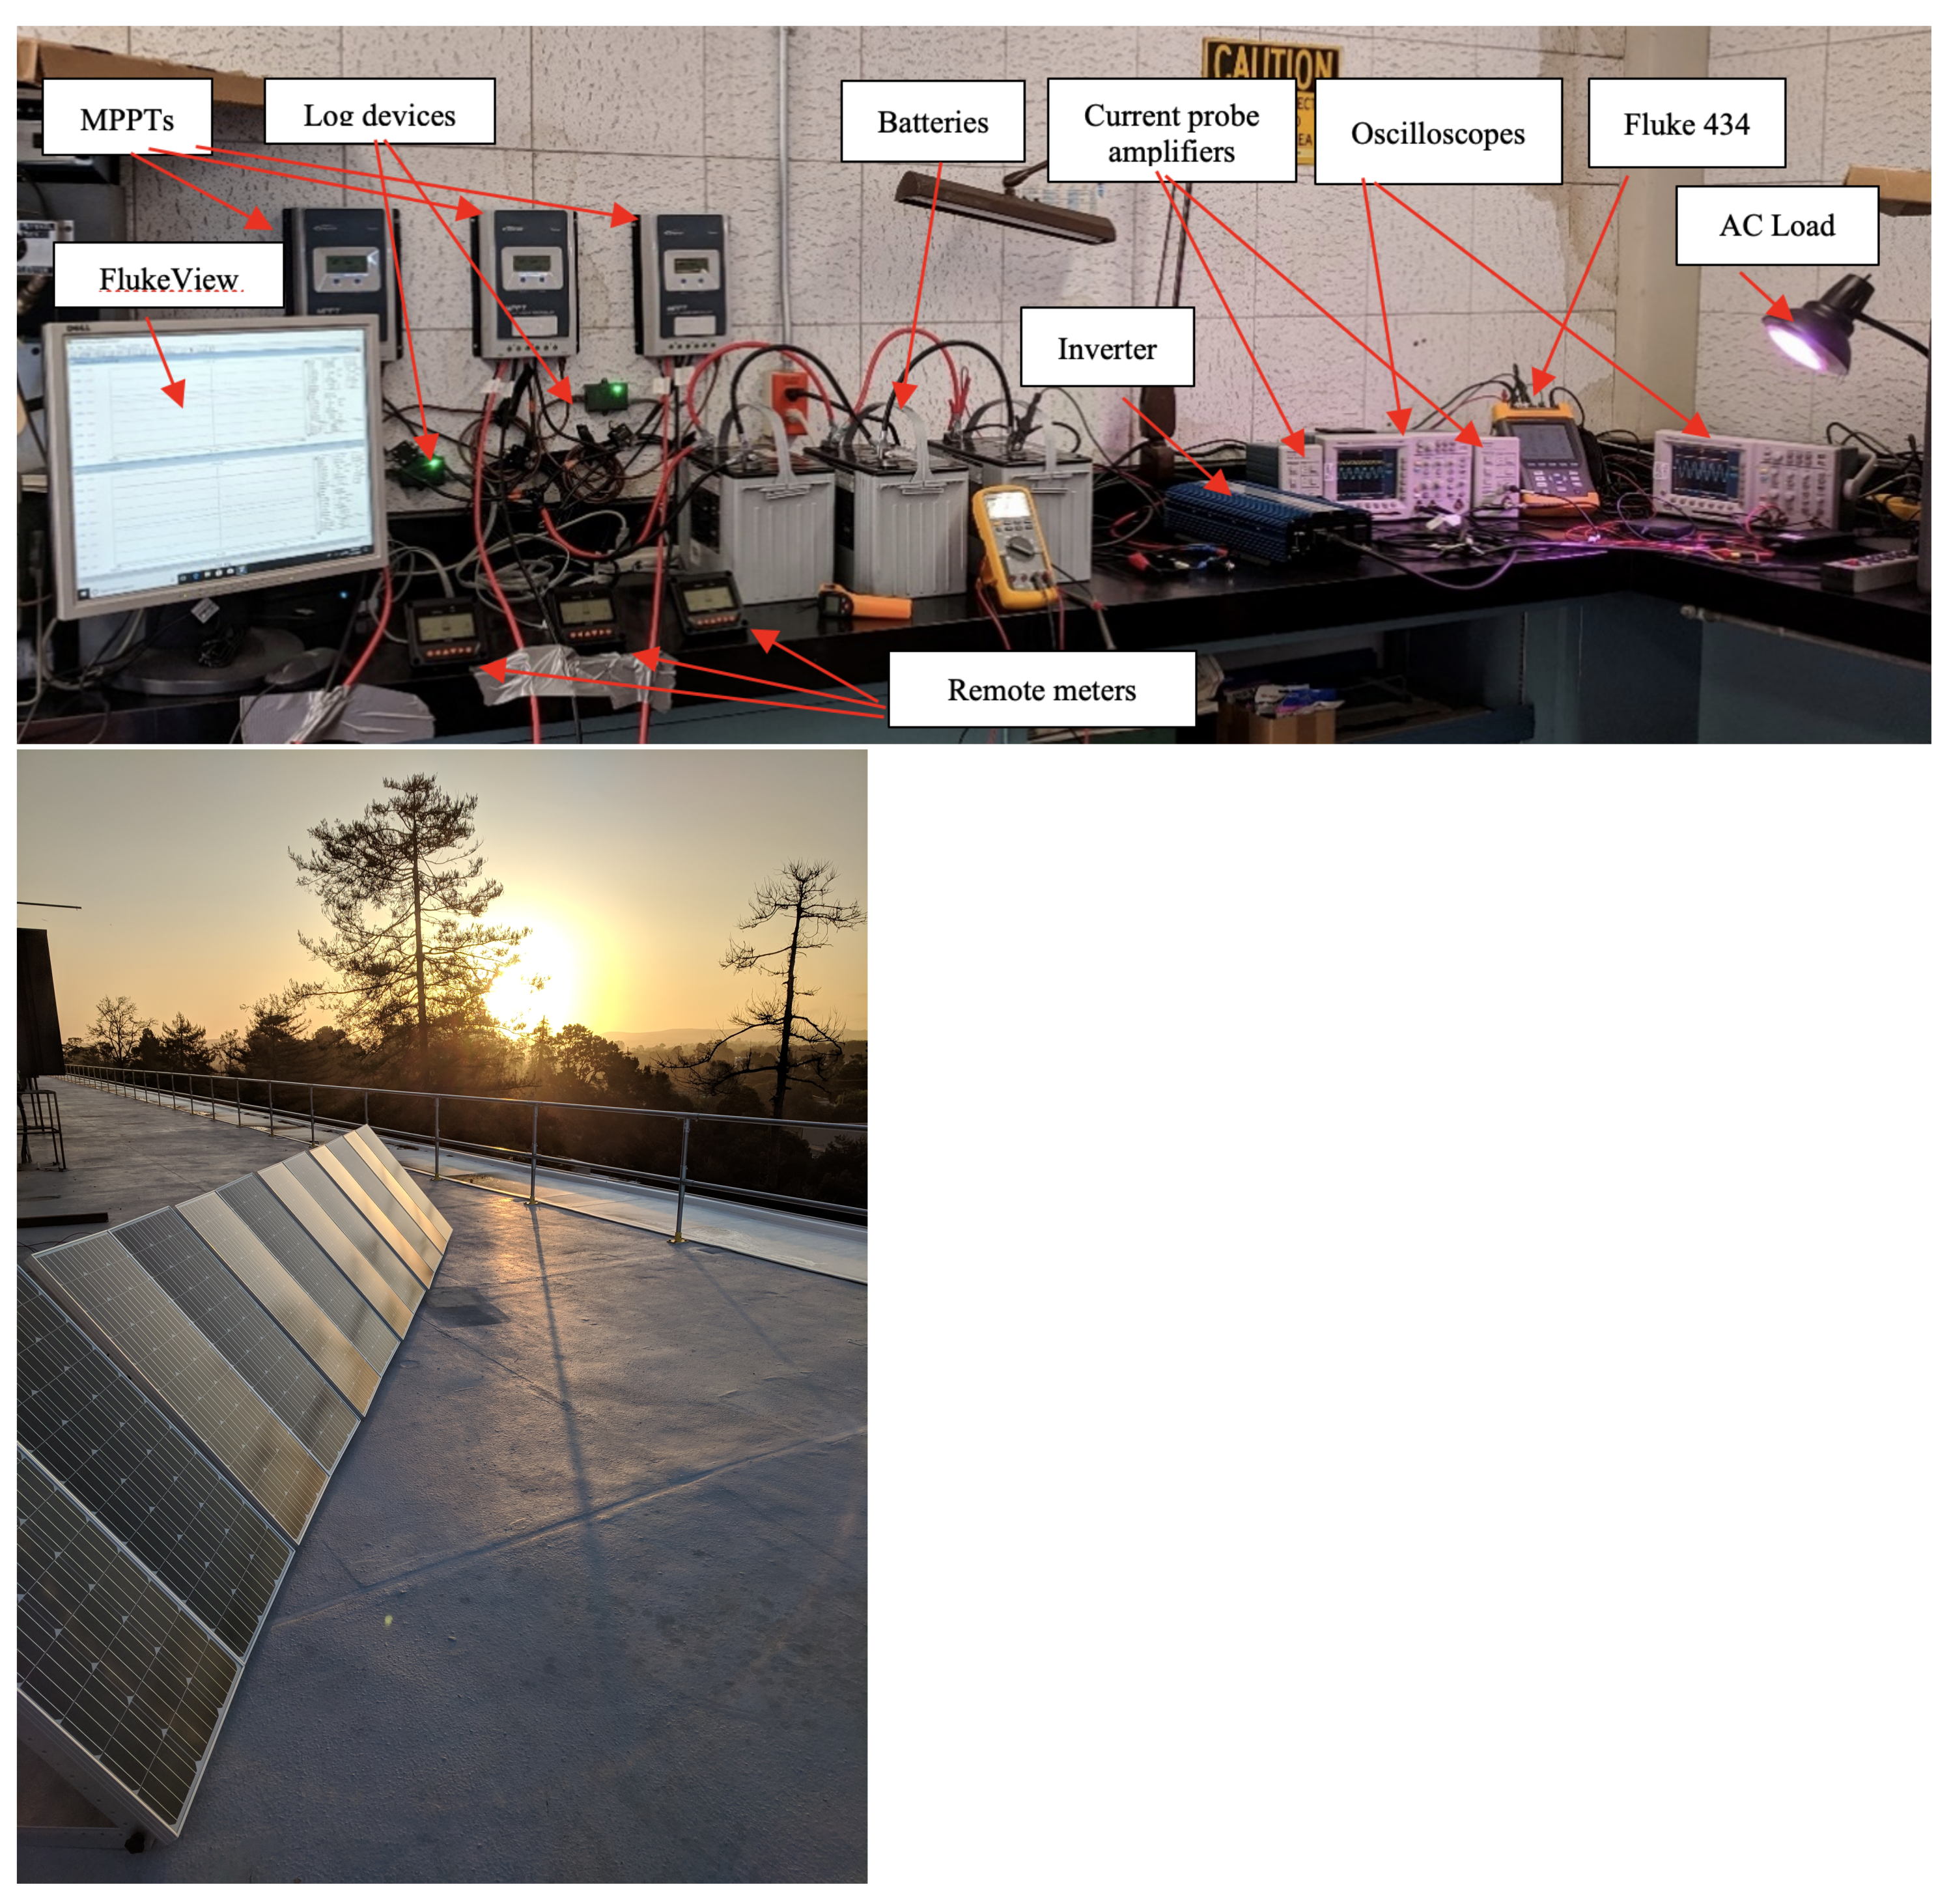
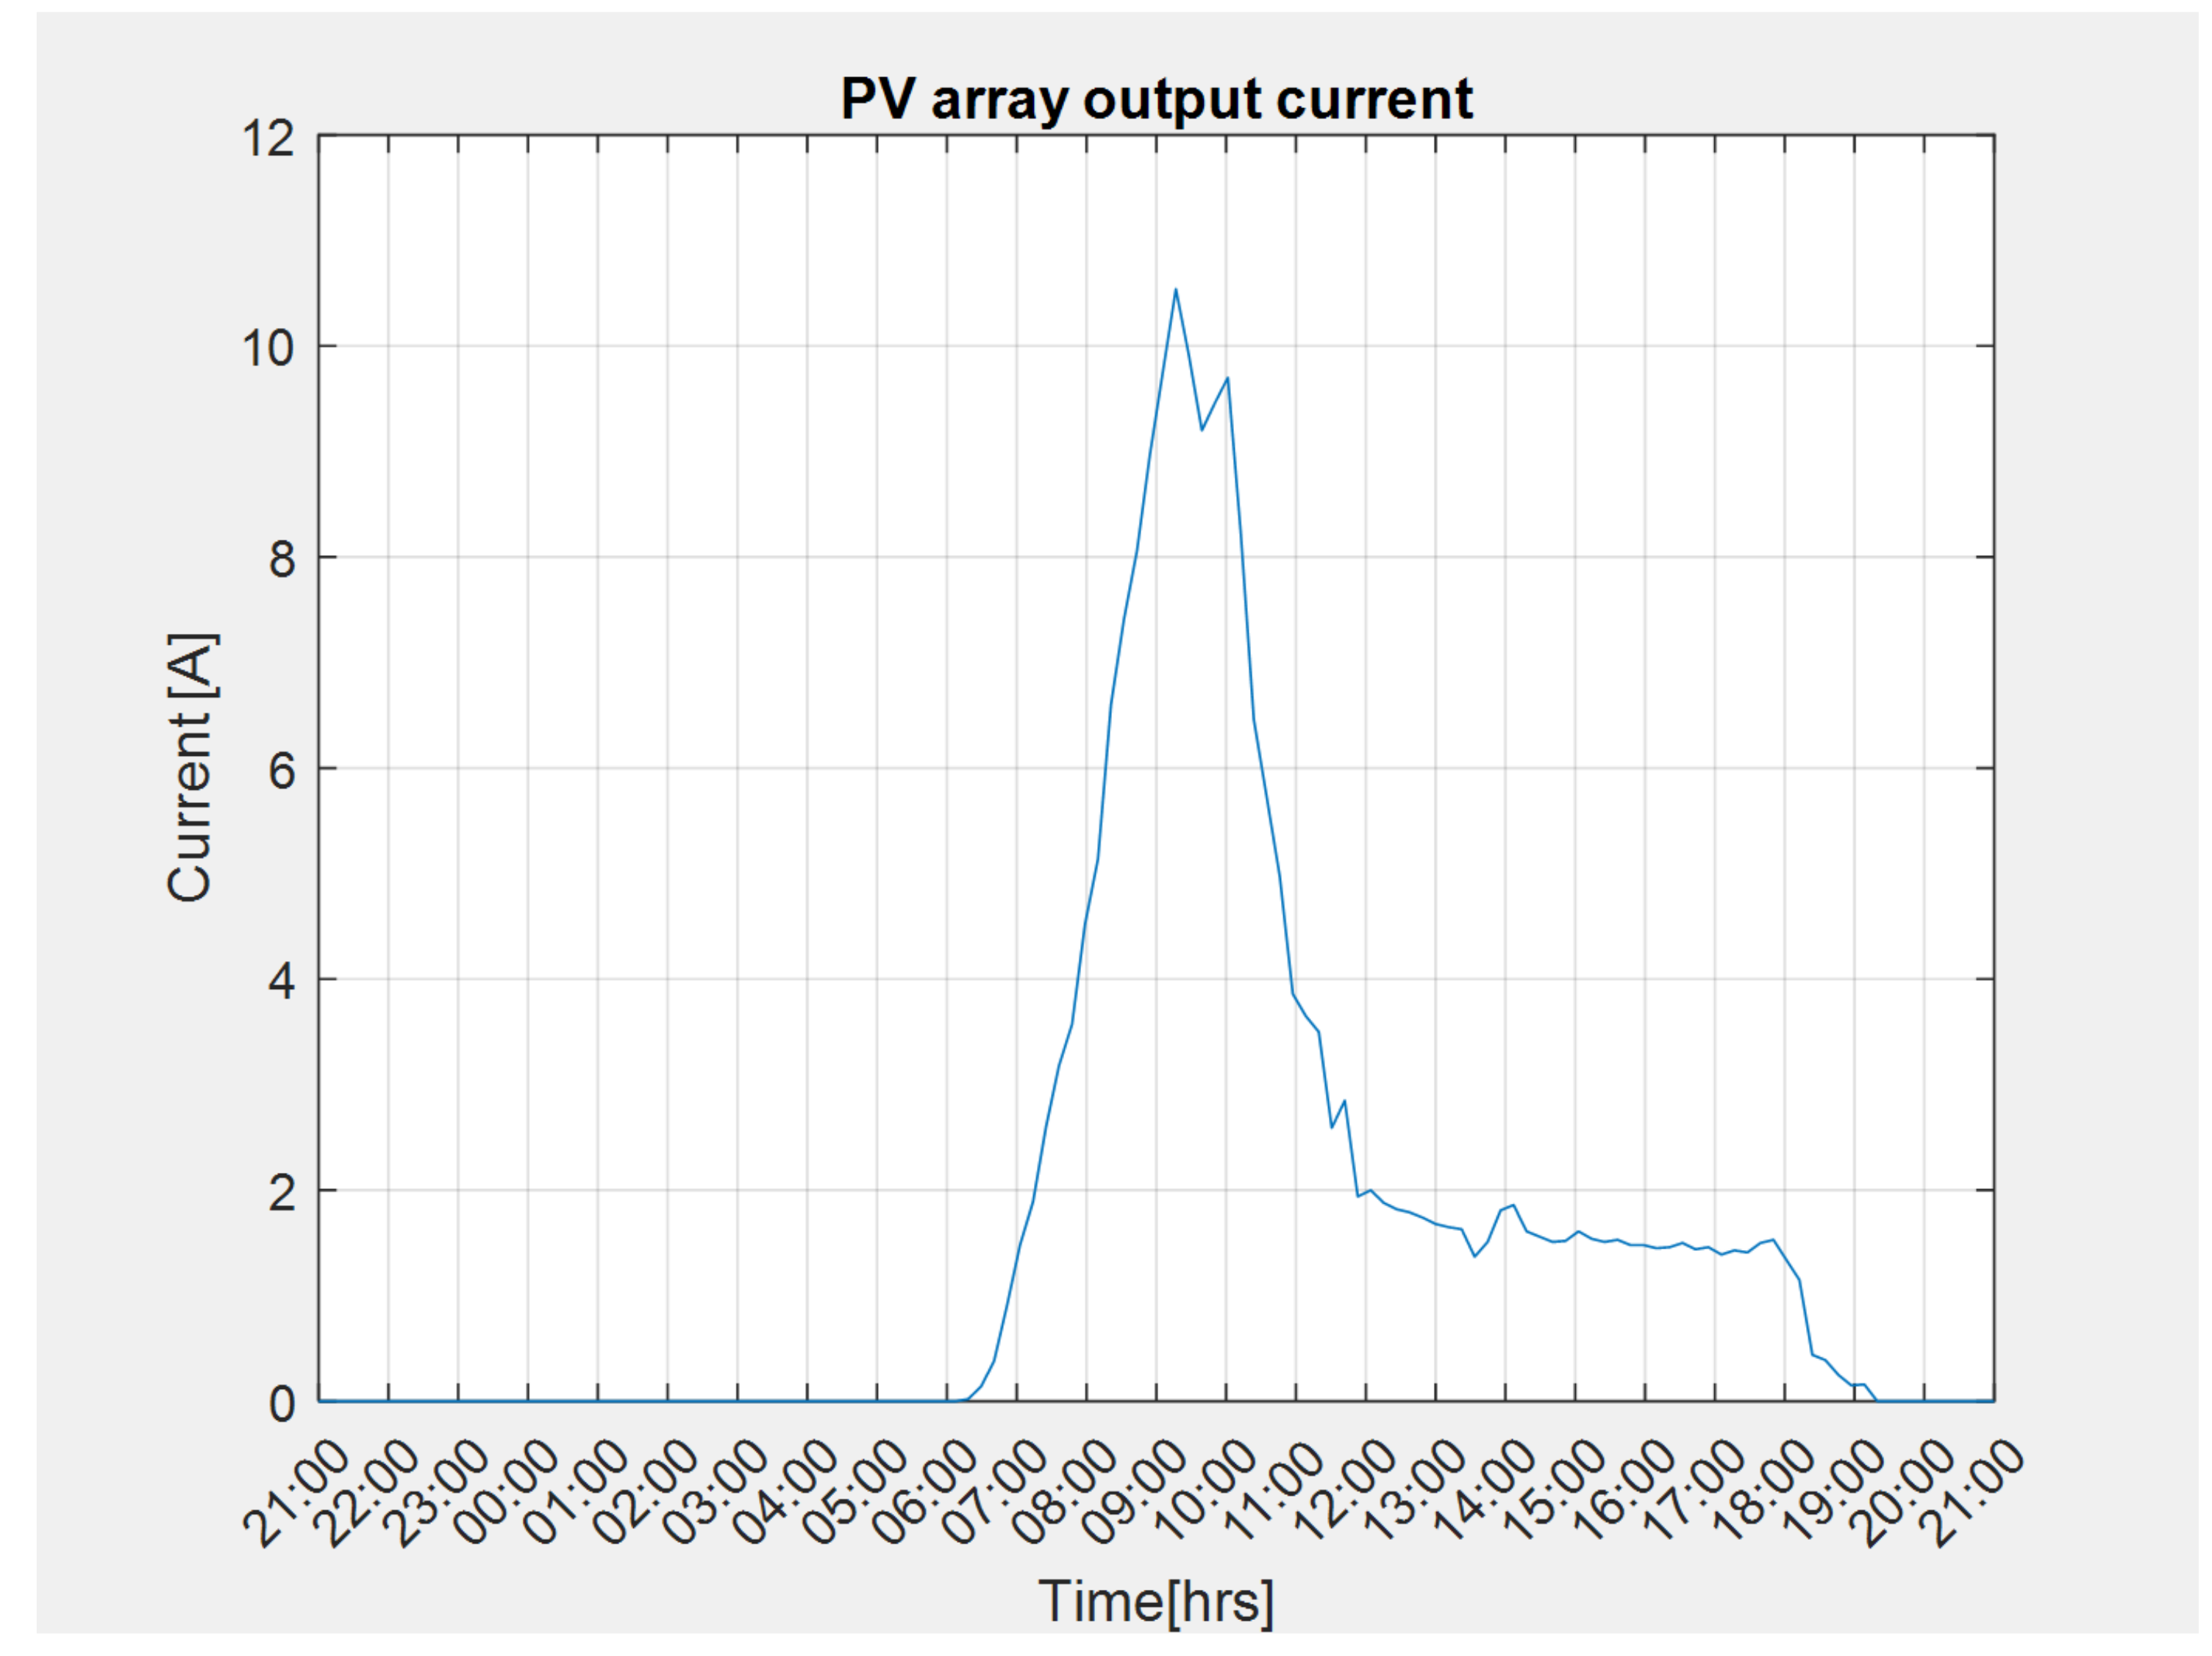
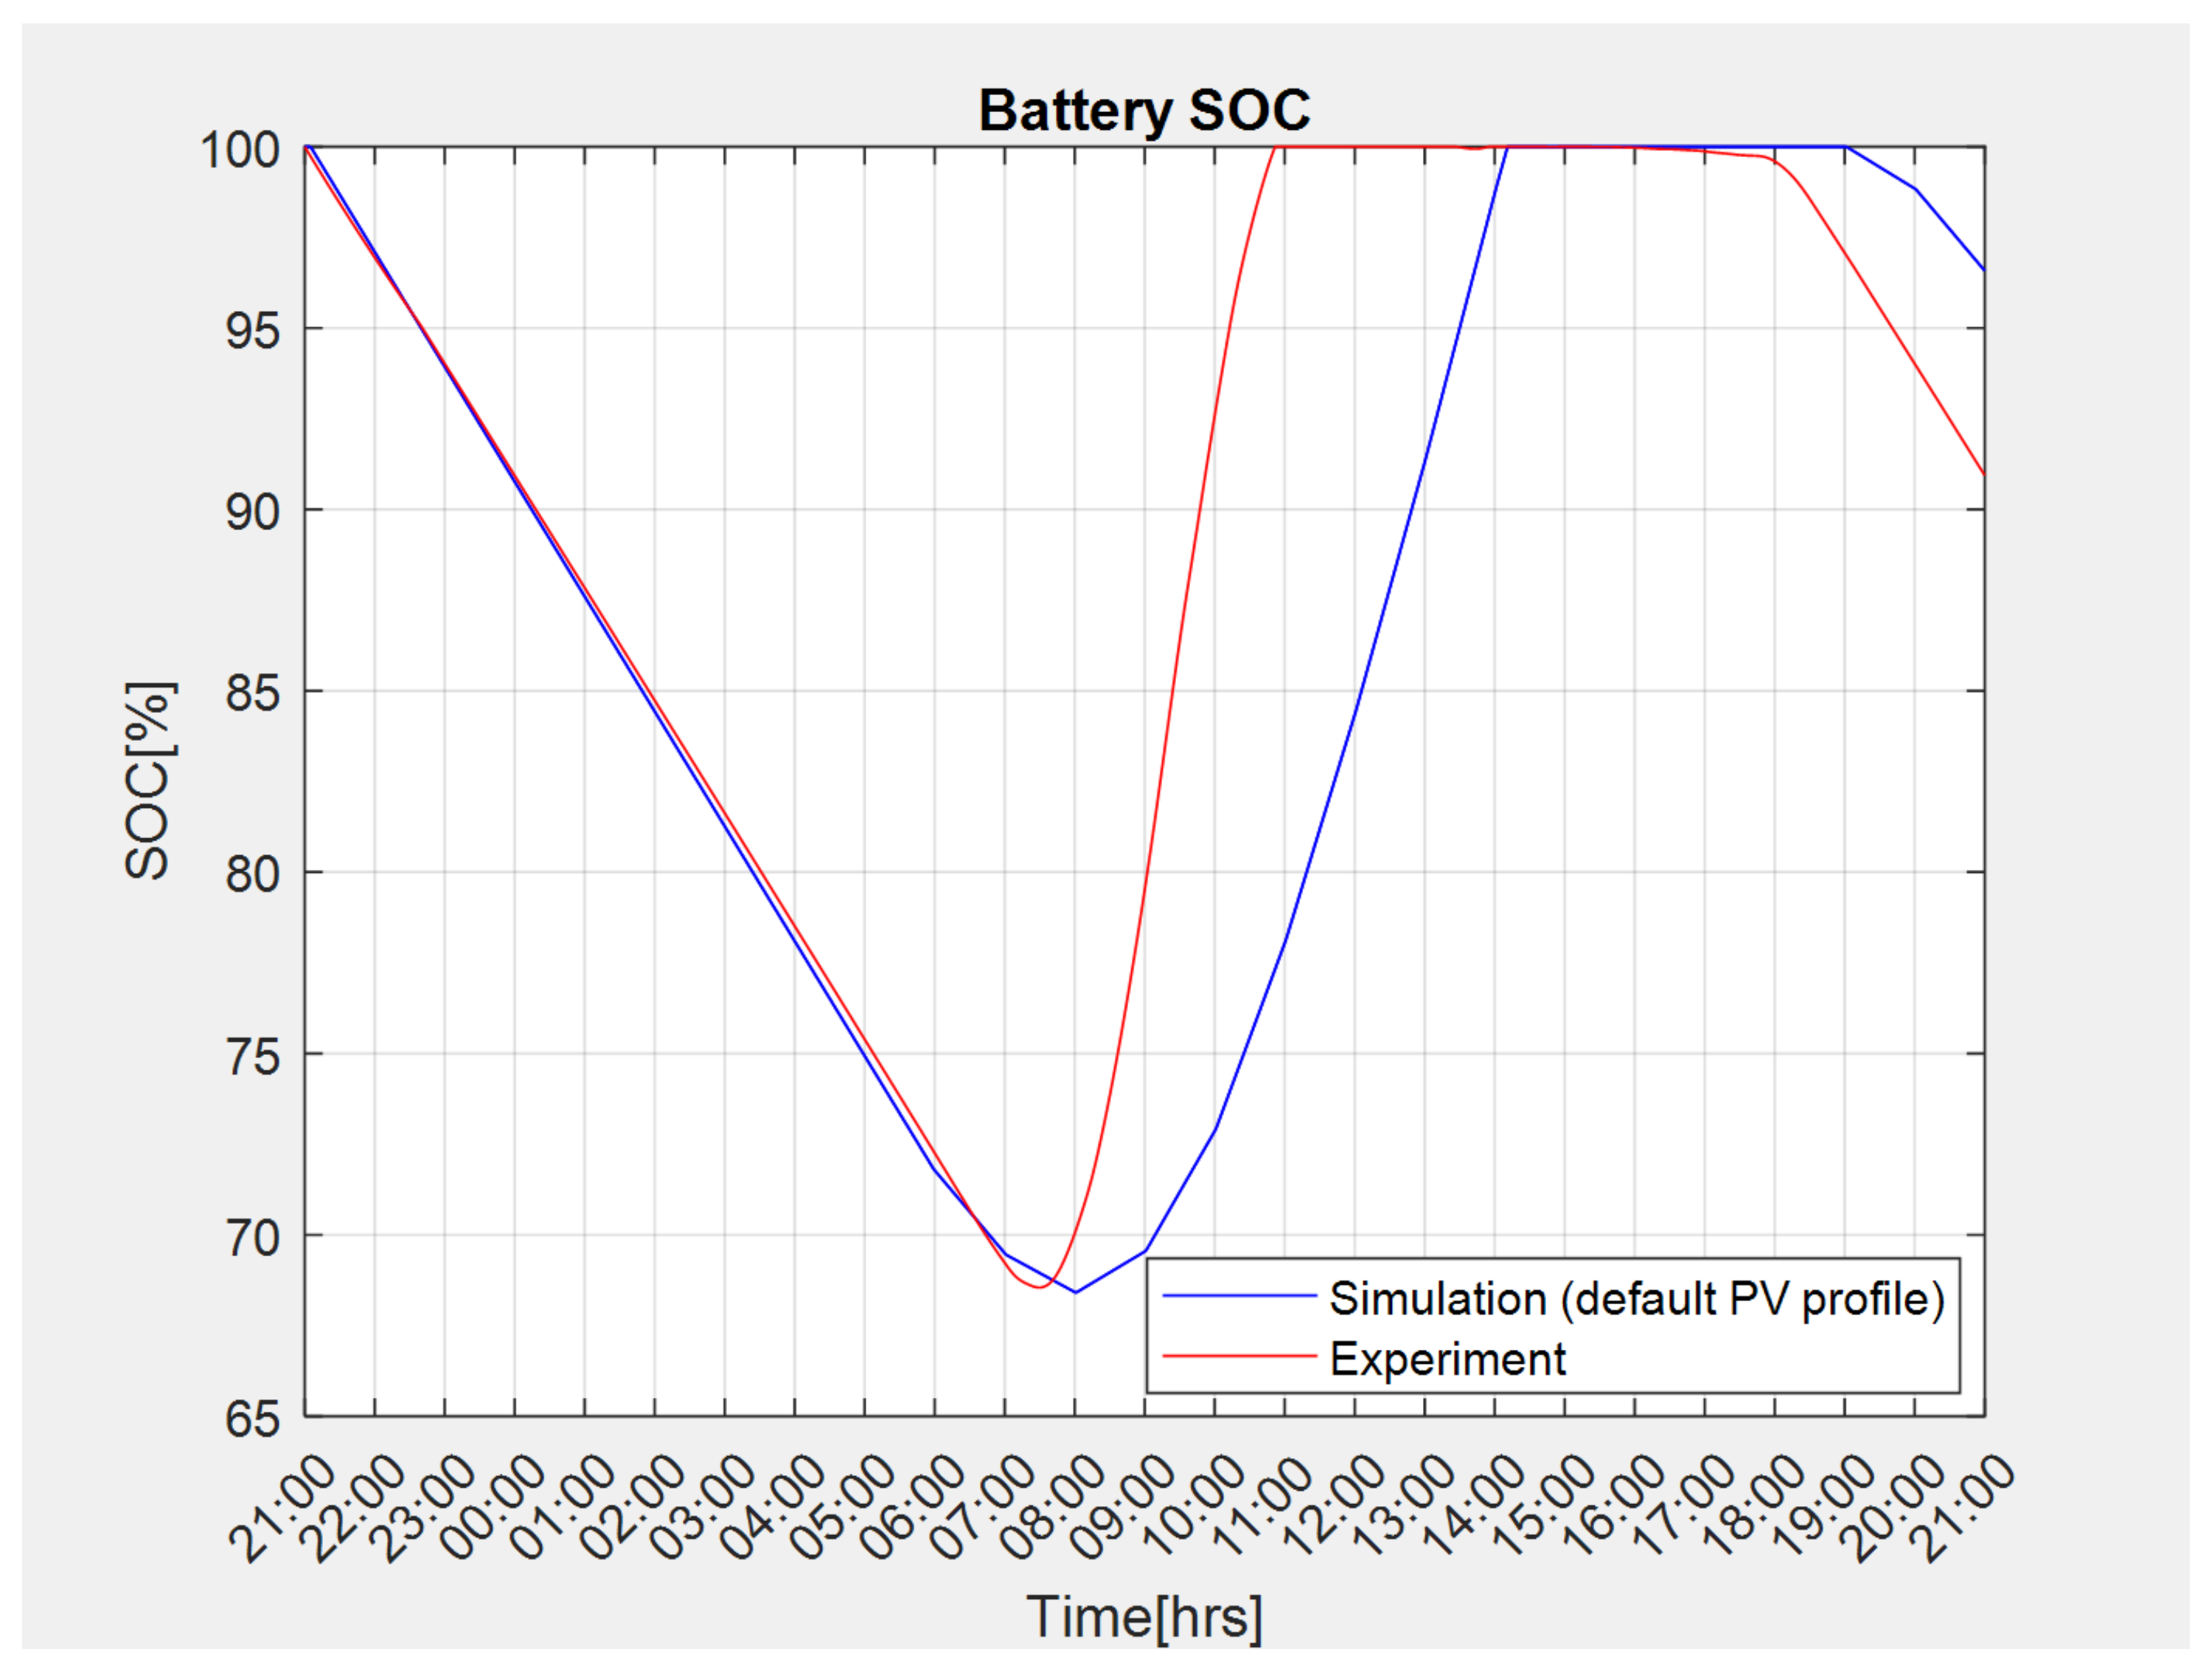
4. Experimental Validation of Design Method and Software

The proposed design method was used to size the COTS components of a small microgrid that was assembled in the laboratory. Experimental measurements on the COTS microgrid were compared to 24 h simulations without and with sunlight.
First, the design method was used to size the batteries of the COTS microgrid shown in Figure 12, which was tested for 24 h without sunlight to simulate either a very cloudy day or a situation where PV panels are damaged. With respect to the input data in Figure 1, the AC load was reduced to 2.9 kWh/day, and the system and battery-voltage were both set to 12 V. An 85% efficient inverter with 12 V rated input and 120 V rated output was used to interface the battery bank to the AC loads. Sealed deep-discharge lead-acid batteries rated at 100 Ah were selected. The design tool output indicated that four batteries could meet the user input’s specifications.
Table 1 shows the measurements acquired during the 24 h experiment, demonstrating the stable operation of the microgrid and the expected decrease in battery output voltage as batteries were depleted. The experimental battery SOC was computed using the Coulomb counting method [43], and it was plotted versus the SOC simulated with the proposed tool in Figure 13. Matching the plot of the battery SOC in the simulation with the one of the experiment validated the design tool. The Coulomb counting method estimates the SOC by measuring the current that is discharged from the battery and integrates it over time. This value is repeatedly subtracted from the initial SOC or, later, the previous SOC value. The experimental SOC could also be obtained using the open-circuit voltage method [43,44] where the linear plot of the battery’s open-circuit voltage V o c and its SOC can be determined from measurements of V o c at 100% SOC when the batteries are fully charged, and the measured V o c at 0% SOC when the batteries are fully discharged. Then, it is straightforward to find the corresponding SOC for any measured V o c [1].
Next, a COTS microgrid was built using the batteries of the previous setup, and PV panels with 16 V MPP voltage and 6.25 A MPP current. AC load input was set to 2.2 kWh/day, A:L to 1.1, and the design tool output indicated that 3 batteries and 12 PV panels were needed to meet the user requirements. The circuit schematic is shown in Figure 3, and the laboratory setup is shown in Figure 14. Maximal power-point tracking (MPPT) modules interfaced with the PV panels, and a 90 W halogen lamp was used as constant load for the 24 h time period. Table 2 shows the acquired current and voltage measurements during the 24 h experiment, demonstrating the stable operation of the microgrid.
The experiment was started at 21:00 to measure the lowest SOC that the battery bank could reach before sunrise. The PV array output current was recorded and is plotted in Figure 15. The battery input current had a similar shape because the outputs of the MPPT modules fed the battery bank, as shown in Figure 3. Figure 16 contrasts the experimental SOC plot with that obtained in simulations using the scaled PV profile in Figure 6.
Although the two curves in Figure 16 are similar, differences are due to discrepancies between the experimental PV profile in Figure 15 and the standard PV profile used in simulation (Figure 6). The experimental PV current rapidly increased, but also decreased very early on the day of testing instead of the gradual current changes of the default PV profile implemented in the Simulink model. Thus, an additional plot, shown in Figure 17, was created by feeding the experimental PV current into the physics-based model to correct the simulations.
The two experiments demonstrated that the design software output correctly sized DERs to meet the user requirements. Furthermore, it output simulated plots that matched those of a generic microgrid, assembled in the laboratory entirely with COTS components. Thus, the implemented physics-based model in the design software was experimentally validated.

5. Conclusions

This paper presented a novel methodology and design software to size DERs for resilient stand-alone back-up microgrids. A design method based on the guidelines in IEEE Standards 1562 [11] and 1013 [10] was presented with all the required equations to size batteries and PV arrays given the user requirements. The method was implemented in a user-friendly software program that can be operated with different levels of knowledge on DER technical specifications, allowing for the timely design of a back-up microgrid with focus on resilience. Critical-load requirements, autonomy, and array-to-load ratio are the input parameters to the software tool that outputs the appropriate DER ratings to obtain the desired performance by the facility’s energy manager based on specified resilience requirements.
Several microgrid-design examples were presented to demonstrate how the proposed method can be used to achieve the user’s resilience goals with a stand-alone microgrid. Specifically, using the software tool, a facility energy manager can simulate potential disruptions to verify that the design could allow for the microgrid to continue to operate through one or multiple disruptions and recover in an acceptable period of time. Examples included obtained simulations with a physics-based model that could run from the design software’s output GUI. Two 24 h laboratory experiments on COTS microgrids validated the design method and physics-based model.
The design software is fully editable and available to research groups for future optimization. A team of engineers is currently conducting research on optimizing different aspects of back-up microgrid design using this methodology, and is porting the design software to Python in order to better provide resilience to critical facilities. The availability of such a methodology and the open-source tool implementation offers a great advantage towards achieving energy security.

Author Contributions

Conceptualization, P.S. and G.O.; methodology, P.S., G.O., and D.L.V.B.; software, P.S.; validation, P.S.; writing—original-draft preparation, P.S. and G.O.; writing—review and editing, G.O. and D.L.V.B. All authors have read and agreed to the published version of the manuscript.

Funding

This research was funded by NAVFAC as part of the Naval Shore Energy Technology Transition Program (NSETTI).

Institutional Review Board Statement

Not applicable.

Informed Consent Statement

Not applicable.

Data Availability Statement

Not applicable.

Acknowledgments

This research is partially supported by the Naval Postgraduate School. Any opinions or findings of this work are the responsibility of the authors, and do not necessarily reflect the views of the sponsors or collaborators. Approved for Public Release; distribution is unlimited.

Conflicts of Interest

The authors declare no conflict of interest.

References

  1. Siritoglou, P. Distributed Energy Storage Design and Modeling to Improve the Energy Security of Naval Facilities. Master’s Thesis, Naval Postgraduate School, Monterey, CA, USA, 2019. [Google Scholar]
  2. Siritoglou, P.; Oriti, G. Distributed Energy Resources Design Method to Improve Energy Security in Critical Facilities. In Proceedings of the IEEE 2020 International Conference on Environment and Electrical Engineering and 2020 IEEE Industrial and Commercial Power Systems Europe (EEEIC/I and CPS Europe), Madrid, Spain, 9–12 June 2020. [Google Scholar]
  3. Paravantis, J.; Kontoulis, N.; Ballis, A.; Tsirigotis, D.; Dourmas, V. A geopolitical review of definitions, dimensions and indicators of energy security. In Proceedings of the 2018 9th International Conference on Information, Intelligence, Systems and Applications (IISA), Zakynthos, Greece, 23–25 July 2018; pp. 1–8. [Google Scholar]
  4. Van Broekhoven, S.; Judson, N.; Nguyen, S.; Ross, W. Microgrid Study: Energy Security for DoD Installations; Technical Report; Massachusetts Inst of Tech Lincoln Lab.: Lexington, MA, USA, 2012. [Google Scholar]
  5. Van Broekhoven, S.; Judson, N.; Galvin, J.; Marqusee, J. Leading the charge: Microgrids for domestic military installations. IEEE Power Energy Mag. 2013, 11, 40–45. [Google Scholar] [CrossRef]
  6. Strategy, D.E. Report of the Defense Science Board Task Force on DoD Energy Strategy “More Fight–Less Fuel”; Technical Report; Office of the Under Secretary of Defense For Acquisition, Technology, and Logistics: Washington, DC, USA, 2008. [Google Scholar]
  7. Peterson, C.J. Systems Architecture Design and Validation Methods for Microgrid Systems. Master’s Thesis, Naval Postgraduate School, Montere, CA, USA, 2019. [Google Scholar]
  8. Giachetti, R.E.; Peterson, C.J.; Van Bossuyt, D.L.; Parker, G.W. Systems Engineering Issues in Microgrids for Military Installations. In INCOSE International Symposium; Wiley Online Library: New York, NY, USA, 2020; Volume 30, pp. 731–746. [Google Scholar]
  9. Peters, J.W. In the Virgin Islands, Hurricane Maria Drowned What Irma Didn’t Destroy. New York Times, 27 September 2017. [Google Scholar]
  10. IEEE. IEEE Guide for Array and Battery Sizing in Stand-Alone Photovoltaic (PV) Systems; Standard IEEE Std 1562-2007; IEEE: Washington, DC, USA, 2008. [Google Scholar]
  11. IEEE. IEEE Recommended Practice for Sizing Lead-Acid Batteries for Stand-Alone Photovoltaic (PV) Systems; Standard IEEE Std 1013-2019; IEEE: Washington, DC, USA, 2019. [Google Scholar]
  12. Panagiotou, K.; Klumpner, C.; Sumner, M. Sizing guidelines for grid-connected decentralised energy storage systems: Single house application. J. Eng. 2019, 2019, 3802–3806. [Google Scholar] [CrossRef]
  13. Mehrtash, M.; Capitanescu, F.; Heiselberg, P.K.; Gibon, T.; Bertrand, A. An Enhanced Optimal PV and Battery Sizing Model for Zero Energy Buildings Considering Environmental Impacts. IEEE Trans. Ind. Appl. 2020, 56, 6846–6856. [Google Scholar] [CrossRef]
  14. Bandyopadhyay, S.; Mouli, G.C.; Qin, Z.; Elizondo, L.R.; Bauer, P. Techno-economical model based optimal sizing of pv-battery systems for microgrids. IEEE Trans. Sustain. Energy 2019, 11, 1657–1668. [Google Scholar] [CrossRef]
  15. Rodríguez-Gallegos, C.D.; Gandhi, O.; Yang, D.; Alvarez-Alvarado, M.S.; Zhang, W.; Reindl, T.; Panda, S.K. A siting and sizing optimization approach for PV–battery–diesel hybrid systems. IEEE Trans. Ind. Appl. 2017, 54, 2637–2645. [Google Scholar] [CrossRef]
  16. Nikhil, P.; Subhakar, D. Sizing and parametric analysis of a stand-alone photovoltaic power plant. IEEE J. Photovoltaics 2013, 3, 776–784. [Google Scholar] [CrossRef]
  17. Jain, D.; Sandeep, N.; Verma, A.K.; Yaragatti, U.R. A Simple Methodology for Sizing of Stand-Alone PV-Battery System. In Proceedings of the 2019 8th International Conference on Power Systems (ICPS), Jaipur, India, 20–22 December 2019; pp. 1–5. [Google Scholar]
  18. Diab, A.A.Z.; Sultan, H.M.; Mohamed, I.S.; Kuznetsov, O.N.; Do, T.D. Application of different optimization algorithms for optimal sizing of PV/wind/diesel/battery storage stand-alone hybrid microgrid. IEEE Access 2019, 7, 119223–119245. [Google Scholar] [CrossRef]
  19. Masters, G.M. Renewable and Efficient Electric Power Systems; John Wiley and Sons: Hoboken, NJ, USA, 2013. [Google Scholar]
  20. Keesee, C.W. Realizing Energy Security on a DoD Installation Using Photovoltaics with a Battery Energy Storage System. Master’s Thesis, Naval Postgraduate School, Monterey, CA, USA, 2018. [Google Scholar]
  21. Ali, W.; Farooq, H.; Rehman, A.U.; Awais, Q.; Jamil, M.; Noman, A. Design considerations of stand-alone solar photovoltaic systems. In Proceedings of the 2018 International Conference on Computing, Electronic and Electrical Engineering (ICE Cube), Quetta, Pakistan, 12–13 November 2018; pp. 1–6. [Google Scholar]
  22. Dong, J.; Zhu, L.; Su, Y.; Ma, Y.; Liu, Y.; Wang, F.; Tolbert, L.M.; Glass, J.; Bruce, L. Battery and backup generator sizing for a resilient microgrid under stochastic extreme events. IET Gener. Transm. Distrib. 2018, 12, 4443–4450. [Google Scholar] [CrossRef]
  23. Lai, K.; Wang, Y.; Shi, D.; Illindala, M.S.; Jin, Y.; Wang, Z. Sizing battery storage for islanded microgrid systems to enhance robustness against attacks on energy sources. J. Mod. Power Syst. Clean Energy 2019, 7, 1177–1188. [Google Scholar] [CrossRef] [Green Version]
  24. Zhang, B.; Dehghanian, P.; Kezunovic, M. Optimal allocation of PV generation and battery storage for enhanced resilience. IEEE Trans. Smart Grid 2017, 10, 535–545. [Google Scholar] [CrossRef]
  25. Chatterji, E.; Bazilian, M.D. Battery Storage for Resilient Homes. IEEE Access 2020, 8, 184497–184511. [Google Scholar] [CrossRef]
  26. Homer Energy LLC. Homer Grid. Available online: https://www.homerenergy.com/products/pro/docs/3.11/index.html (accessed on 1 August 2020).
  27. National Renewable Energy Laboratory (NREL). System Advisor Model (SAM). Available online: http://sam.nrel.org (accessed on 1 August 2020).
  28. Sandia National Laboratories. Microgrid Design Toolkit. Available online: https://www.sandia.gov/CSR/tools/mdt.html (accessed on 1 August 2020).
  29. XENDEE. XENDEE Microgrid Design Platform. Available online: https://www.xendee.com/ (accessed on 1 August 2020).
  30. Pajkic, N.; Kragh, M.; Yang, J.; Wijeratne Mudiyanselage, P.; Wijeratne Mudiyanselage, P.; Too, E.; Wakefield, R.; Eisenlohr, J.; Boddaert, S.; Bonomo, P.; et al. BIPV Design and Performance Modelling: Tools and Methods. 2019. Available online: https://repository.supsi.ch/12051/ (accessed on 1 August 2020).
  31. Lithium Battery Company. LiFePO4 vs. SLA-12V100AH testing report. Unpublished.
  32. National Renewable Energy Laboratory (NREL). National Solar Radiation Database. Available online: https://nsrdb.nrel.gov/ (accessed on 1 August 2020).
  33. Anglani, N.; Oriti, G.; Colombini, M. Optimized energy management system to reduce fuel consumption in remote military microgrids. IEEE Trans. Ind. Appl. 2017, 53, 5777–5785. [Google Scholar] [CrossRef]
  34. RELiON Batteries. RB 48V 200 Li-Ion battery. Available online: https://relionbattery.com/products/lithium/rb48v200 (accessed on 1 August 2020).
  35. SunPower Corporation. X-Series X22-360 Commercial Solar Panel, 514617. Available online: https://us.sunpower.com/ (accessed on 1 August 2020).
  36. Glavin, M.; Chan, P.K.; Armstrong, S.; Hurley, W. A stand-alone photovoltaic supercapacitor battery hybrid energy storage system. In Proceedings of the 2008 13th International Power Electronics and Motion Control Conference, Poznan, Poland, 1–3 September 2008; pp. 1688–1695. [Google Scholar]
  37. Bessani, M.; Massignan, J.A.D.; Fanucchi, R.Z.; Camillo, M.H.M.; London, J.B.A.; Delbem, A.C.B.; Maciel, C.D. Probabilistic Assessment of Power Distribution Systems Resilience Under Extreme Weather. IEEE Syst. J. 2019, 13, 1747–1756. [Google Scholar] [CrossRef]
  38. Mishra, S.; Anderson, K.; Miller, B.; Boyer, K.; Warren, A. Microgrid resilience: A holistic approach for assessing threats, identifying vulnerabilities, and designing corresponding mitigation strategies. Appl. Energy 2020, 264, 114726. [Google Scholar] [CrossRef] [Green Version]
  39. Billinton, R.; Fotuhi-Firuzabad, M.; Bertling, L. Bibliography on the application of probability methods in power system reliability evaluation 1996–1999. IEEE Trans. Power Syst. 2001, 16, 595–602. [Google Scholar] [CrossRef]
  40. Hosseini, S.; Barker, K.; Ramirez-Marquez, J.E. A review of definitions and measures of system resilience. Reliab. Eng. Syst. Saf. 2016, 145, 47–61. [Google Scholar] [CrossRef]
  41. Madni, A.M.; Jackson, S. Towards a Conceptual Framework for Resilience Engineering. IEEE Syst. J. 2009, 3, 181–191. [Google Scholar] [CrossRef]
  42. Mahzarnia, M.; Moghaddam, M.P.; Baboli, P.T.; Siano, P. A Review of the Measures to Enhance Power Systems Resilience. IEEE Syst. J. 2020, 14, 4059–4070. [Google Scholar] [CrossRef]
  43. Chang, W.Y. The state of charge estimating methods for battery: A review. Int. Sch. Res. Not. 2013, 2013, 953792. [Google Scholar] [CrossRef]
  44. Chiasson, J.; Vairamohan, B. Estimating the state of charge of a battery. In Proceedings of the 2003 American Control Conference, Denver, CO, USA, 4–6 June 2003; Volume 4, pp. 2863–2868. [Google Scholar]
Figure 1. Input user interface in manual mode—Design Example 1.
Energies 14 02773 g001
Figure 2. Output GUI from design software—Design Example 1.
Energies 14 02773 g002
Figure 3. Architecture of commercial off-the-shelf (COTS) microgrid.
Energies 14 02773 g003
Figure 4. PV current = 0; load and battery currents were identical for the first simulated scenario without sunlight.
Energies 14 02773 g004
Figure 5. Battery SOC in scenario without sunlight.
Energies 14 02773 g005
Figure 6. Load and PV currents for scenario with sunlight.
Energies 14 02773 g006
Figure 7. Load and battery currents in scenario with sunlight. I b a t t e r y was positive coming out of the battery, and negative when charging the battery.
Energies 14 02773 g007
Figure 8. Battery SOC in scenario with sunlight.
Energies 14 02773 g008
Figure 9. Battery SOC (A:L = 1.1 vs. A:L = 1.3).
Energies 14 02773 g009
Figure 10. Battery state of charge over 14 day period with 50% PV disruption occurring on Day 1 and PV returning to full capacity occurring on Day 4. Battery regained full charge state at 4.6 days after PV returned to full capacity.
Energies 14 02773 g010
Figure 11. Battery state of charge over 14 day period with 50% PV disruption and A:L = 1.4 occurring on Day 1 and PV return to full capacity occurring on Day 4. Battery regained full charge state at 1.8 days after PV returned to full capacity. Recovery time was 5.8 days.
Energies 14 02773 g011
Figure 12. Laboratory experiment setup for the scenario without PV output. cyanMajor elements were identified and included AC loads, inverter, batteries, and a variety of test hardware.
Energies 14 02773 g012
Figure 13. Comparison of simulated and measured battery SOC for scenario without sunlight.
Energies 14 02773 g013
Figure 14. Laboratory setup for 24 h with sunlight. (top) Major identified elements including AC loads, inverter, batteries, MPPTs, and a variety of test hardware. (bottom) Deployed PV array.
Energies 14 02773 g014
Figure 15. PV array output current.
Energies 14 02773 g015
Figure 16. Experimental and simulated battery SOC in scenario with sunlight using ideal PV current.
Energies 14 02773 g016
Figure 17. Experimental and simulated battery SOC in scenario with sunlight using experimental PV current.
Energies 14 02773 g017
Table 1. Summary of laboratory measurements w/o sunlight.
Time (h:min)DC Current (A)AC Current rms (A)DC Voltage (V)AC Voltage rms (V)
1:2011.230.99912.54119.8
9:3011.560.99912.29119.8
19:0012.040.99911.88119.6
23:0012.241.00211.70119.9
Table 2. Summary of laboratory measurements with sunlight.
Time (h:min)DC Current (A)AC Current rms (A)DC Voltage (V)AC Voltage rms (V)
21:238.900.75212.68119.8
06:568.960.76012.45119.7
11:198.600.75314.44120.0
16:058.730.75613.88119.9
18:388.820.75312.91119.5
21:078.900.75512.76119.7
Publisher’s Note: MDPI stays neutral with regard to jurisdictional claims in published maps and institutional affiliations.

