Article

Experimental Investigation on the Characteristic Mobilization and Remaining Oil Distribution under CO2 Huff-n-Puff of Chang 7 Continental Shale Oil

1
College of Petroleum Engineering, Xi’an Shiyou University, Xi’an 710065, China
2
Shaanxi Key Laboratory of Well Stability and Fluid & Rock Mechanics in Oil and Gas Reservoirs, Xi’an Shiyou University, Xi’an 710065, China
*
Authors to whom correspondence should be addressed.
Energies 2021, 14(10), 2782; https://doi.org/10.3390/en14102782
Submission received: 12 March 2021 / Revised: 28 April 2021 / Accepted: 30 April 2021 / Published: 12 May 2021
(This article belongs to the Special Issue Advances in Shale Oil and Shale Gas Technologies)

Abstract

:
The Chang 7 continental shale oil reservoir is tight. The recovery factor is extremely low, the remaining oil is very high, and injecting water to improve oil recovery effectiveness is too hard. Therefore, in this paper, physical simulation experiments of CO2 huff-n-puff shale oil and NMR tests were conducted to study the cycle numbers and permeability on the recovery degree, as well as the characteristics of shale oil mobilization and the remaining oil micro distribution. The results showed that the cumulative oil recovery factors (ORFs) gradually increased in the natural logarithmic form, the single cycle ORFs decreased rapidly in exponential form with the huff-n-puff cycle number, and the biggest economic cycle numbers were between approximately 3 and 5. Furthermore, the higher the permeability, the higher the ORF, but the difference of ORF decreased between the two experimental samples with the cycles. In addition, the gap of production and recovery degree was large between the different scale pores, the ORF of macropores was 6–8 times that of micropores, and the final remaining oil was mainly distributed in the micropores, accounting for 82.29% of the total amount; meanwhile, the macropores comprised less than 0.5%. In the process of huff-n-puff, CO2 flowed into macropores, mesopores, and smallpores under the pressure differential effect, but a small amount of CO2 slowly diffused into micropores, resulting in the ORF of the former with more free oil being higher and the ORF of micropores with more adsorbed oil being lower. Therefore, promoting a better contact and reaction between CO2 and shale oil of micropores is one of the key ways to effectively develop the Chang 7 continental shale oil and enhance oil recovery.

1. Introduction

In recent years, global oil and gas consumption has been increasing. However, the remaining reserves of conventional resources have decreased with exploration and development, resulting in a scarcity of energy. As a result, unconventional resources (such as tight/shale oil and gas) will play an extremely significant role in the petroleum industry. According to the assessment results of the US Energy Information Administration (EIA, 2019), the technical recoverable resources of shale oil in the world are about 473 × 108 t, and the US shale oil production reached 3.20 × 10⁸ t, which accounted for 64.7% of the total oil production in 2018 [1,2]. The exploration results showed that China has abundant shale oil geological reserves of 1420 × 108 t, and the amount of medium and high maturity continental shale oil with good development prospects is about 200 × 108 t [3,4,5]. However, there are issues regarding depletion developments, such as the low production of an individual well, rapid decline, and ultra-low recovery (generally below 10%) [6,7]. Therefore, there is imperative to investigate enhanced oil recovery (EOR) technology for the further development of shale oil reservoirs.
Compared with water flooding, injecting gas can improve shale oil recovery because the viscosity of water is higher than gas, and shale oil reservoirs have ultra-low porosity and permeability characteristics, as well as containing a higher clay content that is prone to absorb water and expand. These factors result in a high injection pressure and a low water injection. Sheng et al. [8,9] simulated different water and gas injection schemes combined with the field production data of shale reservoirs. The results showed that whatever the waterflooding, the water injection volume and recovery factor were very low, but the effect of gas injection was better. Additionally, the recovery factor of gas huff-n-puff was higher than continuous injection, and the difference between them could be as high as 32.46%, which indicated that gas huff-n-puff was a more effective development technology suitable for shale reservoirs. However, for selecting an appropriate gas, Khalid E., Gamadi, and Jia B. et al. [10,11,12,13,14] made comparative analyses of the development effects for multiple factors through physical simulation laboratory experiments, such as injection gas (such as CO2, N2, C1, and C2), displacement methods (such as gas flooding, huff-n-puff, and WAG), shut-in time, cycle numbers, injection pressure, production time. The results showed that the ORF of CO2 injection was better than others and improved about 10–50%. Furthermore, CO2 has the characteristics of a wide distribution, safety, and reliability. Additionally, it has great environmental and social significance to inject CO2 into a shale oil reservoir, which can alleviate the greenhouse effect to a certain extent.
The mechanism of CO2 EOR in tight/shale reservoirs has been investigated by numerous studies. Weijermars R. and Nandlal K. et al. [15] suggested that one of the principal mechanisms of EOR by gas injection is pressurizing the dead fluid zones between fractures, and the minimum miscibility pressure (MMP) between CO2 and oil may be reached with reservoirs deeper than 3000 ft. Additionally, huff-n-puff CO2 EOR is best applied in shale wells when the transition of the flow regime presented on diagnostic plots occurs. Ho Tuan A. and Wang Y. [16] used the molecular dynamics simulation method to find that supercritical CO2 can affect shale oil in both inorganic and organic nanopores, but water only works in inorganic nanopores. H. Yu [17] found that CO2 huff-n-puff could more effectively improve oil recovery for shale with an ultra-low permeability through the numerical simulation method. Gamadi and Li L. et al. [18,19] used a component simulator to analyze the effects of reservoir heterogeneity, soaking time, injection pressure, and huff-n-puff cycles on EOR. Wan et al. [20,21] indicated that molecular diffusion was the significant mechanism of EOR via a CO2 injection numerical simulation with single porosity model and dual permeability model in Eagle Ford shale oil. Gamadi et al. [22] carried out CO2 huff-n-puff experiments and decided that diffusion and dragging were the important mechanisms of EOR based on Mancos and Eagle Ford shale core. For the reservoir characteristics of tight/shale oil in China, Zhang Y., Wei B., and X. Wang [23,24,25] carried out experiments to show that CO2 huff-n-puff could effectively improve production degree.
Though numerous studies have shown that CO2 huff-n-puff is an efficient EOR technology for shale reservoirs, few studies have investigated the production and remaining oil distribution characteristics in natural bedding, micro-fractures, and matrix micro-nano pores. Additionally, the T2 spectrum curve of the relationship between transverse relaxation time and nuclear magnetic signal intensity tested by NMR can quantitatively describe the crude oil content in pores with different sizes. Therefore, NMR has become an effective method to describe the fluid flow in the pores of unconventional reservoirs after CO2 huff-n-puff. In this paper, SEM images were used to analyze the pore structure types and features of Chang 7 continental shale cores. Next, we studied the influence of recovery degree with different cycles and permeabilities through CO2 huff-n-puff lab experiments on continental shale oil and analyzed the pore volume proportions of different scales and the microscopic characteristics of shale oil production and remaining oil distribution combined with the NMR T2 spectrum curves. These can provide theoretical guidance for CO2 huff-n-puff to enhance shale oil recovery.

2. Fundamental Theory

2.1. Pore Radius Conversion Theory Based on NMR

NMR is a physical process of absorbing a certain radio frequency (RF) that is radiation-resonated, and the resonance is generated when an external magnetic field acts on a nucleus of non-zero magnetic distance to result in the nucleus being self-rotated to cause Zeeman splitting. The T2 spectrum of transverse relaxation time could be obtained by detecting NMR signals in the pores containing oil and water. Then, the fluid distribution in different pore sizes is obtained by a mathematical inversion calculation. In a uniform magnetic field, the formula for T2 can be expressed as the following equation:
1 T 2 = 1 T 2 D + 1 T 2 B + 1 T 2 S = D γ G T E 2 12 + 1 T 2 B + ρ S V
where T2 is the total pore fluid transverse relaxation time (ms), T2D is the diffusion relaxation time (ms), T2B is the volume relaxation time that is determined by the self-properties of the fluid (ms), T2S is the surface relaxation time that is related to the pore structure (ms), ρ is the transverse surface relaxivity (μm/ms), S is the pore surface area (μm2), V is the pore volume (μm3), D is the diffusion coefficient (cm2/s), γ is the nuclear gyromagnetic ratio, G is the magnetic field gradient (Guss/cm), and TE is the echo spacing of measurement sequence (ms).
In lab NMR tests, the magnetic field of sets can be nearly uniform, and the magnetic field and echo spacing of measurement sequence can be too small. In this case, the diffusion relaxation 1/T2D can be neglected. Moreover, the volume relaxation time T2B depends on the self-properties of fluids. For specific liquids with a low viscosity such as water and light oil, the T2B is very long and a constant under a specific condition. Additionally, the surface relaxation time T2S is proportional to the pore radius, and the pore radius of shale is mainly at the nano and micro scales, resulting in the surface relaxation time T2S being extremely low in shale core. Generally, the volume relaxation time T2B is much larger than the surface relaxation time T2S in shale rock, which means that the 1/T2B can also be neglected [26]. Therefore, Equation (1) can be simplified as follows [27]:
1 T 2 = ρ 2 S V = ρ 2 F S r
where Fs is the dimensionless pore shape factor and r is the pore radius (μm). Equation (2) shows that the T2 value is directly proportional to the pore radius r. A previous study [28] found that the relationship between T2 value and pore radius r is a power function according to a large number of experimental data statistics, as seen in the following equation:
r = C T 2 n
where C and n are the coefficients that can be obtained by conversion from high pressure mercury injection data.

2.2. Relationship between T2 Spectrum and the Remaining Oil Content

An NMR T2 spectrum is a relationship curve between transverse relaxation time T2 and NMR signal amplitude. The envelope area of the curve is the total NMR signal amplitude within a certain transverse relaxation time range, which reflects the quantity of 1H in fluid. The integral area of a T2 spectrum curve has the following relationship with the mass of fluid in rock:
m o = α S T 2
where mo is the fluid mass (g), S(T2) is the integral area of the T2 spectrum curve comprising the total NMR signal amplitude, and α is the coefficient determined by experiment. The difference of integral areas under the two T2 spectrum curves is the change of fluid mass in the specimen, as shown in Figure 1. Curves 1 and 2 are oil-bearing T2 spectrum curves before and after the experiment, respectively. The yellow part is the integral area difference between the two curves. Then, the change of oil mass is:
Δ m = m 1 m 2 = α S 1 T 2 α S 2 T 2
Then the recovery degree η can be calculated as follows:
η = Δ m m 1 × 100 % = S 1 T 2 S 2 T 2 S 1 T 2 × 100 %
Therefore, after combining the relationship between rock pore radius and transverse relaxation time in Equation (3), one could analyze and calculate the distribution, producing degree, and remaining oil content of shale oil of different pore sizes.

3. Experiments

3.1. Materials

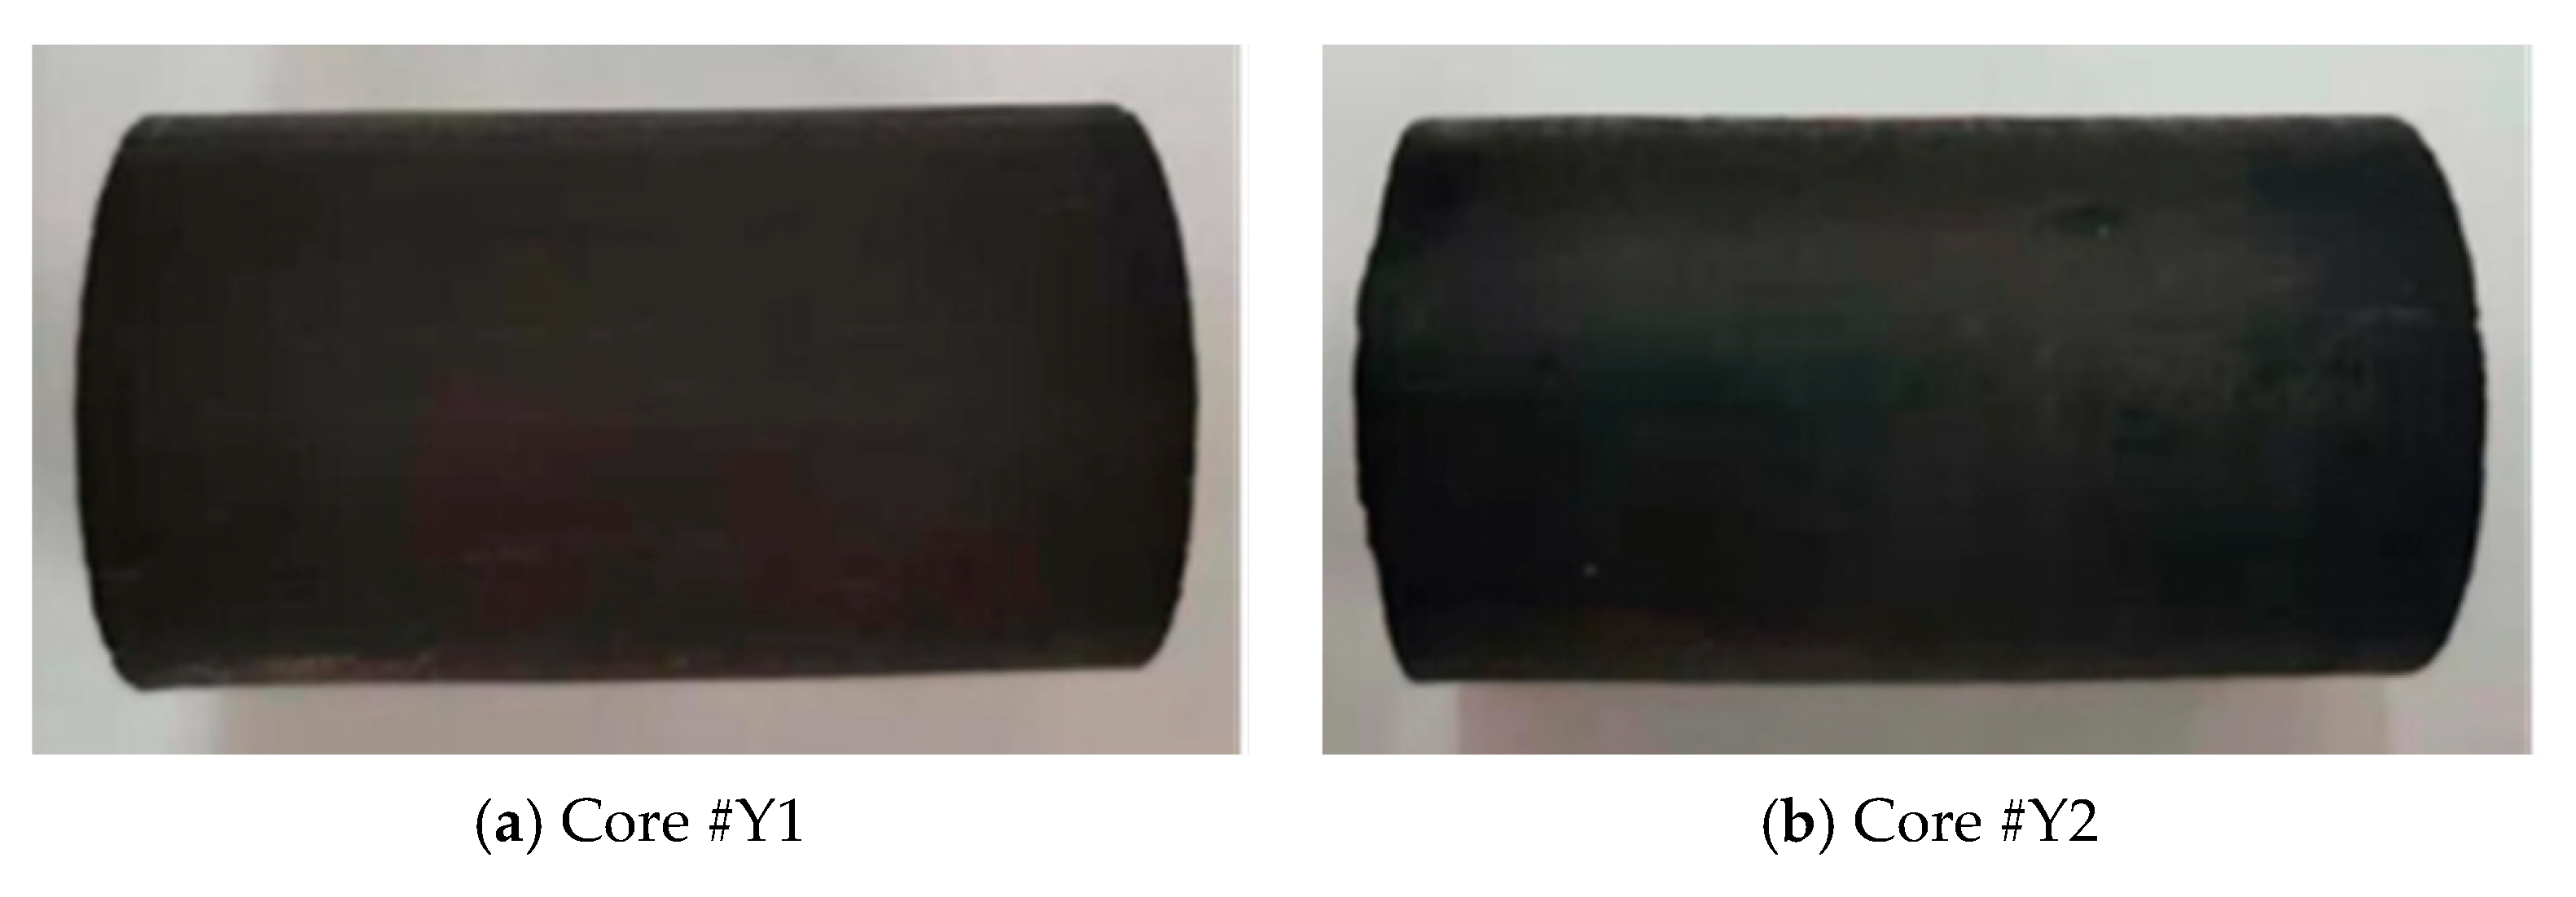
The experimental core samples in Figure 2 were drilled in the Yanchang 7th Formation of Triassic in Ordos Basin. The continental shale of Chang 7 is a set of source rock series that are mainly composed of shale formed in the heyday of Late Triassic lake basin development. Though the two cores were cut from the same rock specimen, there was still a permeability difference due to the strong reservoir heterogeneity in the shale. Table 1 displays the properties of the core samples.
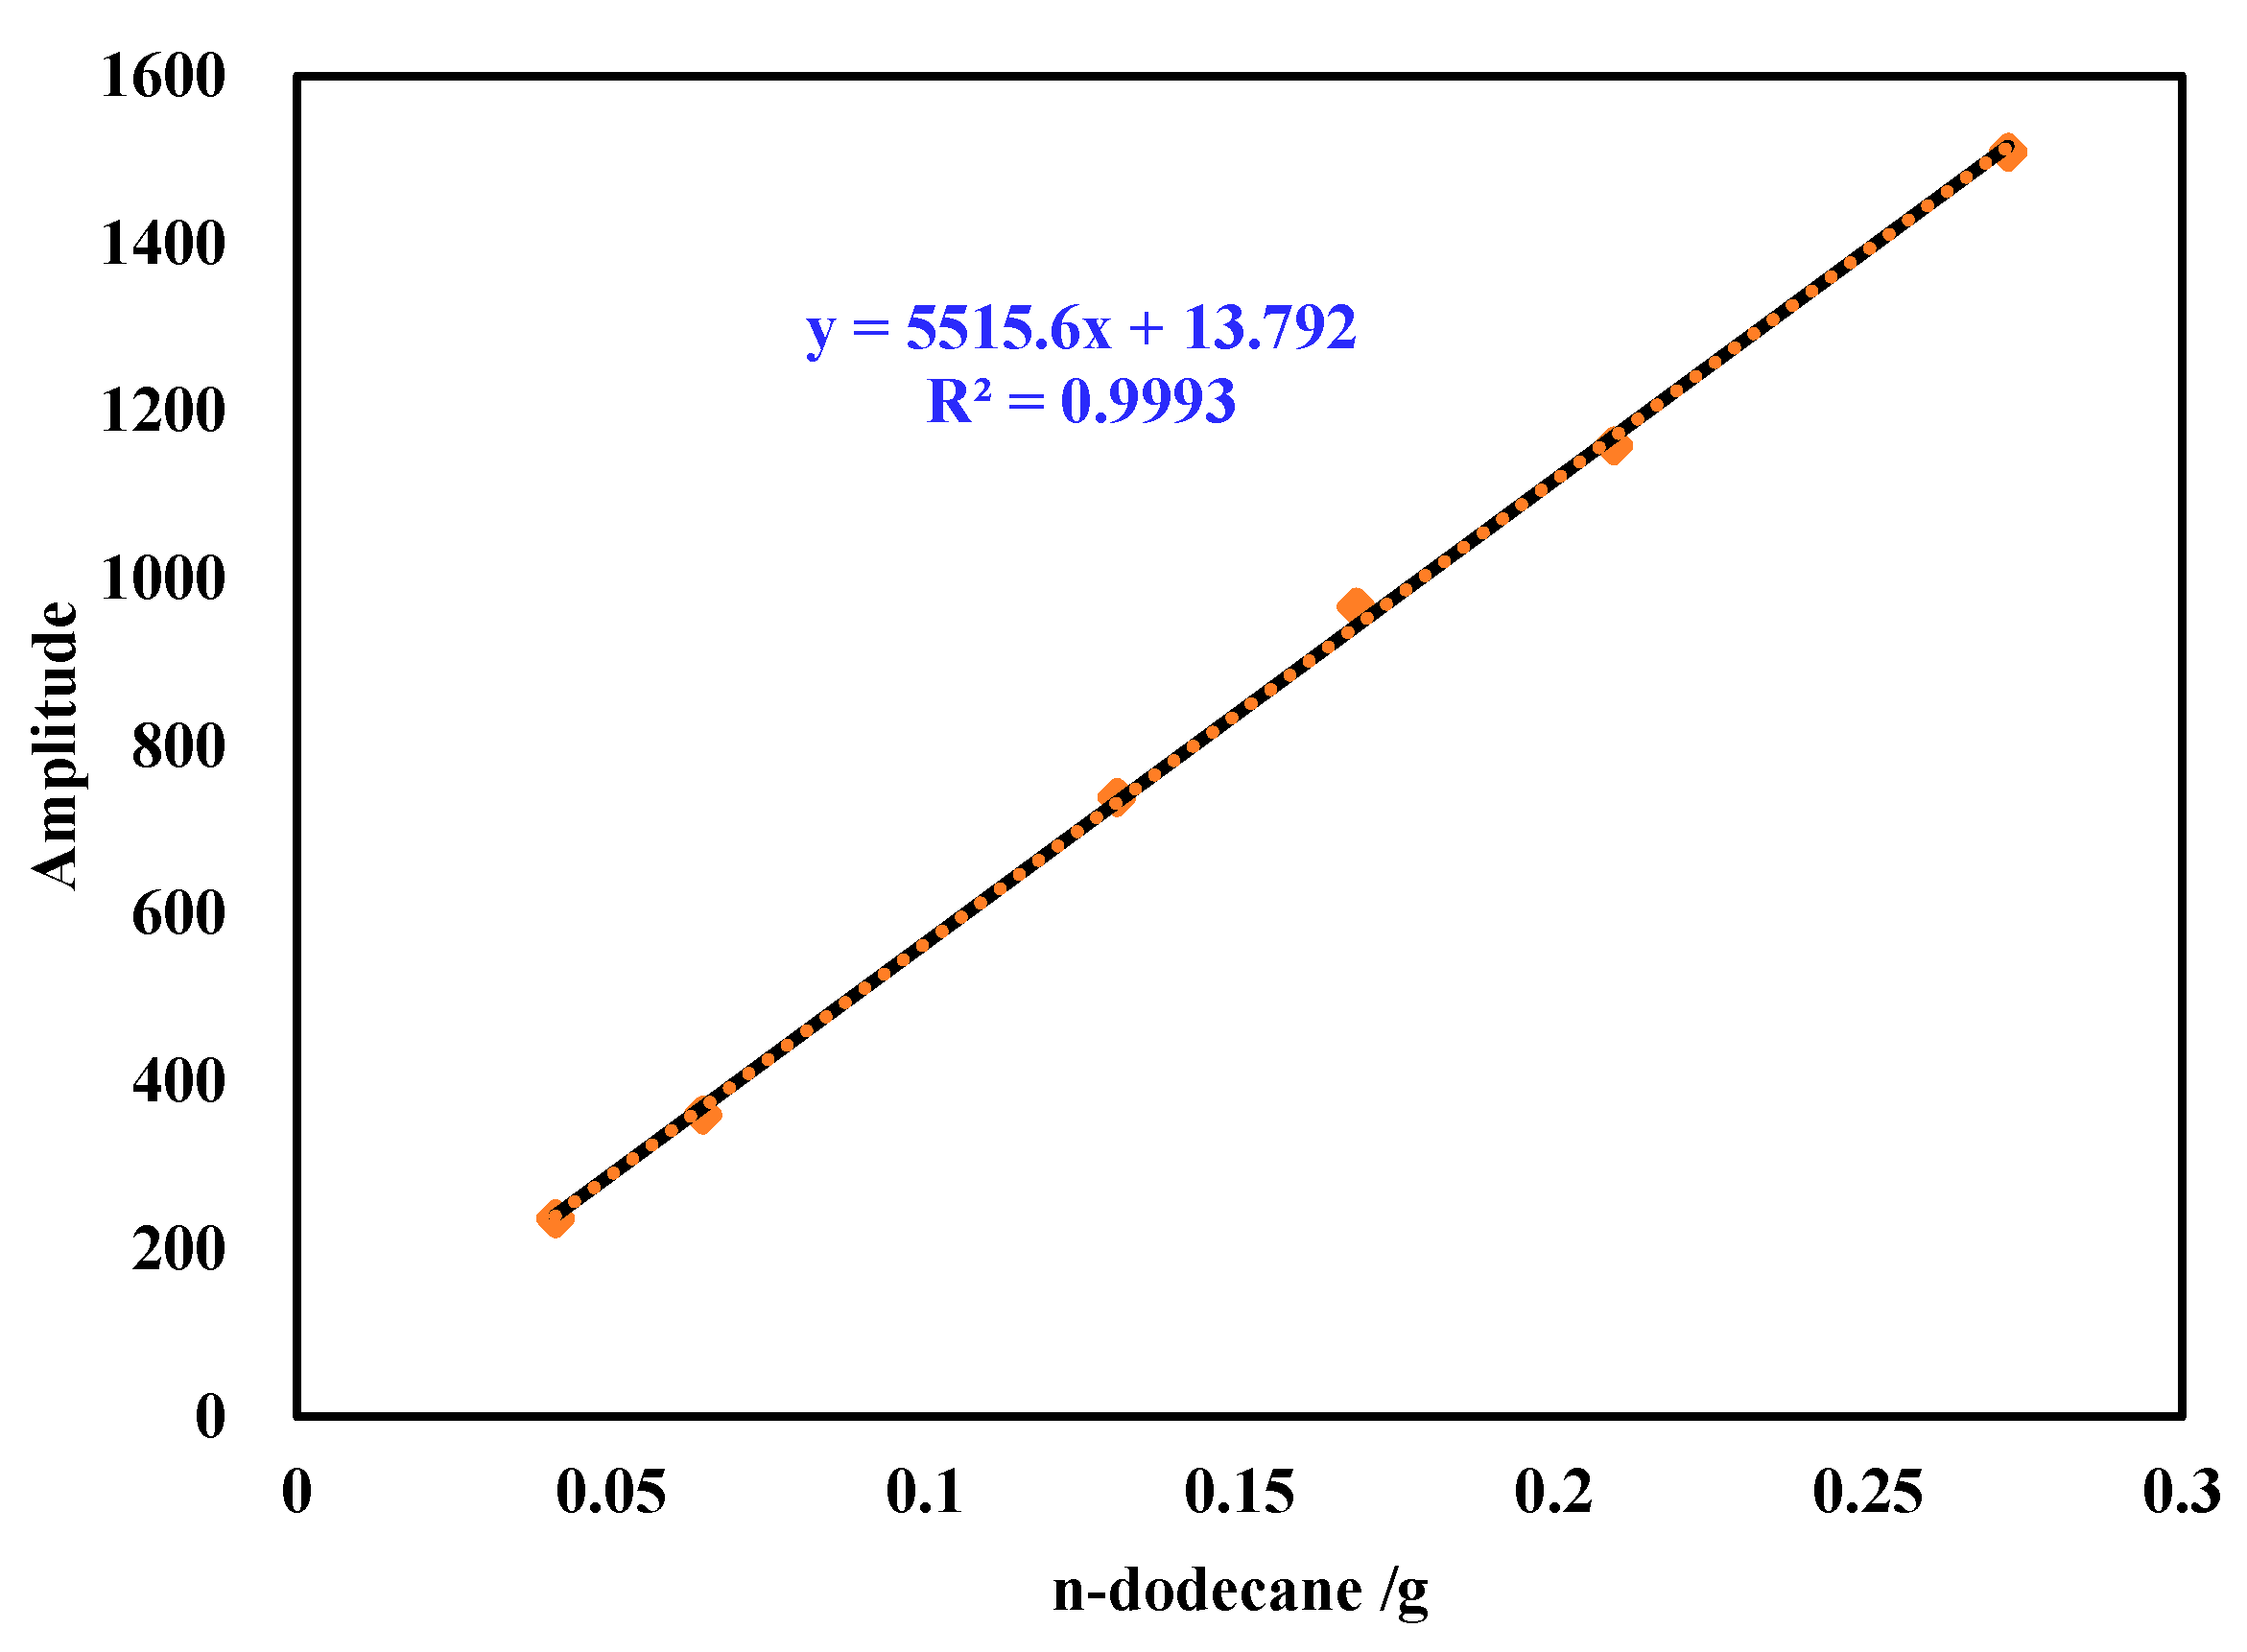
The oil used in this study was n-dodecane with a density of 0.7487 g/cm3 and a viscosity of 1.508 mPa·s at 25 °C, and the calibration curve between n-dodecane and NMR signal amplitude is shown in Figure 3. The CO2 was from Suzhou Chenggong Co. Ltd., Suzhou, China, with a purity of 99.9%.

3.2. Experimental Apparatus

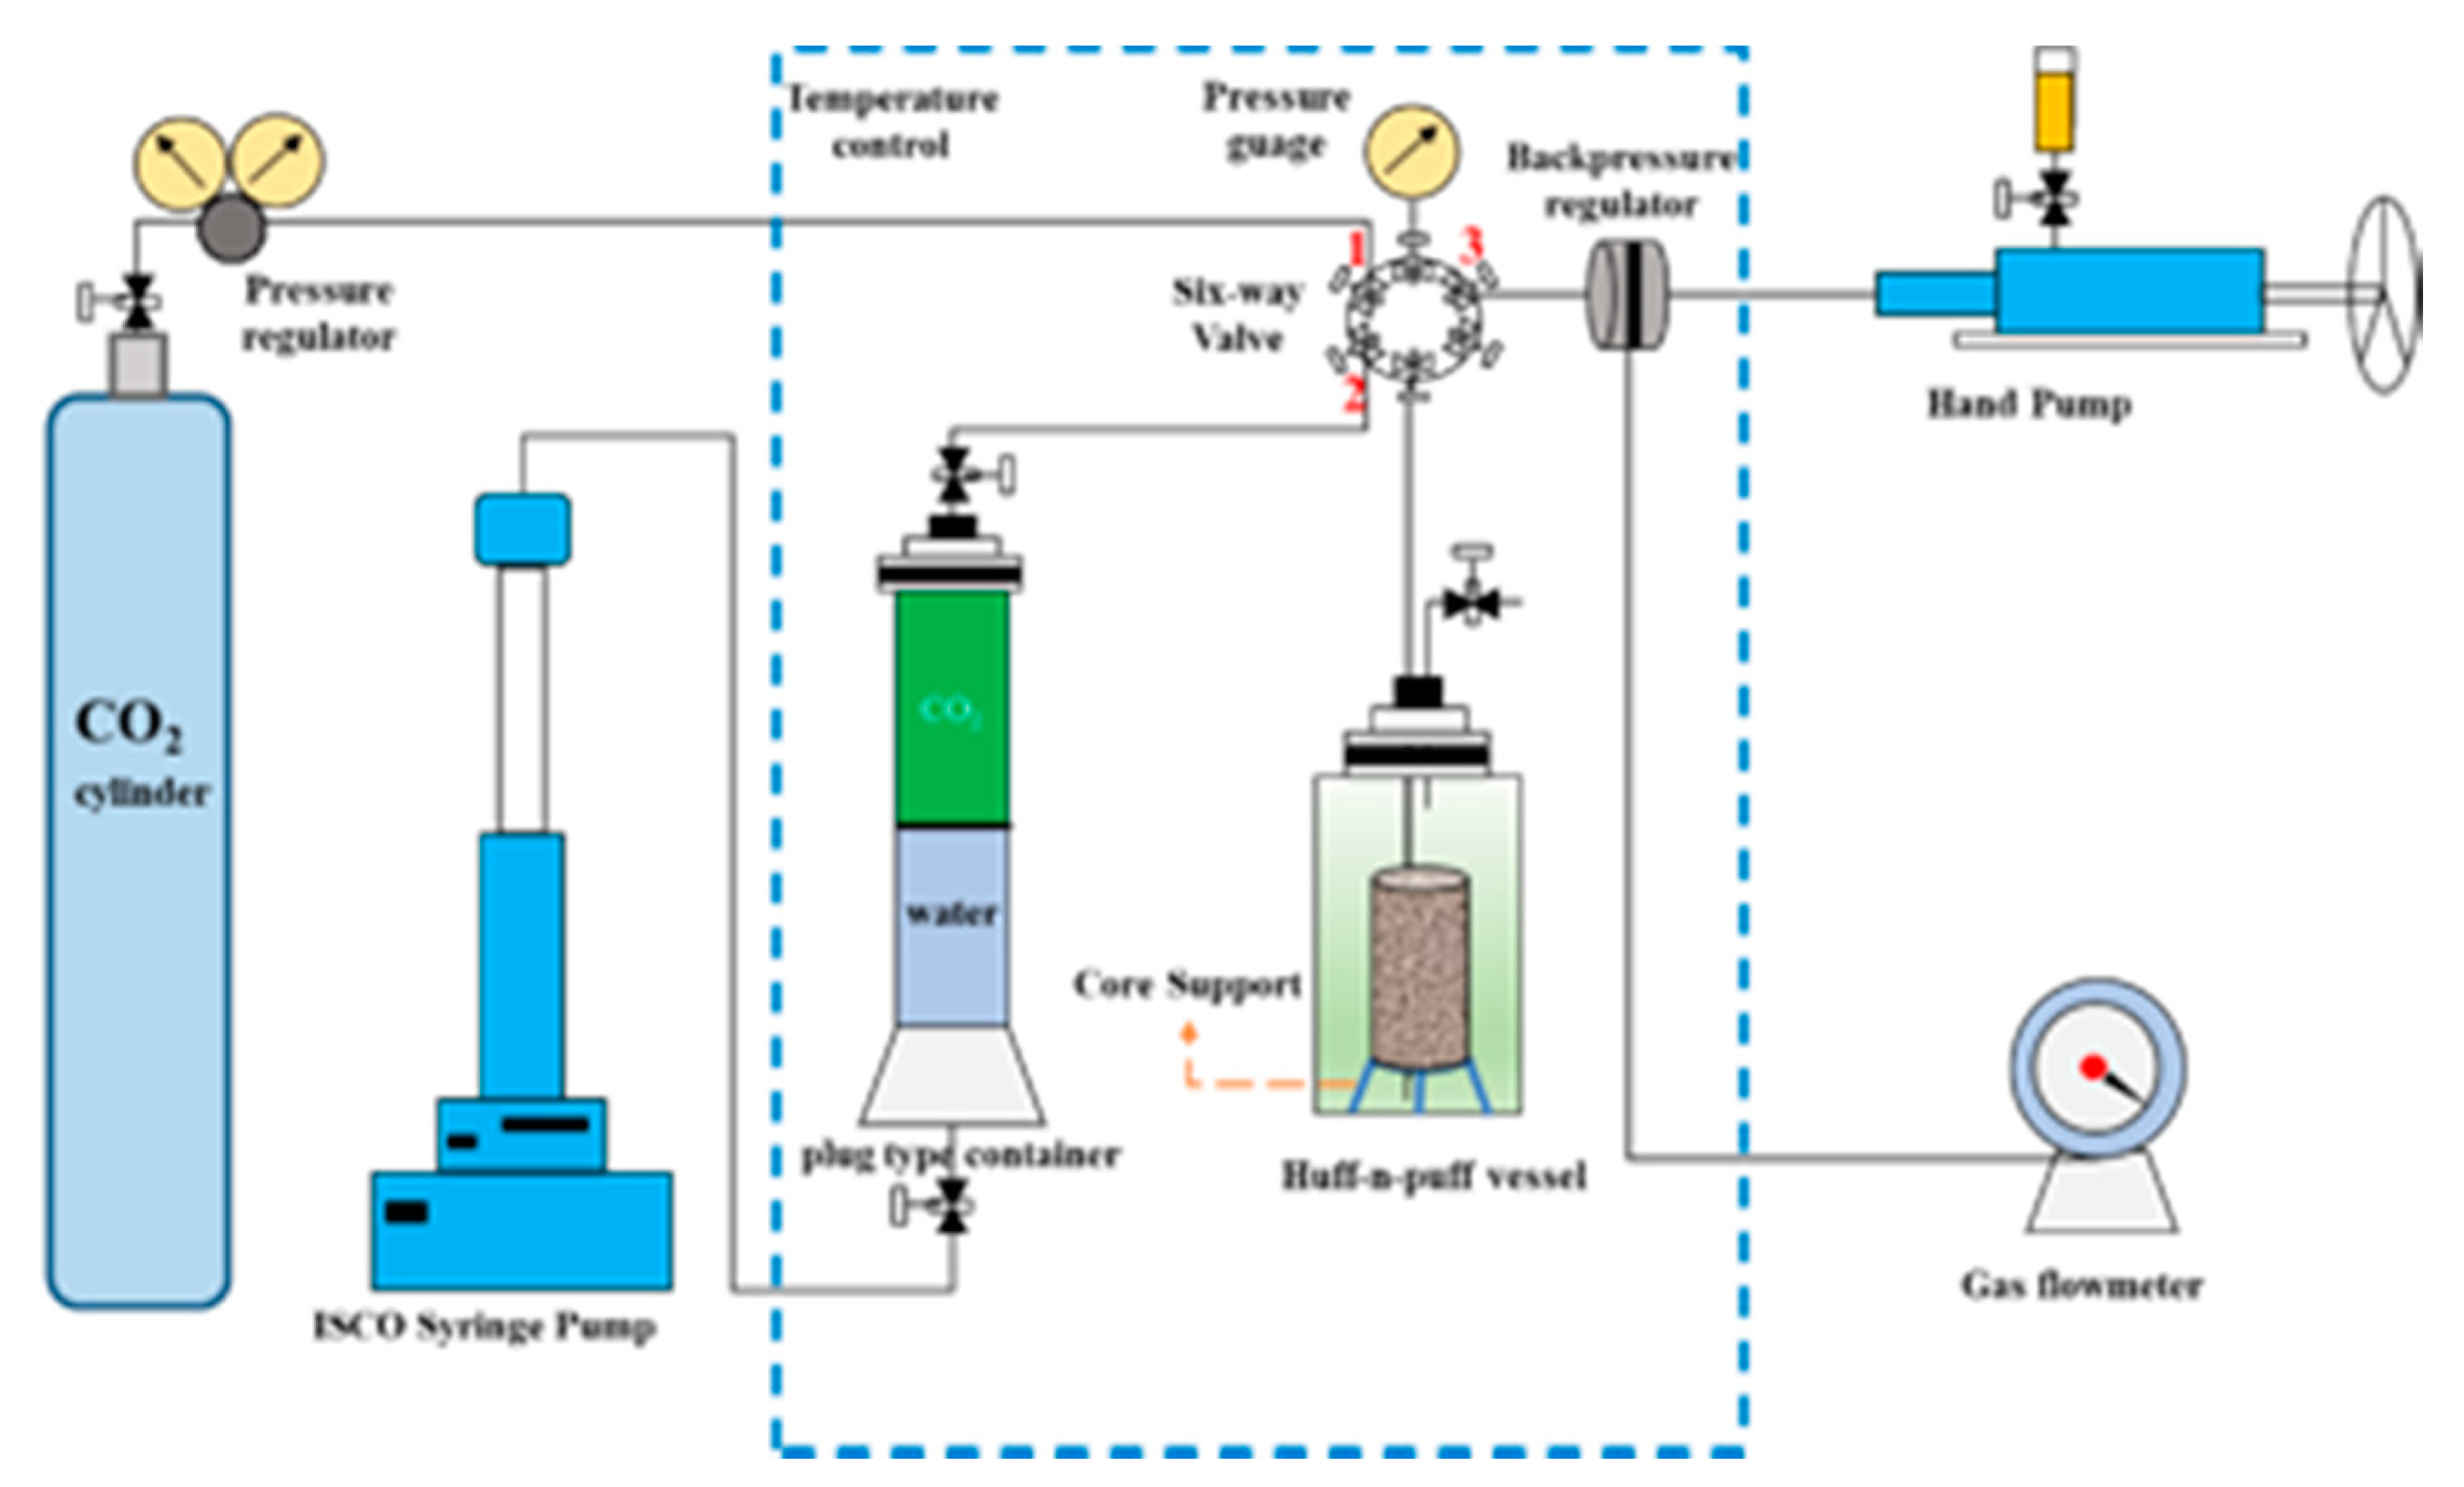
The main experiments carried out in this study were SEM, CO2 huff-n-puff, and NMR tests. The major apparatus for SEM included an argon ion polishing instrument (Ilion+II697C, Gatan Co., Warrendale, PA, USA), an energy spectrometer field emission scanning electron microscope (FESEM, Quanta 450, FEI Co., Hillsboro, OR, USA), and an energy spectrometer (AMETEK, EDAX Co., Philadelphia, PA, USA). As shown in the CO2 huff-n-puff experiment schematic of Figure 4, the huff-n-puff vessel was fitted with CO2 from the cylinder before huff-n-puff. The ISCO pump (260 D, ISCO, Lincoln, NE, USA) provided power to inject CO2 from the plug-type container to the core. The hand pump provided backpressure, and the temperature control setup allowed for the maintenance of the temperature of the whole experimental system at 45 °C during the process. The NMR spectrometer was produced by Suzhou Niumag Analytical Instrument Co., Ltd., Suzhou, China. The magnetic field strength was 0.52 ± 0.05 T, and the resonance frequency of the hydrogen proton was 21.3 MHz. Other devices used in this study included a core linear cutting machine, a core cleaner, an oven, a core measurement system, an analytical electronic balance, a Vernier caliper, and a gas flowmeter.

3.3. Experimental Procedures

The experimental procedures were as follows.
(1)
Core preparation: we prepared the shale cores by a linear cutting machine with a diameter of 25 mm, and we cleaned the samples for 28 days. Afterwards, they with dried at 120 °C for about 3 days, and the permeability and porosity were tested by helium.
(2)
SEM tests: we took the core slice from the standard sample and polished the surface. Then, the polished sample was photographed by FESEM.
(3)
Rock sample saturation: we vacuumed the core samples for 72 h. Next, the specimens were saturated with n-dodecane for 48 h at 30 MPa and 45 °C, and then we put them into the container with n-dodecane for one week to completely saturate at 45 °C. Additionally, the samples were weighed before and after the processes.
(4)
Initial T2 spectrum: after saturation, we measured the samples with an NMR apparatus to obtain the initial T2 spectrum curves of the saturated oil.
(5)
CO2 huff: first, we put the core into the huff-n-puff vessel, and then, as shown in Figure 4, the experimental process was connected. After we filled the huff-n-puff vessel with CO2 from the cylinder, CO2 in the plug-type container was injected into the huff-n-puff vessel by the ISCO pump at 15 MPa.
(6)
CO2 puff: all valves were closed during the soaking period for 12 h. We opened valve #3 and controlled the back pressure to gradually drop to 0 MPa.
(7)
CO2 huff-n-puff T2 spectrum: we took out the core from the huff-n-puff vessel, and then we weighed the sample by the analytical electronic balance and measured the T2 spectrum using the NMR apparatus.
(8)
We repeated steps (5)–(7) at the same injection pressure of 4 rounds for the CO2 huff-n-puff experiments and NMR tests.

4. Results and Discussions

4.1. Pore Characteristics and Radius Distribution

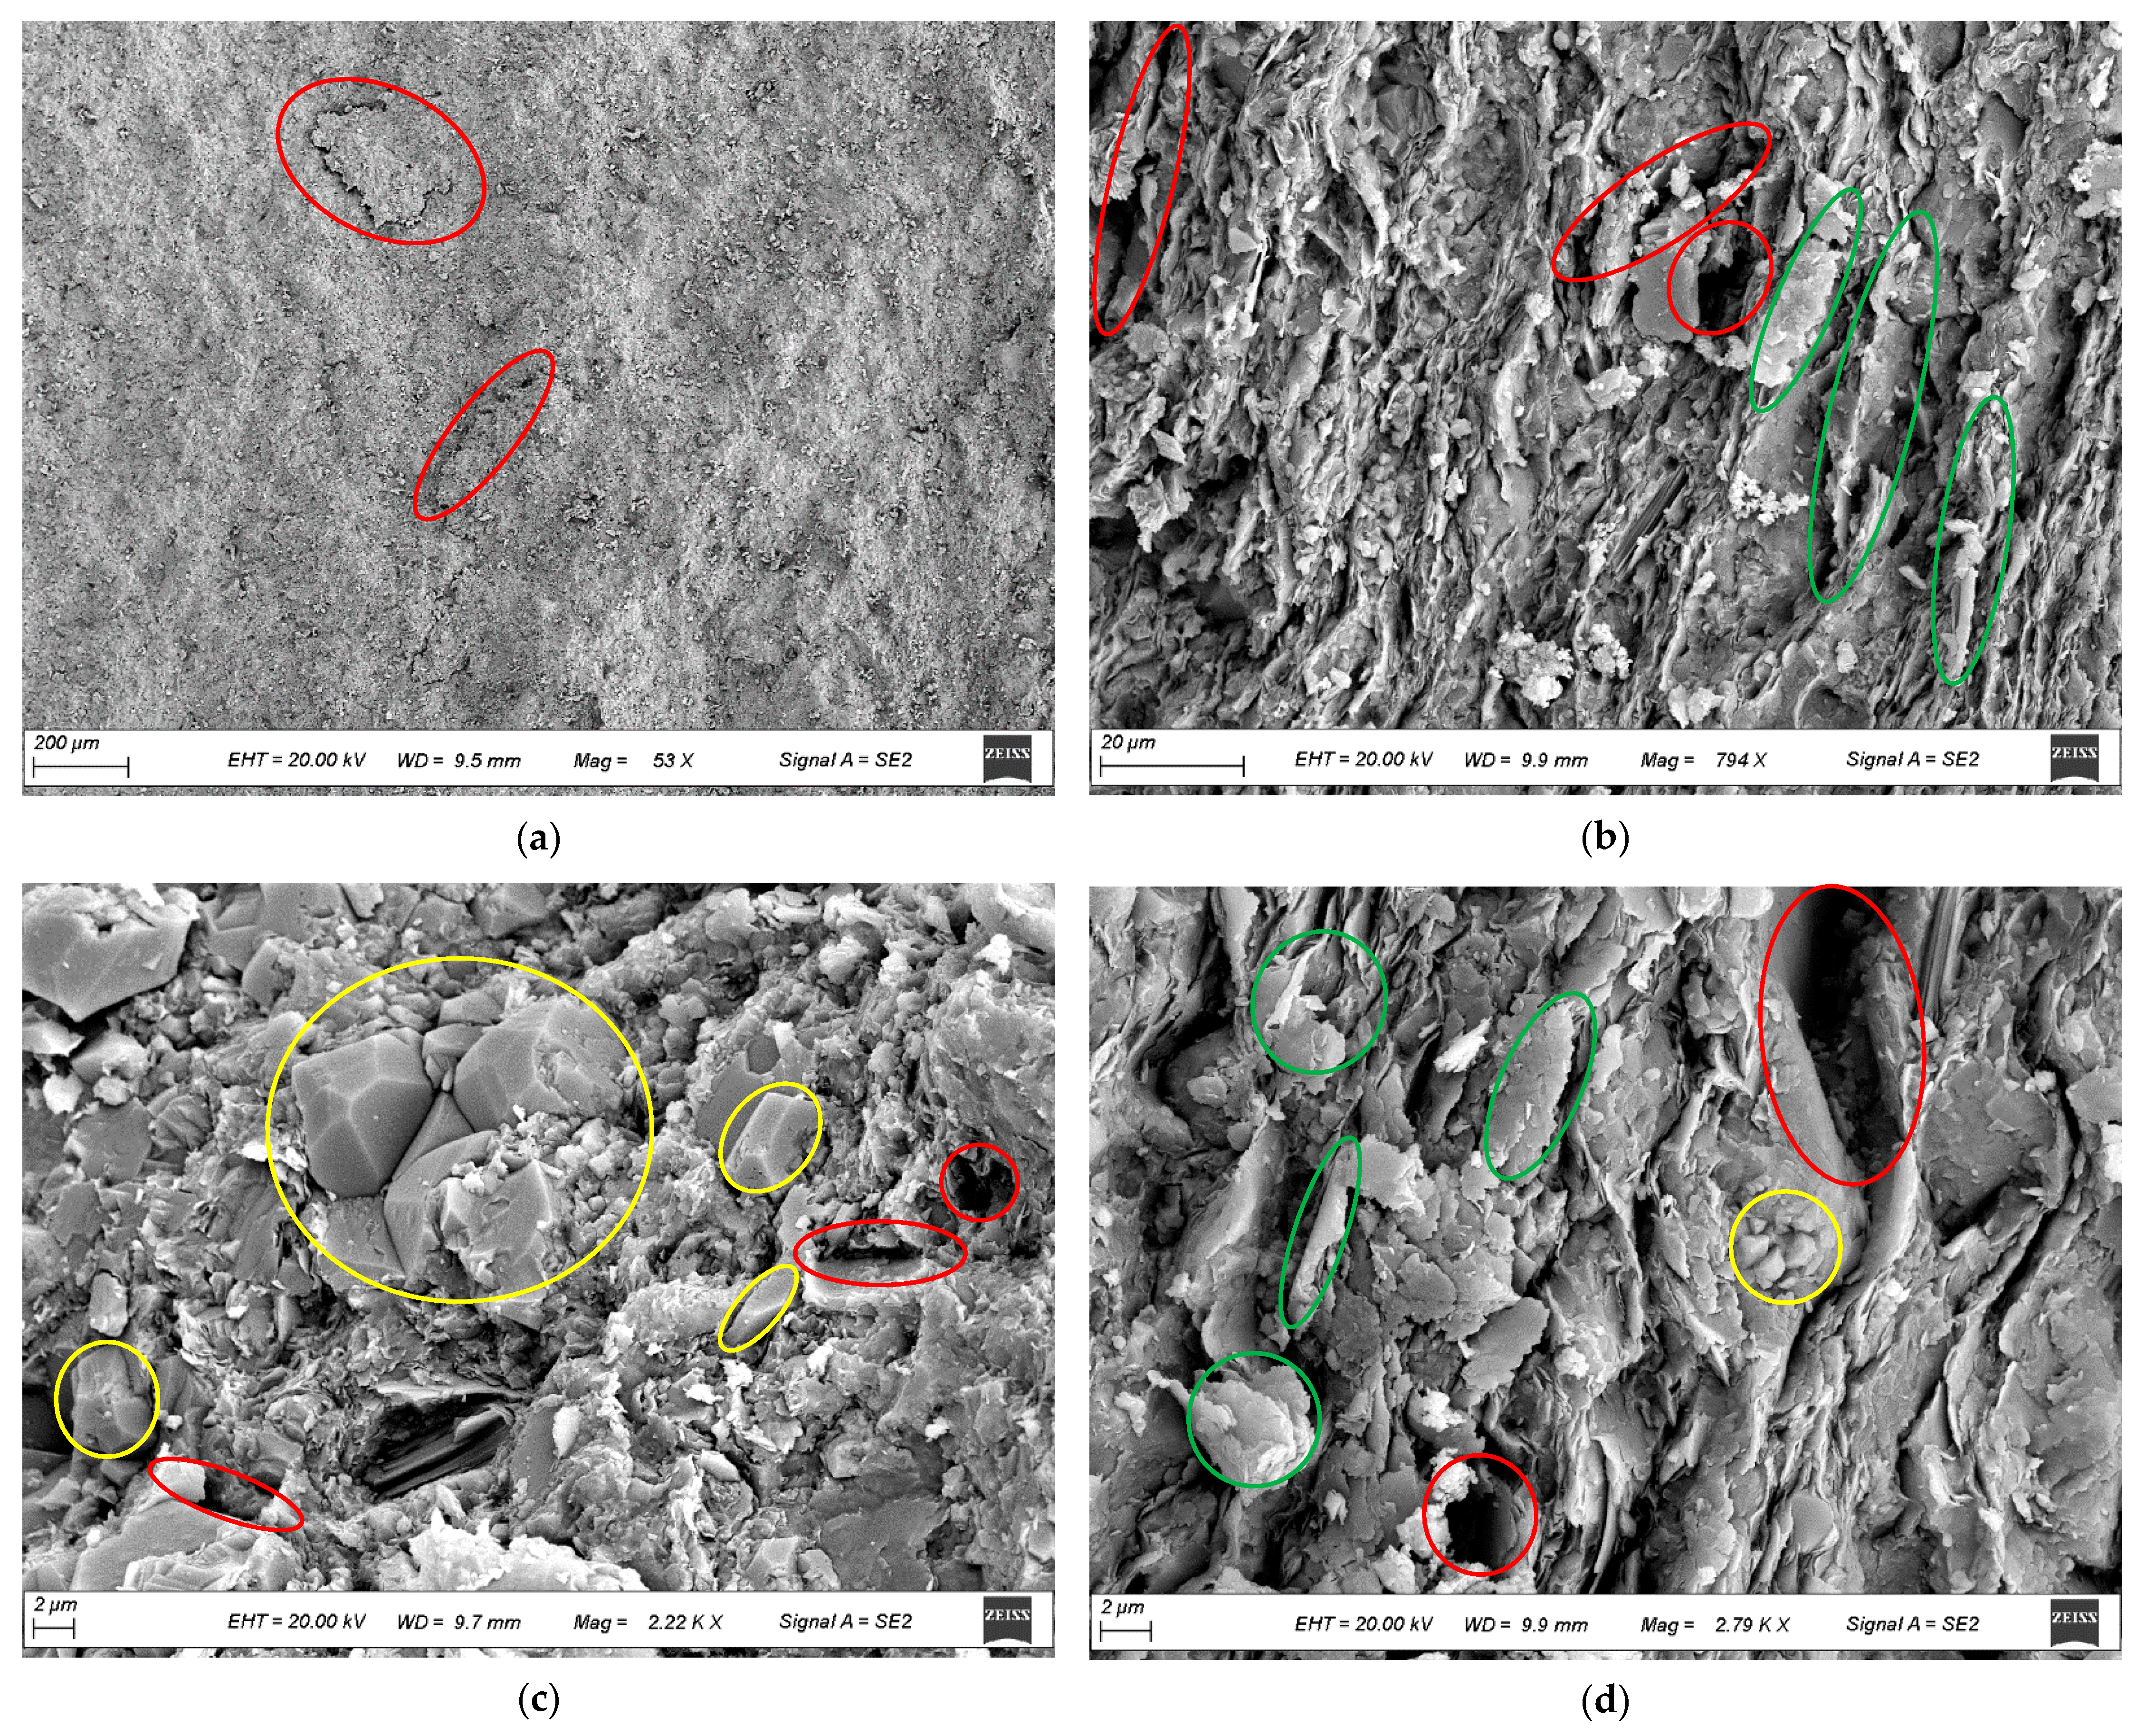
The SEM images of Chang 7 shale core samples are shown in Figure 5. It could be observed that the rock was tight shale, and microfractures with different lengths and widths, as well as a large number of micropores, were developed. Some larger pores were filled with clastic particles among the minerals, such as pyrite and illite. Hence many micropores were formed. As a whole, massive micro-smallpores and fractures developed, and relatively few large-scale pores were distributed in the rock.
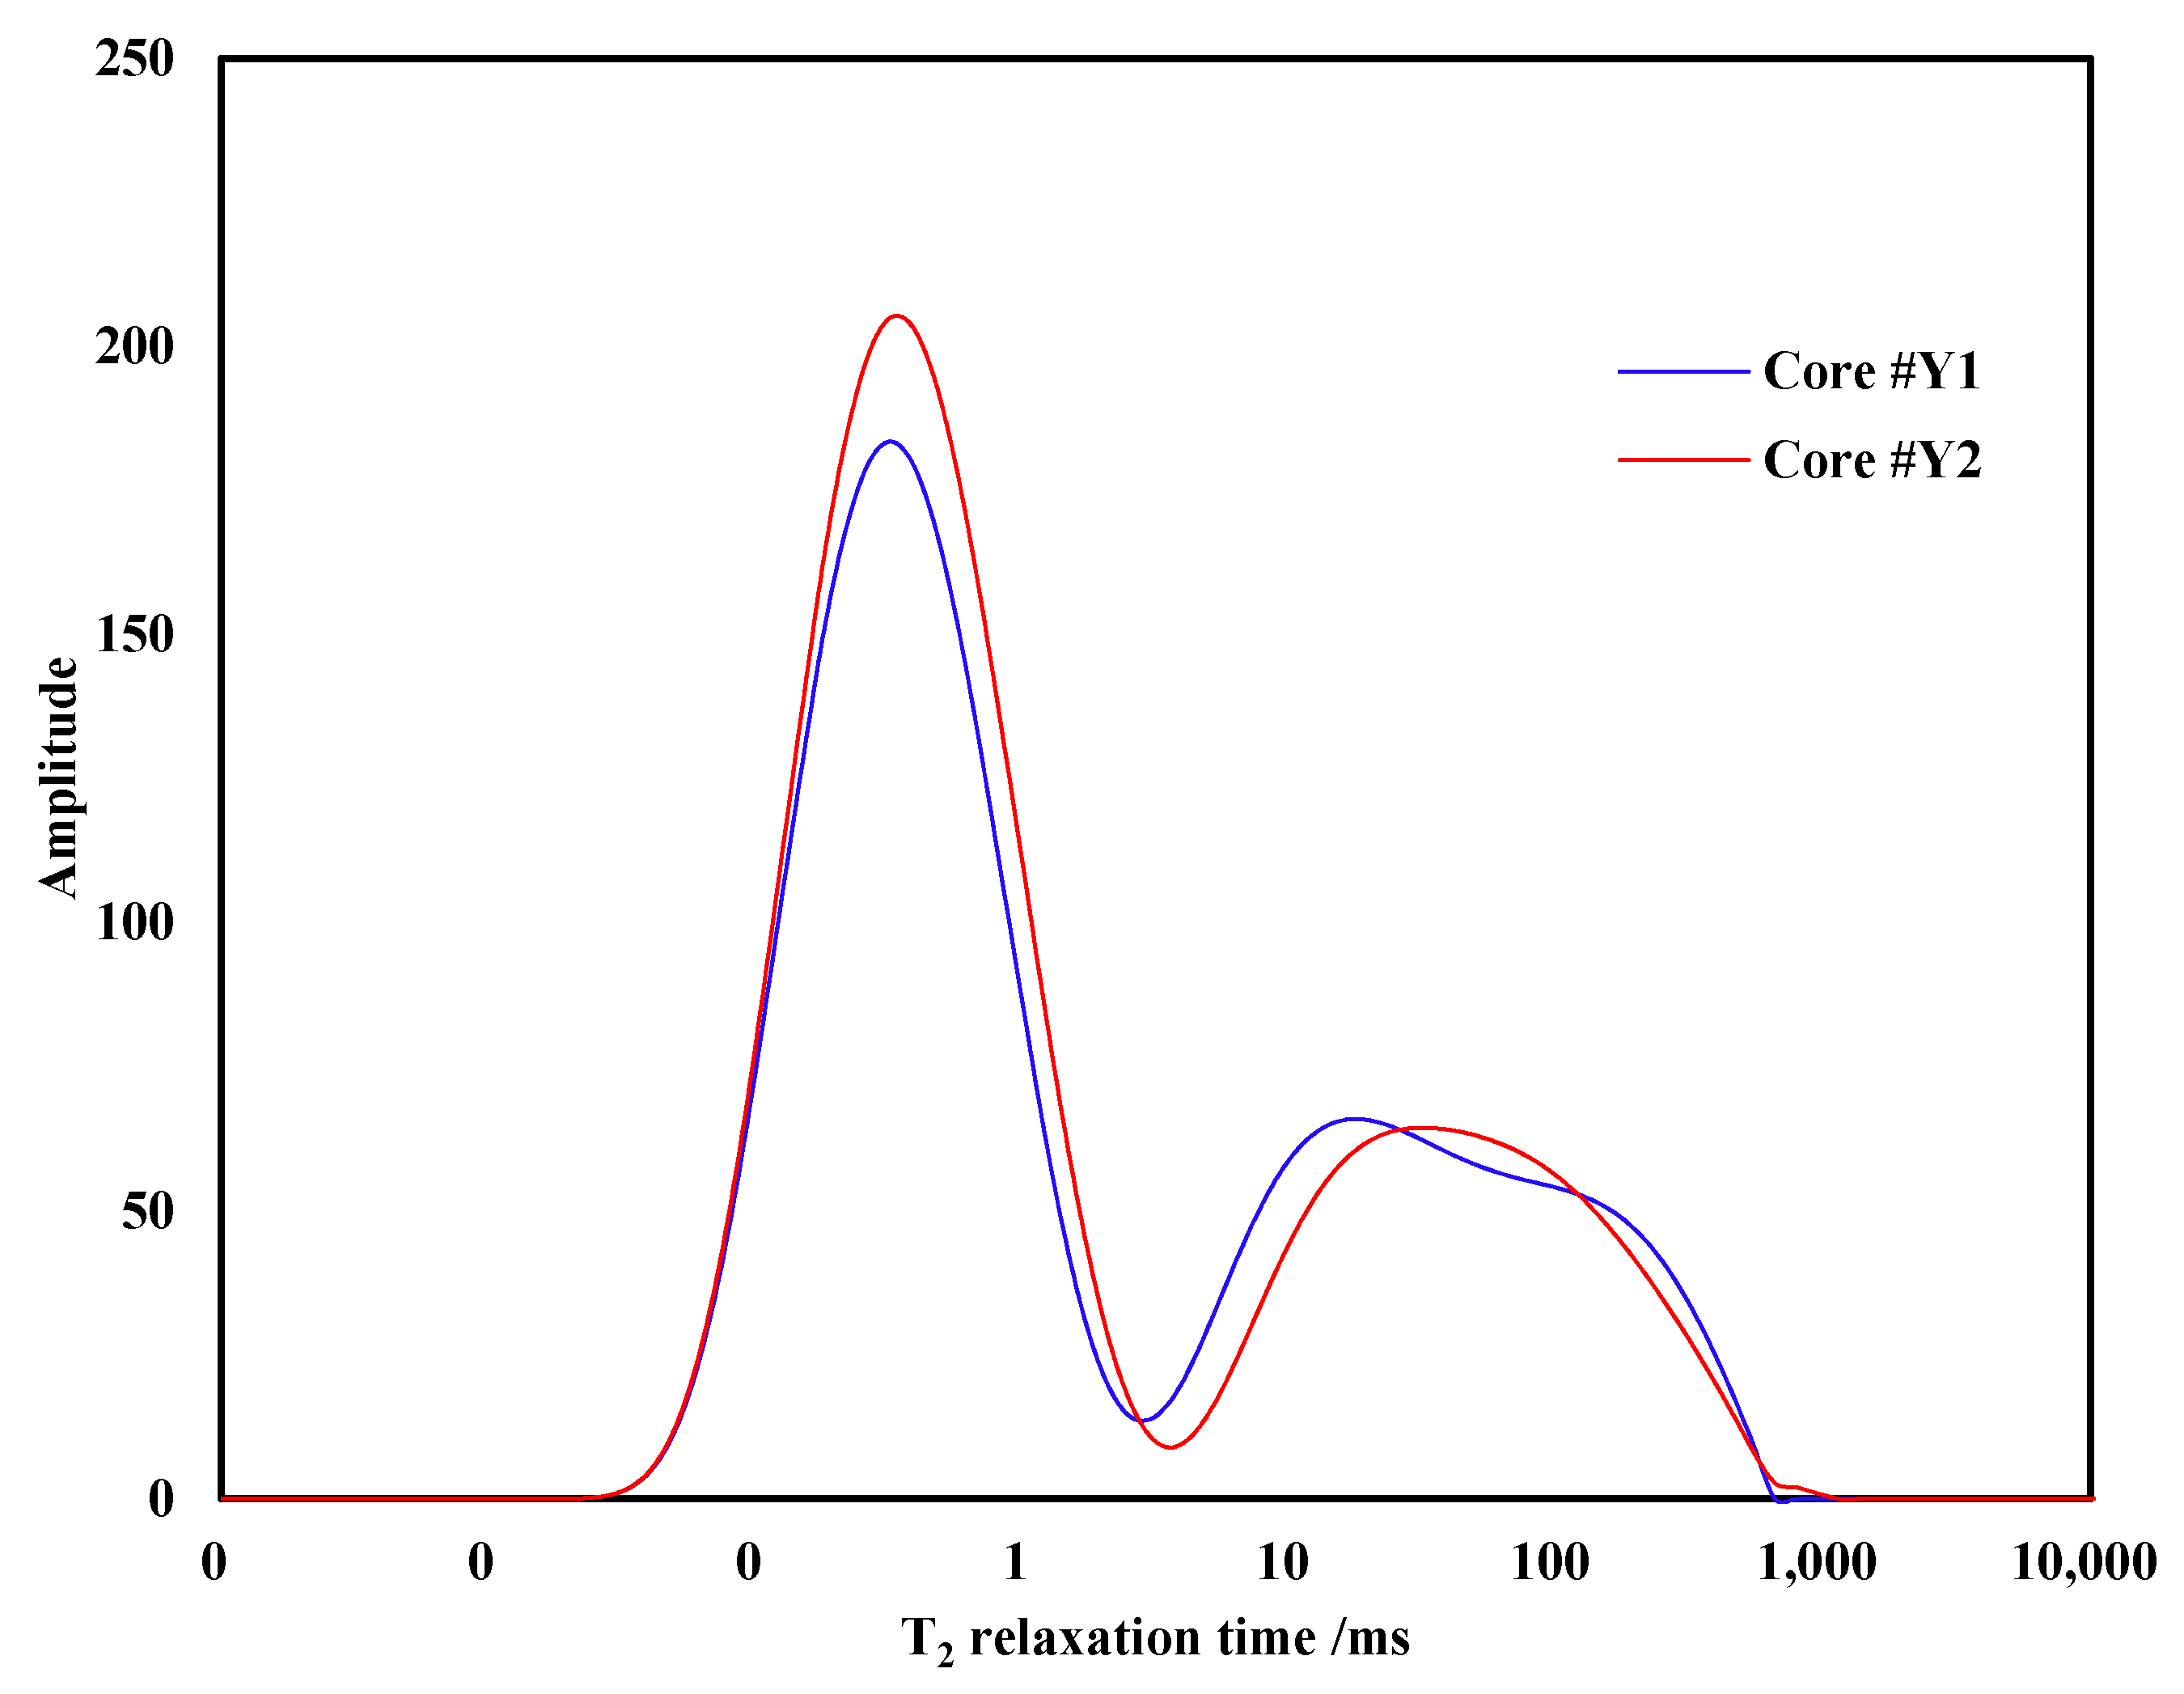
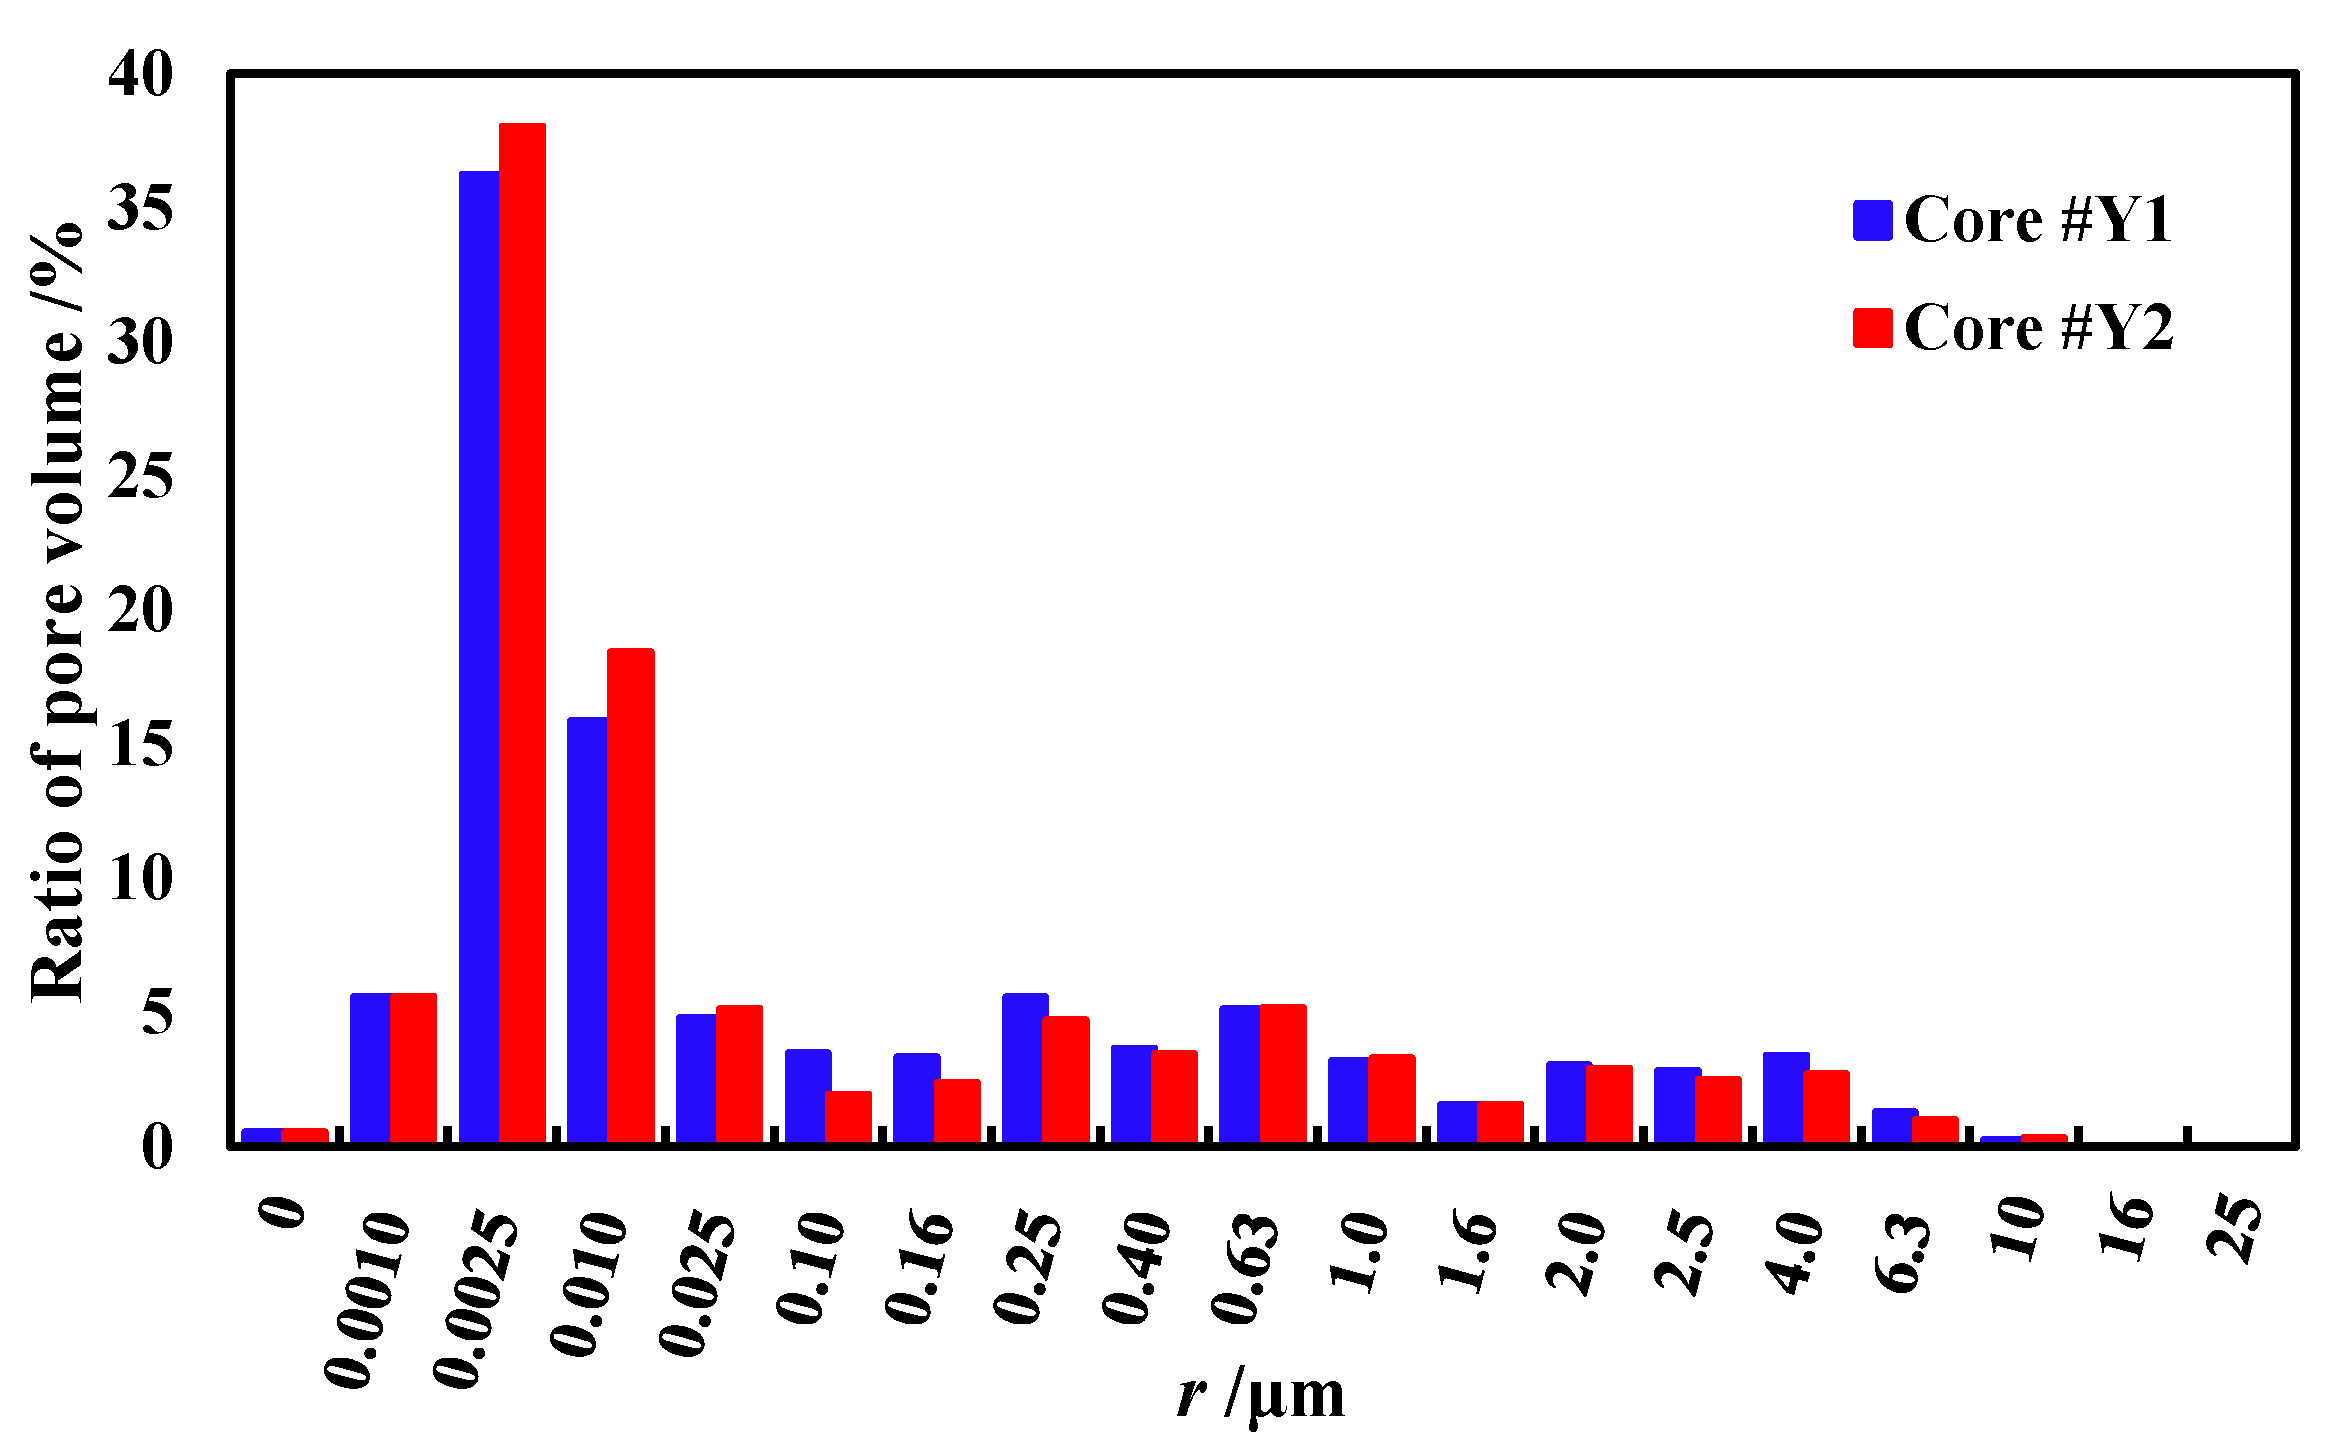
Figure 6 shows the T2 spectrum curves of initial saturated oil in cores. The curve of core #Y1 has three wave crests, but the transition between the middle and right crest is not apparent in the other one. The crest decreases from left to right, which indicates that the core pore distribution was strongly heterogeneous. The crest on the left means micropores, the middle one means mesopores, the trough between the two means smallpores, and the crest on the right represents macropores or fractures. In the T2 spectrum of core #Y2, there is a little transition between the crests that represents mesopores and macropores. Therefore, after combining this spectrum with Equation (3), the pore radius distribution could be shown in Figure 7. In this study, the shale pores could be divided into four types, as shown in Table 2, according to Lai et al. and Nie et al. [29,30], and their volume ratios are shown in Table 3. All the pore volume ratios in core #Y1 were slightly larger than those in core #Y2, except for micropores. This reflects the relationship between permeability and pore size to a certain degree, such that the higher the proportion of pores with a larger radius, the greater the permeability.

4.2. Recovery Factor of CO2 Huff-n-Puff Process

4.2.1. Effect of Cycle Number

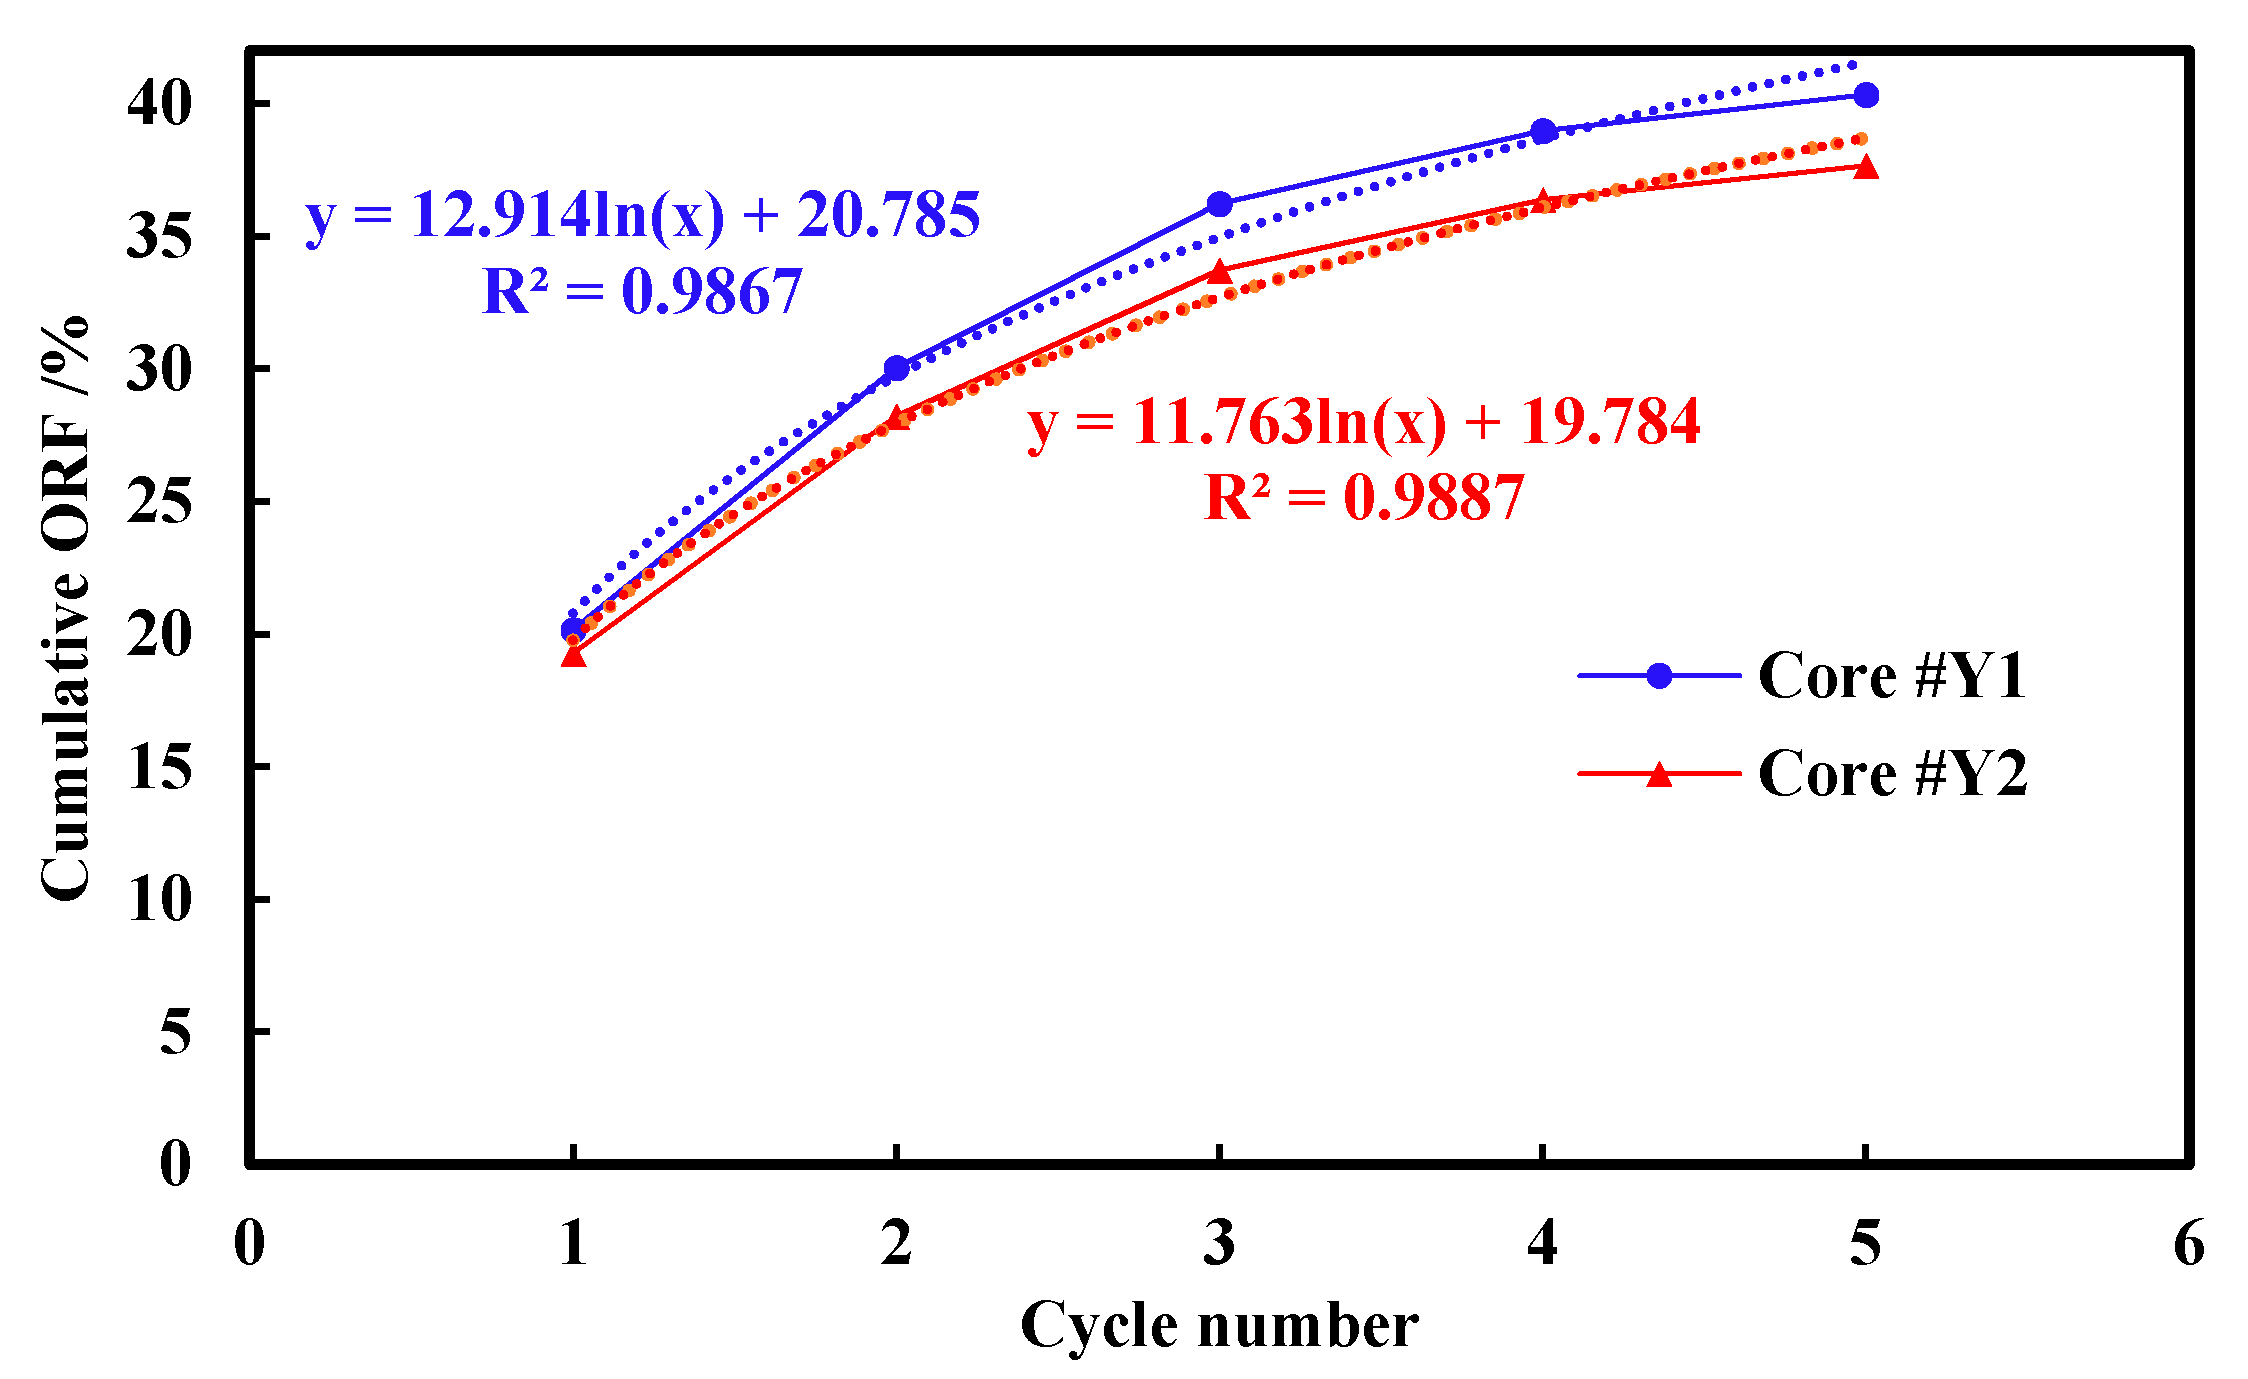
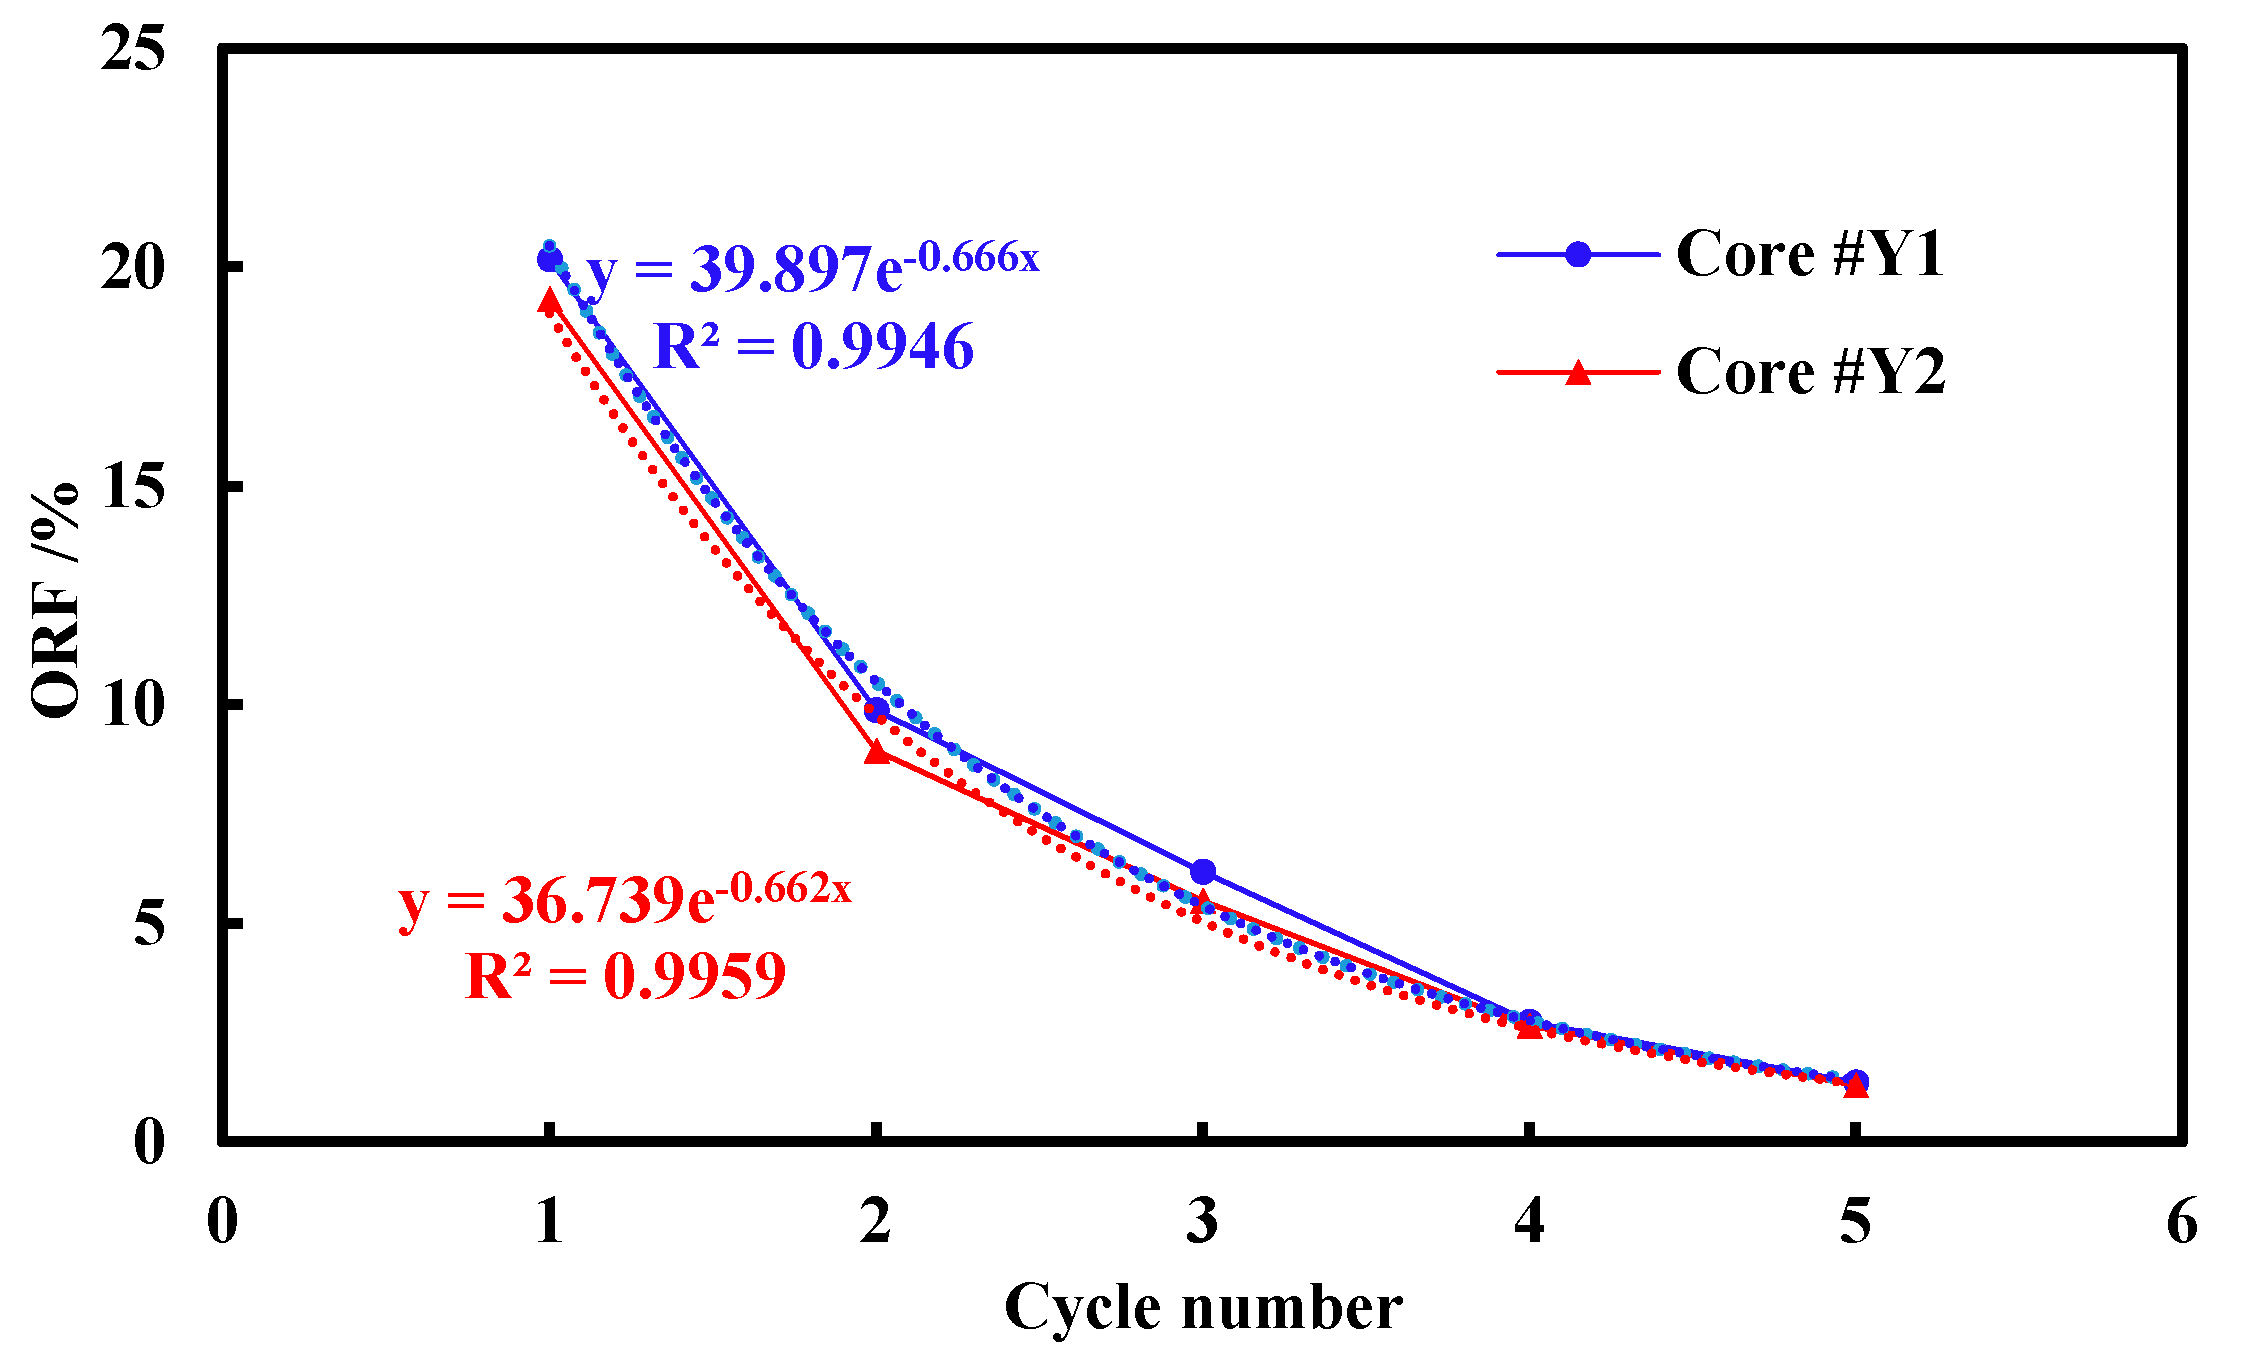
Figure 8 depicts the measured cumulative oil recovery factor (ORF) versus cycle numbers at a pressure of 15 MPa. The results showed that the effect was positive for continental shale oil produced by CO2 huff-n-puff. After five cycles, the cumulative ORFs of cores #Y1 and #Y2 reached 40.34% and 37.66%, respectively. In the first three cycles, the cumulative ORFs significantly increased, and the oil production accounted for 89.80% and 89.53%, respectively, but slowly increased in the succeeding two cycles. Additionally, the cumulative ORFs gradually increased in the natural logarithmic form with cycle number. Correspondingly, as shown in Figure 9, the single cycle ORFs rapidly decreased in the exponential form with cycle number, and the recoveries were only 1.37% and 1.29% for cores #Y1 and #Y2, respectively, at the last cycle. This indicates that the interaction between CO2 and shale oil gradually reduced until it was ineffective for EOR. Thus, based on the analysis of the experimental results, efficient production required about three-to-five cycles of CO2 huff-n-puff for shale oil reservoirs, which was consistent with the research of W. Pu and B. Wei [31].

4.2.2. Effect of Permeability

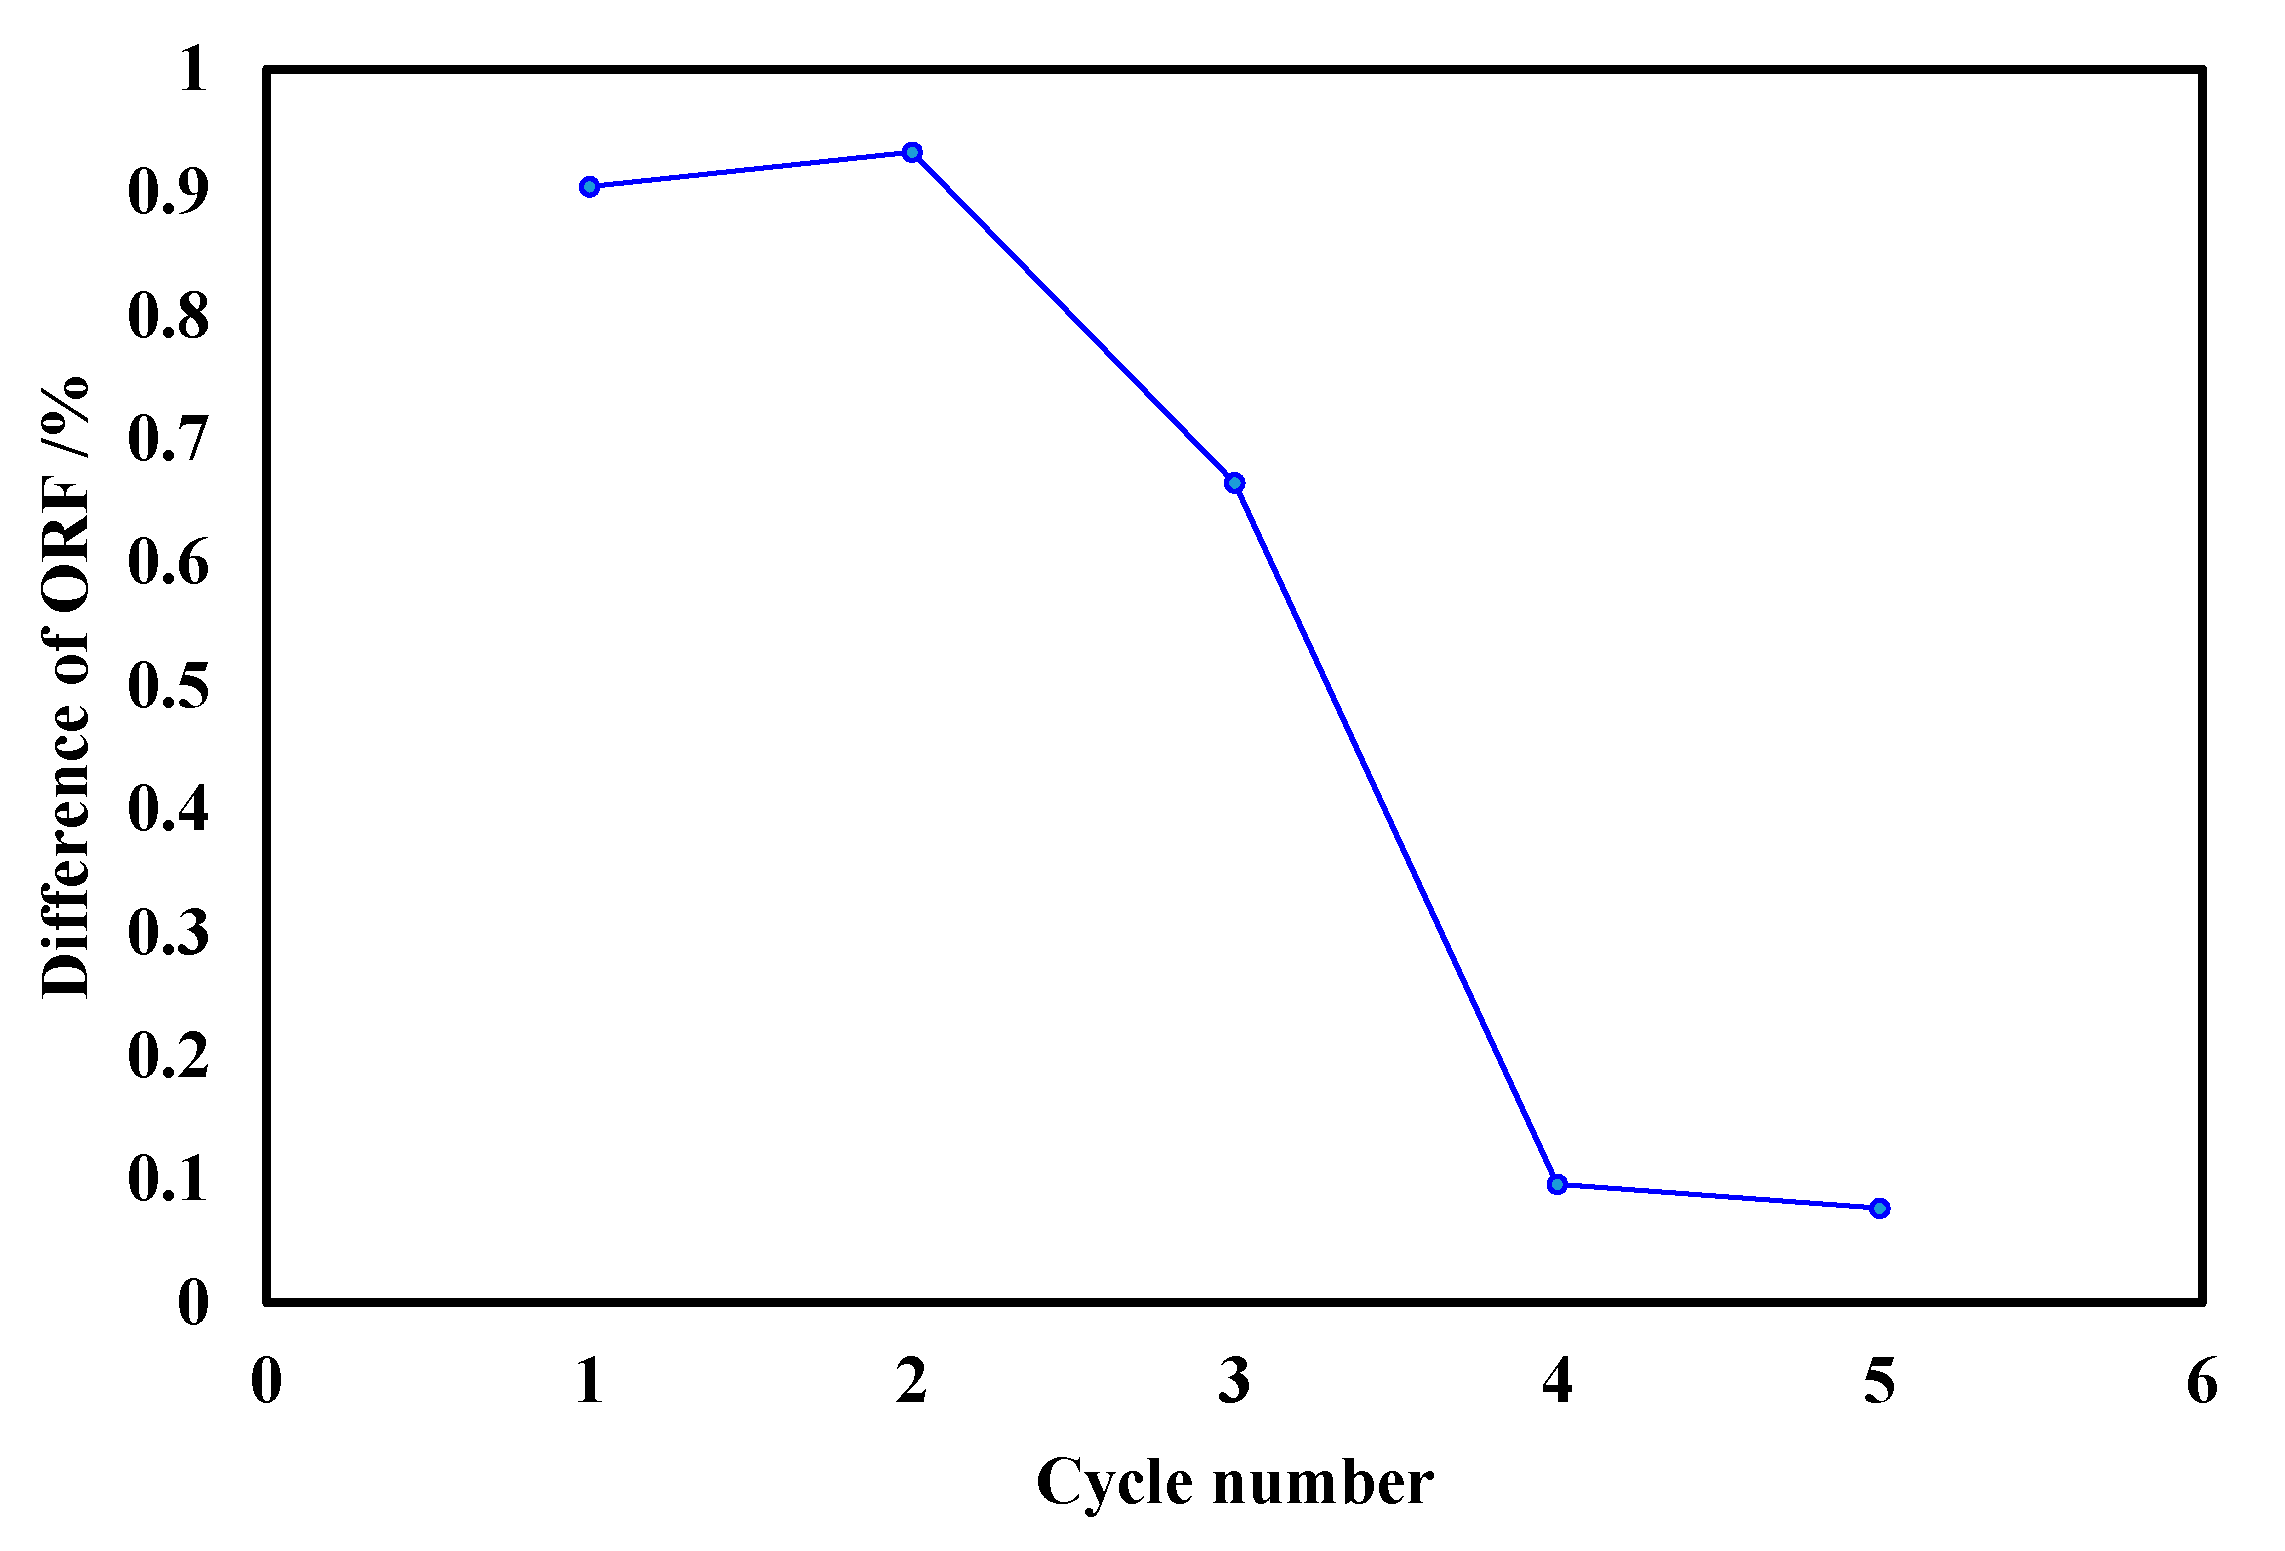
The permeabilities of experimental cores Y1 and Y2 were 0.2911 × 10⁻³ μm2 and 0.0169 × 10⁻³ μm2, respectively, as seen in Table 1. A series of experiments were carried out to investigate the effect of permeability on the oil recovery factor during the CO2 huff-n-puff process under 15 MPa of pressure, as shown in Figure 8 and Figure 9. The single cycle and cumulative ORF of core #Y1 was larger than those of core #Y2. However, as shown in Figure 10, the differences of single cycle ORFs sharply decreased between the specimens with different permeabilities after two cycles, and it was only 0.07% in the fifth cycle. That was because the permeability was proportional to the pore radius of the reservoir. Under the same external conditions, the larger the permeability and the corresponding average pore radius, the smaller capillary force and seepage resistance; then, the saturation of the movable fluid increased in the pore and the recovery factor of CO2 huff-n-puff was higher. The remaining oil decreased with the permeability increases. Generally, fracturing and acidizing could enlarge the sizes of pores, fractures, and permeability for shale oil reservoirs, thus creating a foundation to improve the recovery by CO2 huff-n-puff.

4.3. Microscopic Process with NMR Tests

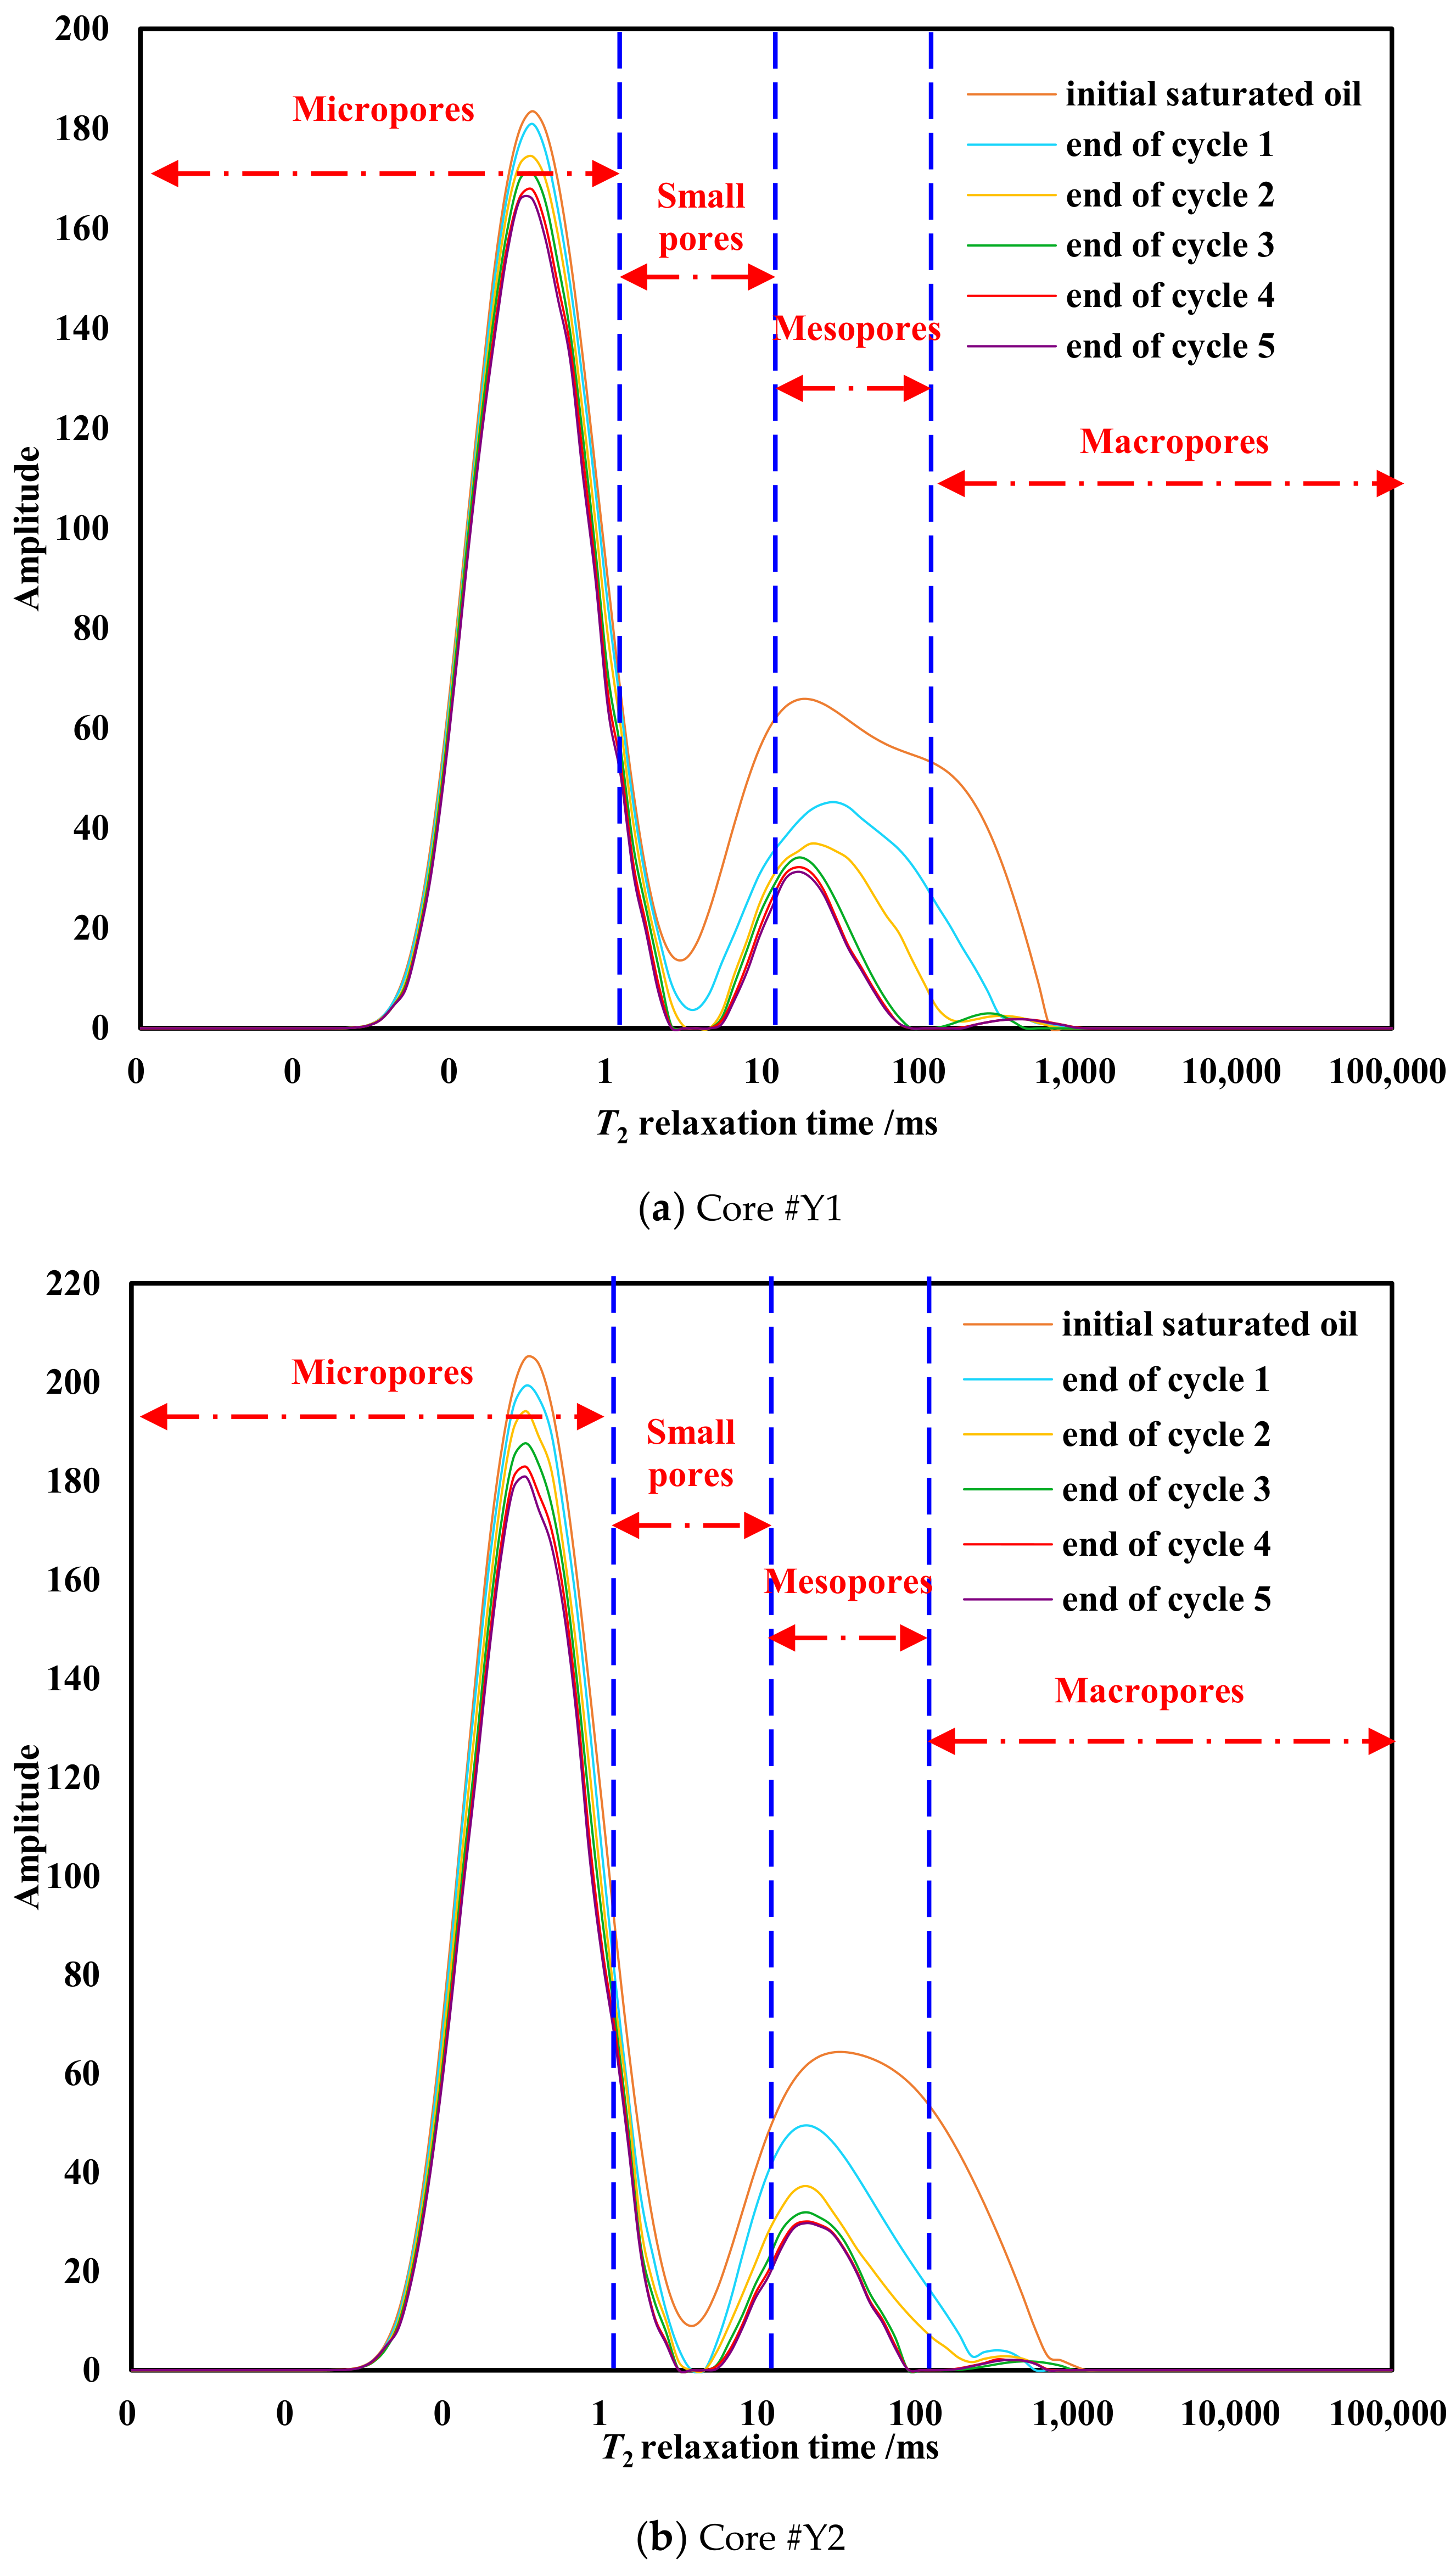
Though the recovery factors can be calculated from the experimental data of different CO2 huff-n-puff cycles, it is difficult to quantitatively determine the oil production and remaining oil in different scale pores in a core. However, to investigate the NMR T2 spectrum curves shown in Figure 11, we obtained the characteristics of ORF, the remaining oil distribution in different-scale pores, and the pores’ contributions to EOR.

4.3.1. Characteristics of Shale Oil Mobilization

As shown in Figure 11a,b, compared with the initial saturated oil, there are three obvious wave crests in the NMR T2 spectrum curve at the end of each CO2 injection cycle. This confirms that the target reservoir had a strong heterogeneity and once again mainly consisted of four scales of pores. The distribution curves of the T2 spectrum obtained from the CO2 huff-n-puff experiment gradually shift downward to the left with the cycle numbers. The curve with the T2 larger than 10 ms more significantly shifts, indicating that the crude oil flowed out first in the mesopores and macropores, which was consistent with a study of Ma et al. [32].
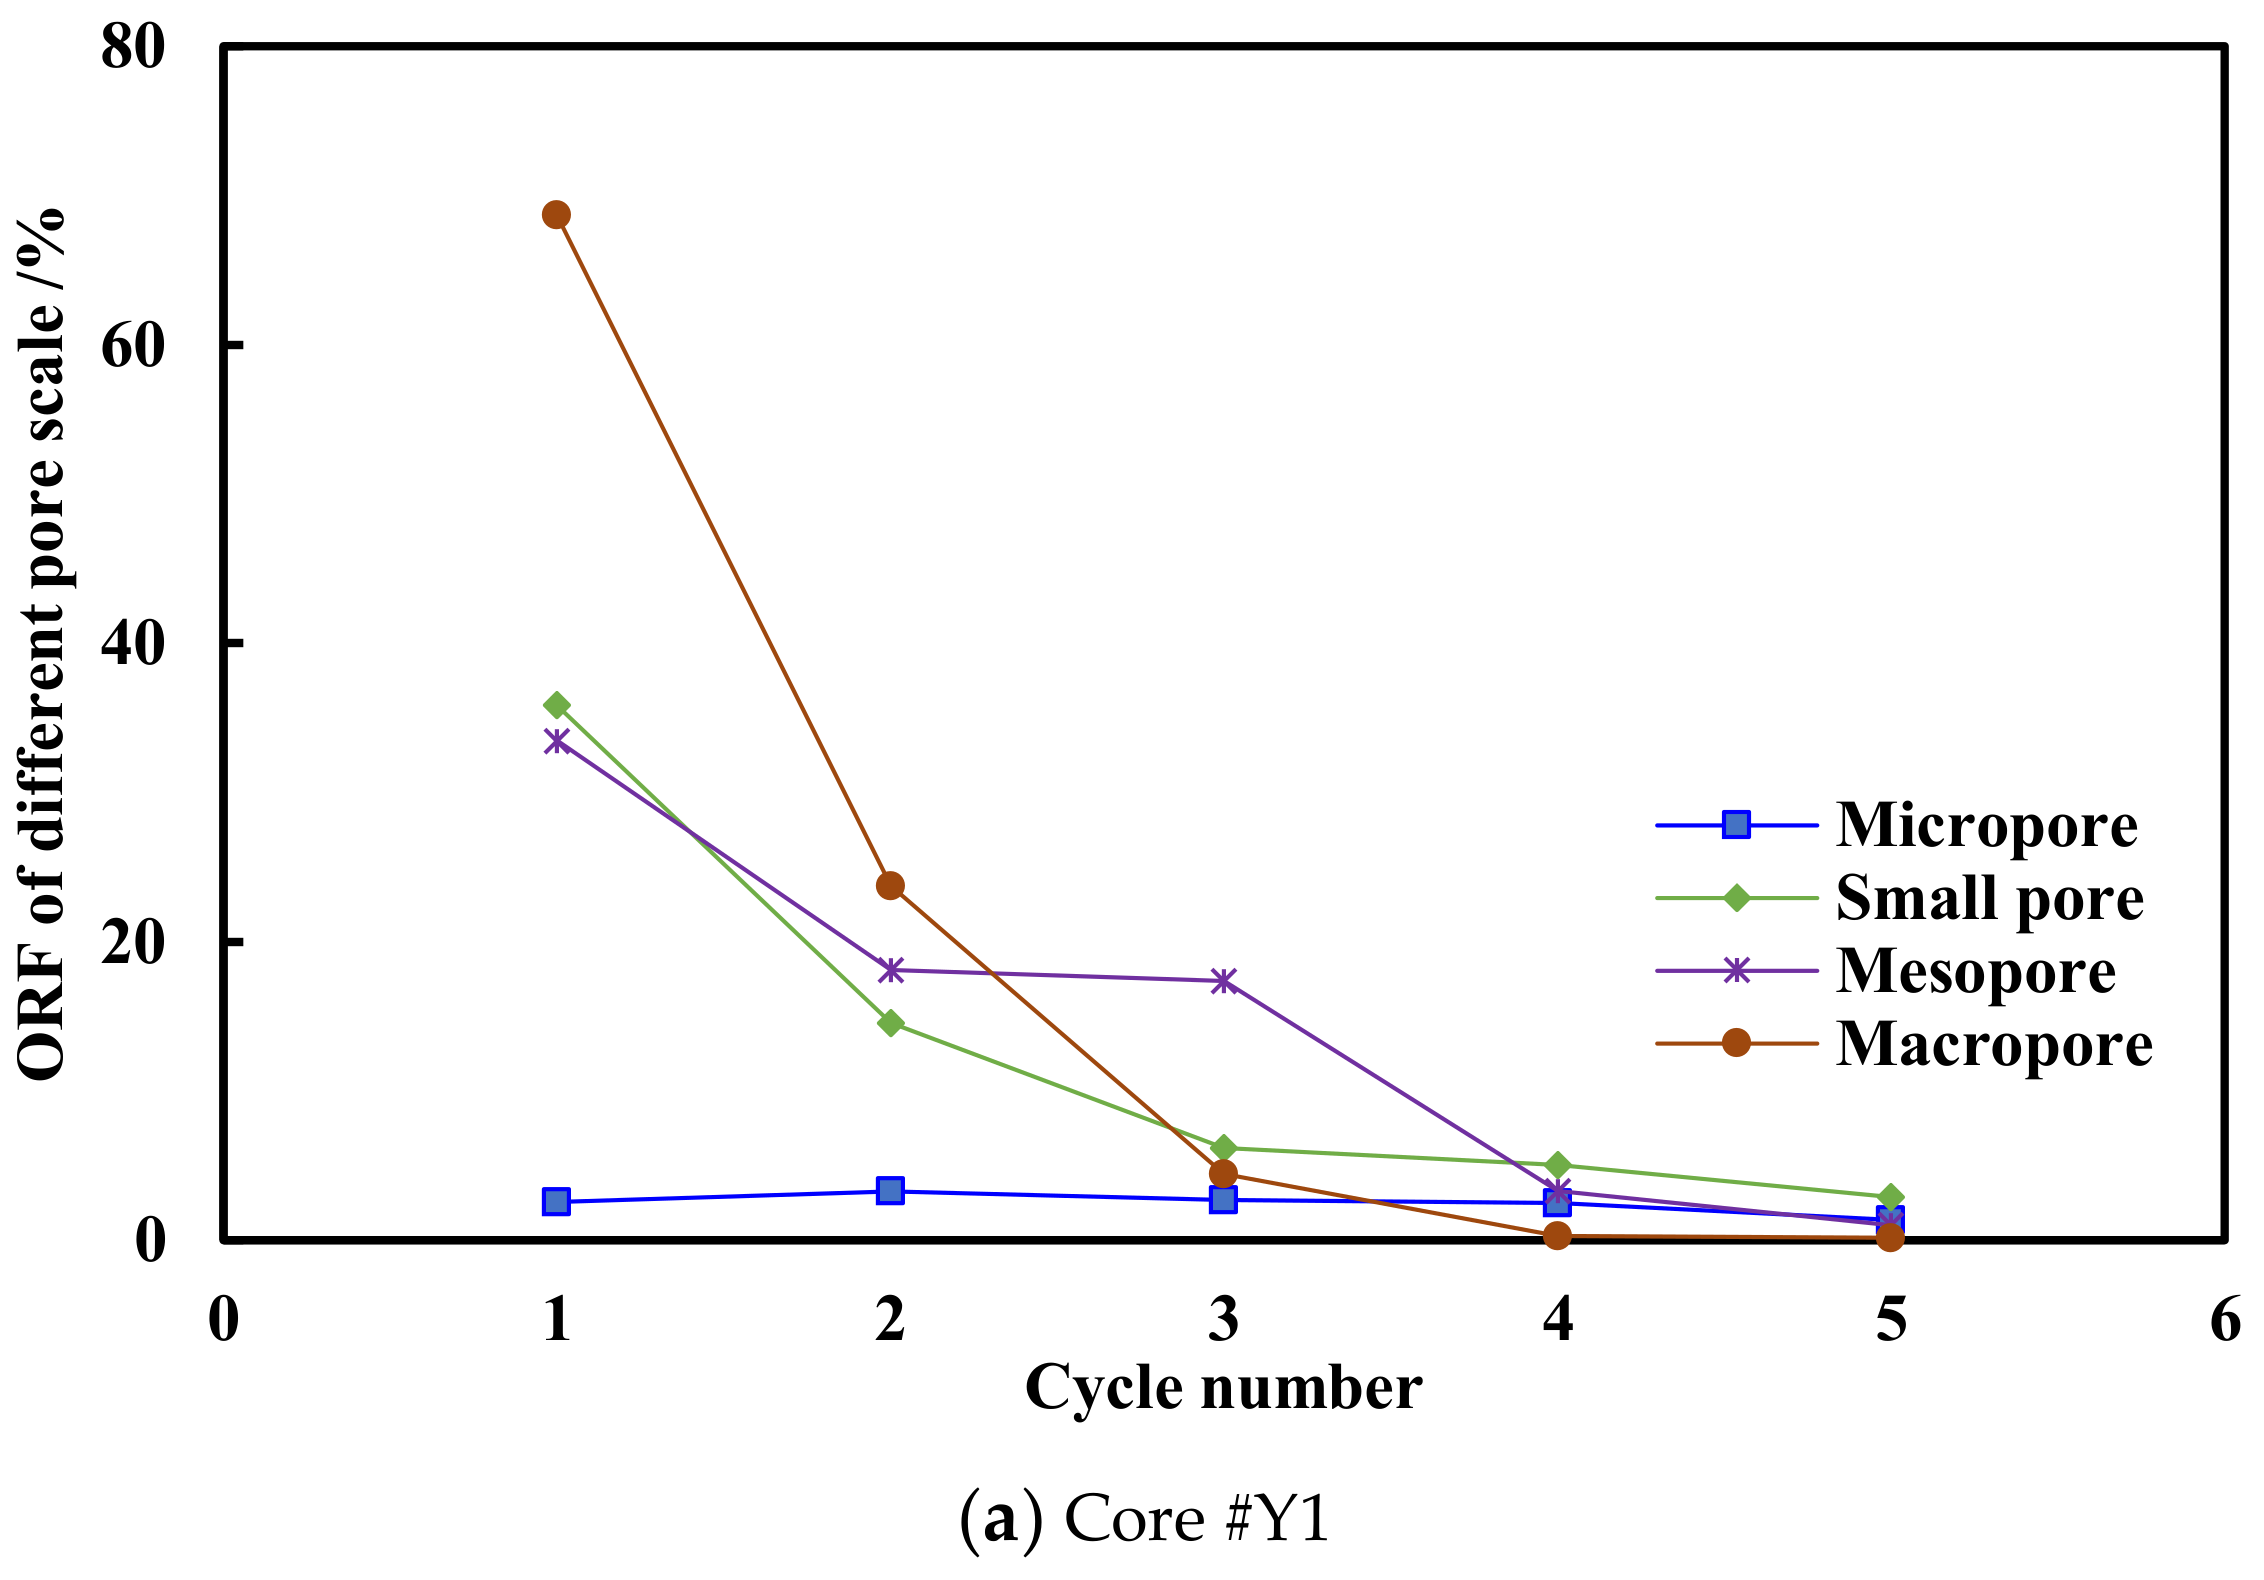
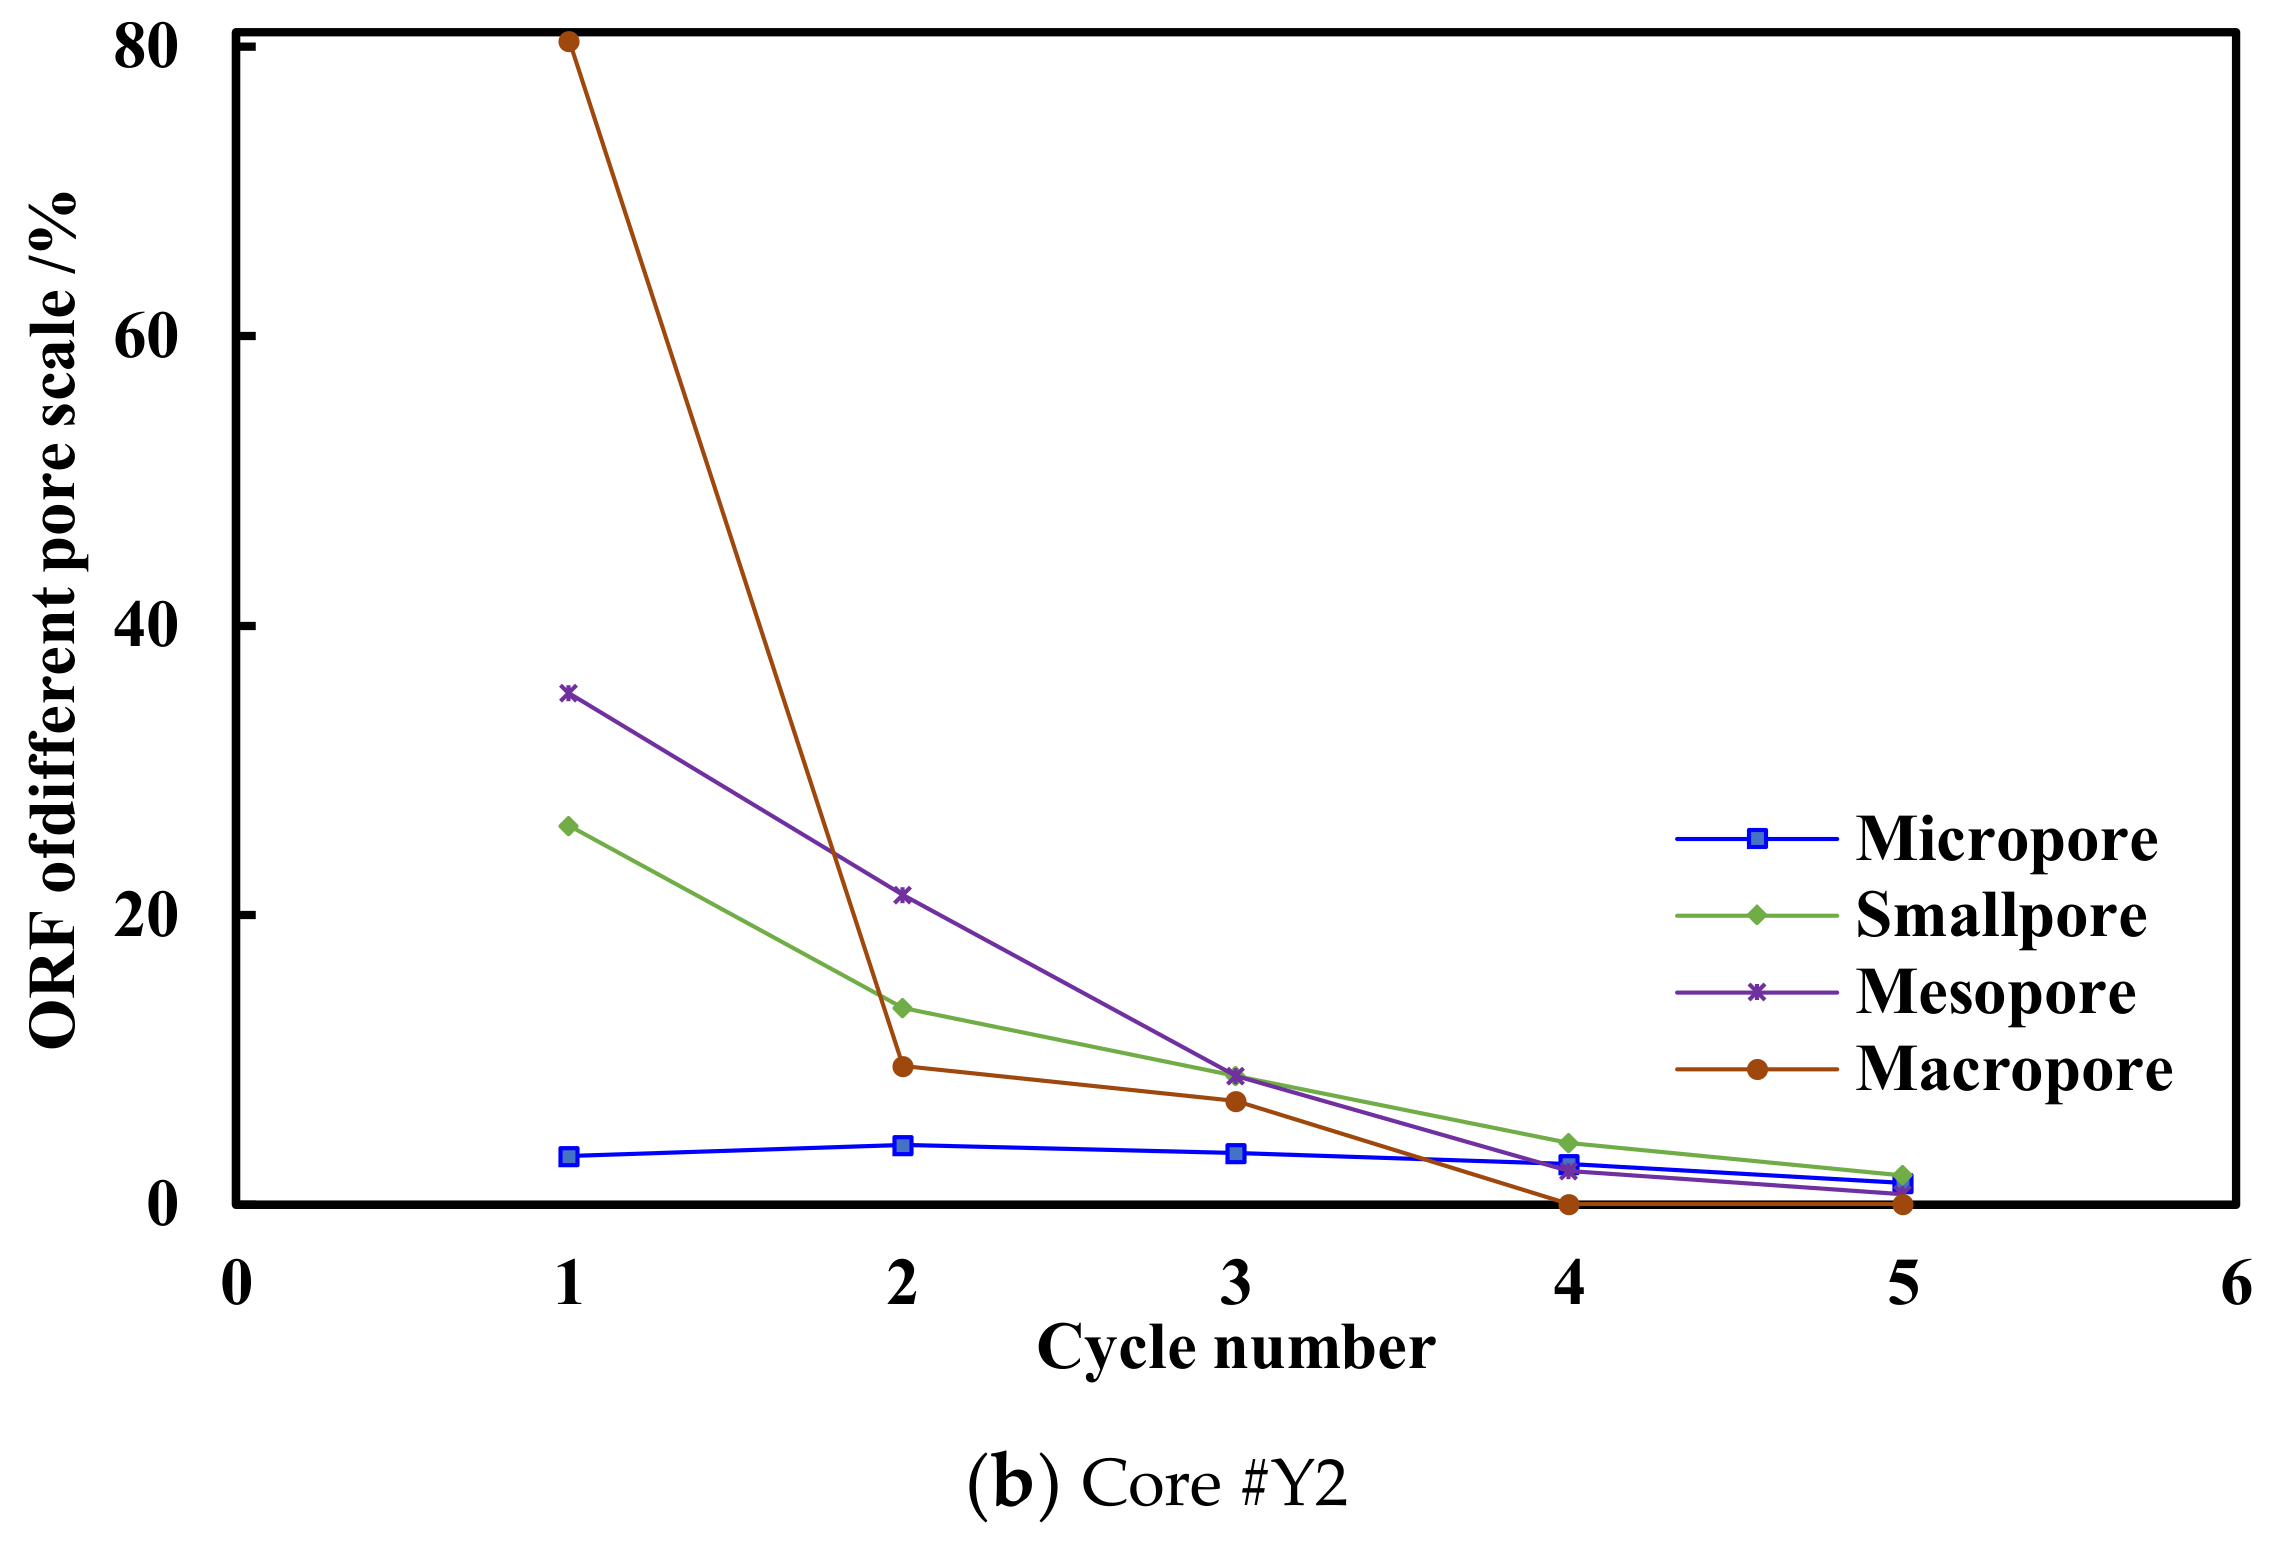
In the first cycle, the oil production was greatest in the macropores. The percentages of the recovery factor were 36.95% and 39.75% for experimental samples. Following was mesopores, accounting for 33.53% and 31.85%, and then 24.11% and 16.21% in the smallpores. Finally, the percentages were at the minimum in the micropores, accounting for only 7.10% and 10.51%. However, with the increase of the injection cycles, the oil production proportion of the macropores continuously decreased and more sharply reduced after the third cycle. Additionally, the oil recovery factors of mesopores also obviously decreased after the third cycle but were generally stable in the smallpores. The percentage gradually increased in the micropores, especially more obviously after the third cycle. After five cycles, the average cumulative ORFs of different pores in the two samples were 97.26%, 70.94%, 64.71%, and 13.89%. The oil production percentages in different pores are shown in Table 4. Therefore, with the increase of the cycle numbers, most oil in macropores and mesopores had flowed out, and the oil in smallpores and micropores became the main oil-producing area after approximately three-to-five cycles of CO2 huff-n-puff.

4.3.2. Characteristics of Remaining Oil Distribution

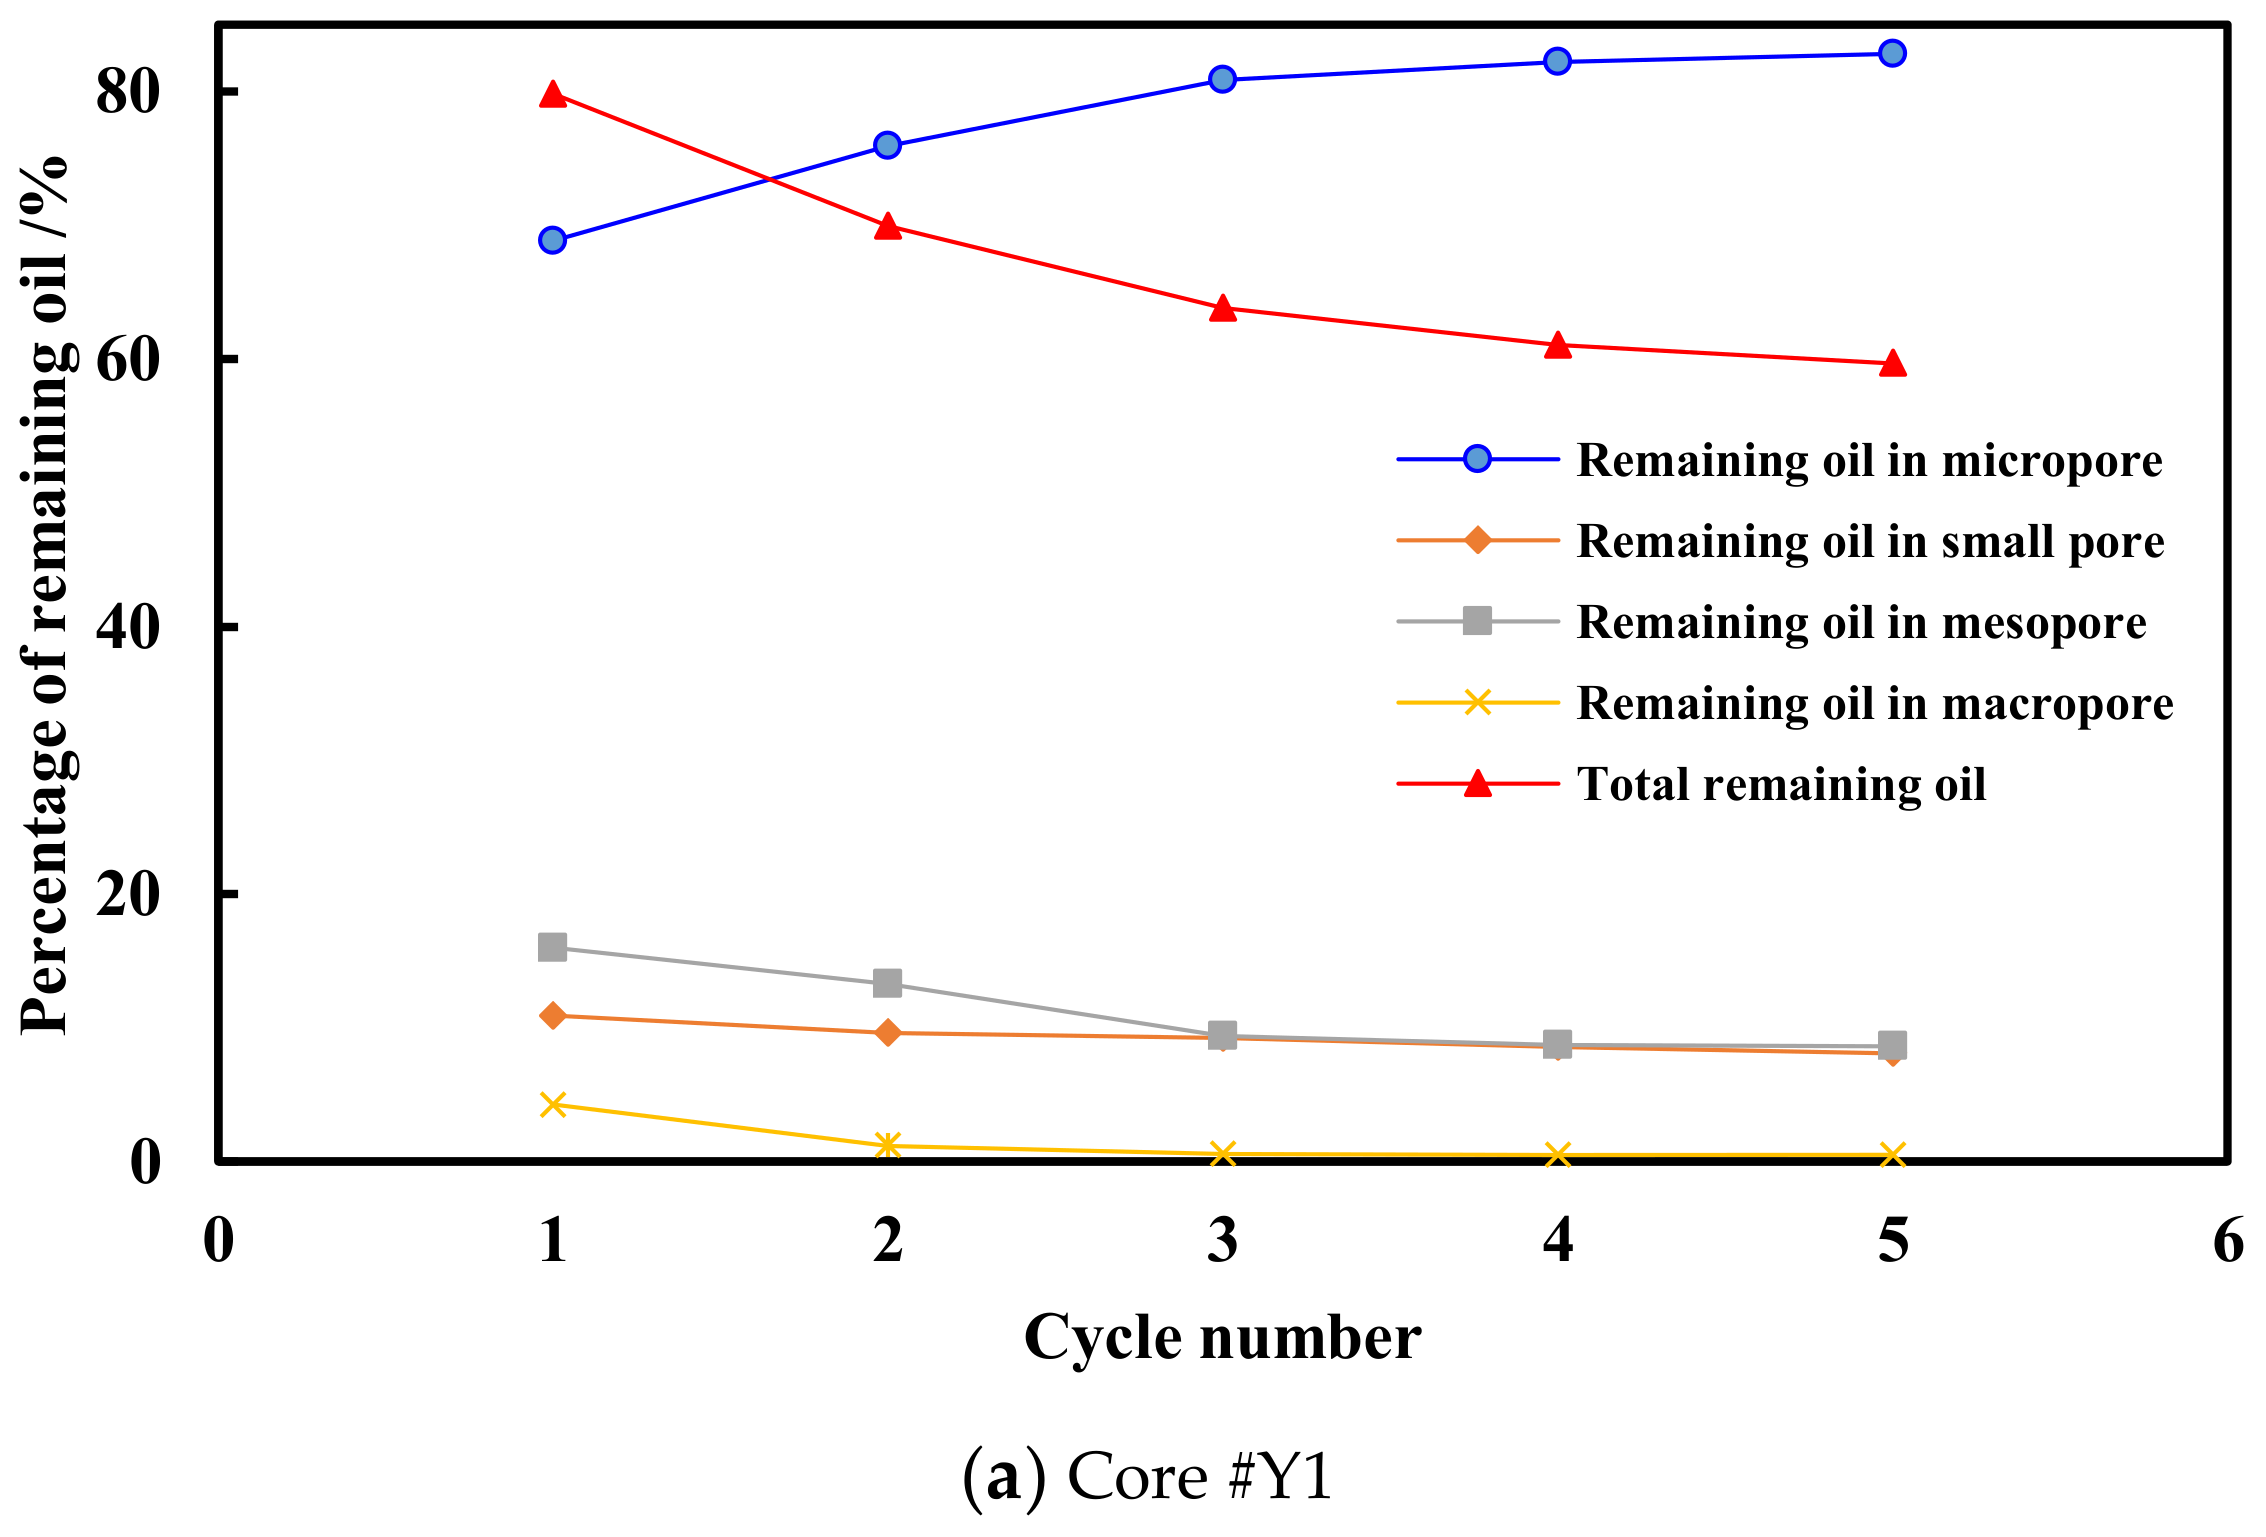
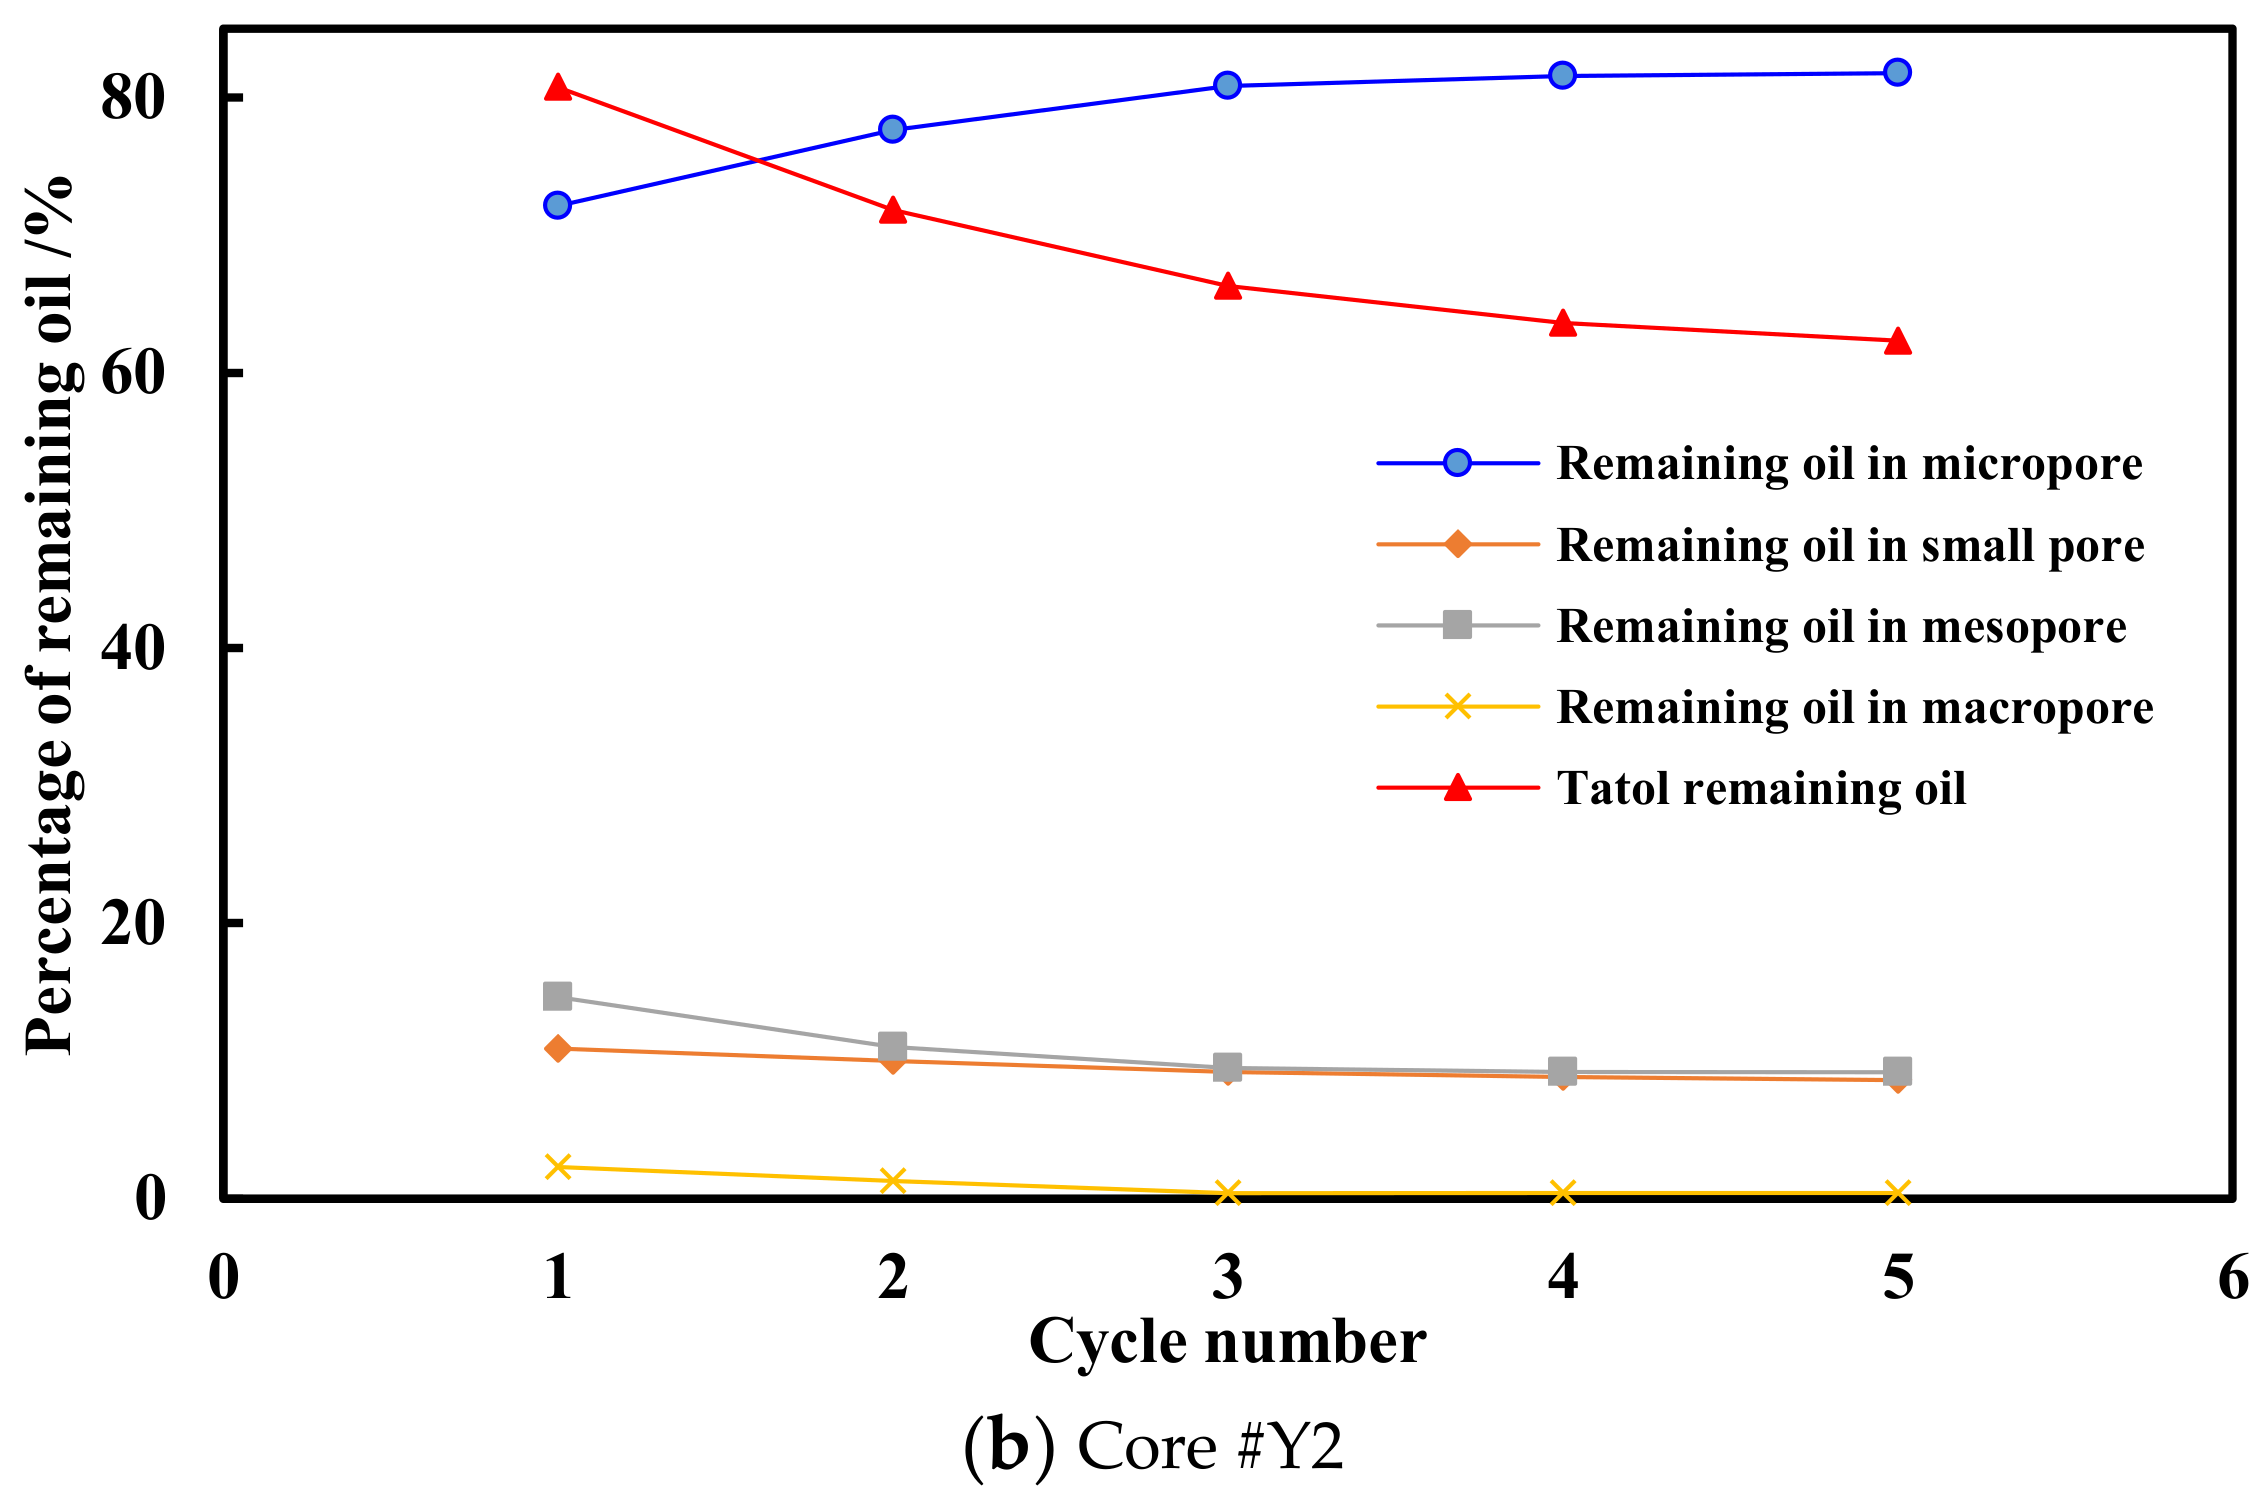
After quantitatively calculating the NMR T2 spectrum curves shown in Figure 11, we were able to obtain the relationship between the remaining oil in different pore sizes and CO2 huff-n-puff cycle numbers, as shown in Figure 12 and Figure 13. The remaining oil saturation was the highest, and the producing degree was the lowest at end of each gas injection cycle in the micropores. The remaining oil saturation was still as high as 87.63% and 84.59% after the entire experiment in the two cores. The remaining oil saturation values of the medium and smallpores were between those of the micropore and macropore, and they obviously dropped in the first three cycles before basically stabilizing at 26.77~45.03%. The remaining oil saturation was only 2.74%, and the producing degree was very high in the macropores. Additionally, the total remaining oil saturation continuously dropped with the cycle numbers, and the average percentages of the remaining oil saturation in the small, medium, and large pores were 8.35%, 8.90%, and 0.46%, respectively, but the percentage in the micropores gradually increased to 82.29%. This means that, after the CO2 huff-n-puff experiment for continental shale oil, the remaining oil was mainly in the micropores, a little was in the medium and smallpores, and an even smaller amount was in the macropores. This showed that there were great differences in the characteristics of mobilization and remaining oil micro-distribution among different sizes of pores. Consequently, the critical problem of EOR for Chang 7 continental shale oil is how to efficiently develop and reduce the remaining oil in the micropores.

5. Process and Mechanism Analysis of CO2 Huff-n-Puff

Alfarge et al. [33,34] summarized several mechanisms for injecting CO2 to improve oil recovery in unconventional reservoirs through laboratory experiments and numerical simulations, as shown in Table 5. For one CO2 huff-n-puff cycle, there are three stages: huff, soak, and puff. During huff, CO2 flows into the reservoir and passes through the fractures, and the rock matrix is encompassed by CO2. Then, the CO2 permeates into the rock by differential pressure and concentration. Some oil is carried into the matrix pores by the flow of CO2, but the oil also swells and some is simultaneously extruded out of the pores. During the soaking period, oil further swells and viscosity is further reduced, and the oil migrates toward the fractures. During puff, the bulk fluid (miscible or immiscible oil and CO2) in the matrix flow towards the fracture, and the oil moves from the pores into the fracture via CO2 diffusion caused by the differential pressure and concentration of the gradually reducing CO2.
However, we analyzed the results of multiple-cycle CO2 huff-n-puff experiments for the Chang 7 continental shale oil reservoir with an ultra-low matrix permeability and a complex pore structure in this study. Then, the processes and mechanisms could be indicated as follows.
(1)
In the first huff-n-puff cycle, CO2 was preferentially injected into the macropores with smaller capillary resistance under the pressure differential effect. Additionally, CO2 was dissolved in the crude oil to generate oil swelling, pressurization, and viscosity reduction. Then, the oil was rapidly produced. Secondly, a small amount of CO2 entered the mesopores and smallpores to produce a little oil. Finally, a tiny amount of oil was obtained by CO2 with diffusion in micropores.
(2)
With the cycle numbers increased, most of the crude oil in the macropores drained, and then the flow resistance and CO2 consumption in the macropores reduced. Therefore, the concentration of the CO2 that contacted and reacted with the remaining oil in the mesopores and smallpores was relatively higher, and the crude oil could be further extracted. However, as shown in Figure 14 and Table 4, the ORF and the percentage of oil production in meso and smallpores both sharply reduced after three injection cycles in this experiment. Analyses have shown that the proportion of adsorbed oil in such pores is higher than that in macropores [36,37], and after several cycles of CO2 huff-n-puff, the free oil basically discharged but the adsorbed oil was hard to extract.
(3)
For the micropores that accounted for more than half of the total pore volume, the shale oil recovery factor was generally at a low level. As shown in Figure 14, though the ORF was found to be the highest in the second cycle, it was also only 3.27% and 4.14% in the first and second cycles, respectively. An analysis showed that the capillary resistance was very large due to the tiny pore size of the micropores. Then, the CO2 mainly entered into the micropores through diffusion to interact with shale oil. Thus, the total amount and rate of CO2 entering the micropores were both lower. Meanwhile, with the production of shale oil in other pores, more CO2 flowed towards the micropores, and the amount of CO2 diffused into the micropores increased, leading to the free oil with a low proportion to quickly discharge. However, the adsorption effect of micropores was stronger, and the remaining adsorbed oil was more difficult to extract. This resulted in the shale oil recovery factor significantly reducing after two cycles of CO2 huff-n-puff.

6. Conclusions

In this paper, the Chang 7 continental shale pore characteristics and radius distribution were analyzed by SEM and NMR T2 spectrum curves, and a series of CO2 huff-n-puff experiments and NMR tests were carried out to investigate the shale oil recovery factor with different cycles, characteristics of production, and amounts of remaining oil distribution in different size pores. The main conclusions based on the above experimental results are as follows.
(1)
In order to study the pore structure of Chang 7 continental shale, a series of SEM and NMR tests were conducted. The SEM images showed that there were massive micro-smallpores and fractures, as well as a few large-scale pores. These results qualitatively characterized the complexity of the pore structure. Furthermore, the T2 spectrum curves of saturated oil and remaining oil had two and three wave crests, respectively. We could quantitatively classify the pores into four types, namely micropore, smallpore, mesopore, and macropore. The proportions of the different pore volumes were 56.38% and 60.26%, 13.57% and 11.93%, 19.19% and 18.29%, 10.85%, and 9.53%, respectively, in the two samples. The above results indicated a strong heterogeneity of the Chang 7 continental shale.
(2)
With the huff-n-puff cycle number, the cumulative ORF gradually increased in the natural logarithmic form, and the single-cycle ORF rapidly decreased in the exponential form. Additionally, the fifth cycle was only 1.37% and 1.29%, respectively, for the aforementioned forms. This shows that an economic production comprises about three-to-five cycles for the shale oil reservoir. Additionally, the higher the permeability was, the higher the ORF was found to be. However, each pore was mainly composed of micropores, and the total capillary force and oil flow resistance were higher, resulting in a difference of ORF that was far less than that of permeability between the two experimental samples.
(3)
A battery of NMR T2 spectrum curves of the CO2 huff-n-puff reflected the recovery factors and remaining oil content of different pores. After five cycles, for the experimental samples, the average cumulative ORF of macropores was greater than 97%, and the mesopores, smallpores, and micropores had average cumulative ORFs of 70.94%, 64.71%, and 13.89%, respectively. Meanwhile, the final remaining oil of micropores accounted for 82.29% of the total amount, and the smallpores, mesopores, and large pores accounted for 8.35%, 8.90%, and less than 0.5%, respectively. These results suggest that the remaining oil was mainly in micropores and rarely in macropores. This reflects that there were great differences in the characteristics of mobilization and the remaining oil micro-distribution among different sizes of pores.
(4)
The shale oil was usually stored freely and adsorbed in the pores. However, the proportion of adsorbed oil in the micropores was higher than that in macropores, and the adsorbed oil was hard to extract. Additionally, the CO2 could more easily flow into macropores, mesopores, and smallpores under the pressure differential effect. However, only small amount of CO2 could slowly diffuse into the micropores, resulting the differences of oil production and remaining oil micro-distribution.
(5)
For the Chang 7 continental shale, large-scale fracturing and acidizing may comprise foundation to promote a better contact and reaction between CO2 and shale oil in micropores. Then, one could effectively develop shale oil, reduce remaining oil, and enhance shale oil recovery.

Author Contributions

Drafting of manuscript: J.Z.; performance of the experiments: X.W. and L.F.; and planning and supervision of the research: J.C. and X.N. All authors have read and agreed to the published version of the manuscript.

Funding

This research was funded by National Natural Science Foundation of China (52004217; 51874239). We would like to express our appreciation to the other members of the laboratory for help provided in experiments and language editing.

Acknowledgments

The authors wish to acknowledge the financial support received from the National Natural Science Foundation of China (52004217; 51874239).

Conflicts of Interest

The authors declare no conflict of interest.

References

  1. Solarin, S.A.; Gil Alana Luis, A.; Lafuente, C. An investigation of long range reliance on shale oil and shale gas production in the U.S. market. Energy 2019, 195, 116933. [Google Scholar] [CrossRef]
  2. Energy Information Administration. U.S. Energy Facts—Energy Explained. 2019. Available online: https://www.eia.gov/energyexplained/?page=us_energy_home (accessed on 17 May 2019).
  3. Zhao, W.Z.; Hu, S.Y.; Hou, L.H. Connotation and strategic role of in-situ conversion processing of shale oil underground in the onshore China. Pet. Explor. Dev. 2018, 45, 537–545. [Google Scholar] [CrossRef]
  4. Hu, S.; Zhao, W.; Hou, L.; Yang, Z.; Zhu, R.; Wu, S.; Bai, B.; Jin, X. Development potential and technical strategy of continental shale oil in China. Pet. Explor. Dev. 2020, 47, 819–828. [Google Scholar] [CrossRef]
  5. Zhao, W.; Hu, S.; Hou, L.; Yang, T.; Li, X.; Guo, B.; Yang, Z. Types and resource potential of continental shale oil in China and its boundary with tight oil. Pet. Explor. Dev. 2020, 47, 1–11. [Google Scholar] [CrossRef]
  6. Gamadi, T.D.; Sheng, J.J.; Soliman, M.Y. An experimental study of cyclic gas Injection to Improve shale oil recovery. In Proceedings of the SPE Annual Technical Conference and Exhibition, New Orleans, LA, USA, 30 September–2 October 2013. [Google Scholar] [CrossRef]
  7. Sun, R.; Yu, W.; Xu, F.; Pu, H.; Miao, J. Compositional simulation of CO2 Huff-n-Puff process in Middle Bakken tight oil reservoirs with hydraulic fractures. Fuel 2019, 236, 1446–1457. [Google Scholar] [CrossRef]
  8. Sheng, J.J. Enhanced oil recovery in shale reservoirs by gas injection. J. Nat. Gas Sci. Eng. 2015, 22, 252–259. [Google Scholar] [CrossRef] [Green Version]
  9. Sheng, J.J.; Chen, K. Evaluation of the EOR potential of gas and water injection in shale oil reservoirs. J. Unconv. Oil Gas Resour. 2014, 5, 1–9. [Google Scholar] [CrossRef]
  10. Elwegaa, K.; Emadi, H.; Soliman, M.; Gamadi, T.; Elsharafi, M. Improving oil recovery from shale oil reservoirs using cyclic cold carbon dioxide injection-An experimental study. Fuel 2019, 254, 115586. [Google Scholar] [CrossRef]
  11. Sheng, J.J.; Mody, F.; Griffith, P.J.; Barnes, W.N. Potential to increase condensate oil production by huff-n-puff gas injection in a shale condensate reservoir. Nat. Gas Sci. Eng. 2013, 28, 46–51. [Google Scholar] [CrossRef] [Green Version]
  12. Jia, B.; Tsau, J.; Barati, R. A review of the current progress of CO2 injection EOR and carbon storage in shale oil reservoirs. Fuel 2019, 236, 404–427. [Google Scholar] [CrossRef]
  13. Li, L.; Su, Y.; Hao, Y.; Zhan, S.; Lv, Y.; Zhao, Q.; Wang, H. A comparative study of CO2 and N2 huff-n-puff EOR performance in shale oil production. J. Pet. Sci. Eng. 2019, 181, 106174. [Google Scholar] [CrossRef]
  14. Li, L.; Sheng, J.J.; Watson, M.; Mody, F. Experimental and Numerical Upscale Study of Cyclic Methane Injection to Enhance Shale Oil Recovery. In Proceedings of the AIChE Annual Conference, Salt Lake City, UT, USA, 8–13 November 2015. [Google Scholar]
  15. Weijermars, R.; Nandlal, K.; Khanal, A.; Tugan, M.F. Comparison of pressure front with tracer front advance and principal flow regimes in hydraulically fractured wells in unconventional reservoirs. J. Pet. Sci. Eng. 2019. [Google Scholar] [CrossRef]
  16. Ho Tuan, A.; Wang, Y. Enhancement of oil flow in shale nanopores by manipulating friction and viscosity. Phys. Chem. Chem. Phys. PCCP 2019, 21, 1–10. [Google Scholar]
  17. Yu, H.; Qi, S.; Chen, Z.; Cheng, S.; Xie, Q.; Qu, X. Simulation Study of Allied In-Situ Injection and Production for Enhancing Shale Oil Recovery and CO2 Emission Control. Energies 2019, 12, 3961. [Google Scholar] [CrossRef] [Green Version]
  18. Gamadi Talal, D.; Elldakli, F. Compositional Simulation Evaluation of EOR Potential in Shale Oil Reservoirs by Cyclic Natural Gas Injection. In Proceedings of the SPE/AAPG/SEG Unconventional Resources Technology Conference, Denver, CO, USA, 25–27 August 2014. [Google Scholar]
  19. Li, L.; Sheng James, J. Gas Selection for Huff-n-Puff FOR in Shale Oil Reservoirs Based upon Experimental and Numerical Study. In Proceedings of the SPE Unconventional Resources Conference, Society of Petroleum Engineers, Calgary, AB, Canada, 15–16 February 2017. [Google Scholar]
  20. Tao, W. Evaluate EOR Potential in Fractured Shale Oil Reservoirs by Cyclic Gas Injection. In Proceedings of the Unconventional Resources Technology Conference, Denver, CO, USA, 12–14 August 2013. [Google Scholar]
  21. Wan, T.; Sheng, J. Compositional Modelling of the Diffusion Effect on EOR Process in Fractured Shale-Oil Reservoirs by Gas flooding. J. Can. Pet. Technol. 2015, 54, 2248–2264. [Google Scholar] [CrossRef]
  22. Gamadi, T.D.; Sheng, J.J.; Soliman, M.Y.; Menouar, H.; Watson, M.C.; Emadibaladehi, H. An experimental study of cyclic CO2 Injection to Improve shale oil recovery. In Proceedings of the SPE Improved Oil Recovery Symposium, Tulsa, OK, USA, 12–16 April 2014. [Google Scholar] [CrossRef]
  23. Zhang, Y.; Yu, W.; Li, Z.; Sepehrnoori, K. Simulation study of factors affecting CO2 huff-n-puff process in tight oil reservoirs. J. Pet. Sci. Eng. 2018, 163, 264–269. [Google Scholar] [CrossRef]
  24. Wei, B.; Zhong, M.; Gao, K.; Li, X.; Zhang, X.; Cao, J.; Lu, J. Oil recovery and compositional change of CO2 huff-n-puff and continuous injection modes in a variety of dual-permeability tight matrix-fracture model. Fuel 2020, 276, 117939. [Google Scholar] [CrossRef]
  25. Wang, X.; Xiao, P.; Yang, Z.; Liu, X.-W.; Xia, Z.-Z.; Wang, L.-Q. Laboratory and field-scale parameter optimization of CO2 huff-n-puff with the staged-fracturing horizontal well in tight oil reservoir. J. Pet. Sci. Eng. 2019, 186, 106703. [Google Scholar] [CrossRef]
  26. Li, J.; Jin, W.; Wang, L.; Wu, Q.; Lu, J.; Hao, S. Quantitative evaluation of organic and inorganic pore size distribution by NMR: A case from the Silurian Longmaxi Formation gas shale in Fuling area, Sichuan Basin. Oil Gas Geol. 2016, 37, 129–134. [Google Scholar] [CrossRef]
  27. Liu, J.; Sheng, J.J. Experimental investigation of surfactant enhanced spontaneous imbibition in Chinese shale oil reservoirs using NMR tests. J. Ind. Eng. Chem. 2018, 72, 414–422. [Google Scholar] [CrossRef]
  28. Gu, X.; Pu, C.; Huang, H.; Huang, F.; Li, Y.; Liu, Y.; Liu, H. Micro-influencing mechanism of permeability on spontaneous imbibition recovery for tight sandstone reservoirs. Pet. Explor. Dev. 2017, 44, 948–954. [Google Scholar] [CrossRef]
  29. Lai, F.; Li, Z.; Wei, Q.; Zhang, T.; Zhao, Q. Experimental investigation of spontaneous imbibition in tight reservoir with nuclear magnetic resonance testing. Energy Fuels 2016, 30, 8932–8940. [Google Scholar] [CrossRef]
  30. Nie, X.; Chen, J. Nuclear Magnetic Resonance Measurement of Oil and Water Distributions in Spontaneous Imbibition Process in Tight Oil Reservoirs. Energies 2018, 11, 3114. [Google Scholar] [CrossRef] [Green Version]
  31. Pu, W.; Wei, B.; Jin, F.; Li, Y.; Jia, H.; Liu, P.; Tang, Z. Experimental investigation of CO2 huff-n-puff process for enhancing oil recovery in tight reservoirs. Chem. Eng. Res. Des. 2016, 111, 13256–13271. [Google Scholar] [CrossRef]
  32. Ma, Q.; Yang, S.; Lv, D.; Wang, M.; Chen, J.; Kou, G.; Yang, L. Experimental investigation on the influence factors and oil production distribution in different pore sizes during CO2 huff-n-puff in an ultra-high-pressure tight oil reservoir. J. Pet. Sci. Eng. 2019, 178, 1155–1163. [Google Scholar] [CrossRef]
  33. Alfarge, D.; Wei, M.; Bai, B. CO2-EOR mechanisms in huff-n-puff operations in shale oil reservoirs based on history matching results. Fuel 2018, 226, 112–120. [Google Scholar] [CrossRef]
  34. Alfarge, D.; Wei, M.; Bai, B. Factors affecting CO2-EOR in shale-oil reservoirs: Numerical simulation study and pilot tests. Energy Fuel 2017. [Google Scholar] [CrossRef]
  35. Lang, D.; Lun, Z.; Lyu, C.; Wang, H.; Zhao, Q.; Sheng, H. Nuclear magnetic resonance experimental study of CO2 injection to enhance shale oil recovery. Pet. Explor. Dev. 2021, 48, 1–10. [Google Scholar]
  36. Zhang, S.; Li, , Y.; Pu, H. Studies of the storage and transport of water and oil in organic-rich shale using vacuum imbibition method. Fuel 2020, 266, 117096. [Google Scholar] [CrossRef]
  37. Cui, J.; Cheng, L. A theoretical study of the occurrence state of shale oil based on the pore sizes of mixed Gaussian distribution. Fuel 2017, 206, 564–571. [Google Scholar] [CrossRef]
Figure 1. NMR T2 spectrum curve of before and after the experiment. 1 denotes the oil-bearing T2 spectrum curves before the experiment, and 2 denotes the oil-bearing T2 spectrum curves after the experiment.
Energies 14 02782 g001
Figure 2. Chang 7 formation core samples used in this study.
Energies 14 02782 g002
Figure 3. The calibration curve of n-dodecane vs. NMR signal amplitude.
Energies 14 02782 g003
Figure 4. Schematic of the apparatus for the CO2 huff-n-puff experiments. The red numbers 1, 2 and 3 denote three different valves in the six-way valve.
Energies 14 02782 g004
Figure 5. SEM images of core samples. (a) The full view of SEM image magnified 53 times shows that the rock was tight. (bd) The SEM images magnified 794, 2220, and 2790 times show the clay minerals of lamellar illite, crystalline pyrite, and micropores/fractures, respectively. (Note: the red circles are pores and fractures, the yellow circles are crystalline pyrite, and the green circles are illite.).
Energies 14 02782 g005
Figure 6. T2 spectrum curves of initial saturated oil in cores.
Energies 14 02782 g006
Figure 7. The histogram of pore radius distribution.
Energies 14 02782 g007
Figure 8. Cumulative ORF versus cycle numbers.
Energies 14 02782 g008
Figure 9. ORF of different CO2 injection cycles.
Energies 14 02782 g009
Figure 10. Difference of ORF versus different CO2 injection cycles.
Energies 14 02782 g010
Figure 11. NMR T2 spectrum curve after different cycles under 15 Mpa.
Energies 14 02782 g011
Figure 12. Remaining oil saturation in different pore scales.
Energies 14 02782 g012
Figure 13. Percentage of remaining oil in different pore scales.
Energies 14 02782 g013aEnergies 14 02782 g013b
Figure 14. ORF of different pore scales versus cycle number.
Energies 14 02782 g014aEnergies 14 02782 g014b
Table 1. Physical properties of the core samples.
Core No.Diameter, cmLength, cmPorosity, %Permeability, 10−3 μm2
Core #Y12.4983.4235.770.2911
Core #Y22.5003.5736.060.0169
Table 2. Relationship between T2, pore radius, and pore type.
T2 Relaxation Time, msPore Radius, μmPore Type
T2 < 1r < 0.020micropore
1 ≤ T2 < 100.020 ≤ r < 0.25smallpore
10 ≤ T2 < 1000.25 ≤ r < 2.0mesopore
T2 ≥ 100r ≥ 2.0macropore
Table 3. Pores’ volume ratio of different scales (%).
Core No.Micropore
<r1
Smallpore
r1r < r2
Mesopore
r2r < r3
Macropore
r3
Core #Y156.3813.5719.1910.85
Core #Y260.2611.9318.299.53
Table 4. Percentage of oil production in different pore scales (%).
Cycle NumberCore #Y1Core #Y2
Micro
<r1
Small
r1 < r < r2
Meso
r2 < r < r3
Macro
>r3
Micro
<r1
Small
r1 < r < r2
Meso
r2 < r < r3
Macro
>r3
17.1024.1131.8536.9510.5116.2133.5339.75
218.6520.0335.1926.1327.8818.1643.7610.20
324.8513.5453.877.7438.9619.1929.4812.38
450.9624.9123.061.0764.5719.3415.890.21
555.9428.7114.071.2770.5118.7210.360.42
Table 5. The mechanism of CO2-EOR in unconventional reservoirs (Modified on the basis of Alfarge et al. [34] and Lang D. et al. [35]).
CO2 MechanismApproach Tool
1: CO2 diffusion and molecular diffusionLab and simulation
2: Reduction in Capillary forcesLab and simulation
3: DissolutionLab
4: ReplacementLab
5: MiscibleSimulation
6: RepressurizationLab
7: ExtractionLab
8: Oil swelling and pressure maintenanceLab and simulation
9: Oil Viscosity reductionLab and simulation
10: Combination of more than one mechanism from above
Publisher’s Note: MDPI stays neutral with regard to jurisdictional claims in published maps and institutional affiliations.