Article

Numerical Simulation of Fluidized Bed Gasifier Coupled with Solid Oxide Fuel Cell Fed with Solid Carbon

1
School of Chemical Engineering and Technology, Xi’an Jiaotong University, Xi’an 710049, China
2
State Key Laboratory of Multiphase Flow in Power Engineering, Xi’an Jiaotong University, Xi’an 710049, China
*
Author to whom correspondence should be addressed.
Energies 2021, 14(10), 2800; https://doi.org/10.3390/en14102800
Submission received: 4 April 2021 / Revised: 7 May 2021 / Accepted: 8 May 2021 / Published: 13 May 2021
(This article belongs to the Special Issue Progress and Novel Applications of Fluidized Bed Technology)

Abstract

:
A model of a fluidized bed coupled with direct carbon solid oxide fuel cell (SOFC) is developed to explore the effect of coupling between fluidized bed and solid oxide fuel cell. Three gas–solid flow regimes are involved including fixed bed, delayed bubbling bed and bubbling bed. The anode reaction of SOFC is treated as the coupling processes of Boudouard gasification of carbon and electrochemical oxidation of CO. The effects of inlet velocity of the fluidizing agent CO2, carbon activity, channel width and coupling extent on the system performance are investigated. The results show that the inlet velocity of CO2 can promote the gasification rate in the anode, but too high velocities may lower CO molar fraction. The gasification rate generally increases with the increase of the channel width and carbon activity. The overlapping area between the anode surface and the initial carbon bed, gas–solid regime and carbon activity have a significant influence on the gasification rate and the maximum current density the system can support. Overall, the mass transport in the anode is dramatically enhanced by the expansion of the carbon bed, back-mixing, solid mixing and gas mixing, especially for the delayed bubbling bed and bubbling bed. This indicates that the adopted coupling method is feasible to improve the anode performance of direct carbon solid oxide fuel cell.

1. Introduction

Direct carbon solid oxide fuel cell (DC-SOFC) is an electrochemical device that converts the chemical energy in solid carbon into electrical energy at an elevated temperature with high efficiency, fuel flexibility and low pollution [1,2,3,4]. The total reaction occurring in DC-SOFCs is C(s) + O2(g) → CO2(g), which is the same as the combustion of carbon, while the difference is that the solid carbon in DC-SOFC is electrochemically oxidized in the anode chamber by O2− ion transporting through the electrolyte and CO2 and electrons are produced in the anode without touching with oxygen or air. The electrons transport through external circuit generating electricity. The high concentration of CO2 produced in the anode is cost-effective for capture and storage, and minimizing NOx is produced [5,6,7,8]. The theoretical thermodynamic efficiency of DC-SOFC is close to 100%, much higher than that of a traditional coal-fired power station, which is limited by the Carnot cycle.
Compared with other fuel cells fed with gaseous fuel (such as H2, natural gas, CH4), the exclusive characteristic of DC-SOFC is the solid fuel, which has a higher volumetric energy density. The solid fuel is convenient and safe to transport and can be obtained widely from coal [9,10,11,12,13,14,15] and biomass [3,16] (such as almond shells [17], wheat straw [18], corn cob char [19], pepper straw [20], and pomelo peel [21]). The concentration of solid fuel will not decrease due to the co-existence with gaseous products during the operation of the fuel cell, and thus the theoretical potential will not reduce. However, the solid fuel is too stable to be oxidized, and thus the DC-SOFCs need to work at elevated temperatures (600~1000 °C) and the direct electrochemical reaction of solid fuel can only occur at the solid–solid interface between fuel and electrolyte, which limits the performance of DC-SOFCs.
Although the solid–solid interface is limited and the direct electrochemical oxidation of solid carbon is ignorable, CO produced by Boudouard gasification (C(s) + CO2(g) → 2CO(g)) can act as a shuttle between solid carbon and the TPBs (triple phase boundaries, TPBs) in anodes of SOFC [22,23,24]. CO is electrochemically oxidized into CO2 (CO(g) + O2− → CO2(g)) at TPBs and CO2 can transfer back to solid carbon and produce CO according to Boudouard gasification. Based on this mechanism, the performance of DC-SOFC will be affected by the electrochemical oxidation of CO at TPBs in anodes, the Boudouard gasification and mass transport between anode and solid carbon fuel [25,26,27]. Besides development of new anode material and microstructure [19,28,29,30], which can improve catalytical activity, mass transport, ionic or electronic conductivities of anode, plenty of experimental evidence demonstrates that carbon activity and transport properties in the anode can significantly influence the DC-SOFC performance [3,13,17,21,25,31,32,33,34]. Liu et al. [31] operated a tubular SOFC fed with the activated carbon and the results indicated that the fuel gas in the anode was insufficient and the mass transport in the anode was poor. Cai et al. analyzed [25] the qualitative coupling relationship between the gasification of a fixed carbon bed and SOFC, and found that when the gasification rate ( R tot ) was larger than the electrochemical oxidation rate of CO( R e ) and smaller than 2 R e , DC-SOFC could continuously maintain the composition of exhaust gas varied with the R tot / R e . Bai et al. [32] added 5wt.% Fe in the form of Fe2O3 into the activated carbon and the peak power density (PPD) reached 465 mW/cm2 at 850 °C, but the stability of DC-SOFC was limited due to degradation of the Boudouard gasification rate. Jiao et al. [33] compared the effect of desulfurization of the low-rank coal on the performance of DC-SOFC with nickel-yttrium stabilized zirconia (Ni-YSZ) anode and the PPD increased from 115 to 221 mW/cm2 at 900 °C after desulfurization. An et al. [21] operated DC-SOFC with a Ni-YSZ anode utilizing pomelo peel char as fuel; the PPD was as high as 518 mW/cm2 and the limiting current density was higher than 16,500 A/m2. Zhou et al. [34] found that the open circuit voltage (OCV), PPD, and fuel utilization reduced with increasing distance between the fixed carbon bed and anode. When there was no gas flowing into the anode chamber, the cell performance including OCV, PPD, and limiting current density would reduce with increasing anode chamber size. They also found that a smaller anode chamber results in a lower overall resistance and a higher PPD and OCV. According to the above experimental studies, it is deduced that the activity of carbon fuel and mass transport in the anode chamber has a remarkable influence on cell performance. However, all of the above studies are based on a fixed carbon bed in which the major mass transport mechanism in the anode chamber is diffusion and natural convection. In such systems, the mass transport and Boudouard gasification rate of the carbon bed reduced significantly as the operation went on, causing a poor cell durability.
To enhance the Boudouard gasification and the mass transport in the anode chamber and further improve cell durability, Gür et al. [11,17,23] proposed a fluidized bed coupled with DC-SOFC. As a preliminary study, they chose helium as the fluidizing gas to establish the relationship between oxygen atom flux in anode exhaust and the oxygen ion flux through electrolyte [35]. Simultaneously, Lee et al. [17] tested different carbonaceous fuels, such as synthetic carbon, coal, and biomass, in a fluidized anode of DC-SOFC, and the results showed that the type of carbon fuel had a significant influence on cell performance. Thereafter, Gür et al. [11] developed a fluidized bed gasifier integrated with SOFC, in which the gasifier and SOFC could operate separately at different temperatures, while the effluent gas from a gasifier was able to directly flow into the tubular SOFC. They tested the effect of inlet velocity on the concentration of effluent gas to ensure that the equilibrium concentration of CO is obtained in the outlet of gasifier and the PPD of SOFC achieved as high as 0.45 W/cm2 at 0.64 V with fuel utilization of 55%. Lee et al. [36] modeled the Boudouard gasification integrated with SOFC and emphasize was put on the gasification of carbon. They obtained the kinetic parameters for the Boudouard gasification experimentally and operated a fluidized carbon bed under different carbon bed heights, temperatures, and inlet flow velocities. However, in these studies, the carbon bed was described as a porous media and the moving of solid carbon particles was ignored.
Although an excellent contribution to the technology of gasifiers coupled with SOFC was made by researchers, most of the studies focused on the fixed bed. The bed with buoyancy and suspensions of solid particles was not considered [17,23,35,36,37,38]. As mentioned above, mass transport in the fixed carbon bed is the limiting factor for the performance and stability of DC-SOFCs [31,34] and can be enhanced with increasing gas velocities, especially when the solid particles are fluidized. The aim of this study is to numerically explore the influence of the coupling between SOFC and fluidized bed gasifiers on the system performance. Firstly, the gas–solid flow regimes (including fixed bed, delayed bubbling bed and bubbling bed) changing with inlet velocities are calculated; secondly, the fluidized bed gasifiers with different active carbon fuels, CO2 inlet velocities and channel width are investigated; thirdly, the fluidized bed gasifier coupled with SOFCs under different current densities are explored. The benefits of gas–solid flows and coupling between gasifiers and SOFC are illustrated and a feasible method to improve the cell performance of DC-SOFC is suggested.

2. Physicochemical Model

Figure 1 shows the model of the fluidized bed gasifier coupled with DC-SOFC. There are several advantages to coupling SOFC with a fluidized bed gasifier. Firstly, compared with direct electrochemical oxidation of solid carbon where the solid–solid contact between solid carbon fuel and active sites in anodes is requisite; SOFC coupled with a fluidized bed gasifier can dramatically promote the cell performance by increasing the contact area between active sites and fuel. Secondly, compared with operating SOFC and fluidized bed gasifier separately, SOFC coupled fluidized bed gasifier can provide a more uniform concentration of fuel gas by in situ gasification in the anode chamber, as shown in the next section. Thirdly, Boudouard gasification is endothermic, while SOFC will release heat unavoidably. When combining SOFC and gasifier in the same chamber, the efficiency of system can be improved further by thermal coupling. Lastly, the balance of plant for DC-SOFC can be simplified. In this study, the simulations are conducted to explore the coupling effect on mass transport in the anode chamber. The heat transfer between SOFC and gasifier will be considered in the further work and is neglected here.
In fluidized bed gasifiers coupled with SOFC, as shown in Figure 1, there are several coupled physicochemical processes, namely, the gas–solid flow, Boudouard gasification of solid carbon, electrochemical oxidation of CO occurring at TPBs in the anode and the mass transport in the chamber. These physicochemical models are introduced below.

2.1. Boudouard Gasification of Carbon

The thermodynamic mechanism proposed by Ma et al. [39] was used to describe Boudouard gasification of solid carbon particles. In this model, Boudouard gasification can be divided into five steps: (1) a reversible CO2 adsorption reaction on the free carbon site producing CO gas and oxygenated carbon site; (2) the escape of surface oxygenated carbon from the bondage of surrounding atoms in the bulk; (3) the interaction of CO2 and a chemisorbed oxygen, which is a rate-limiting step; (4) the reversible CO adsorption on the active sites; and (5) the formation of CO2 by interacting between CO gas and adsorbed CO, as shown follows.
CO 2 g + C f k 1 f k 1 b CO g + C O
C b + C O k 2 CO g + C f
C b + CO 2 g + C O k 3 2 CO g + C O
C f + CO g k 4 f k 4 b C CO
CO g + C CO k 5 CO 2 g + 2 C f
where C f represents the free carbon site on the solid surface, C O is oxygenated carbon, C b is the carbon atom in the solid particle, C CO is adsorbed CO on the free carbon site, ki is the reaction rate constant of the ith reaction and the subscripts ‘f’ and ’b’ mean the forward and backward of the reversable reactions, respectively. The reaction rate constant k i of the ith reaction can be calculated according to Arrhenius equation,
k i = A i exp E i R T
where A i is pre-exponent constant, E i is activation energy (J/mol), R is ideal gas constant and R = 8.314 J/(mol·K), and T is operation temperature (K). The values of A i and E i measured using pressurized thermogravimetric analyzer were used (shown in Table 1) [36,37] The more details of measurements procedure are introduced elsewhere [36,39]. In the steady condition, the concentrations of C f , C O , C CO on the solid surface are in equilibrium and the sum of their concentration fraction is unit,
d C O d t = k 1 f CO 2 g C f k 1 b CO g C O k 2 C O = 0
d C CO d t = k 4 f CO 2 g C f k 4 b C CO k 5 C CO CO g = 0
where [ ] denotes the concentration in unit of mol/m2 for C f , C O , C CO on the solid surface and mol/m3 for CO g and CO 2 g in the chamber. The Boudouard gasification rate, R C (mol/(m2·s)), of solid carbon can be calculated,
R C = M C A s k 2 C O + k 3 CO 2 g C O k 4 f CO 2 g C f + k 4 b C CO
where M C is the molar mass of carbon (g/mol) and A s is the active site density (mol/m2). The production rate R CO (mol/s) of CO can be obtained by,
R CO = 2 R C S C m p
where S C denotes the specific area of carbon particle (m2/g) and m p denotes the mass of the particle (g). According to this thermodynamic mechanism, R C varies with operating temperature and CO2 concentrations.

2.2. Momentum and Mass Transport in Gas–Solid Flows

Reactive gas–solid flows are described based on two-fluid model (TFM). In TFM, the governing equations for gas–solid flows with chemical reaction are briefly introduced as follows. The continuum equations for the solid carbon and gas are,
ε g ρ g t + ε g ρ g U g i x i = N p Δ m p
ε C ρ C t + ε C ρ C U C i x i = N p Δ m p
where ε g , ε C are volume fractions of gas and carbon particle (vol.%); ρ g , ρ C are densities of gas and carbon particle (g/m3); U g i , U C i are velocities of gas and carbon particle along i direction (m/s); t is time (s); N p is the number of carbon particles per volume (1/m3); Δ m p is the consumption rate of carbon particle (g/s). The first term on the left is the accumulation term of the total mass, the second term denotes the convection term, and the term on the right-hand side is the interphase mass transfer due to Boudouard gasification. The species conversion equations of CO and CO2 are,
ε g ρ g X CO t + ε g ρ g U g i X CO x i = x i D CO X CO x i + 2 M CO M C N p Δ m p
ε g ρ g X CO 2 t + ε g ρ g U g i X CO 2 x i = x i D CO 2 X CO 2 x i M CO 2 M c N p Δ m p
where X CO , X CO 2 denote mass fractions of CO and CO2 (wt.%); D CO , D CO 2 represent diffusivities of CO and CO2 (g/(m·s));  M C ,   M CO and M CO 2 . are molar mass of carbon, CO and CO2, and M C = 12 g/mol, M CO = 28 g/mol, M CO 2  = 44 g/mol. The terms on the left hand are the mass accumulation and convective species mass flux, respectively. Those on the right-hand side are the diffusive species mass flux and source term due to Boudouard gasification. The momentum conversion equations for gas and solid phases are,
ε g ρ g U g i t + ε g ρ g U g j U g i x j = ε g σ g i j x j F gC i + ε g ρ g g i + S gC
ε C ρ C U C i t + ε C ρ C U C j U C i x j = ε C σ g i j x j + σ C i j x j + F gC i + ε C ρ C g i S gC
U g i , U C i are the velocities of gas and solid carbon along direction i (m/s); σ g i j , σ C i j are the gas and solid carbon stress tensors (Pa); F gC i is gas/carbon momentum interface transfer caused by physical interaction between gas and solid carbon (N/m3); g i is acceleration due to gravity (m2/s); S gC is the momentum transfer caused by Boudouard gasification (N/m3). F gC i is calculated using the model correlated by Gidaspow et al. [40]. The detailed description of the governing equations for gas–solid flows can be obtained in references [41,42].

2.3. Electrochemical Reaction of CO

SOFC consists of a porous anode and cathode, as well as compact electrolytes in between. In the anode, there are electronic conductors (such as Ni, Ag, Pt), ionic conductors (such as YSZ, GDA), and pores. CO is treated as the only fuel of SOFC and the direct electrochemical oxidation of solid carbon in SOFC is ignorable due to the ignorable contact between solid carbon and TPBs. During operation, the electrochemical reaction occurs at the triple-phase boundaries (TPBs) in the anode where oxygen ions and CO are consumed, producing CO2 gas and electrons as follows,
CO g + O 2     CO 2 g + 2 e
The produced CO2 diffuses away from the porous anode and reacts with solid carbon particles in the anode chamber or flows away from the chamber. Electrons travel along the current collector and external circuit and then into the cathode of SOFC. In the cathode, electrons and O2 combine with each other and the reaction is,
O 2 g + 4 e     2 O 2
The produced oxygen ion O 2 passes the electrolyte and reacts with CO in the anode. The relationship between current density, I, and CO consumption rate, J CO (CO2 production rate, J CO 2 ) on the anode surface can be described by,
J CO 2 = J CO = I n F
where F is the Faraday constant and F = 96,485.3 C/mol, n is the number of electrons transferred per CO oxidized and n = 2. The theoretical potential EDC-SOFC of DC-SOFC can be calculated according to the Nernst equation,
E DC SOFC = Δ G 0 n F + R T n F ln P CO , a P O 2 , c 0.5 P CO 2 , a = Δ G 0 n F + R T n F ln C CO , a C O 2 , c 0.5 C CO 2 , a
where Δ G 0 represents the Gibbs free energy of reaction CO g + 1 / 2 O 2 g = CO 2 g J / mol ; P CO , a , P CO 2 , a , P O 2 , c are partial pressures of CO, CO2 in the anode and O2 in the cathode, respectively, and P O 2 , c = 0.21 atm when air is used as oxidant; C CO , a , C CO 2 , a , C O 2 , c are the molar fraction of CO, CO2 in the anode and O2 in the cathode, respectively, and C O 2 , c = 21.0 mol.%.

2.4. Model Assumption

The main assumptions adopted in this simulation are shown as below:
1. The carbon particle is treated as a porous sphere with 155 μm diameter whose specific area is 750 m2/g [36]. The mass transport rate inside the particle is sufficiently large to keep the Boundouard gasification in a kinetically limited regime. In other words, the reaction rate of the gasification is uniquely determined by the kinetic rate. Since the material parameter in present study is same as that in [36], the reasonability of this assumption has been tested using the Thiele modulus in that literature.
2. The mass change of carbon particles is ignored. Compared with the total mass of carbon particles, the consumed carbon estimated using the maximum kinetic rate in the present study is less than 1.2% after 30 s when the simulation reaches the statistically quasi-steady state; thus, the mass change of carbon particles is ignorable and the particle density could be regarded as invariant during simulation.
3. Temperature is uniform, and heat transfer in the system is not considered.
4. CO2 and CO are only gases in the anode chamber and are treated as ideal gases.
5. SOFC is working underfixed current density mode and SOFC is simplified as reactive boundary with different fixed species fluxes.

3. Simulation Method

The simulation is conducted in MFiX 19.2.2 (Multiphase Flow with Interphase eXchange, MFiX), a free open-source multiphase flow resolver, which is a powerful tool to simulate the gasification of solid fuel and allows users to develop model conveniently [43]. TFM is the most mature model in MFiX and can calculate dense, reactive multiphase flow by treating both solids and gases as interpenetrating continua. TFM is adopted to describe the gas–solid flow and the governing equations are solved using finite volume method. The implicit Euler scheme with the first-order accurate is employed for temporal discretization and Superbee, a second-order accurate scheme, is used for spatial discretization. The automatic time-step adjustment is utilized to accelerate calculation. A grid size smaller than 8 d p ( d p stands for the diameter of solid particle) is thought to be fine enough [42,44]; about 4 d p is adopted here to achieve a satisfied accuracy and grid independency. The electrochemical reactions occur in SOFC are treated as reactive boundary conditions in MFiX and the SOFCs are operating under fixed current densities.
The fluidized bed gasifier coupled with DC-SOFC is simplified as a 2D rectangle domain with the size of W × HR, where W is the width and HR is the height. The initial still carbon bed is HC high with 45.0% porosity, as shown in Figure 1. The fluidizing agent CO2 flow into the channel from the bottom with different velocities, and the carbon particles react with CO2 producing CO according to Boudouard gasification as described in Section 2.1. CO is electrochemically oxidized on the SOFC boundaries and CO2 is produced at the same time. The parameters adopted in this simulation are listed in Table 2.
The boundary conditions are set as below. The bottom of the channel is the inlet and a constant velocity with 100.0 mol.% CO2 is set; the upper part of the channel is the outlet and an atmospheric pressure is applied; the side walls of the channel are non-flux boundaries when no SOFCs are placed and are reactive boundaries with fixed species fluxes when SOFCs are applied. It should be noted that even though the SOFC is coupled with a fluidized gasifier, not all of side walls are SOFCs. That is to say, only part of the side walls are reactive boundaries and other parts are still non-flux boundaries. Additionally, in typical fluidized beds, the gas inflow exhibits a fluctuating behavior owing to the limited pressure drop in the distributor. This feature indeed has a considerable effect on the bubble evolution and mass transfer [45]. In this study, the continuous gas inflow is set, and the effect of the pulsed inlet condition is left for the future.

4. Results and Discussion

In this section, the model of fluidized bed gasifier is tested by comparing with experimental study first, and then the effects of CO2 inlet velocity,   v CO 2 , in , activity of carbon fuel and channel width, W, on the performance of gasifier are discussed. Finally, fluidized bed gasifiers coupled with SOFC are explored and the influences of coupling between SOFC and three typical gas–solid flows, namely fixed bed, delayed bubbling bed and bubbling bed, are explored.

4.1. Model Validation

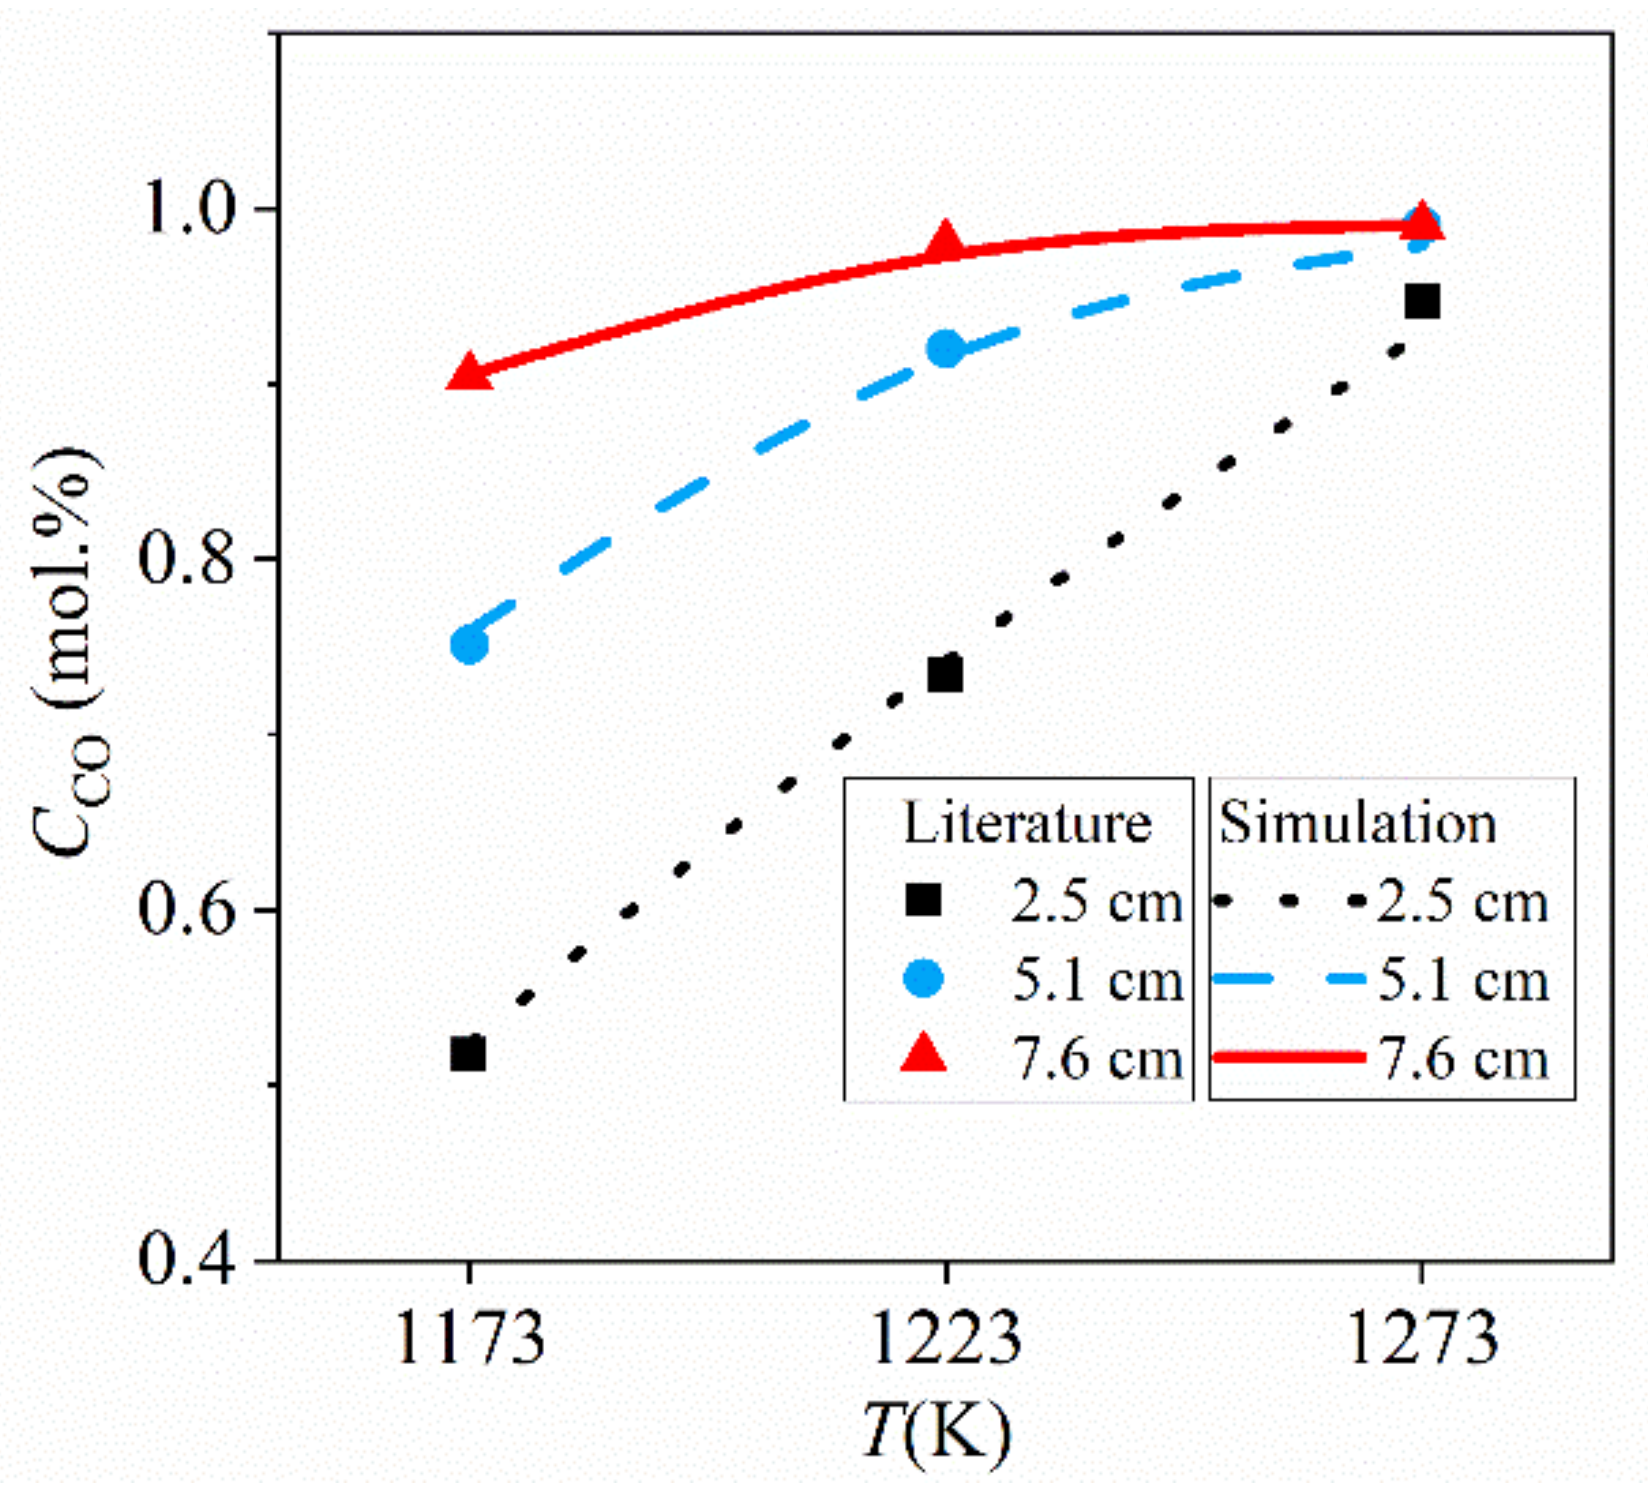
To validate the model of a fluidized bed coupled with Boudouard gasification, a fluidized bed gasifier with different carbon bed height was simulated and compared with the experimental result obtained by Lee et al. [36]. As shown in Figure 2, the gasifiers with three different carbon bed heights (2.5 cm, 5.1 cm and 7.6 cm) operating at 1173 K, 1223 K and 1273 K have been simulated and the CO molar fraction along the height were obtained, which are in good agreement with the experimental tests, verifying the reliability of the model.
When the SOFC and gasifier are combined in one chamber, they need to operate at the same temperature, so the operating temperature is a critical factor for this system. Boudouard gasification accelerates with the increasing temperature. That means a relatively high temperature benefits the gasification while SOFC needs a relatively low temperature to achieve a good durability. In this study, 1173 K is set, at which the Boudouard gasification rate is not too low and SOFC with Ni-YSZ still has a good performance [17,33].

4.2. Fluidized Bed Gasifiers

4.2.1. Effects of CO2 Inlet Velocity

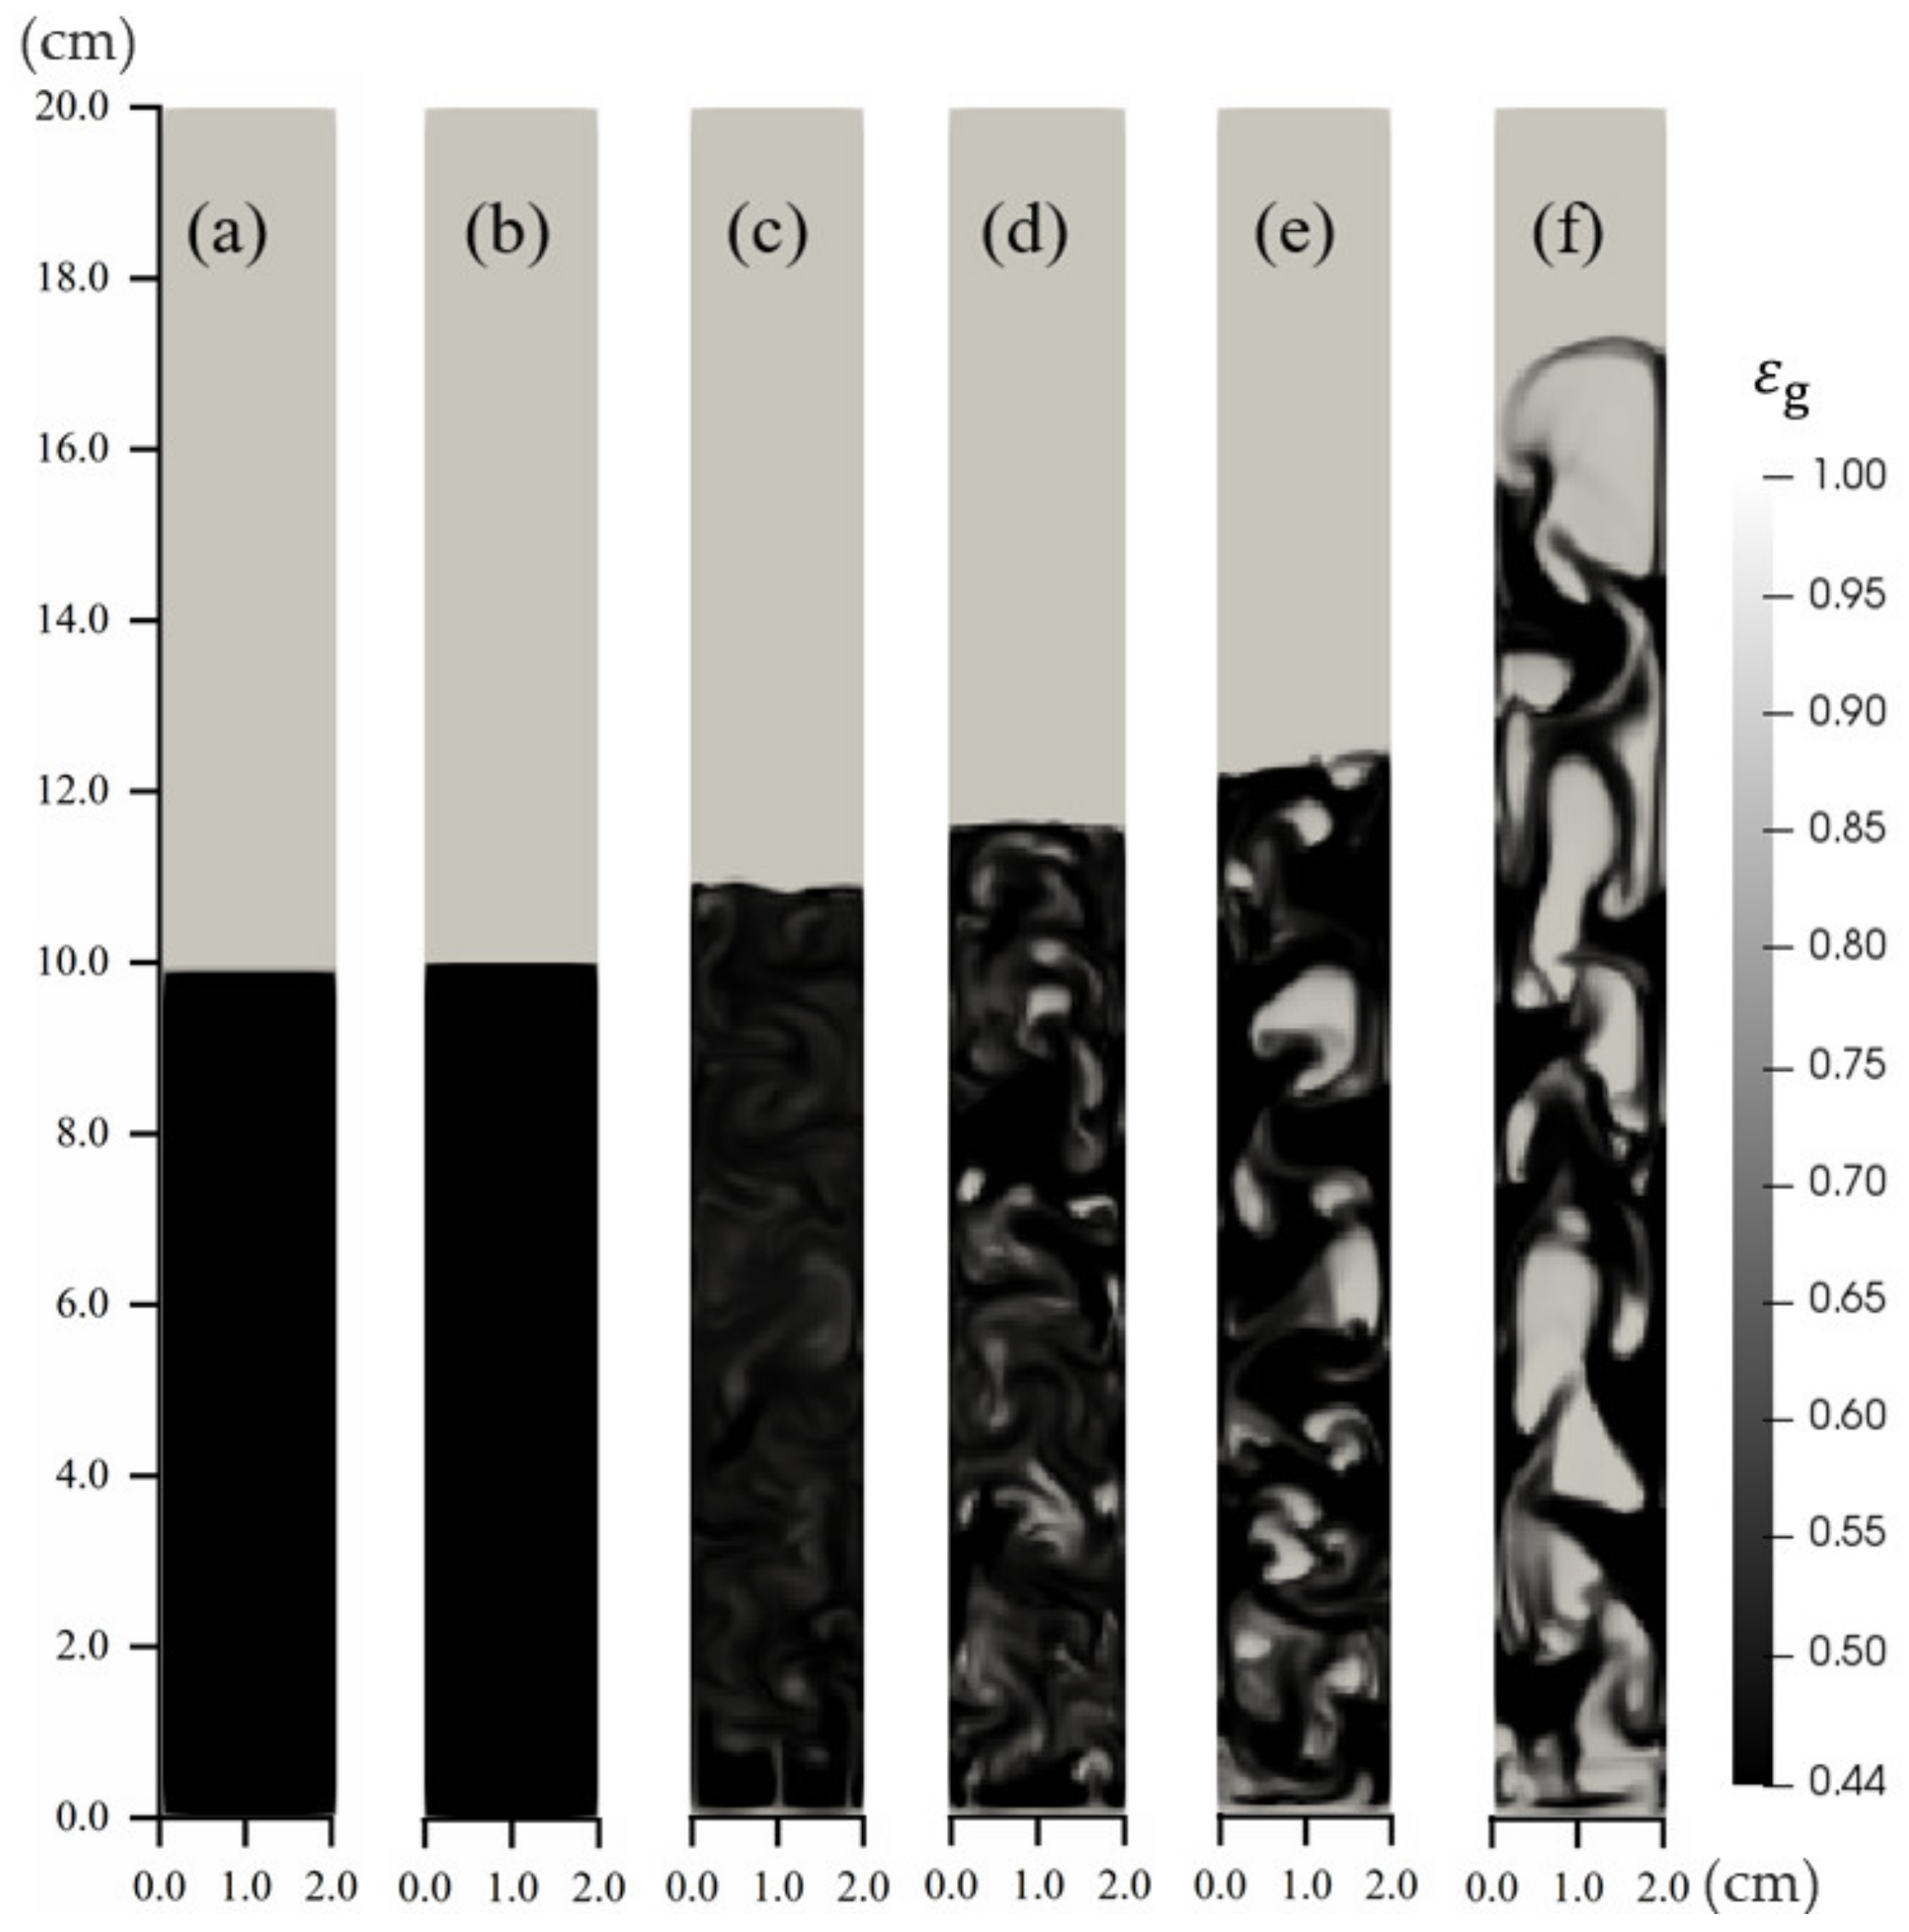
Before simulation of the fluidized bed gasifier, the gas–solid flow without Boudouard gasification was calculated first to explore the effect of CO2 inlet velocity,   v CO 2 , in , on the gas–solid flow. Utilizing the correlation reviewed in the book by J.R. Grace et al. [46], the minimum fluidized velocity and the minimum bubbling velocity are estimated as 0.585 cm/s and 1.407 cm/s, respectively. Six different CO2 inlet velocities ranging from a value less than the minimum fluidized velocity to a value greater than the minimum bubbling velocity were chosen. As shown in Figure 3, the gas–solid flow regimes change with the CO2 inlet velocity ( v CO 2 , in ). At v CO 2 , in = 0.2 and 0.5 cm/s, the carbon particles are stagnant (Figure 3a,b); at v CO 2 , in = 0.9 cm/s, the carbon particles are fully suspended by the gas and the carbon bed sets up to homogeneously fluidize and expand (Figure 3c); as v CO 2 , in increases to 1.5 or 3.0 cm/s, bubbles appear in the carbon bed (Figure 3d,e); as v CO 2 , in raises further, the bubbles in the carbon bed may coalesce into larger bubbles called gas slugs (Figure 3f). The above flow regimes are the fixed bed, delayed bubbling bed, bubbling bed and slugging bed, respectively. In this study, v CO 2 , in is controlled to avoid flowing away of carbon particle from outlet and only the fixed bed, delayed bubbling bed and bubbling bed have been considered.

4.2.2. Effects of Activity of Carbon Fuel and CO2 Inlet Velocity

Activities of different types of carbon fuel vary in a wide range and an abundance of experimental studies are focused on developing activity catalyst to enhance the fuel activity; therefore, it is practically meaningful to explore the effects of carbon activity and CO2 inlet velocity,   v CO 2 , in . According to Section 2.1, the activity of carbon fuel can be enhanced by increasing active site density, raising the temperature, reducing activation energy, and so on. Here, activity is changed by varying the active site density, A s . A s of carbon particles utilized by Lee et al. [36] is determined to be 7.2 × 10⁻⁶ mol/m2 by fitting the experimental data and A s changing from 7.2 × 10⁻⁶ mol/m2 to 3.6 × 10⁻⁴ mol/m2 is considered. The effects of A s on CO molar fraction distribution in fluidized bed gasifiers are shown in Figure 4.
Figure 4a shows the CO molar fraction distribution in a fixed bed gasifier with v CO 2 , in = 0.2 cm/s. It can be seen that for all of the active site densities ( A s ) considered here, CO molar fraction at the outlet is close to the equilibrium molar fraction (97.4 mol.%), and with increasing of A s the distance in the carbon bed to reach CO equilibrium concentration reduces. In the fixed bed, convection is weak, carbon particles are stagnant, the carbon bed can be thought of as porous media, mass transport in the carbon bed are diffusion and convection, and there is ignorable concentration gradient in the transversal the transversal direction.
Figure 4b shows the CO molar fraction distribution in a delayed bubbling bed with CO2 inlet velocity v CO 2 , in = 0.5 cm/s. It is shown that, when A s = 7.2 × 10⁻⁶ mol/m2, CO concentration reduced significantly with the increase of v CO 2 , in and CO molar fraction in the chamber is much lower than its equilibrium value. It is because the gasification rate of carbon is too slow for a delayed bubbling bed and the period for CO2 to pass the carbon bed is not long enough to reach the equilibrium. It should be mentioned that when v CO 2 , in . = 0.5 cm/s, the carbon bed in the channel converts from a fixed bed into a delayed bubbling bed after adding Boudouard gasification and the bed expansion can be observed in Figure 5. In the delayed bubbling bed, the carbon particles are fully suspended by the gas phase, the carbon bed is expanding uniformly, and the porosity of the carbon bed reduces. All of these changes benefit mass transport in the carbon bed. Figure 4c, d is CO molar fraction distribution in bubbling beds with v CO 2 , in = 1.5 and 3.0 cm/s, respectively. It is observed that, at v CO 2 , in = 1.5 cm/s, CO concentration reduces further for A s = 7.2 × 10⁻⁶ mol/m2 and CO concentration at the outlet cannot reach the equilibrium for A s  = 3.6 × 10⁻⁵ mol/m2 either. As v CO 2 , in is as high as 3.0 cm/s, only for  A s = 1.44 × 10⁻⁴ mol/m2, the CO molar fraction at the outlet can be close to the equilibrium. In the bubbling beds, the bubbles form in the carbon bed, the carbon bed is expanding significantly with moving bubbles in it, the mass transport is dramatically increased due to the fluid-like solid particle, which cannot be described by mass transport in porous media anymore. Due to the significant convection and the motion of solid particles along the channel, there is considerable concentration gradient in the transversal direction.
Figure 5a gives the effect of A s and v CO 2 , in on the carbon bed height, HC, and total gasification rate, R tot , in the channel. The carbon bed height, HC, is defined as the lowest height where the time-averaged gauge pressure is zero. HC can describe the conversion of gas–solid flows to some extension. For the fixed bed, HC is equal to initial bed height, while for the delayed bubbling bed and bubbling bed, HC is larger than the initial bed height due to the suspending of solid carbon particles. R tot , is the sum of gasification rate of whole system in unit of mol/s, which should match with the output current to maintain a steady operation. As shown in Figure 5a, HC increases with v CO 2 , in due to the interaction between the particles and gas flow while the influence of A s on HC is complicated. When HC is equal to the initial bed height, which means a fixed bed, there is an ignorable influence of A s on HC, while as the carbon bed begins expanding, HC raises with A s . This phenomenon is caused by the coupling effects between gas–solid flows and gasification, which will increase the volume of gases. As shown in Figure 5b, R tot is affected by active site density A s and CO2 inlet velocity v CO 2 , in . As CO concentration at the outlet is lower than the equilibrium concentration, like v CO 2 , in = 0.5 cm/s and A s = 7.2 × 10⁻⁶ mol/m2, shown in Figure 4b, R tot increases with the increase of A s . and v CO 2 , in . Conversely, as CO concentration at the outlet reaches equilibrium concentration, R tot is linear with v CO 2 and does not increase with increase of A s anymore. Thus, for a given carbon fuel and geometrical structure of anode chamber, there is critical v CO 2 , in , to achieve the largest R tot and a near equilibrium concentration of CO at the outlet. This conclusion is also very useful to design DC-SOFC with a separated fluidized bed gasifier.
In the validation part, the fluidized bed gasifier with A s = 7.2 × 10⁻⁶ mol/m2 have a good agreement with Lee’s experimental test for activated carbon particles [36]. That is to say, for activated carbon tested by Lee et al., critical v CO 2 , in to maximize gasification rate should be lower than 0.5 cm/s to reach an equilibrium CO concentration. However, for other more active carbon fuel, increasing v CO 2 , in is suggested to achieve an enhanced mass transport in the anode chamber and a higher gasification rate.

4.2.3. Effects of Channel Width

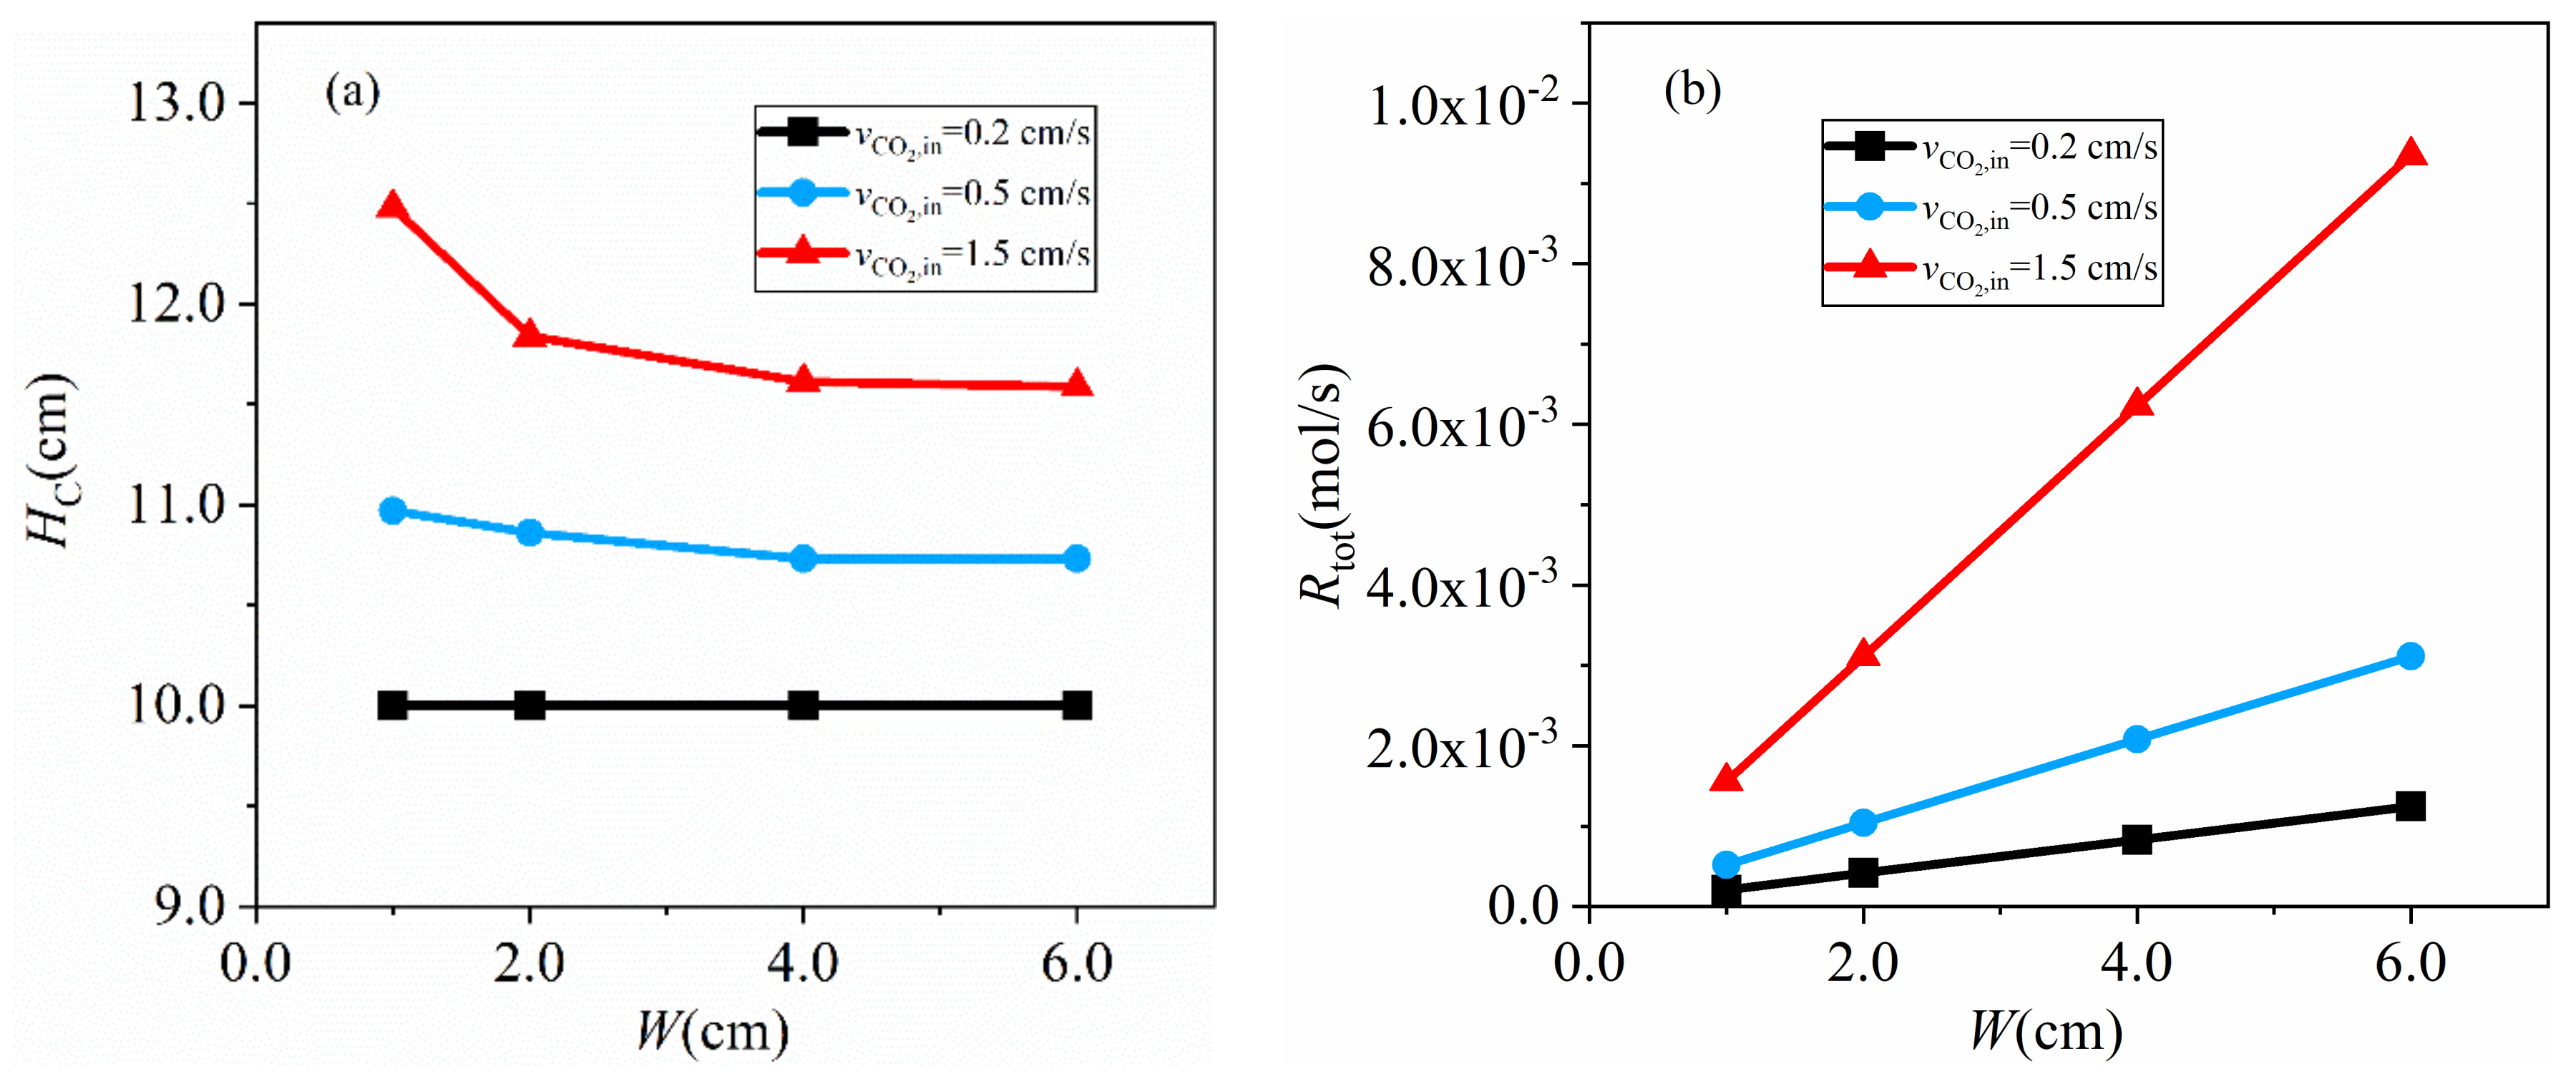
According to Cai’s study [25], to maintain the steady and continuous operation of DC-SOFC, the gasification rate and the current density should match each other; the consumption of CO by SOFC should be equal to the production rate of CO by Boudouard gasification. In order to provide enough CO to SOFC under high current densities, it is critically important to raise the production rate of CO. When the activity of carbon is fixed, widening the channel can raise the production rate of CO conveniently. Figure 6 shows the effects of channel width on the bed height HC, and total gasification rate, R tot . In this section, the active site density, A s , is 7.2 × 10⁻⁵ mol/m2, and the fixed bed with v CO 2 , in = 0.2 cm/s, the delayed bubbling bed with v CO 2 , in = 0.5 cm/s, and the bubbling bed with v CO 2 , in = 1.5 cm/s are considered. The width of channel is set as 1 cm, 2 cm, 4 cm and 6 cm, respectively.
As shown in Figure 6, R tot increases with channel width linearly, while the effects on bed height, HC, varies with the gas–solid flow regime. For the fixed bed with v CO 2 , in = 0.2 cm/s, HC keeps the initial bed height; for the delayed bubbling bed with v CO 2 , in = 0.5 cm/s, HC decreases with increasing channel width slightly, indicating that the expansion of the carbon bed is weakened; for the bubbling bed with v CO 2 , in = 1.5 cm/s, HC reduces significantly when the channel width varies from 1 cm to 2 cm and then reduces slightly with increasing of the channel width. Combined with Figure 4b, it can be concluded that for given A s and v CO 2 , in , widening the channel can increase the total gasification rate, R tot , linearly.

4.3. Fluidized Bed Gasifiers Coupled with SOFC

Fluidized bed gasifiers coupled with SOFC operating under different constant current densities are simulated and the effects of coupling extent between fluidized bed gasifiers and SOFC on system performance are discussed. Two different active site densities, 7.2 × 10⁻⁶ mol/m2 and 7.2 × 10⁻⁵ mol/m2, of carbon particles are considered. Carbon particles with A s  = 7.2 × 10⁻⁶ mol/m2 tested by Lee et al. [36] are referred to as low activity carbon fuel and those particles with A s  = 7.2 × 10⁻⁵ mol/m2 are referred to as high activity carbon fuel. Two SOFCs are placed on both side walls symmetrically with the anodes inside and the current density is set as 1000, 2000, 5000, 8000, 10,000, 15,000 A/m2, respectively. The coupling extent is measured by the overlapping area between the anode surface and the carbon bed, as shown in Figure 1, where d SOFC is the distance between inlet and SOFCs. The channel length HR is 20 cm and the width, W, is 4 cm. The initial carbon bed is 10 cm high and the size of SOFC is set as 10 cm long, which is available for most of SOFC producers [47,48,49]. Four different positions of SOFC including d SOFC = 0.0, 2.5, 5.0 and 7.5 cm are involved to investigate the influence of coupling extent. Three gas–solid flow regimes, namely, fixed bed, delayed bubbling bed and bubbling bed are explored.

4.3.1. Low Activity Carbon fuel with A s = 7.2 × 10⁻⁶ mol/m2

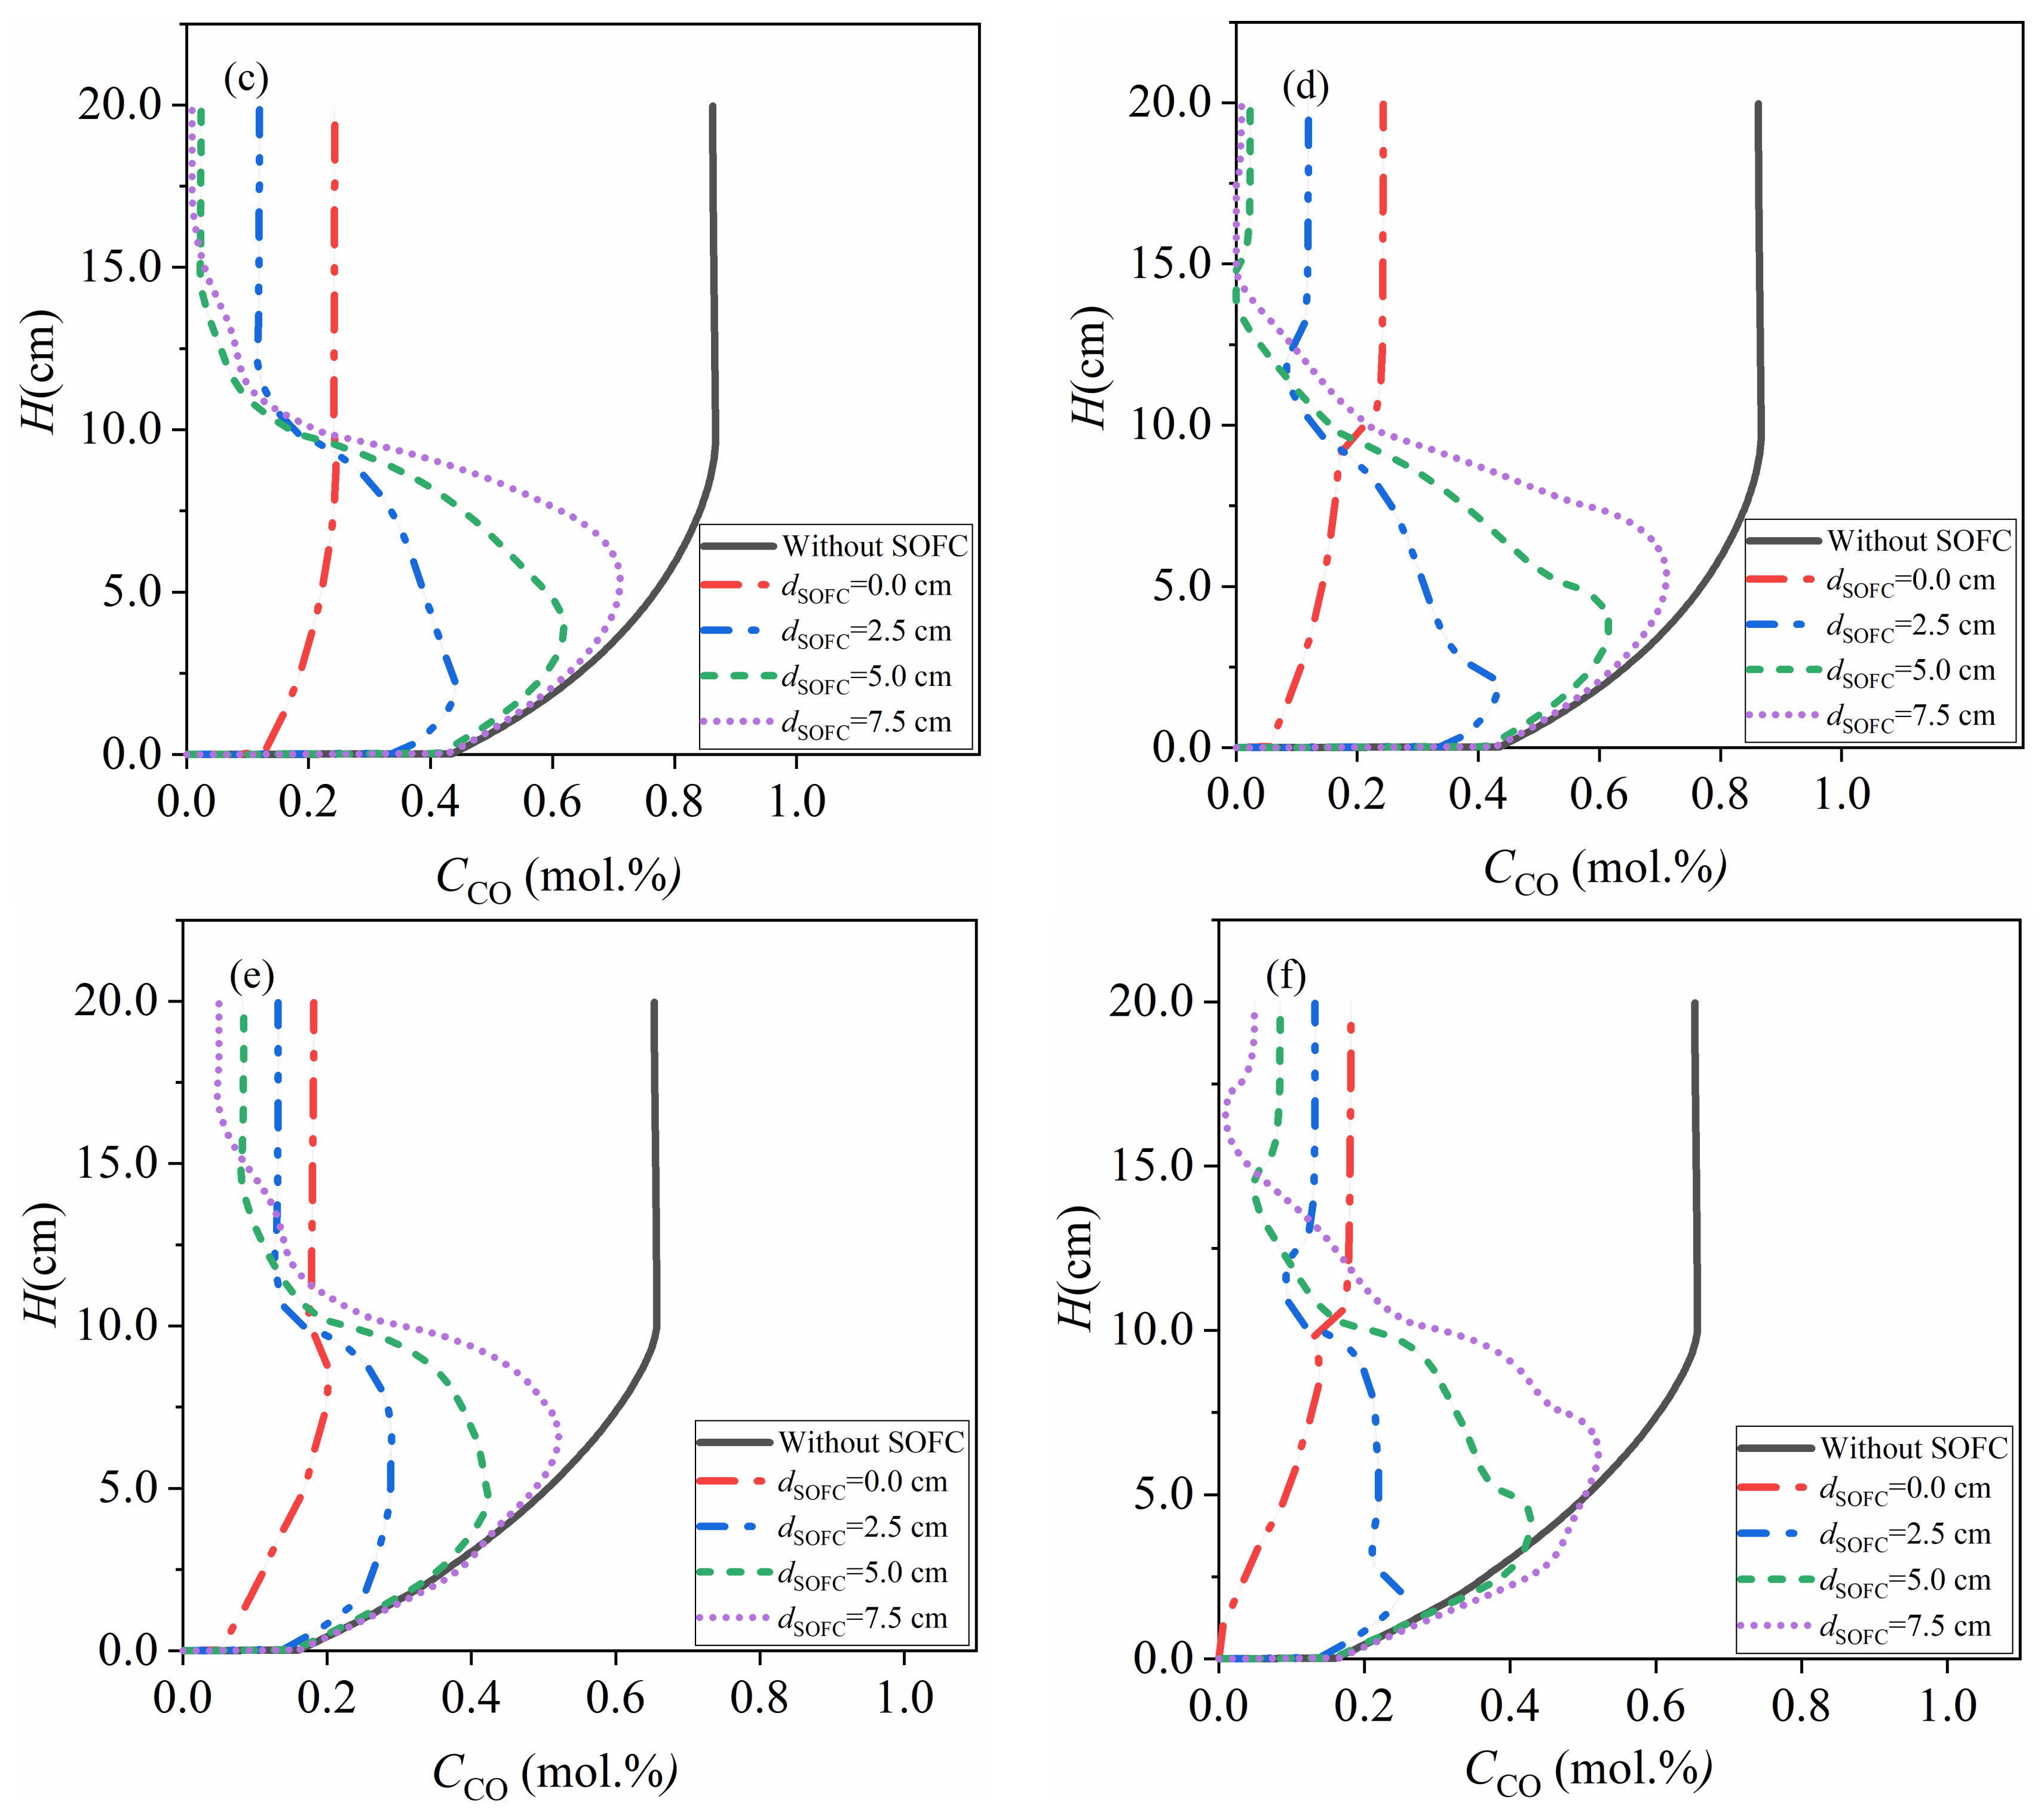
Fluidized bed gasifier coupled with SOFCs utilizing low activity carbon fuel is simulated and two inlet CO2 velocities, v CO 2 , in = 0.2 cm/s and 0.5 cm/s, are considered. The CO molar fraction along the channel for different conditions is shown in Figure 7. Figure 7a,c,e are the average CO molar fraction and Figure 7b,d,f are the CO molar fraction near the side walls where SOFCs are placed. It can be seen from Figure 7 that CO molar fraction at the outlet reduces as SOFCs are moved upwards. With the moving up of the SOFCs, the coupling extent reduces and more and more of the anode surface operates beyond the carbon bed, where no gasification happens to produce CO and only the electrochemical oxidation of CO occurs. This indicates that larger d SOFC results in lower CO concentration in exhaust gas and more of carbon is oxidized into CO2, instead of CO, accounting for a higher fuel efficiency. As the current density increases from 1000 to 2000 A/m2 (Figure 7c,d), CO concentration near the outlet is close to zero for d SOFC = 5.0, 7.5 cm, which means these systems cannot support 2000 A/m2. For d SOFC = 0.0, 2.5 cm, the CO concentration is much higher than zero, indicating that the system can support 2000 A/m2. This result demonstrates that the coupling extent can change the limiting current density in the anode chamber and a higher coupling extent leads to a higher limiting current density.
When the SOFC and gasifier are operated separately, an equilibrium CO molar fraction benefits the cell performance because a higher CO concentration accounts for a higher cell performance according to Equation (20). This is not the case when the SOFC and fluidized bed are coupled together, as shown in Figure 7b–f. When v CO 2 , in increases from 0.2 to 0.5 cm/s, CO molar fraction reduces and equilibrium concentration cannot be reached as shown in Figure 4b, but increasing v CO 2 , in benefits the cell performance at 2000 A/m2 (Figure 7b–f). When v CO 2 , in raises from 0.2 to 0.5 cm/s, all of the systems can operate steadily under 2000 A/m2. The positive impacts of coupling extent and v CO 2 , in can be explained according to Figure 8, where the effects of coupling extent and v CO 2 , in are shown.
As shown in Figure 8a, there is no change in HC at v CO 2 , in = 0.2 cm/s. This is because the flows are in the fixed bed regime. However, at v CO 2 , in = 0.5 cm/s, it is noticeable that HC decreases slightly especially when d SOFC attains lower values. This is not surprising since the flows at such condition are in the delayed bubbling bed regime. The radial mixing of the bed is not sufficiently strong and the increased gases due to gasification form low solid volume fraction structures near the bed boundaries. These structures then find pathways to go upwards along the bed boundaries. Figure 8b shows that the total gasification rate is promoted with the increase of the coupling extent. In summary, for activated carbon particle with A s  = 7.2 × 10⁻⁶ mol/m2 utilized by Lee et al. [36], the coupling extent and v CO 2 , in are two critical parameters to improve the cell performance. Although increasing inlet velocity reduces CO molar fraction in anode chamber, the total gasification rate goes up and thus the maximum current density is enhanced.

4.3.2. High Activity Carbon Fuel with A s = 7.2 × 10⁻⁵ mol/m2

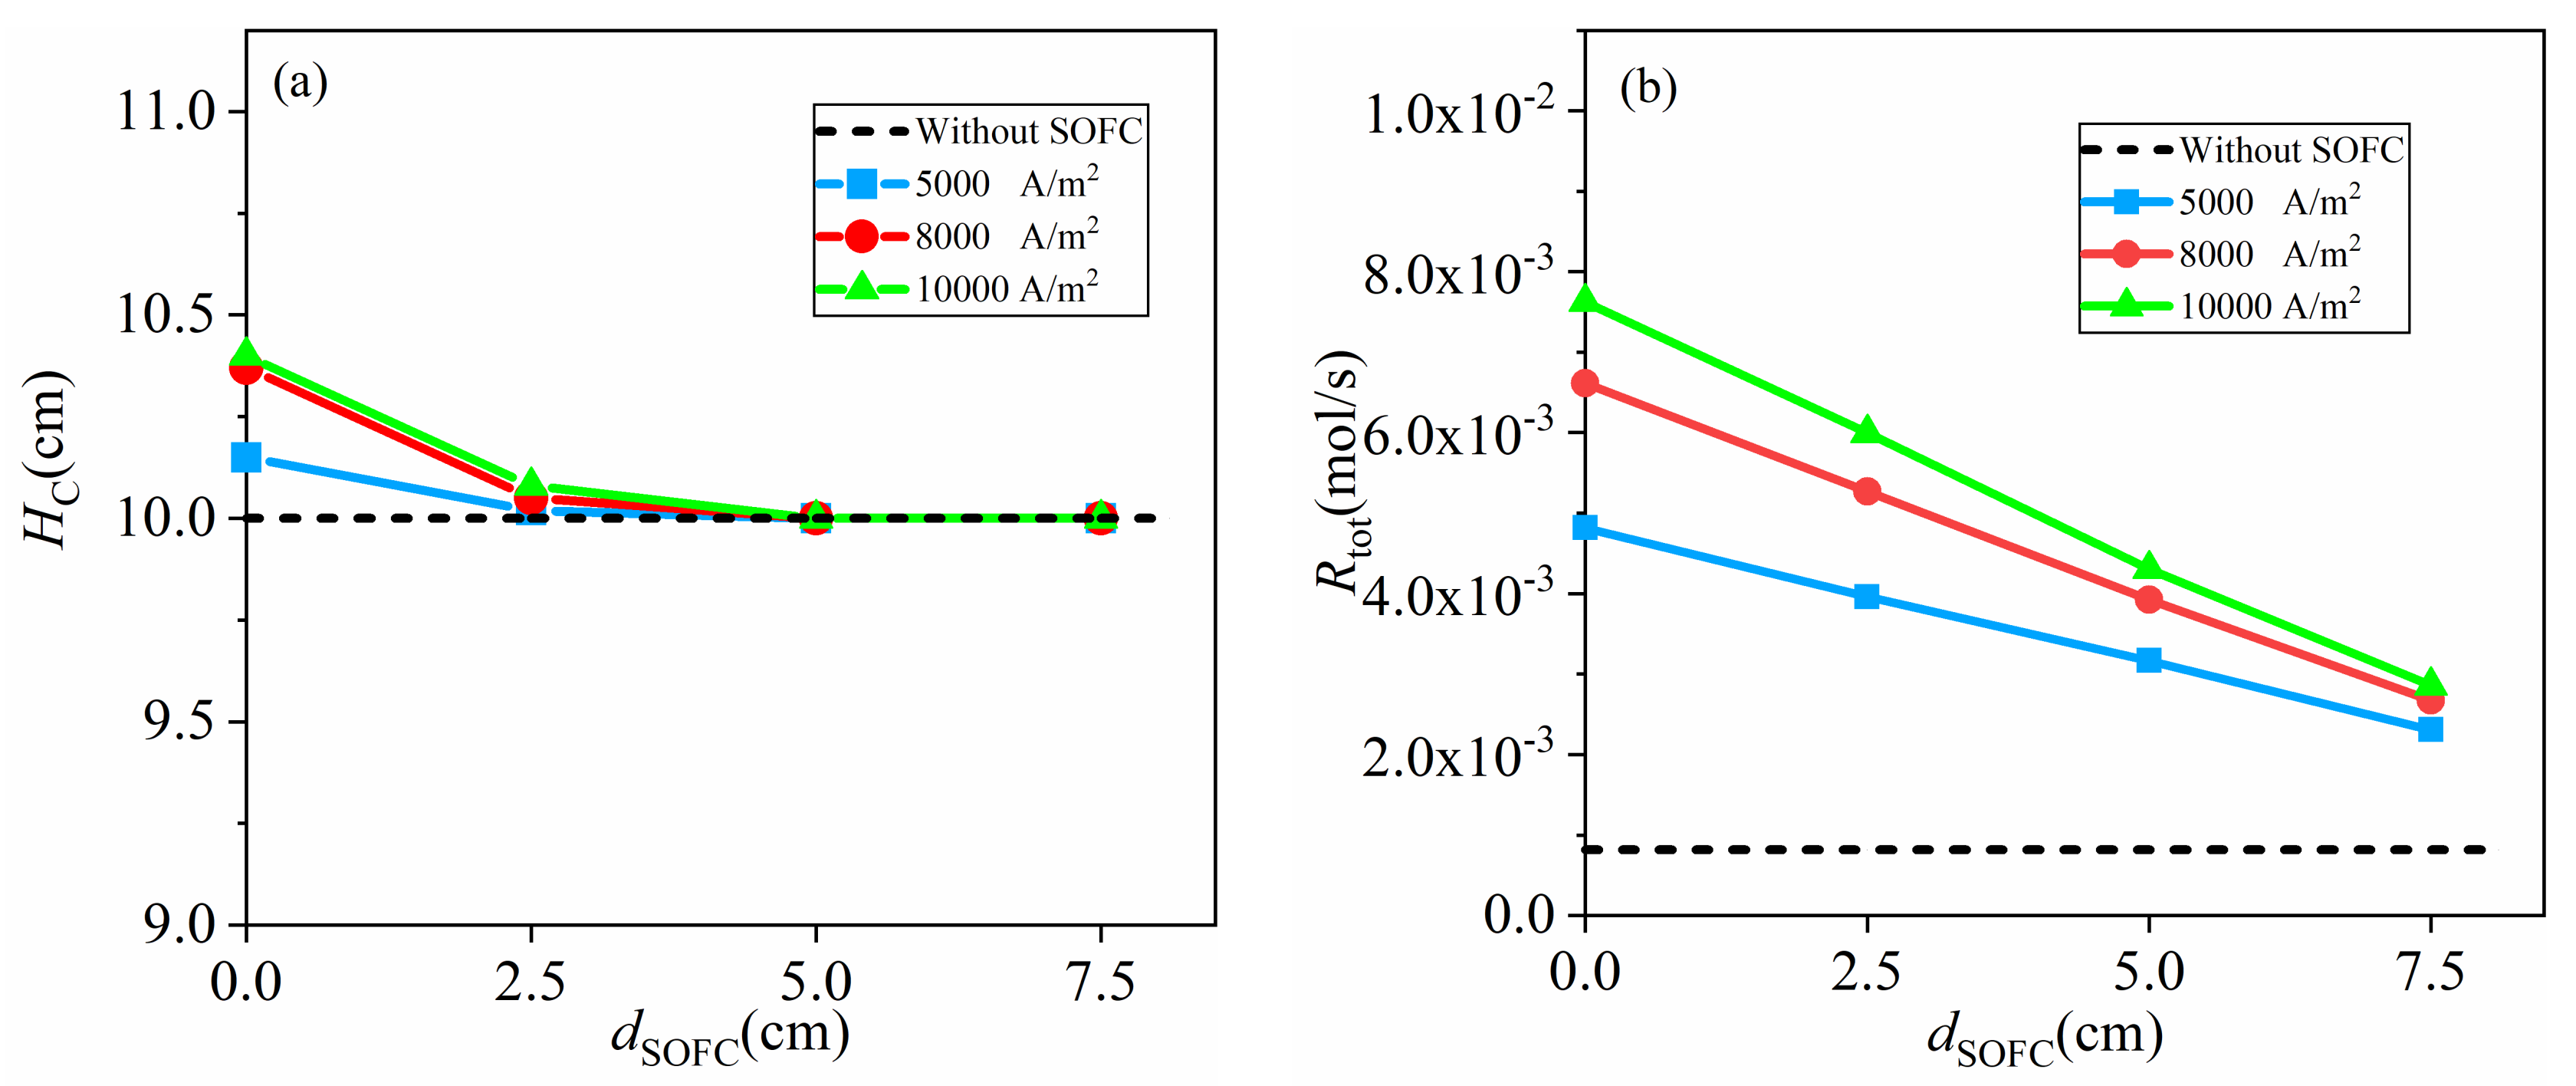
Fluidized bed gasifiers coupled with SOFCs fed with high activity carbon fuel have been investigated and three different inlet CO2 velocities, 0.2 cm/s (fixed bed), 0.5 cm/s (delayed bubbling bed) and 1.5 cm/s (bubbling bed), have been considered. The CO molar fraction along the channel under 5000, 8000, 10,000 A/m2 is shown in Figure 9.
Similar to that observed in Figure 7 the CO molar fractions in exhaust gas reduce with the increasing of d SOFC and the coupling extent has positive effects on cell performance. One of the important differences is that the concentration gradient increases in transversal direction, which can be observed by comparing the averaged CO molar fraction in Figure 9a,c,d with CO molar fraction near the side walls in Figure 9b,e,f. Although the averaged CO molar fraction at a given height is larger than zero, the CO molar fraction near the side walls is close or equal to zero for several cases. The current density of 5000 A/m2 cannot be supported at d SOFC = 7.5 cm and 10,000 A/m2 can only be maintained at d SOFC = 0.0 cm. This illustrates that the CO concentration gradient cannot be ignored when the current density is 5000 A/m2 or higher, and the mass transport is a considerable factor for system performance.
The influence of coupling extent and inlet velocity on gas–solid flows and total gasification rate can be observed in Figure 10. The bed height, HC, keeps the initial height except at d SOFC = 0.0 cm under 10,000 A/m2. The carbon bed expands slightly at d SOFC = 0.0 cm under 10,000 A/m2. The total gasification rate, R tot , increases with increasing current density and coupling extent, as shown in Figure 10b. This is a critical difference between DC-SOFCs and fuel cells utilizing gaseous fuel. As gaseous fuel is utilized, raising the gaseous fuel flux is the only way to support an increasing current density, while as solid carbon is fed, the in situ gasification of carbon accelerates with the increasing current density, which can provide more CO.
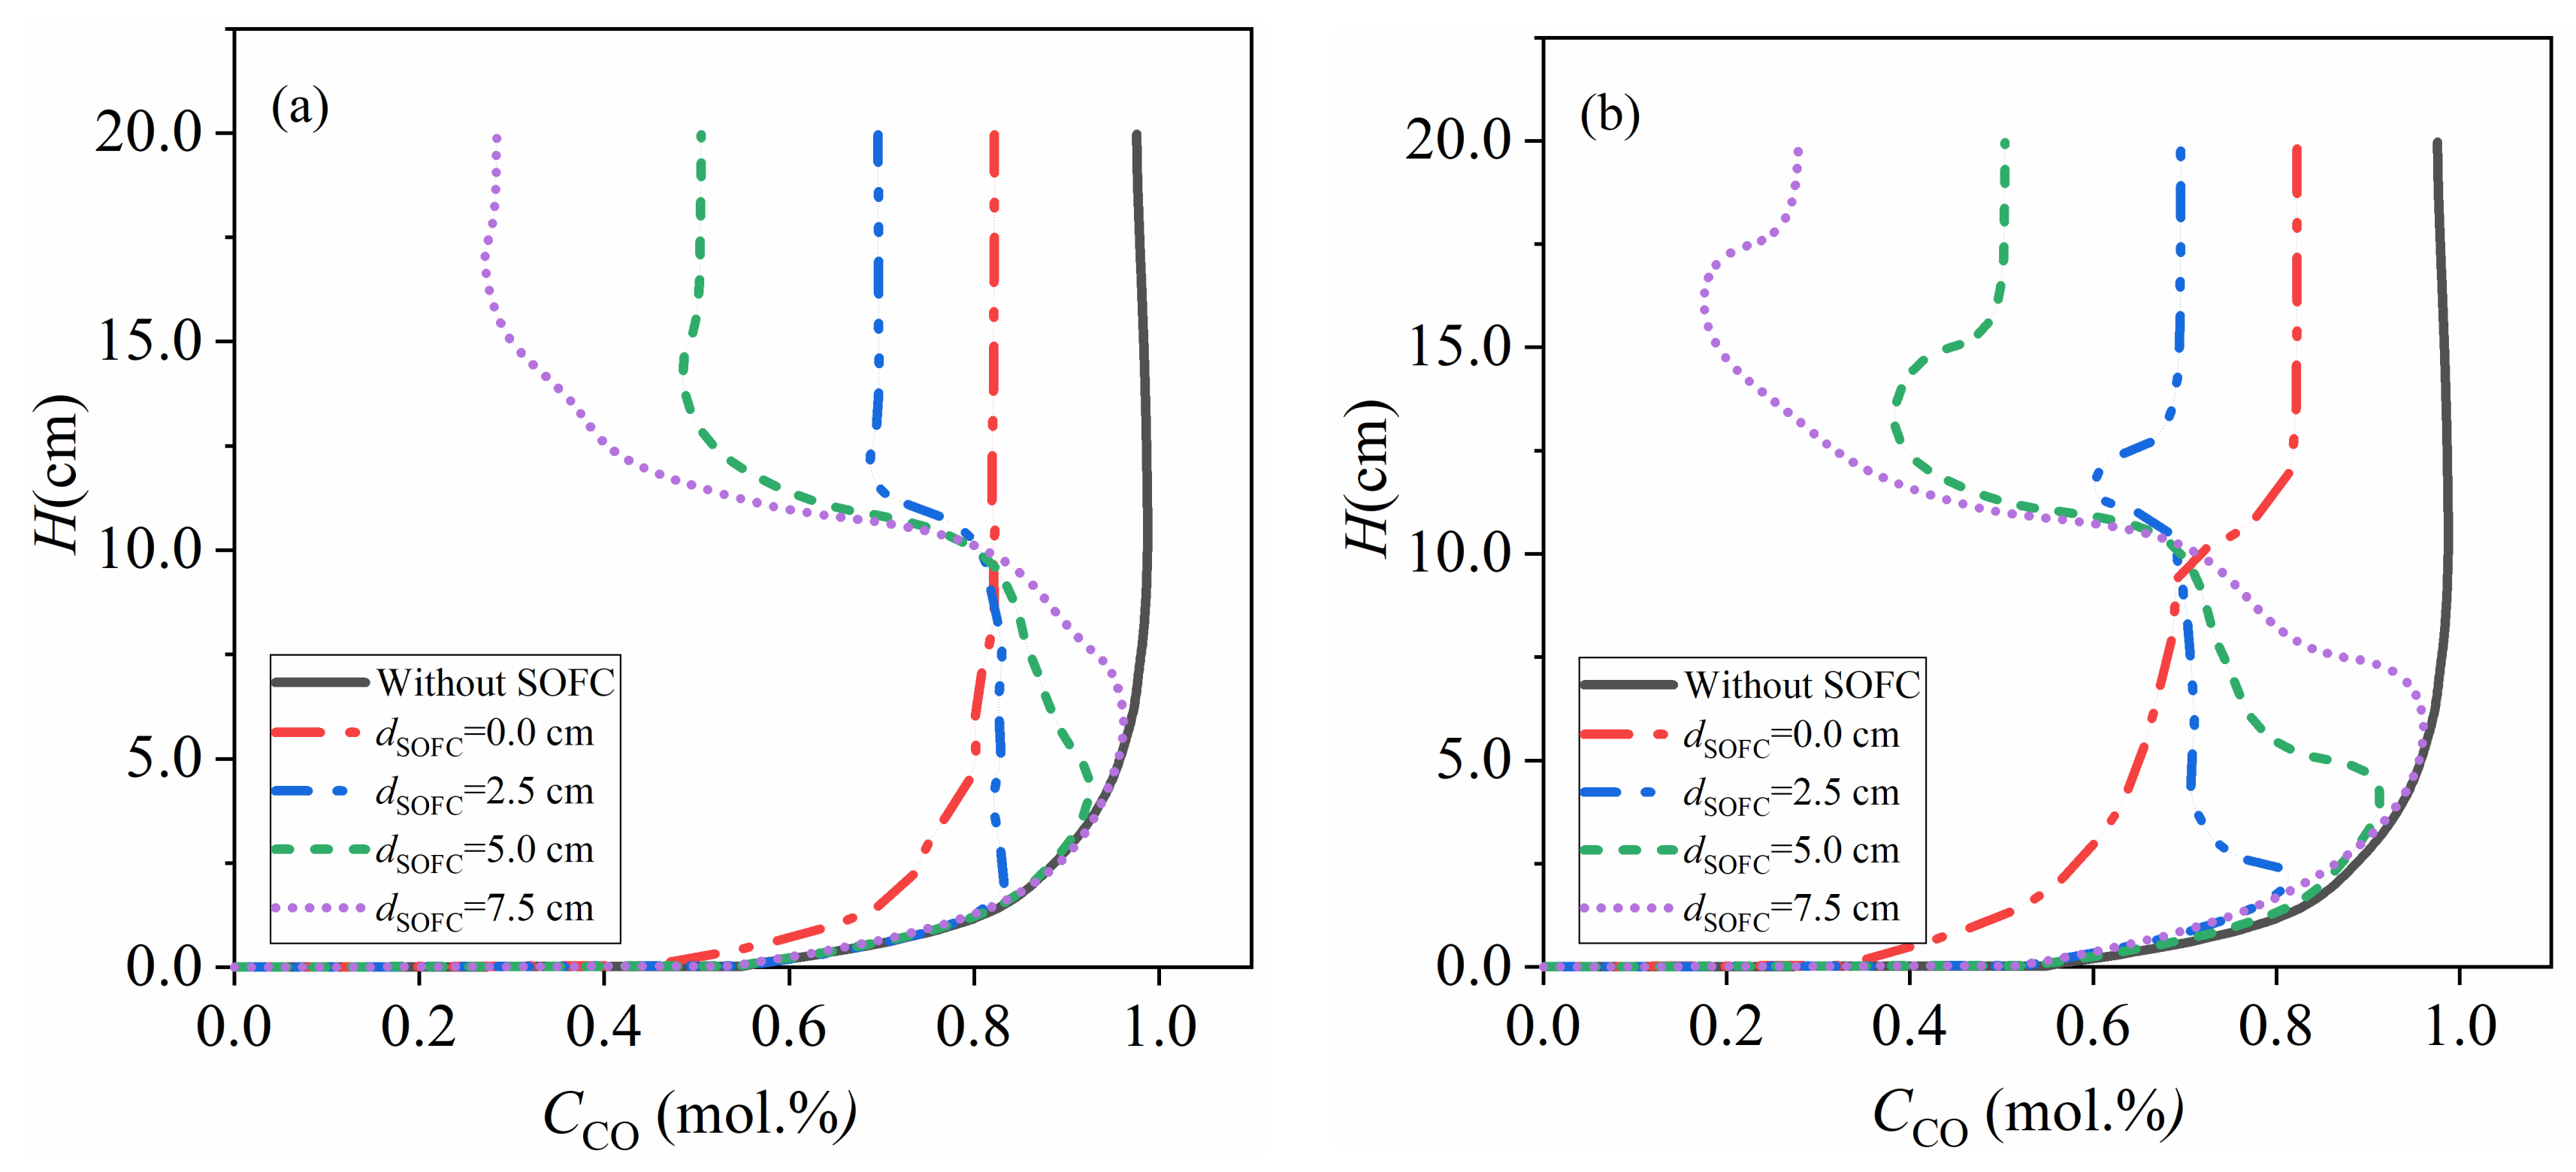
When v CO 2 , in increases to 0.5 cm/s, the gas–solid flows are delayed bubbling beds, in which the carbon particles are suspending but no observable bubbles forms in the carbon bed. The increasing porosity and enhanced convection in the delayed bubbling bed benefits mass transport and further promotes the gasification reaction of carbon. CO molar fraction along the channel for delayed bubbling bed gasifiers coupled with SOFC is illustrated in Figure 11. As shown in Figure 11, 5000 A/m2 can be maintained by all systems due to the enhanced mass transport and 10,000 A/m2 can be operated at d SOFC = 0.0 and 2.5 cm indicating improvement of system performance.
An ideal CO concentration profile appears in Figure 11a,b at d SOFC = 2.5 cm under 5000 A/m2. As shown in Figure 11b, the CO concentration on the anode surface keeps a relatively high CO molar fraction for most of the anode surface with no observable concentration reduction along the channel. In this domain, a balance between the electrochemical oxidation of CO and gasification of carbon is reached. On the anode surface above carbon bed where there are no carbon particles, only electrochemical oxidation occurs and CO is consumed rapidly, reducing CO concentration in exhaust gas and raising fuel efficiency. To achieve a lower CO concentration at the outlet of the channel and increase fuel utilization further, the length of SOFC can be elongated properly. This is another critical benefit of DC-SOFC. Geometrical optimization of DC-SOFC can improve the cell performance further, but this is beyond the scope of this study.
The impacts of the coupling extent and current density on carbon bed height and total gasification rate can be seen in Figure 12. Both the HC and R tot increase with the increase of coupling extent gradually and the effects of current density weaken with the increase of d SOFC . There is only a slight difference of carbon bed height under varying current densities while the total gasification rate increases significantly with increasing current density. It can be found that the total gasification rate increases as high as six times after combining with SOFCs, which can explain the improvement of cell performance shown in Figure 11. A significant improvement of system performance is obtained, and the benefits of coupling between fluidized bed gasifiers and SOFCs are observed again.
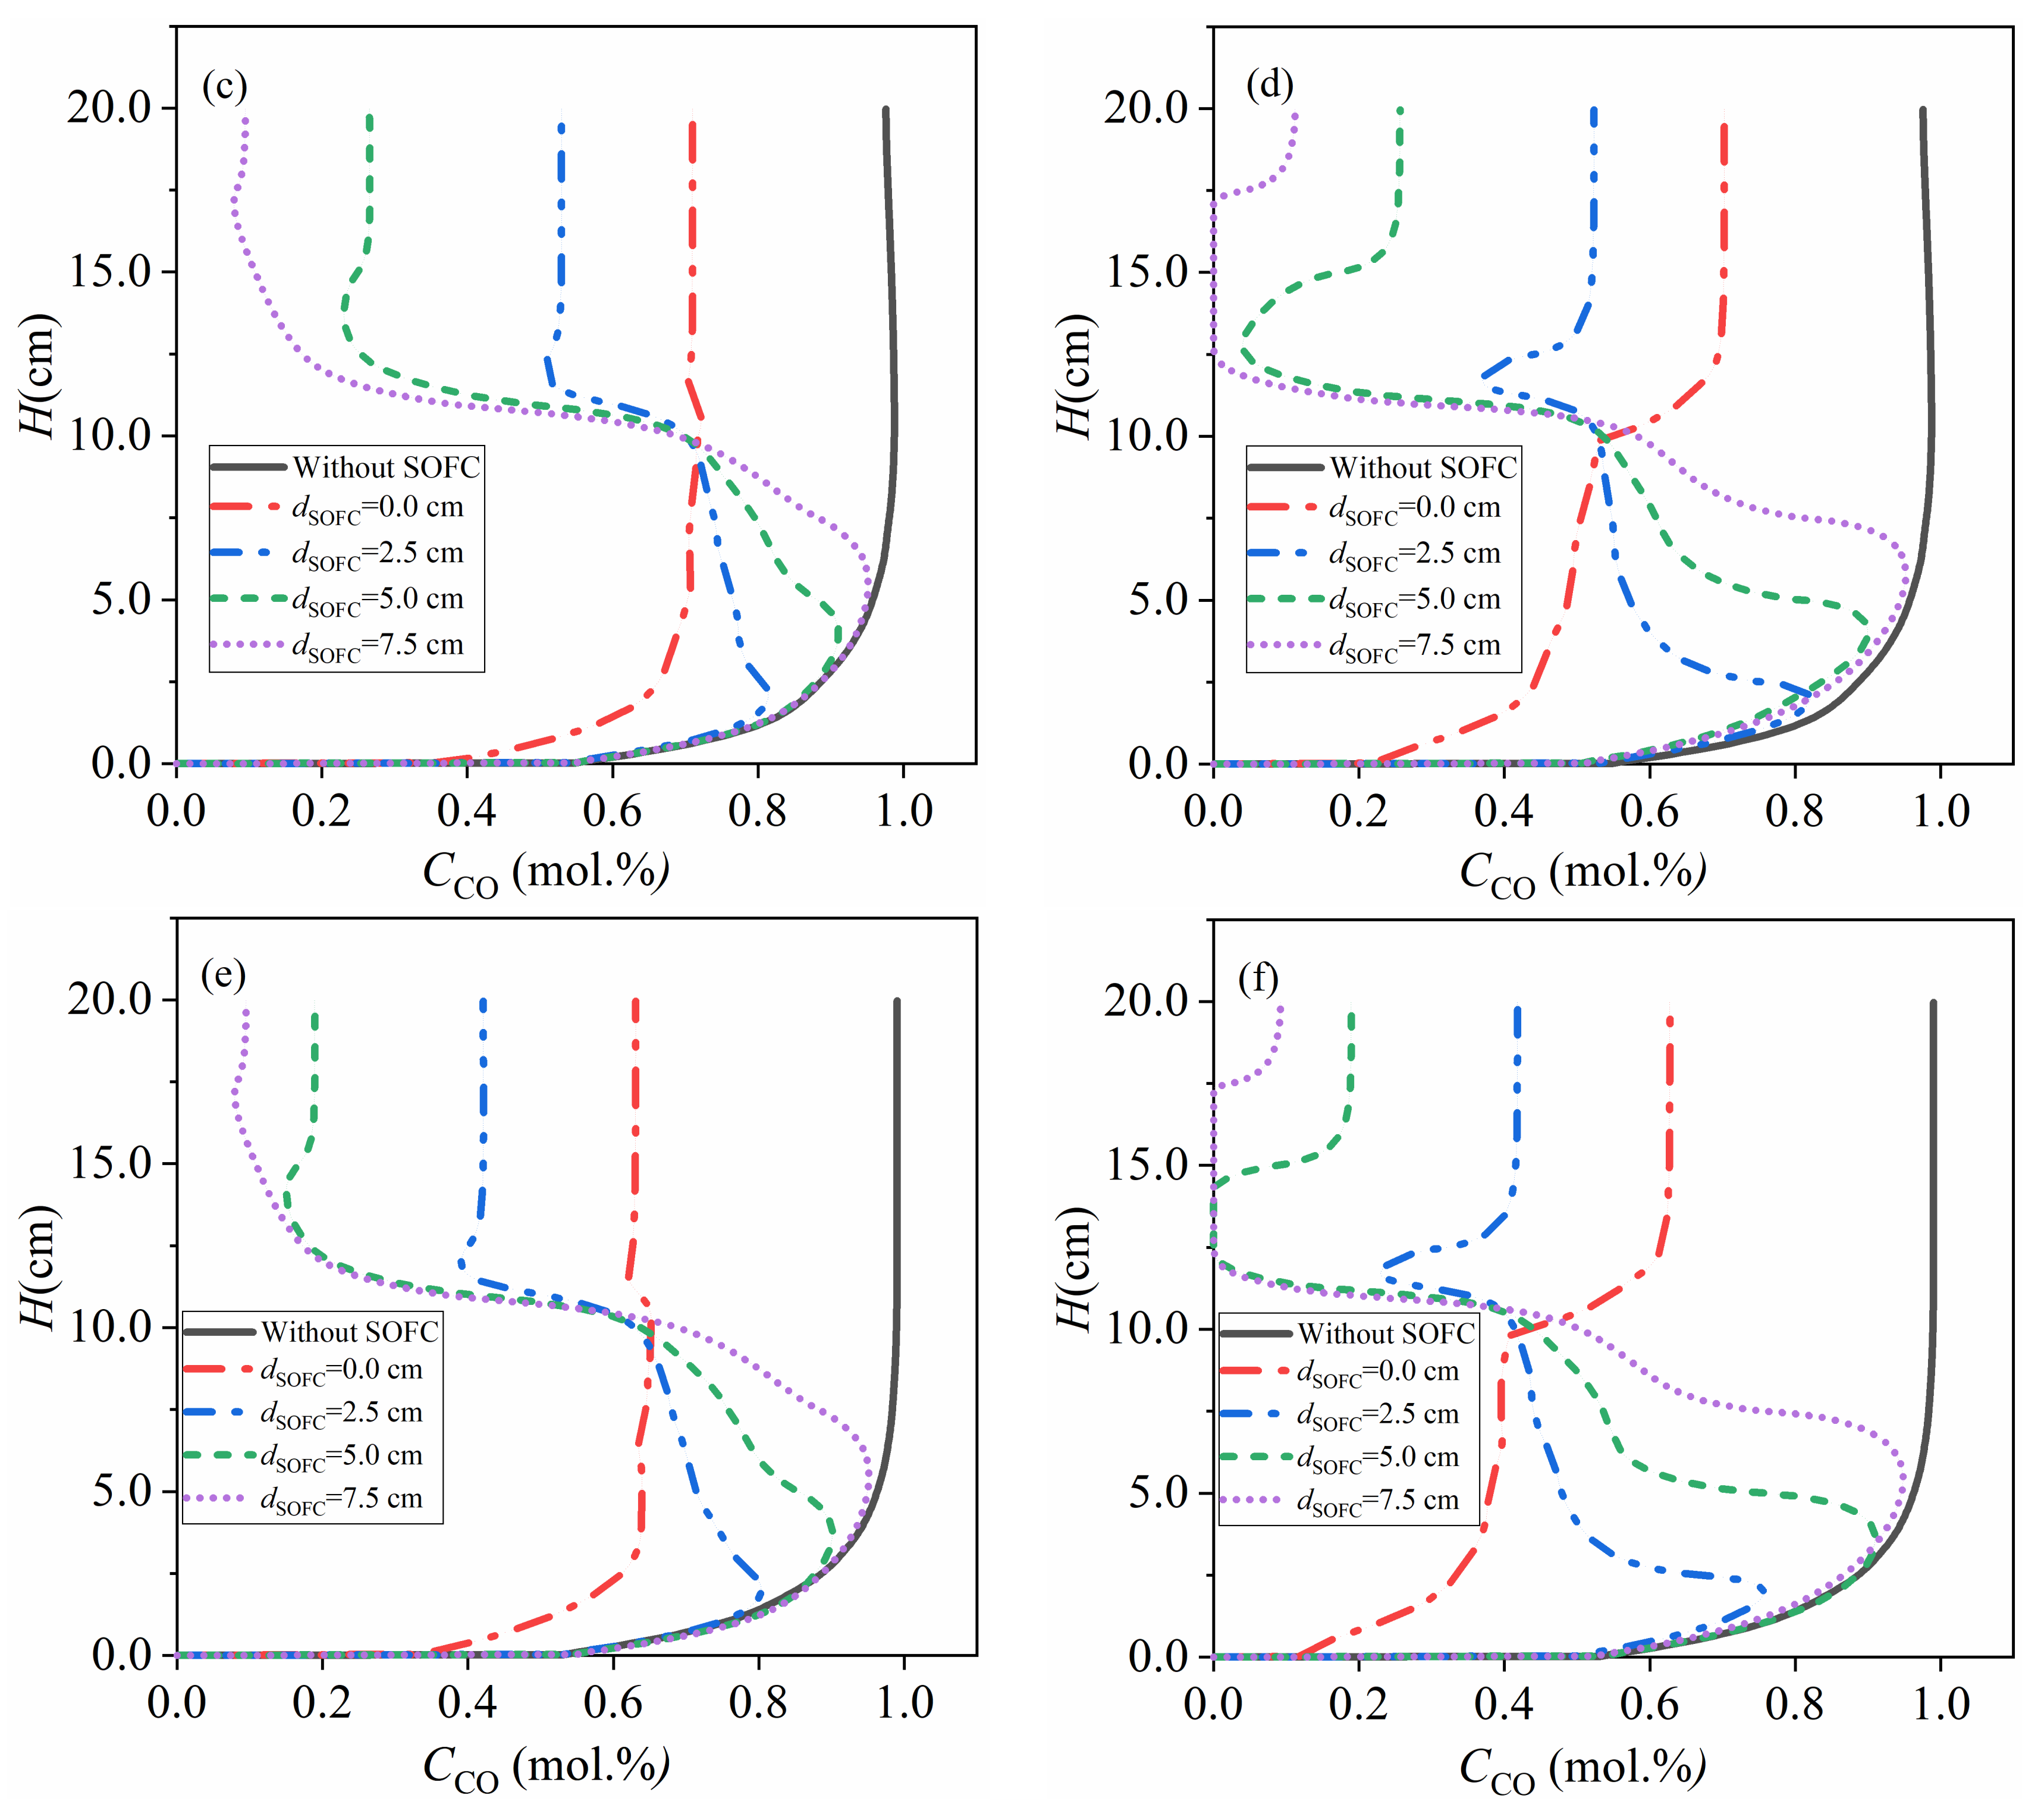
More interesting phenomena appear when the inlet CO2 velocity, v CO 2 , in , increases to 1.5 cm/s. At such a condition, many bubbles form in the carbon bed. First, carbon particles move in axial and radial directions in the bubbling beds, causing both axial and radial solids mixing and gas mixing. The gas mixing and solid mixing are related and affected by each other. For example, back-mixing caused by the downward motion of carbon particles and horizontal gas mixing resulted from lateral solids mixing are two important mass transport mechanisms in bubbling beds. Particularly, the horizontal gas mixing is a feasible way to enhance mass transport in the radial direction. This is the second new phenomenon in the bubbling bed gasifier. Figure 13 gives CO molar fractions in bubbling bed gasifiers with v CO 2 , in = 1.5 cm/s under 5000, 10,000, 15,000 A/m2. Due to the enhanced horizontal mass transport, the radial concentration gradient weakens for all the cases and four systems with different coupling extents can support a current density as high as 10,000 A/m2. Only the system with d SOFC = 7.5 cm cannot operate under 15,000 A/m2 continuously. The improvement of cell performance caused by enhanced horizontal mass transport is the third new phenomenon.
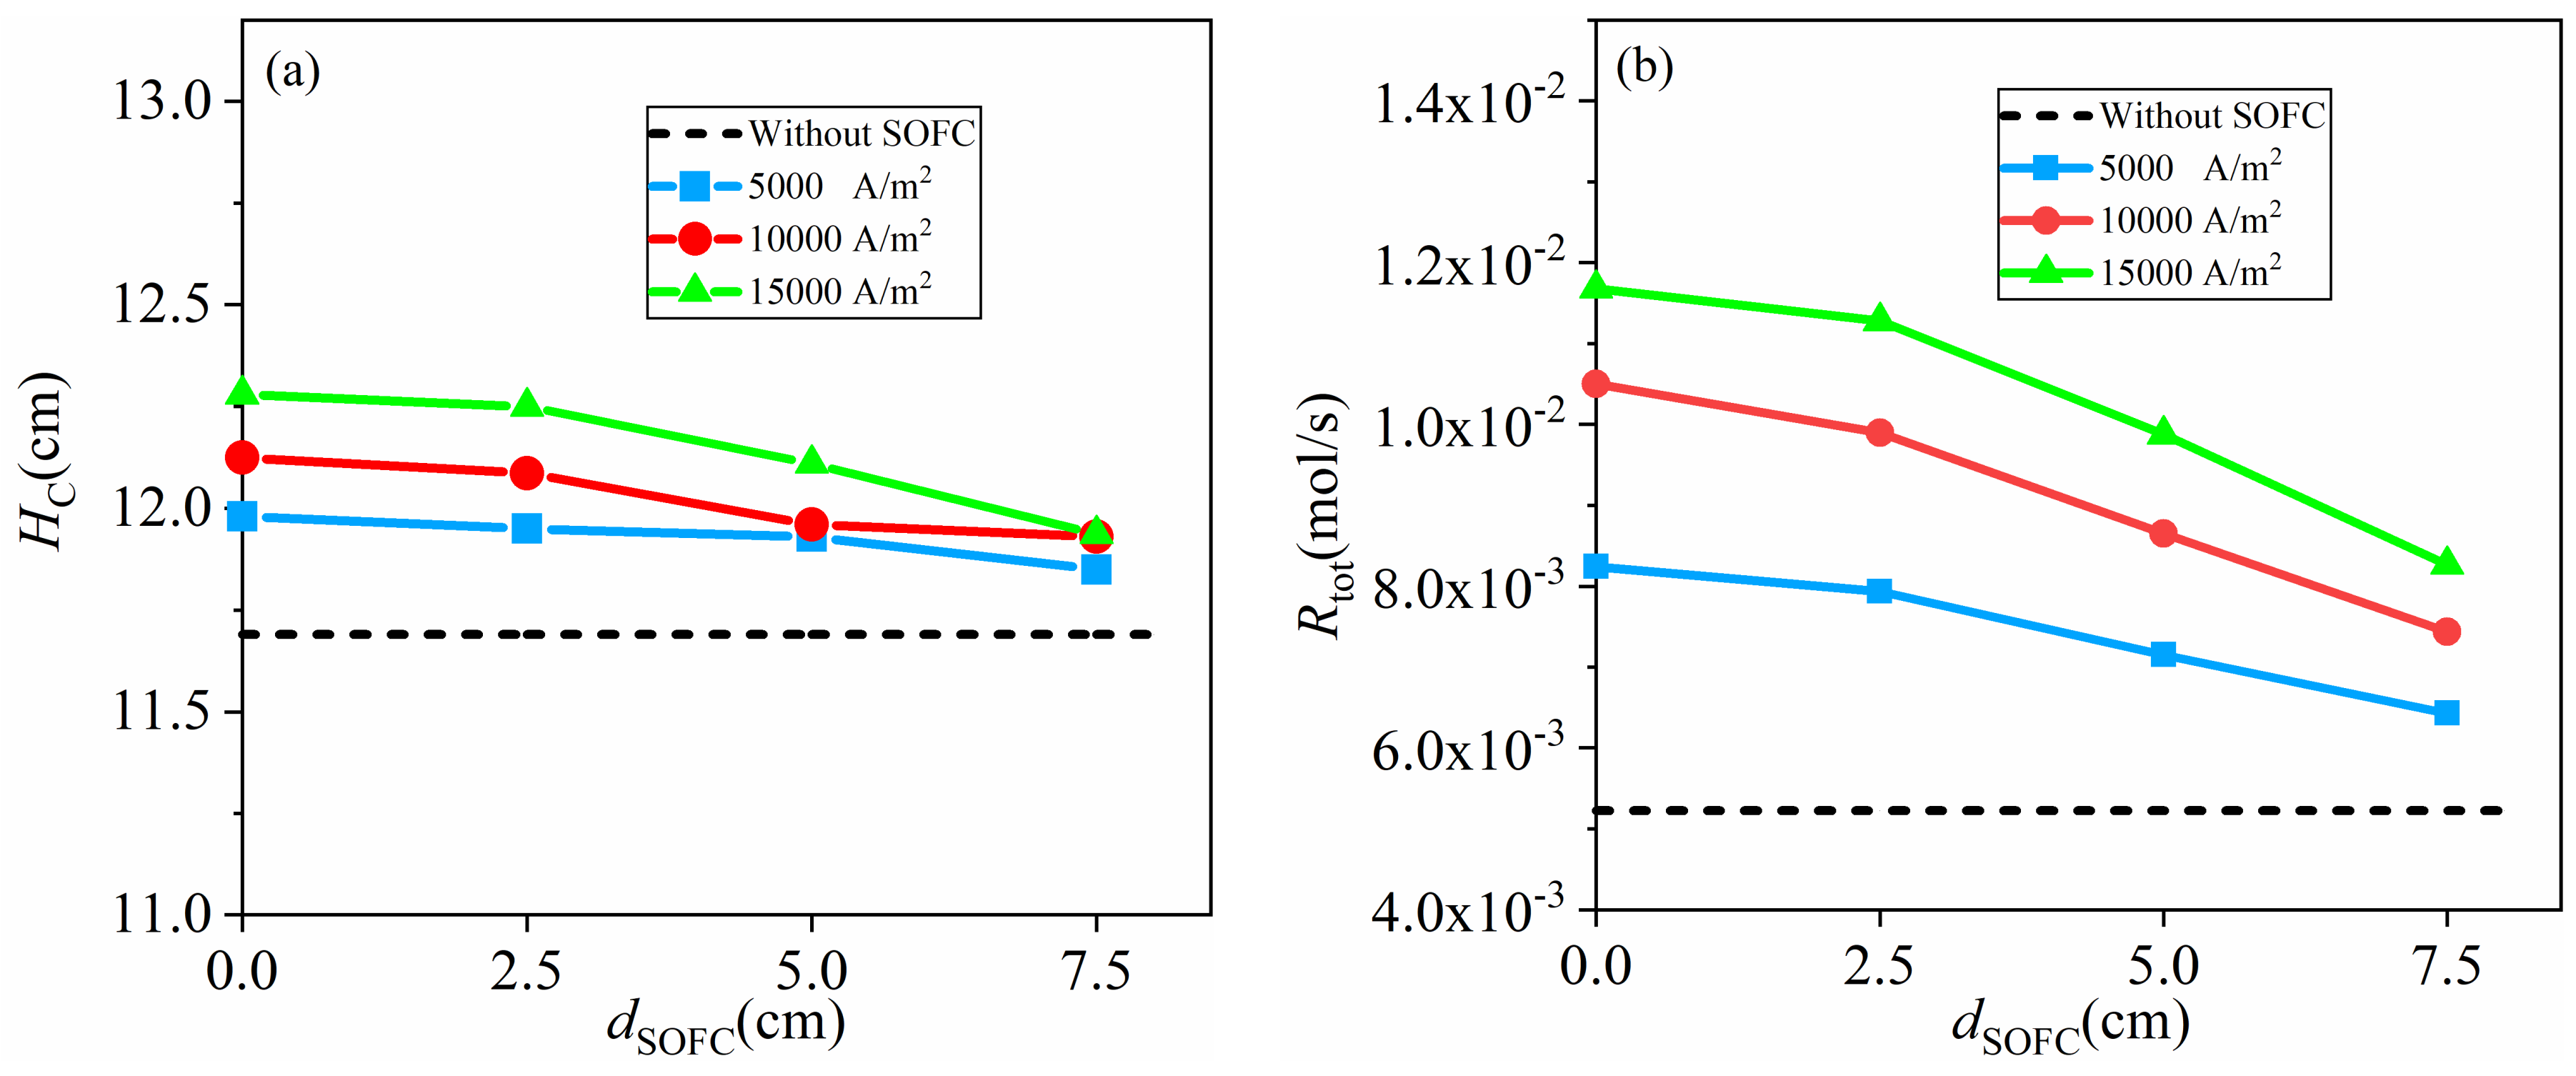
The carbon bed height, HC, and total gasification rate, R tot , of the bubbling bed gasifier coupled with SOFCs are shown in Figure 14. The effects of the current density on HC are much more significant than those in the fixed and delayed bubbling bed and the expansion of the bed becomes a considerable factor to optimize the system performance at d SOFC = 0 and 2.5 cm, wherein the CO molar fraction of exhaust gas is close to higher than that in the carbon bed where SOFCs are placed. This is because the carbon bed is higher than the upper boundaries of SOFCs and only gasification of carbon occurs in this domain. The highest total gasification rate is 1.17 × 10⁻² mol/s in all the cases simulated in this study, which is about 28 times higher than that of fixed bed gasifiers with the same active site density (7.2 × 10⁻⁵ mol/m2) (4.09 × 10⁻⁴ mol/s shown in Figure 5).
This dramatic promotion of gasification rate is ascribed to the improved mass transport in gas–solid flows. Therefore, the coupling between gasifiers and SOFCs is a feasible way to improve the cell performance of DC-SOFC.

5. Conclusions

The numerical simulation of fluidized bed gasifiers coupled with DC-SOFC have been conducted based on TFM. Three flow regimes including fixed bed, delayed bubbling bed and bubbling bed were involved. A five-step Boudouard gasification model was adopted and the anode reactions of DC-SOFC were treated as the coupling processes between Boudouard gasification of solid carbon particles and electrochemical oxidation of CO in the anode. A model of the fluidized bed gasifiers was tested by comparing with the experimental results in the literature. The effects of inlet velocity of the fluidizing agent CO2, carbon activity and channel width on the performance of fluidized bed gasifiers have been explored. The overlapping area between the initial carbon bed and anode surface of SOFC was utilized to explore the effect of the coupling extent on the performance of fluidized bed gasifiers coupled with SOFC. Fixed current densities varying from 1000 to 15,000 A/m2 were simulated to test the effect of the coupling extent, inlet velocity of CO2 on total gasification rate and the maximum current density the system can maintain. The main conclusions include:
(1)
results calculated based on the fluidized bed gasifiers model agree well with the experimental tests, validating its reliability;
(2)
the total gasification rate rises with the increase of inlet velocity, carbon activity and channel width, while too high an inlet velocity reduces CO concentration in the channel;
(3)
in the range this study involved, a higher coupling extent and inlet velocity of CO2 result in a larger total gasification rate and maximum current density, because of enhanced mass transport by expansion of the carbon bed, back-mixing, solid mixing and gas mixing. The gasification rate rises as high as 28 times that of the fixed bed gasifiers with the same activity of carbon and the maximum current density increases from <5000 A/m2 to >15,000 A/m2 due to the coupling between fluidized bed gasifiers and SOFC.
In summary, coupling between fluidized bed gasifiers and DC-SOFC is a feasible way to promote the anode performance of DC-SOFCs, and to our best knowledge, it is the first simulation to couple fluidized gas–solid flows with SOFC. Future works will focus on exploring the effect of particle size and temperature distribution in the fuel cell.

Author Contributions

Conceptualization, Q.Z. and T.M.; methodology, D.Z., M.J. and Y.Y.; software, D.Z., M.J. and Y.Y.; validation, D.Z. and T.M.; formal analysis, D.Z. and T.M.; investigation, D.Z. and T.M.; data curation, D.Z.; writing—original draft preparation, D.Z.; writing—review and editing, T.M., M.J. and D.Z.; supervision, Q.Z.; project administration, Q.Z.; funding acquisition, Q.Z. and T.M.. All authors have read and agreed to the published version of the manuscript.

Funding

This work was funded by the National Natural Science Foundation of China, grant number 51906187 and 21978228; Shaanxi Creative Talents Promotion Plan-Technological Innovation Team, grant number 2019TD-039; China Postdoctoral Science Foundation, grant number 2019M653620 and the Fundamental Research Funds for the Central Universities, grant number cxtd2017004.

Institutional Review Board Statement

Not applicable.

Informed Consent Statement

Not applicable.

Acknowledgments

This simulation was conducted by using the HPC Platform of Xi’an Jiaotong University.

Conflicts of Interest

The authors declare no conflict of interest.

References

  1. Cao, D.X.; Sun, Y.; Wang, G.L. Direct carbon fuel cell: Fundamentals and recent developments. J. Power Sources 2007, 167, 250–257. [Google Scholar] [CrossRef]
  2. Nease, J.; Adams, T.A. Comparative life cycle analyses of bulk-scale coal-fueled solid oxide fuel cell power plants. Appl. Energy 2015, 150, 161–175. [Google Scholar] [CrossRef]
  3. Rady, A.C.; Giddey, S.; Badwal, S.P.S.; Ladewig, B.P.; Bhattacharya, S. Review of fuels for direct carbon fuel cells. Energy Fuel 2012, 26, 1471–1488. [Google Scholar] [CrossRef]
  4. Yu, F.; Han, T.; Wang, Z.; Xie, Y.; Wu, Y.; Jin, Y.; Yang, N.; Xiao, J.; Kawi, S. Recent progress in direct carbon solid oxide fuel cell: Advanced anode catalysts, diversified carbon fuels, and heat management. Int. J. Hydrog. Energy 2021, 46, 4283–4300. [Google Scholar] [CrossRef]
  5. Gur, T.M. Perspectives on oxygen-based coal conversion towards zero-carbon power generation. Energy 2020, 196, 117074. [Google Scholar] [CrossRef]
  6. Chen, K.K.; Han, Y.; Tong, Z.; Gasda, M.; Ho, W.S.W. Membrane processes for CO2 removal and fuel utilization enhancement for solid oxide fuel cells. J. Membr. Sci. 2021, 620, 118846. [Google Scholar] [CrossRef]
  7. Gur, T.M. Progress in carbon fuel cells for clean coal technology pipeline. Int. J. Energy Res. 2016, 40, 13–29. [Google Scholar] [CrossRef]
  8. Giddey, S.; Badwal, S.P.S.; Kulkarni, A.; Munnings, C. A comprehensive review of direct carbon fuel cell technology. Prog. Energy Combust. Sci. 2012, 38, 360–399. [Google Scholar] [CrossRef]
  9. Rady, A.C.; Giddey, S.; Kulkarni, A.; Badwal, S.P.S.; Bhattacharya, S. Direct carbon fuel cell operation on brown coal with a Ni-GDC-YSZ Anode. Electrochim. Acta 2015, 178, 721–731. [Google Scholar] [CrossRef]
  10. Li, H.B.; Xu, N.; Fang, Y.H.; Fan, H.; Lei, Z.; Han, M.F. Syngas production via coal char-CO2 fluidized bed gasification and the effect on the performance of LSCFN//LSGM//LSCFN solid oxide fuel cell. J. Mater. Sci. Technol. 2018, 34, 403–408. [Google Scholar] [CrossRef]
  11. Gur, T.M.; Homel, M.; Virkar, A.V. High performance solid oxide fuel cell operating on dry gasified coal. J. Power Sources 2010, 195, 1085–1090. [Google Scholar] [CrossRef]
  12. Wu, H.; Xiao, J.; Zeng, X.Y.; Li, X.; Yang, J.; Zou, Y.L.; Liu, S.D.F.; Dong, P.; Zhang, Y.J.; Liu, J. A high performance direct carbon solid oxide fuel cell—A green pathway for brown coal utilization. Appl. Energy 2019, 248, 679–687. [Google Scholar] [CrossRef]
  13. Dudek, M.; Skrzypkiewicz, M.; Moskala, N.; Grzywacz, P.; Sitarz, M.; Lubarska-Radziejewska, I. The impact of physicochemical properties of coal on direct carbon solid oxide fuel cells. Int. J. Hydrog. Energy 2016, 41, 18872–18883. [Google Scholar] [CrossRef]
  14. Niu, Y.; Liu, X.; Chang, G.; Guo, Q. Treatment of isopropanol wastewater in an anaerobic fluidized bed microbial fuel cell filled with macroporous adsorptive resin as multifunctional biocarrier. Sci. Total Environ. 2020, 719, 137495. [Google Scholar] [CrossRef] [PubMed]
  15. Liu, X.; Niu, Y.; Wang, L.; Guo, Q. Treatment of m-Cresol wastewater in an anaerobic fluidized bed microbial fuel cell equipped with different modified carbon cloth cathodes. Energy Fuels 2020, 34, 10059–10066. [Google Scholar] [CrossRef]
  16. Pongratz, G.; Subotić, V.; Schroettner, H.; Stoeckl, B.; Hochenauer, C.; Anca-Couce, A.; Scharler, R. Investigation of solid oxide fuel cell operation with synthetic biomass gasification product gases as a basis for enhancing its performance. Biomass Convers. Biorefin. 2020, 11, 121–139. [Google Scholar] [CrossRef] [Green Version]
  17. Lee, A.C.; Li, S.; Mitchell, R.E.; Guer, T.M. Conversion of solid carbonaceous fuels in a fluidized bed fuel cell. Electrochem. Solid State Lett. 2008, 11, B20–B23. [Google Scholar] [CrossRef]
  18. Cai, W.Z.; Liu, J.; Liu, P.P.; Liu, Z.J.; Xu, H.R.; Chen, B.; Li, Y.Z.; Zhou, Q.; Liu, M.L.; Ni, M. A direct carbon solid oxide fuel cell fueled with char from wheat straw. Int. J. Energy Res. 2019, 43, 2468–2477. [Google Scholar] [CrossRef]
  19. Li, J.W.; Wei, B.; Wang, C.Q.; Zhou, Z.Y.; Lu, Z. High-performance and stable La0.8Sr0.2Fe0.9Nb0.1O3-delta anode for direct carbon solid oxide fuel cells fueled by activated carbon and corn straw derived carbon. Int. J. Hydrog. Energy 2018, 43, 12358–12367. [Google Scholar] [CrossRef]
  20. Yu, F.Y.; Wang, Y.S.; Xie, Y.J.; Zhang, W.M.; Zhang, J.J.; Meng, X.X.; Xiao, J.; Yang, N.T. A microtubular direct carbon solid oxide fuel cell operated on the biochar derived from pepper straw. Energy Technol. 2020, 8, 1901077. [Google Scholar] [CrossRef]
  21. An, W.T.; Sun, X.J.; Jiao, Y.; Juliao, P.S.B.; Wang, W.; Wang, S.B.; Li, S.D.; Shuang, S.M. A solid oxide carbon fuel cell operating on pomelo peel char with high power output. Int. J. Energy Res. 2019, 43, 2514–2526. [Google Scholar] [CrossRef]
  22. Nakagawa, N.; Ishida, M. Performance of an internal direct-oxidation carbon fuel-cell and its evaluation by graphic exergy analysis. Ind. Eng. Chem. Res. 1988, 27, 1181–1185. [Google Scholar] [CrossRef]
  23. Gur, T.M.; Huggins, R.A. Direct electrochemical conversion of carbon to electrical energy in a high-temperature fuel-cell. J. Electrochem. Soc. 1992, 139, L95–L97. [Google Scholar] [CrossRef]
  24. Xie, Y.M.; Tang, Y.B.; Liu, J. A verification of the reaction mechanism of direct carbon solid oxide fuel cells. J. Solid State Electrochem. 2013, 17, 121–127. [Google Scholar] [CrossRef]
  25. Cai, W.Z.; Liu, J.; Xie, Y.M.; Xiao, J.; Liu, M.L. An investigation on the kinetics of direct carbon solid oxide fuel cells. J. Solid State Electrochem. 2016, 20, 2207–2216. [Google Scholar] [CrossRef]
  26. Jiang, Y.; Virkar, A.V. Fuel composition and diluent effect on gas transport and performance of anode-supported SOFCs. J. Electrochem. Soc. 2003, 150, A942–A951. [Google Scholar] [CrossRef]
  27. Siengchum, T.; Guzman, F.; Chuang, S.S.C. Analysis of gas products from direct utilization of carbon in a solid oxide fuel cell. J. Power Sources 2012, 213, 375–381. [Google Scholar] [CrossRef]
  28. Cai, W.Z.; Cao, D.; Zhou, M.Y.; Yan, X.M.; Li, Y.Z.; Wu, Z.; Lu, S.P.; Mao, C.Y.; Xie, Y.M.; Zhao, C.W.; et al. Sulfur-tolerant Fe-doped La0.3Sr0.7TiO3 perovskite as anode of direct carbon solid oxide fuel cells. Energy 2020, 211, 118958. [Google Scholar] [CrossRef]
  29. Xiao, J.; Han, D.; Yu, F.Y.; Zhang, L.; Liu, J.; Zhan, Z.L.; Zhang, Y.J.; Dong, P. Characterization of symmetrical SrFe0.75Mo0.25O3-delta electrodes in direct carbon solid oxide fuel cells. J. Alloy Compd. 2016, 688, 939–945. [Google Scholar] [CrossRef] [Green Version]
  30. Liu, C.; Pu, J.G.; Chen, X.; Ma, Z.; Ding, X.; Zhou, J.; Wang, S.R. Influence of anode’s microstructure on electrochemical performance of solid oxide direct carbon fuel cells. Int. J. Hydrog. Energy 2020, 45, 11784–11790. [Google Scholar] [CrossRef]
  31. Liu, R.Z.; Zhao, C.H.; Li, J.L.; Zeng, F.R.; Wang, S.R.; Wen, T.L.; Wen, Z.Y. A novel direct carbon fuel cell by approach of tubular solid oxide fuel cells. J. Power Sources 2010, 195, 480–482. [Google Scholar] [CrossRef]
  32. Bai, Y.H.; Liu, Y.; Tang, Y.B.; Xie, Y.M.; Liu, J. Direct carbon solid oxide Fuel Cell—A potential high performance battery. Int. J. Hydrog. Energy 2011, 36, 9189–9194. [Google Scholar] [CrossRef]
  33. Jiao, Y.; Xue, X.T.; An, W.T.; Juliao, P.S.B.; Wang, W.; Yang, G.M.; Zhou, W.; Li, S.D. Purified high-sulfur coal as a fuel for direct carbon solid oxide fuel cells. Int. J. Energy Res. 2019, 43, 2501–2513. [Google Scholar] [CrossRef]
  34. Zhou, M.Y.; Wang, X.Q.; Zhang, Y.P.; Qiu, Q.Y.; Liu, M.L.; Liu, J. Effect of counter diffusion of CO and CO2 between carbon and anode on the performance of direct carbon solid oxide fuel cells. Solid State Ion. 2019, 343, 115127. [Google Scholar] [CrossRef]
  35. Li, S.; Lee, A.C.; Mitchell, R.E.; Gur, T.M. Direct carbon conversion in a helium fluidized bed fuel cell. Solid State Ion. 2008, 179, 1549–1552. [Google Scholar] [CrossRef]
  36. Lee, A.C.; Mitchell, R.E.; Gur, T.M. Modeling of CO2 gasification of carbon for integration with solid oxide fuel cells. AIChE J. 2009, 55, 983–992. [Google Scholar] [CrossRef]
  37. Alexander, B.R.; Mitchell, R.E.; Gur, T.M. Modeling of experimental results for carbon utilization in a carbon fuel cell. J. Power Sources 2013, 228, 132–140. [Google Scholar] [CrossRef]
  38. Armstrong, G.J.; Alexander, B.R.; RMitchell, E.; Guer, T.M. Modeling heat transfer effects in a solid oxide carbon fuel cell. In Batteries and Energy Technology; Manivannan, A., Minakshi, M., Narayan, S.R., Mukerjee, S., Eds.; ECS Transactions: Pennington, NJ, USA, 2013; pp. 143–150. [Google Scholar]
  39. Ma, L. Combustion and Gasification of Chars in Oxygen and Carbon Dioxide at Elevated Pressure; Mechnical Engieeering Department, Stanford University: Stanford, CA, USA, 2006. [Google Scholar]
  40. Gidaspow, D. Multiphase Flow and Fluidization: Continuum and Kinetic Theory Descriptions; Academic Press: San Diego, CA, USA, 1994. [Google Scholar]
  41. Jiang, M.; Chen, X.; Zhou, Q. A gas pressure gradient-dependent subgrid drift velocity model for drag prediction in fluidized gas-particle flows. AIChE J. 2020, 66, e16884. [Google Scholar] [CrossRef]
  42. Huang, Z.Q.; Wang, L.X.; Zhou, Q. Development of a filtered reaction rate model for reactive gas-solid flows based on fine-grid simulations. AIChE J. 2021, 67, e17185. [Google Scholar] [CrossRef]
  43. Li, T.W.; Rogers, W.A.; Syamlal, M.; Dietiker, J.F.; Musser, J.; Shahnam, M.; Rabha, S. The NETL MFiX Suite of multiphase flow models: A brief review and recent applications of MFiX-TFM to fossil energy technologies. Chem. Eng. Sci. 2017, 169, 259–272. [Google Scholar] [CrossRef]
  44. Holloway, W.; Sundaresan, S. Filtered models for reacting gas-particle flows. Chem. Eng. Sci. 2012, 82, 132–143. [Google Scholar] [CrossRef] [Green Version]
  45. Ireland, E.; Pitt, K.; Smith, R. A review of pulsed flow fluidisation; the effects of intermittent gas flow on fluidised gas–solid bed behaviour. Powder Technol. 2016, 292, 108–121. [Google Scholar] [CrossRef]
  46. Grace, J.R.; Bi, X.; Ellis, N. Essentials of Fluidization Technology; Wiley-VCH: Weinheim, Germany, 2020. [Google Scholar]
  47. Li, G.D.; Gou, Y.J.; Qiao, J.S.; Sun, W.; Wang, Z.H.; Sun, K.N. Recent progress of tubular solid oxide fuel cell: From materials to applications. J. Power Sources 2020, 477, 228693. [Google Scholar] [CrossRef]
  48. Huang, K.; Singhal, S.C. Cathode-supported tubular solid oxide fuel cell technology: A critical review. J. Power Sources 2013, 237, 84–97. [Google Scholar] [CrossRef]
  49. Udomsilp, D.; Lenser, C.; Guillon, O.; Menzler, N.H. Performance Benchmark of Planar Solid Oxide Cells Based on Material Development and Designs. Energy Technol. 2021, 9, 2001062. [Google Scholar] [CrossRef]
Figure 1. Model of fluidized bed gasifier coupled with DC-SOFC.
Energies 14 02800 g001
Figure 2. Fluidized bed gasifier with different carbon bed.
Energies 14 02800 g002
Figure 3. Gas–solid flows with different CO2 inlet velocities, v CO 2 , in . (a) 0.2 cm/s, (b) 0.5 cm/s, (c) 0.9 cm/s, (d) 1.5 cm/s, (e) 3.0 cm/s, (f) 11.0 cm/s.
Energies 14 02800 g003
Figure 4. CO molar fraction distribution in fluidized bed gasifiers with different active site densities A s , 7.2 × 10⁻⁶ mol/m2, 3.6 × 10⁻⁵ mol/m2, 7.2 × 10⁻⁵ mol/m2, 1.44 × 10⁻⁴ mol/m2, 3.6 × 10⁻⁴ mol/m2. (a) Fixed bed with v CO 2 , in = 0.2 cm/s, (b) Delayed bubbling bed with v CO 2 , in = 0.5 cm/s, (c) Bubbling bed with v CO 2 , in = 1.5 cm/s, (d) Bubbling bed with v CO 2 , in = 3.0 cm/s.
Energies 14 02800 g004
Figure 5. Effect of active site densities A s and inlet velocity v CO 2 , in on (a) carbon bed height, HC, (b) total gasification rate, R tot .
Energies 14 02800 g005
Figure 6. Effect of channel width, W, and inlet velocity v CO 2 , in on (a) carbon bed height, HC, (b) total gasification rate, R tot .
Energies 14 02800 g006
Figure 7. Averaged CO molar fractions (a,c,e) and CO molar fractions near side walls (b,d,f) along channel for fixed bed gasifiers coupled with SOFCs with A s = 7.2 × 10⁻⁶ mol/m2. (a,b) 1000 A/m2, v CO 2 , in = 0.2 cm/s; (c,d) 2000 A/m2, v CO 2 , in = 0.2 cm/s; (e,f) 2000 A/m2, v CO 2 , in = 0.5 cm/s.
Energies 14 02800 g007aEnergies 14 02800 g007b
Figure 8. (a) Carbon bed height, HC, and (b) total gasification rate, R tot of fluidized bed coupled with SOFC with A s = 7.2 × 10⁻⁶ mol/m2.
Energies 14 02800 g008
Figure 9. Averaged CO molar fractions (a,c,e) and CO molar fraction near side walls (b,d,f) along channel for fixed bed gasifiers coupled with SOFC with A s = 7.2 × 10⁻⁵ mol/m2,   v CO 2 , in = 0.2 cm/s. (a,b) 5000 A/m2, (c,d) 8000 A/m2, (e,f) 10,000 A/m2.
Energies 14 02800 g009
Figure 10. (a) Carbon bed height, HC and (b) total gasification rate, R tot of fluidized bed coupled with SOFC with A s = 7.2 × 10⁻⁵ mol/m2,   v CO 2 , in = 0.2 cm/s.
Energies 14 02800 g010
Figure 11. Averaged CO molar fractions (a,c,e) and CO molar fraction near side walls (b,d,f) along channel for delayed bubbling bed gasifiers coupled with SOFC with A s = 7.2 × 10⁻⁵ mol/m2,   v CO 2 , in = 0.5 cm/s. (a,b) 5000 A/m2, (c,d) 8000 A/m2, (e,f) 10,000 A/m2.
Energies 14 02800 g011aEnergies 14 02800 g011b
Figure 12. (a) Carbon bed height, HC and (b) total gasification rate, R tot of fluidized bed coupled with SOFC with A s = 7.2 × 10⁻⁵ mol/m2,   v CO 2 , in = 0.5 cm/s.
Energies 14 02800 g012
Figure 13. Averaged CO molar fractions (a,c,e) and CO molar fractions near side walls (b,d,f) along channel for bubbling bed gasifiers coupled with SOFC with A s = 7.2 × 10⁻⁵ mol/m2,   v CO 2 , in = 1.5 cm/s. (a,b) 5000 A/m2, (c,d) 10,000 A/m2, (e,f) 15,000 A/m2.
Energies 14 02800 g013aEnergies 14 02800 g013b
Figure 14. (a) Carbon bed height, HC and (b) total gasification rate, R tot of bubbling bed gasifiers coupled with SOFC with A s = 7.2 × 10⁻⁵ mol/m2,   v CO 2 , in = 1.5 cm/s.
Energies 14 02800 g014
Table 1. Parameters in Boudouard gasification model.
Pre-Exponent ConstantValueActivation Energy (J/mol)Value
A 1 f 5.00 × 10³ E 1 f 1.85 × 10⁵
A 1 r 1.08 × 10² E 1 r 8.97 × 10⁵
A 2 1.00 × 10¹³ E 2 3.75 × 10⁵
A 3 1.00 × 10⁻⁴ E 3 5.80 × 10⁴
A 4 f 0.877 E 4 f 1.48 × 10⁵
A 4 r 1.00 × 10¹³ E 4 r 4.55 × 10⁵
A 5 1.01 × 10⁷ E 5 2.62 × 10⁵
Table 2. Parameters adopted in TFM simulations.
ParameterValue
Reactor   height ,   H R m 0.200
Initial   bed   height ,   H 0 m 0.100
Temperature ,   T K 1173
Particle   diameter ,   d p μ m 155
Particle   density ,   ρ p kg · m 3 1000
Bed   voidage ,   ε 0 0.450
CO 2   dynamic   viscosity ,   μ co 2 Pa · s 4.446 × 10⁻⁵
CO   dynamic   viscosity ,   μ co Pa · s 4.443 × 10⁻⁵
Specific   surface   area   of   the   char ,   S C   m 2 · g 1 750
Gravitational   acceleration ,   g m · s 2 9.807
Faraday   constant ,   F ( C · mol 1 ) 96,485.3
Gas   constant ,   R J · mol 1 · K 1 8.314
Inlet   gas   composition ,   x co 2 100%
Grid   resolution ,   Δ x μ m 4.3   d p
Gibbs free energy, G0 kJ · mol 1 180.549
Time   step ,   Δ t s 10−8~10−3
Publisher’s Note: MDPI stays neutral with regard to jurisdictional claims in published maps and institutional affiliations.