Article

Energy Conservation Measures for a Research Data Center in an Academic Campus

Mechanical Engineering, Youngstown State University, Youngstown, OH 44555, USA
*
Author to whom correspondence should be addressed.
Energies 2021, 14(10), 2820; https://doi.org/10.3390/en14102820
Submission received: 11 April 2021 / Revised: 7 May 2021 / Accepted: 11 May 2021 / Published: 14 May 2021
(This article belongs to the Section G: Energy and Buildings)

Abstract

:
Simulation and experimental studies were conducted to investigate energy consumption, develop ECMs (Energy Conservation Measures), and analyze temperature increase under a power failure scenario for a research data center at Youngstown State University. Two ECMs were developed to improve energy consumption by analyzing the thermal performance of the data center: (1) increase the return temperature in air conditioning vents; (2) provide cold aisle containment with the set point temperature increase. A transient analysis was conducted under a cooling system failure scenario to predict the temperature variation over time. The results suggest that it takes 600 s to increase the server inlet temperature by 16.1 °C for the baseline model. In addition, in the ECM #2, the maximum temperature at the server inlet did not reach 40 °C under the air conditioning system failure scenario, which is the maximum operating temperature of the ASHRAE A3 envelop.

Graphical Abstract

1. Introduction

Data centers are energy intensive, they account for over 1% of the worlds energy usage [1]. In the United States, data centers consume more than 100 TWh per year, which corresponds to more than 2% of the overall electricity use [2]. In 2020, it was estimated that their energy consumption reached roughly 140 billion kWh per year, which is equivalent to 150 million metric ton of carbon emission [3]. Some reports even suggest that data center energy consumption may increase to 20% of the total global energy consumption in 2025 [4]. In addition to that, data centers consume up to 100 to 200 times more energy than standard office spaces [5]. This massive increase in energy consumption by data centers over the last several decades has caused multiple significant environmental crises due to carbon pollution and climate change [6]. As a result, energy performance analysis of data centers is a crucial concern, followed by availability and security as the second and third concerns, respectively.
Several studies have been developed and performed to analyze the energy consumption of data centers [7,8,9,10,11]. Phan and Lin [12] conducted a simulation study for a multi-zone building data center. They used a commercial simulation software for building energy analysis (EnergyPlus) to study the effects of climatic locations, air inlet temperatures, and flow rates on the thermal performance of data centers. The researchers showed that multi-zone modeling approach is a reasonable model for energy consumptions of data centers. Cupertino et al. [13] investigated the thermal efficiency of data centers by analyzing the IT load, cooling load, and workload. They obtained a data center model including the effect of workload. Fu et al. [14] conducted a simulation study to compare the cooling and the electrical system under normal and emergency scenarios such as blackouts for data centers powered by conventional energy to ones powered by renewable energy. The researchers showed that the simulation modeling and multi-domain simulations streamline the ease at which users can investigate both normal and emergency operations for conventional and renewable data centers. Dvorak et al. [15] investigated simulation models and analyzed the energy performance of a data center at a university campus. They found that the uncertainty of the waste heat potential associated to various thermal management strategies of the data center. Kahsay et al. [9] investigated the effects of building size, changes in microclimate parameters with altitude, and the uncertainties on the energy consumption by individual rooms at various elevations of buildings. They showed the importance of heat transfer coefficients correlations because of their usefulness in enhancing the thermal comfort of individual rooms and optimizing building energy consumptions.
The purpose of the present study is to investigate an energy consumption model and identify energy conservation measures (ECMs) that can save the energy consumptions of the data center at Youngstown State University campus. Although variations in the design and operating parameters occur between one academic data center to another, one can expect many applicability and similarity of the general ECMs such as those identified in this case study.

2. Materials and Methods

Figure 1 shows a schematic of the data center with equipment. The data center room includes four racks, a PDU (Power Distribution Unit), and an ACU (Air Conditioning Unit). In order to analyze the thermal performance and the cooling load of data center, the velocity and temperature at the inlets and outlets of the ACU were measured. The total thermal load of the room is the sum of the cooling system load of the ACU as shown in Equation (1). Twelve points of velocity and 8 points of temperature were measured at the inlets and outlets of the ACU. The instruments used to conduct the experiment were the Hobo MX1101 Data logger, with an accuracy of 2%, to collect the temperature and relative humidity data, and a hot wire anemometer (Testo 405i), with an accuracy of 0.1 m/s, to measure the air velocity. The measured temperature and velocity locations are indicated in Figure 1 with red circles. The average velocity and temperature were used to obtain the total energy consumption of the data center.
Q D a t a C e n t e r = Q I T + Q P D U + Q A C U   F a n s + Q L i g h t + Q e t c = i = 1 n m ˙ i c p ( T - i n , i T - o u t , i ) A C U
where Q, m ˙ , cp, and T - , are generated heat (W), mass flow rate (kg/s), specific heat (J/kg·K), and average temperature (°C), respectively. The thermal load of the data center yielded to 16.6 kW. The IT load of 6.6 kW was calculated from the measured the output power in the PDUs.
In order to analyze data center energy performance, the power usage effectiveness (PUE) was calculated, which is defined as the ratio of the total power consumption of the data center to the power used by the IT equipment [16]:
PUE = Totalfacilitypower IT   facilitypower
Based on the obtained total energy consumption and IT load of the data center room, the PUE can be calculated through Equation (2), which yielded to 2.51. According to The National Renewable Energy Laboratory [16], the average PUE value of data centers in the United States of America is 1.8. Therefore, the PUE utilized in this research is about 30% higher than the PUE of the national average. Moreover, based on the PUE analysis, the cooling system and operational strategies of the data center leave much room for improvement.

3. Results and Discussion

The PUE of the data center is about 30% higher than the PUE of the national average. Therefore, some opportunities for energy saving are developed by suggesting ECMs in this research. To evaluate how the room preforms, a baseline was simulated on a commercial 3D simulation software called 6Sigma room, one of the most widely used software packages for data center simulations [17]. Many researchers have used the simulation software to analyze thermal performance of data centers [18,19,20,21]. The simulation model provides accurate analysis for the actual data center thermal systems. The location and number of servers in each rack are modeled according to the actual data center arrangement.
Figure 2 shows the temperature variation of the air from the vents in the room under steady heat transfer conditions. The maximum and minimum inlet temperatures in the server are 21.9 °C and 18.1 °C in the simulation model, which are well matched with the measured data within 4% error. The measured maximum and minimum inlet temperature in the server are 22.6 °C and 17.5 °C, respectively. Moreover, based on the measurement and simulation results, three ECMs are proposed to save the energy consumption of the data center.

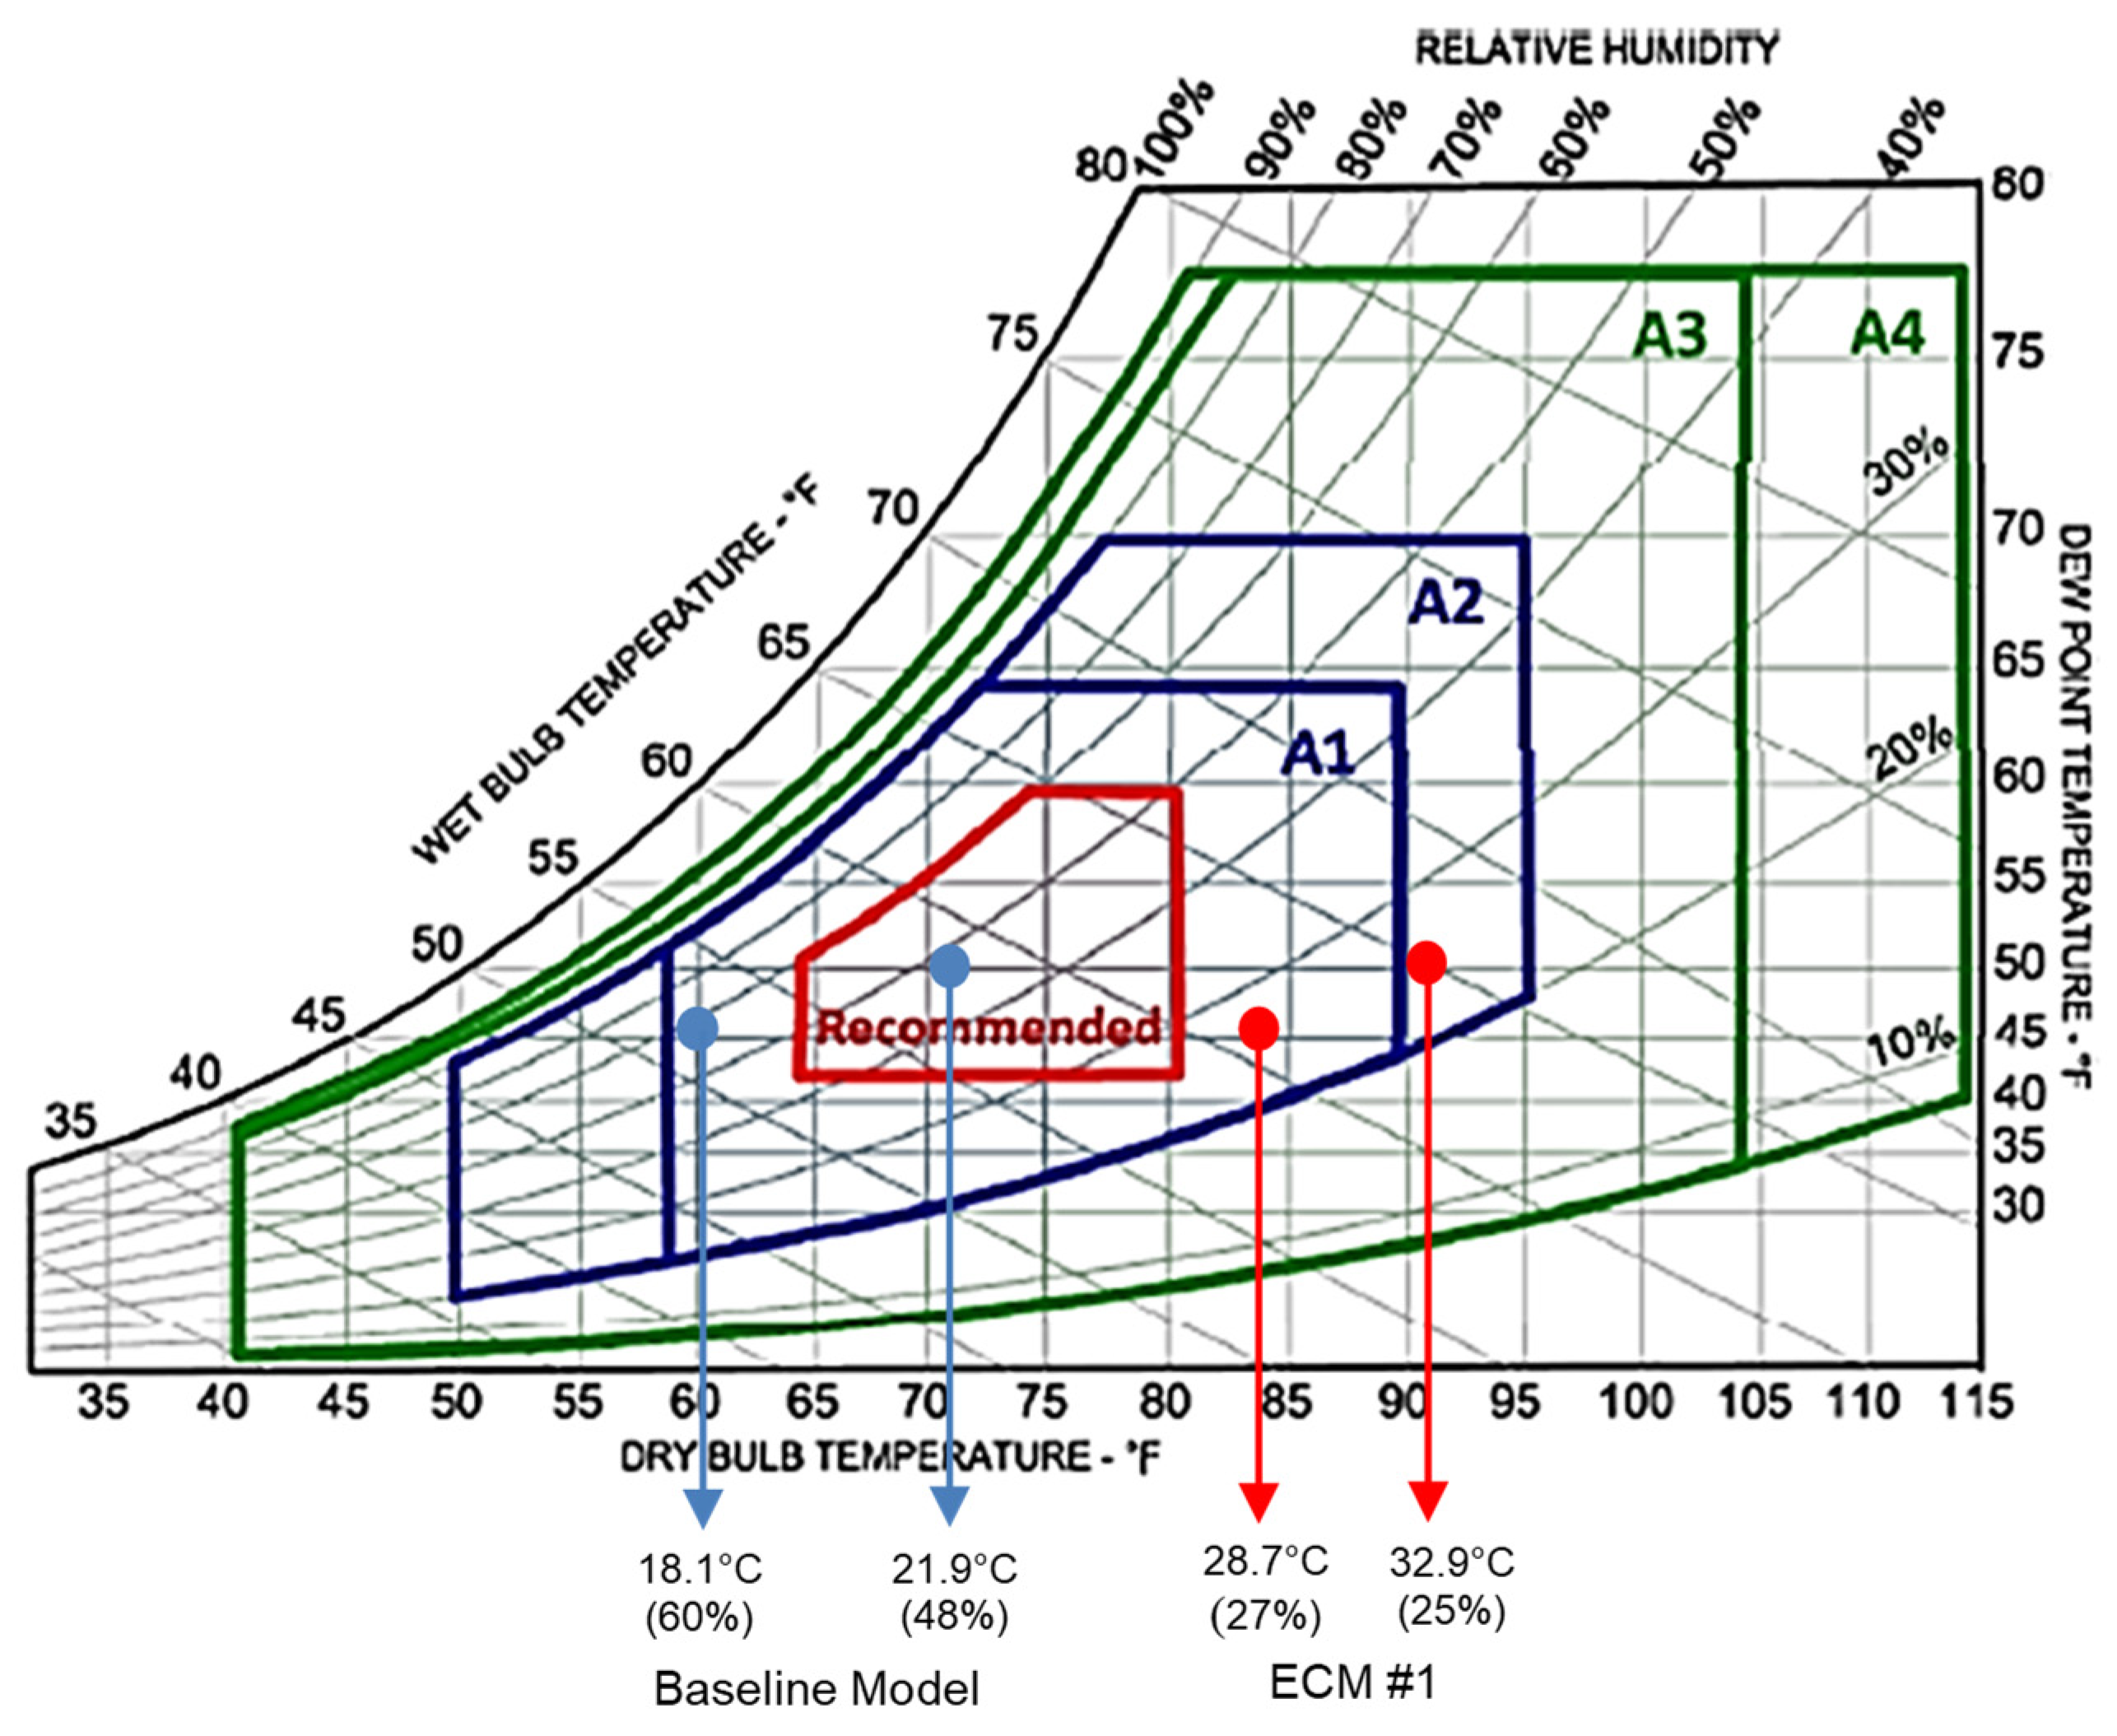
3.1. ECM #1—Increase the Return Air Temperature

Temperature and humidity are measured at each rack to evaluate the thermal conditions of the data center. The commercial 3D simulation software called 6Sigma room is used for ECM and the energy consumption model same as the baseline model. The air conditioning inlet temperature in the baseline model was 12.5 °C, with a maximum and minimum inlet temperature of the racks at 21.9 °C with 50% humidity, and 18.1 °C with 50% humidity. In reference to the ASHRAE’s thermal guideline [22], as shown in Figure 3, these conditions placed the maximum and minimum inlet temperatures in box A1.
In this ECM, the air conditioning inlet temperature was increased by 11 °C to 23.5 °C. As a result, the maximum and minimum temperature of the racks increased to 32.9 °C with 28% humidity and 28.7 °C with 27% humidity. Moreover, it keeps the inlet conditions in box A1 while providing better thermal conditions for the IT servers and saving energy in Figure 3. Increasing the set point air temperature results in energy savings of the data center. Increasing the return air temperature of the data center can save energy by reducing the cooling load. Several data center managers mentioned that about 4% energy saving is obtained for every degree of upward change in the return air temperature. Google, Intel, Sun and HP mentioned energy savings from the higher return air temperature settings in the data centers [23]. Ghaharamani et al. [24] showed that about 27% of the total energy savings was achieved by increasing the return air temperature from 22.2 °C to 25 °C. Hoyt et al. [25] found that raising return air temperature reduces up to 28% energy consumption for office buildings. Fernandez et al. [26] showed that energy savings of 9–20% can be obtained by increasing set point temperature by 1 °C. Based on the energy saving data obtained from the studies [24,25,26], the energy savings of ECM #1 yielded to 25,053 kWh/yr in the data center room utilized.

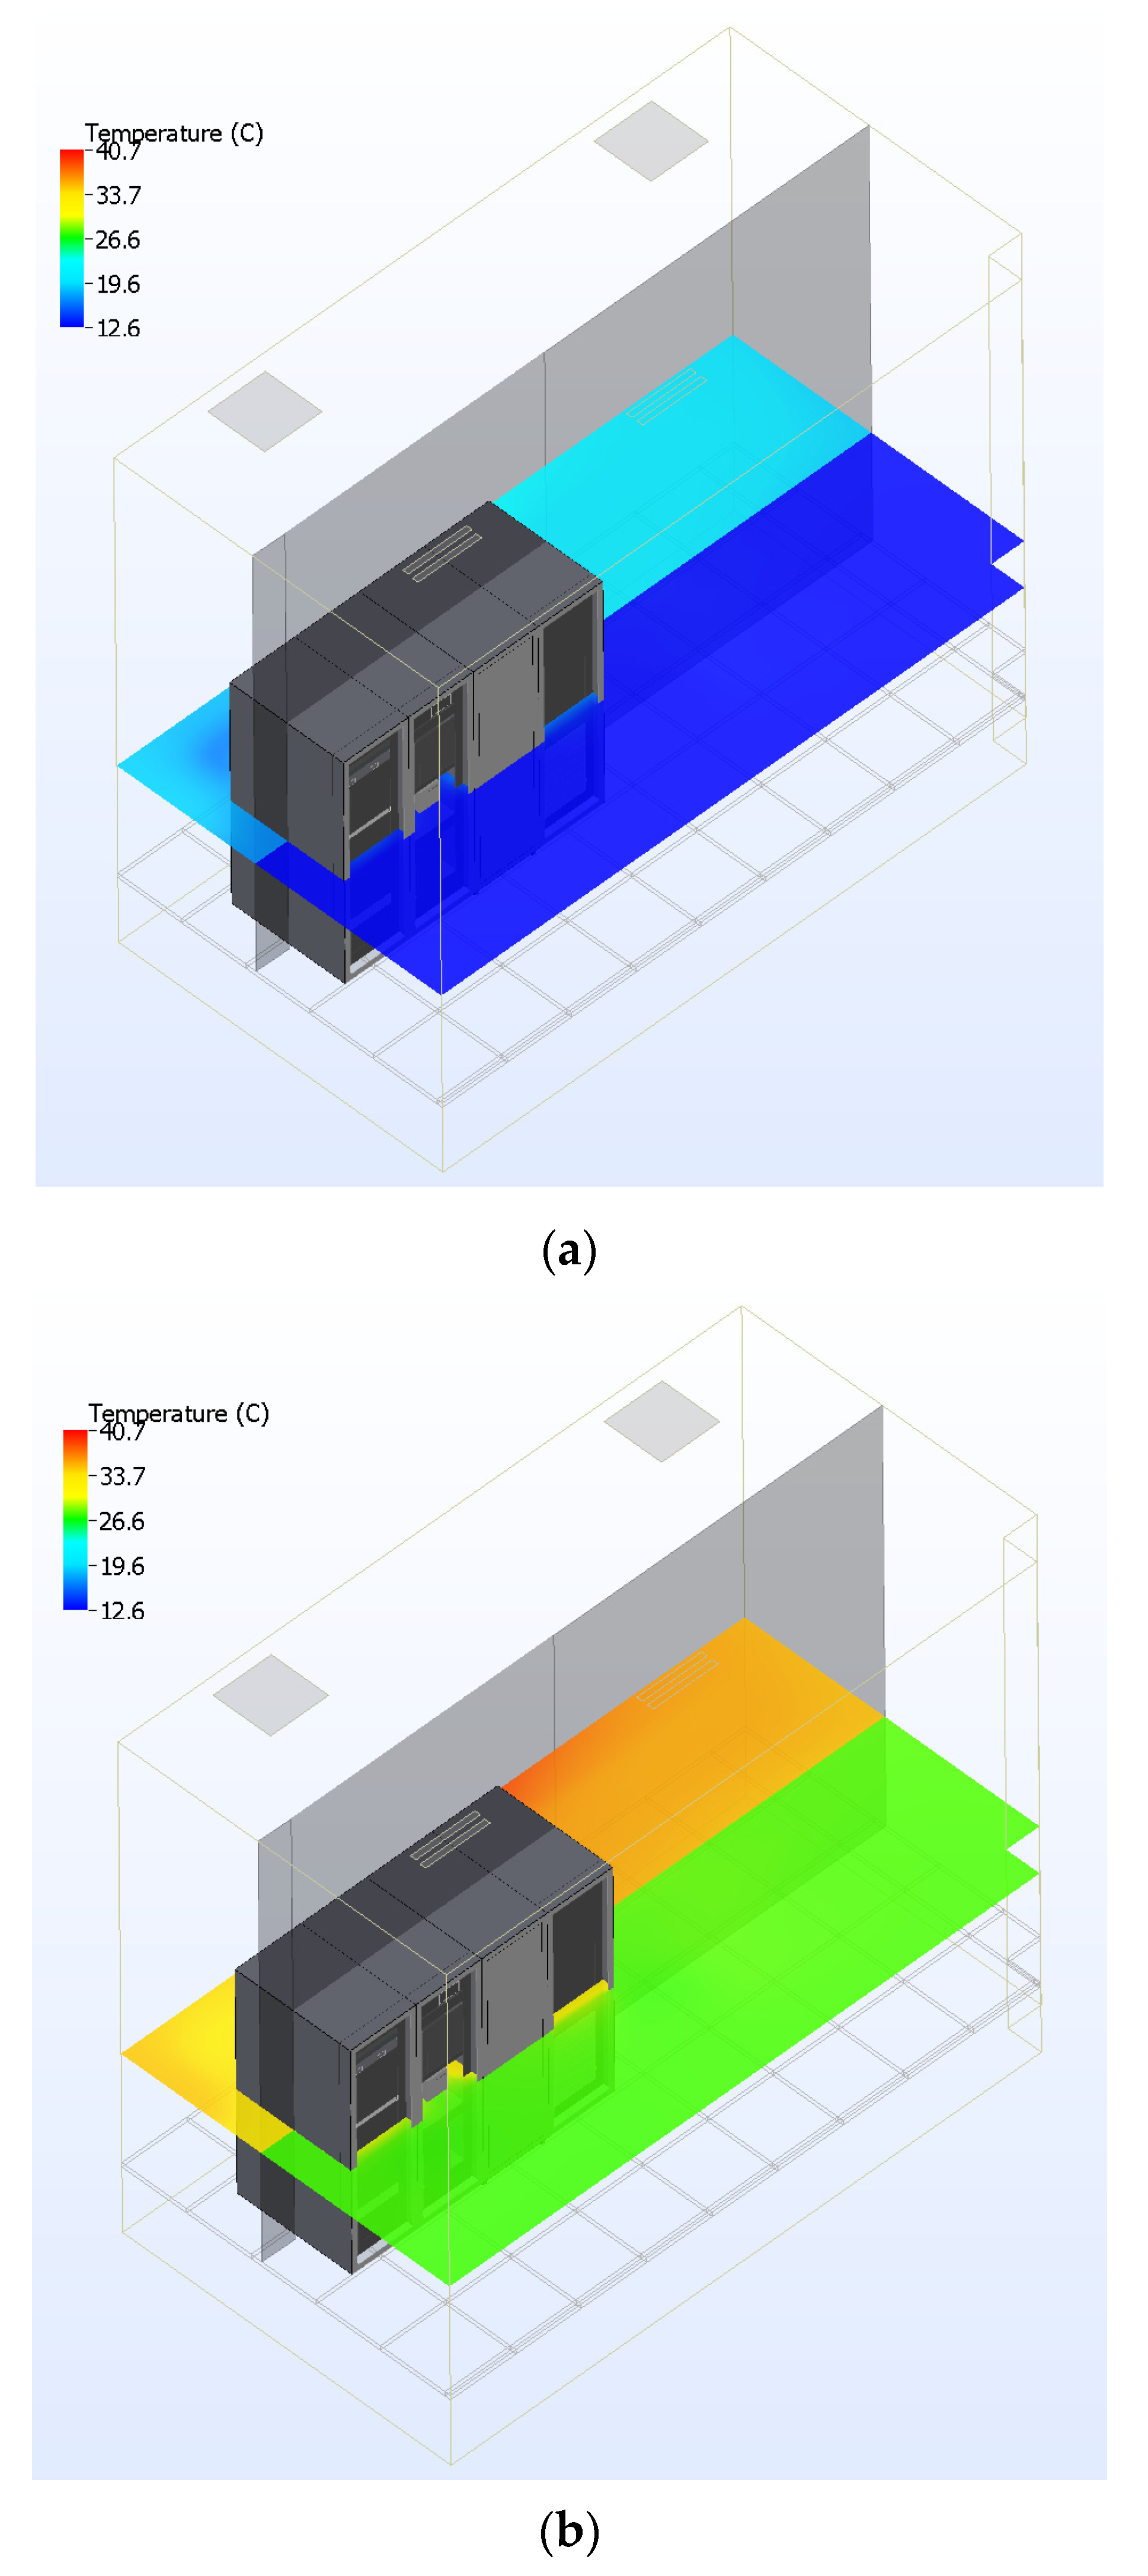
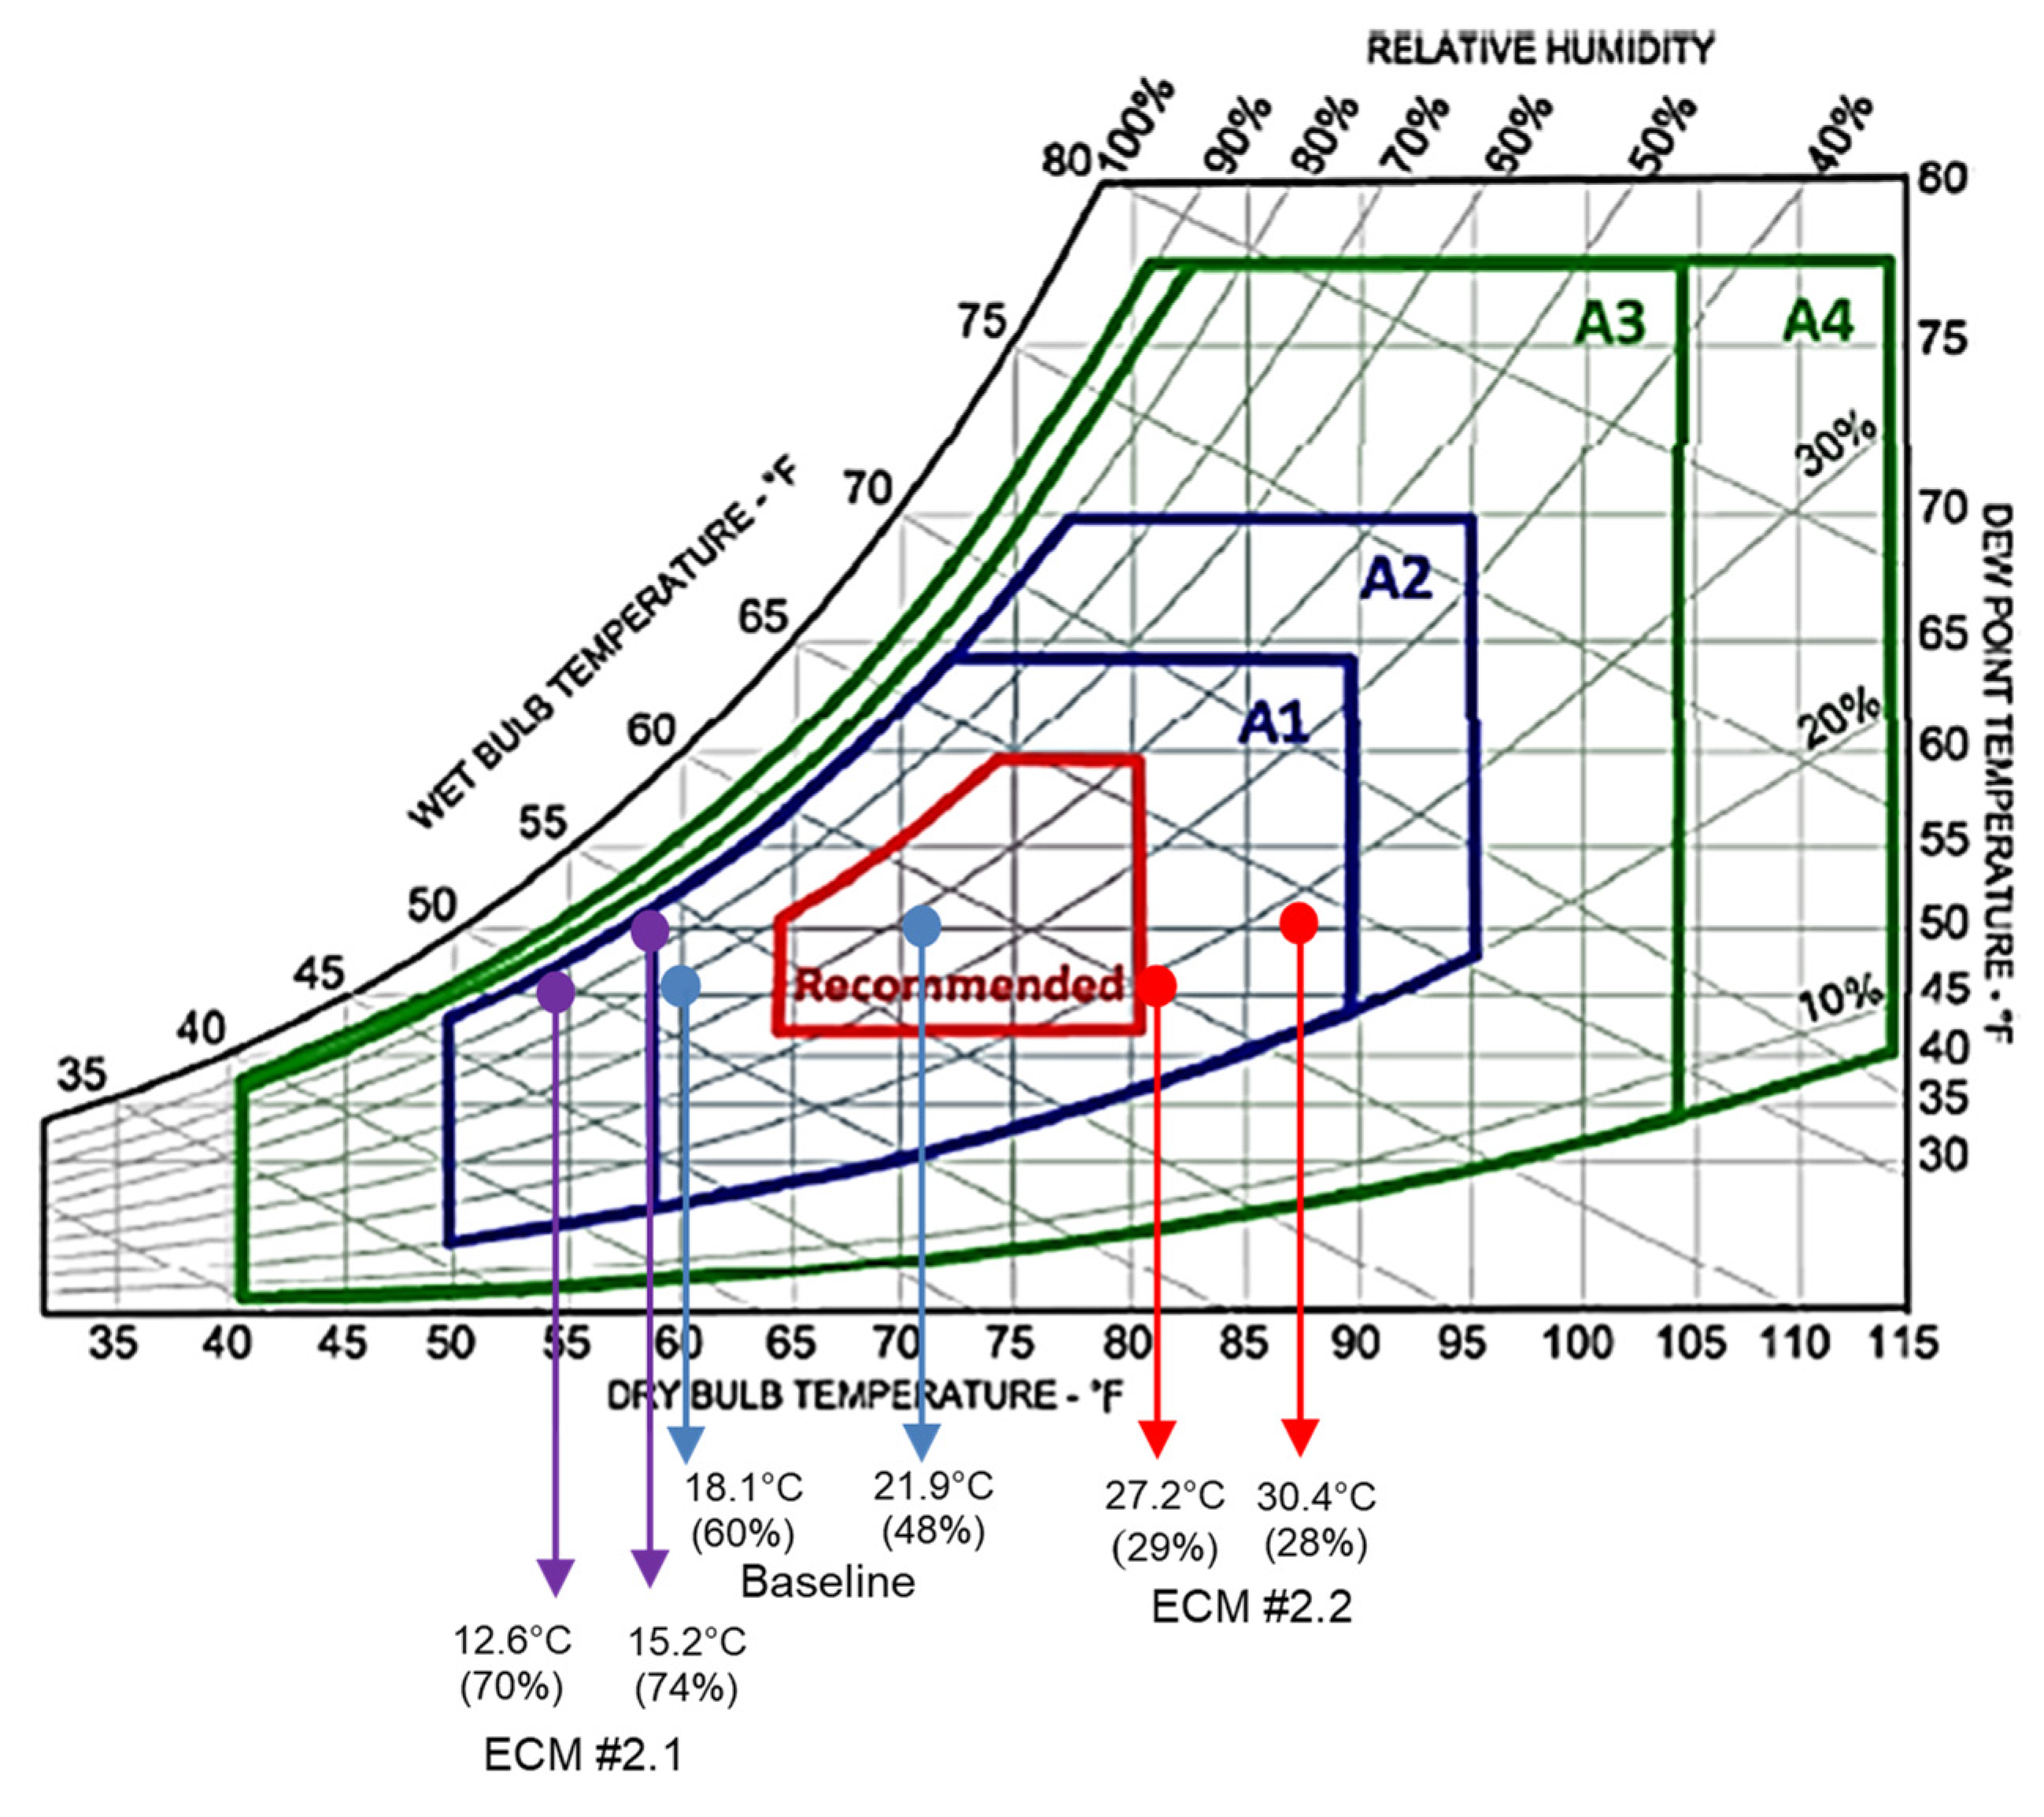
3.2. ECM #2.1—Cold and Hot Aisle Containment and ECM #2.2 Set Point Temperature Increase

This ECM model considered the effects of applying a cold and hot aisle containment on the baseline model. A transparent plate was attached to sperate the inlet and outlet of the server racks. ECM #2.1 studied the outcome of applying the cold and hot aisle containment while maintaining the original set point temperature of 20 °C imposed in the baseline model. Figure 4 shows temperature distributions for ECM models under steady heat transfer conditions. As shown in Figure 4a, the cold aisle containment provides uniform and low inlet temperature distribution in the data center. In comparison to the baseline model, the minimum server inlet temperature dropped from 18.1 °C with 60% humidity to 12.6 °C with 70% humidity, and the maximum server inlet temperature of the data center dropped from 21.9 °C with 48% humidity to 15.2 °C with 74% humidity as shown in Figure 4. As a result of applying the cold and hot aisle containment, the server inlet conditions moved from box A1 to A2, in reference to the ASHRAE thermal guidelines.
Furthermore, to increase the energy performance of the data center, ECM# 2.2 was suggested. The air conditioning inlet temperature was increased to 27.5 °C while applying the cold and hot aisle containment, therefore the set point temperature was raised from 20 to 35 °C. The temperature profile of ECM #2.2 (set point temperature increase from ECM #2.1) for the data center is shown in Figure 4b. In contrast to ECM #2.1, the minimum server inlet and maximum servlet inlet temperatures where increased to 27.2 °C with 29% humidity and 30.4 °C with 28% humidity, respectively. The changes implemented in ECM #2.2 corresponded to changes in the server’s inlet conditions which were mapped on the ASHRAE thermal guideline alongside the baseline model and ECM #2.1, as illustrated in Figure 5. As a result, the server inlet condition moved from box A2 to box A1, when compared to ECM #2.1. This improves the efficiency of the data center room by providing better inlet conditions for the servers. Based on the energy saving reports mentioned in ECM #1, the implementation of the cold and hot aisle containment upon increasing the set point temperature yielded to 34,164 kWh/yr in energy savings.

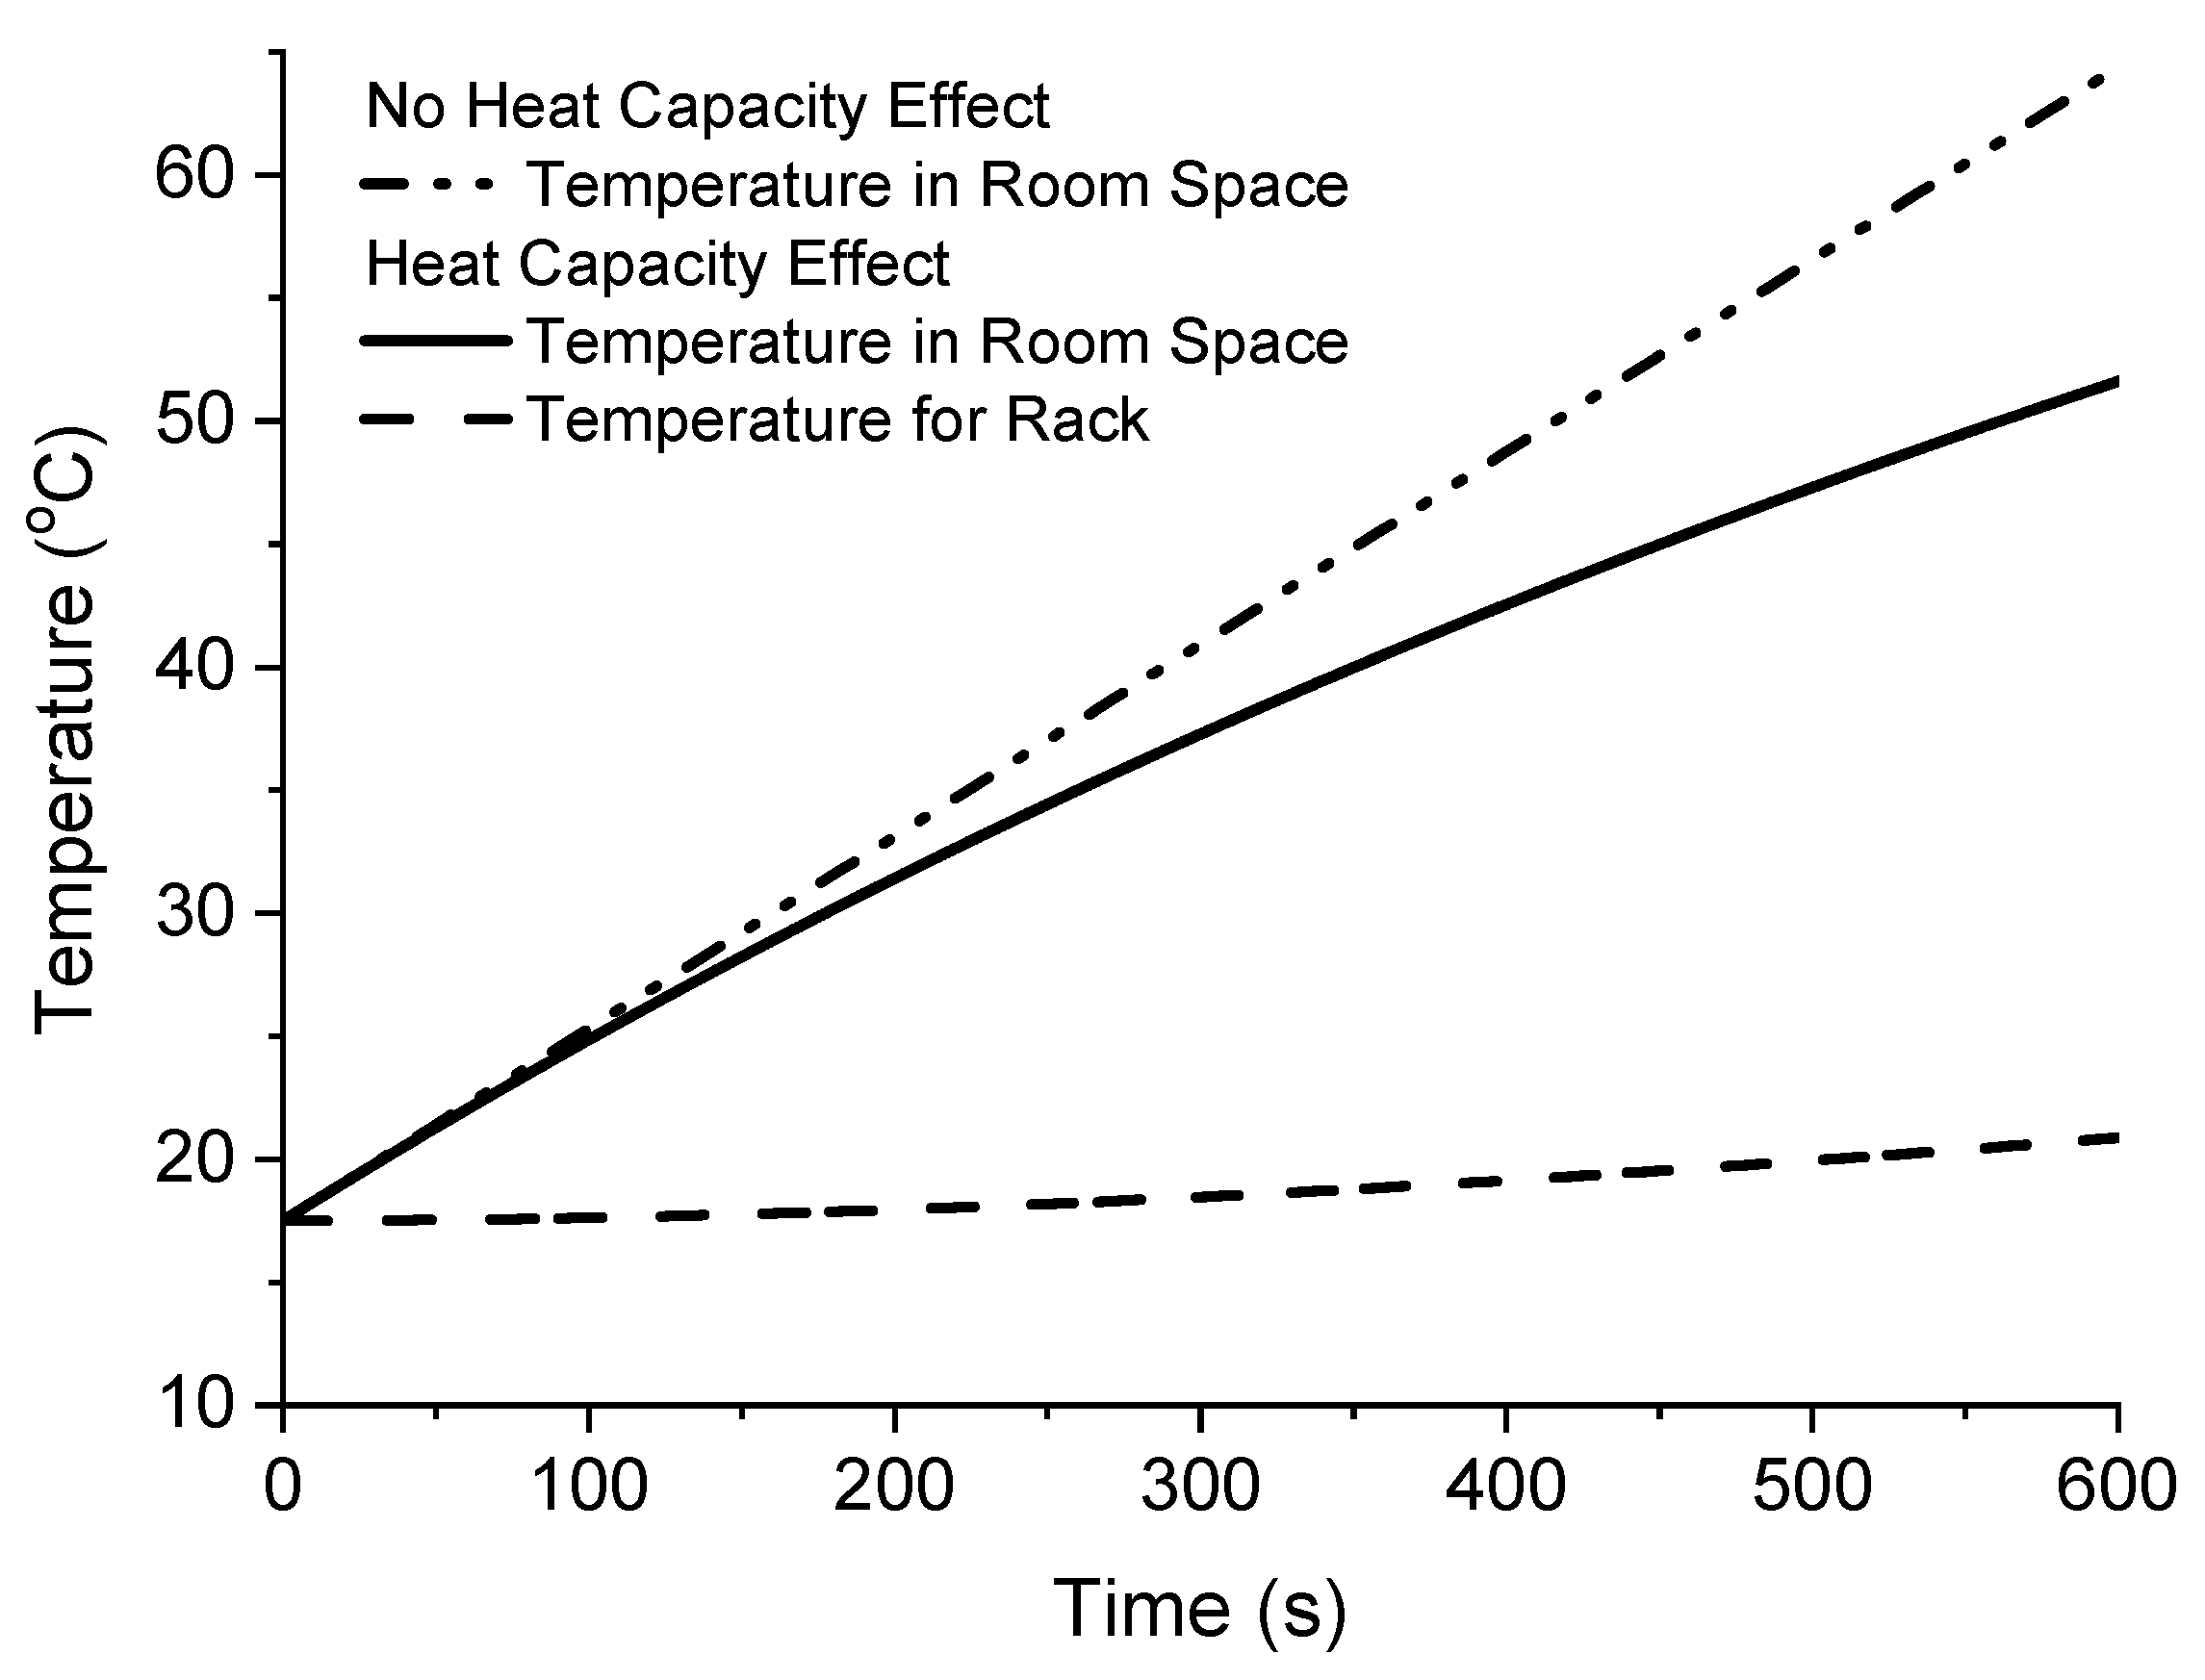
3.3. Transient Analysis

HVAC systems in the data center stop under a power outage scenario. The IT equipment in a data center tend to overheat and fail under high temperature conditions. Therefore, predicting the change in temperature in the data center room with respect to time is critical to maintain working IT equipment. The transient analysis in this section investigated the increase of temperature over a period of time under a power failure in the cooling infrastructure in the room while powering the IT serves. The analysis was performed using the simulation software 6Sigma room. To analyze the transient response of the room, temperature sensors were placed in the most critical locations in the room, the inlet and outlet of hot spot server in rack 4 and the empty space of the room. The cooling failure analysis was carried out on the baseline model, ECM# 1, ECM# 2.1, and ECM# 2.2 models.
Figure 6a shows the temperature profile with time of the hot spot server inlet and outlet temperatures and the empty space temperature in the room for the baseline model. From the cooling failure scenario for the baseline model, the server inlet temperature increased from 23.5 to 39.6 °C in 600 s. Even though the temperature starts to increase in almost a linear fashion, the increase is not rapid since the cool air moves from the empty room space. The cooling failure analysis simulation was performed on all the ECM models as shown in Figure 6b,c. In ECM #1 cooling failure scenario, the inlet temperature of the server increased from 35 to 47.5 °C in 600 s as shown in Figure 6b. In ECMs #2.1 and #2.2 cooling failure scenario, the server inlet temperature increased from 20.5 to 31.9 °C in 600 s as shown in Figure 6c. When the air conditioning unit fails scenario in ECM #2, the maximum inlet temperature of the server does not reach 40 °C, which is the maximum operating temperature of ASHRAE A3 envelope. However, the maximum server inlet temperature of ECM #1 cooling unit failure scenario increased to 47.5 °C, which means the ECM #2 (Cold and hot aisle containment) needs to be implemented to ECM #1 to prevent thermal damage of the servers in the cooling failure scenario.
Although the transient analysis predicted how the temperature will increase with respect to time under a power outage, it did not take into consideration the effects of thermal mass. A copious amount of the server racks in a data center room are enclosed by carbon steel, therefore it is necessary to analyze the thermal mass of the carbon steel enclosures during a power outage.
The volumetric thermal capacity of the mass was estimated to about 4000 kJ/ m 3 · K, which is equivalent to that of water. The study conducted investigated a hypothesis on the bases of that the total heat generated by servers during the off-cooling period is primarily dissipated to the surrounding air through active recirculation induced by the server fans. Furthermore, a percentage of the heat is dissipated into the surrounding by air through multiple flow pathways which include the masses of the enclosures and the cold air trapped under the raised floor which is dissipated to ambient air outside the building through the envelope infrastructure. Despite the fact that there are multiple air flow pathways that dissipates the total heat mass generated from a data center room, it was deemed appropriate to consider the pathways that are dominate, which are that of the racks and the surrounding air. According to Khankari [27], other pathways account for less than 4% of the total heat transfer to air and therefore can be neglected. Equations (3) and (4) displayed below represent a thermal model that is solved numerically which accounts for the effect of thermal mass.
Q = ( ρ V c p ) a i r d T a i r d t + ( ρ V c p ) R a c k d T R a c k d t
( ρ V c p ) R a c k d T R a c k d t = ( U A ) R a c k ( T R a c k T a i r )
where Q, V , cp, A , and U , are generated heat (W), volume (m3), specific heat (J/kg·K), surface area (m2), and overall heat transfer coefficient (W/m2·K), respectively. Moreover, the thermal models illustrated in Equations (3) and (4) computed the heat transfer as a function of time, therefore it is zero-dimensional and all spatial variations within the data center are negligible. In addition to that, both equations assume that the heat energy is transferred by convection and that the air is well mixed, hence single mixed temperature, which is appropriate considering that air is swiftly moved by the server fans. Furthermore, the surface of the racks poses high thermal conductivity compared to the heat transfer coefficient, therefore the heat transfer resistance was assumed to be small.
The servers were considered to be the main source of heat generation; hence, their thermal mass was not considered as it was dissipated and absorbed by the air inside the room. In addition to that, the rate of heat transfer from the servers to the ambient air in the room was considered to be constant with respect to time, therefore the associated rack heat transfer term in equation goes to zero and Equation (3) can be rewritten as displayed in Equation (5).
Q = ( ρ V c p ) a i r d T a i r d t
Further assumptions were considered to obtain an accurate graphical representation of the effects of thermal mass, for instance, a certain initial temperature was imposed as it was assumed that the ambient room air and the rack mass are in thermal equilibrium subsequently after the power outage, additionally the heat transfer that dissipated from other thermal masses in the room such as ducts, pipes and building infrastructure were neglected.
Displayed in Figure 7 is the graphical result obtained from the thermal mass model illustrated in Equation (5). The results of the analysis indicate that without the effect of thermal mass it took almost 275 s for the room to reach 40 °C in a linear fashion. However, with the effect of thermal considered it took 350 s to reach 40 °C, since the thermal mass absorbs the heat generated by the servers. The thermal mass delays the temperature rise by nearly 75 s. The effect of thermal mass is crucial under cooling system shut down conditions [27].

4. Conclusions

In the present study, simulation and experimental studies were conducted to analyze energy consumption and suggest ECMs in a research data center at Youngstown State University. Two ECMs were suggested to save energy consumption by optimizing the thermal performance of the data center. These were: (1) increase the return air temperature of the data center (25,053 kWh/yr); (2) provide cold aisle containment (34,164 kWh/yr) with the return air temperature increase.
A transient simulation analysis was conducted to predict the temperature variation over time under a cooling system failure for the baseline model. The results showed that it took 600 s to increase the sever inlet temperature by 16.1 °C for the baseline model under the blackout situation. When the air conditioning unit fails scenario in ECM #2, the maximum inlet temperature of the server is below 40 °C, which is the maximum operating temperature of ASHRAE A3 envelop, and the maximum server outlet temperatures are below 50 °C.
The transient analysis did not account for the effects of thermal mass due to the rack enclosures, therefore a thermal model was developed to compute the change in temperature with respect to time in the data center room. The results indicate that the thermal mass delays the increase in temperature by 75 s during a total power outage.
The specific energy management strategies of academic data centers have received little attention in the past. However, lately, as a result of budget shortages many universities have begun looking into their data centers for potential substantial annual energy savings. In many academic data centers on campus, there is 30% or more energy savings opportunities that have yet to be carefully studied. More than 40% of the power consumption in a data center goes to cooling of the data center electronics in the server racks. Implementation of the suggested ECMs in the present study will improve the mission of the data center and/or the security and quality of the data. In addition, the cooling system failure analysis in the present study should be helpful for researchers and engineers in the design of data center cooling systems under the power outage scenario and for saving energy consumption of the data centers.

Author Contributions

Conceptualization, K.C.; methodology, K.C. and K.I.A.; software, K.C. and K.I.A.; validation, K.C., K.I.A., and A.G.; formal analysis, K.C. and K.I.A.; investigation, K.C. and K.I.A.; resources, K.C. and K.I.A.; data curation, K.C. and K.I.A.; writing—original draft preparation, K.C. and K.I.A.; writing—review and editing, K.C., K.I.A., and A.G.; visualization, K.C. and K.I.A.; supervision, K.C.; project administration, K.C.; funding acquisition, K.C. All authors have read and agreed to the published version of the manuscript.

Funding

This research was funded by Center of Excellence in Youngstown State University.

Institutional Review Board Statement

Not applicable.

Informed Consent Statement

Not applicable.

Data Availability Statement

Data is contained within the article.

Acknowledgments

Authors’ thanks to Feng Yu in Computer Science Department at Youngstown State University for his support in measuring thermal and fluid flow conditions of the data center.

Conflicts of Interest

The authors declare no conflict of interest.

Nomenclature

m ˙ Mass flow rate [kg/s]
T Temperature [°C]
tTime [s]
cpSpecific heat [J/kg·K]
QGenerated heat [W]
( ρ V c p ) a i r Heat capacity of room air (J/K)
( ρ V c p ) R a c k Heat capacity of rack mass (J/K)
( U A ) R a c k Thermal conductance between room air and rack thermal mass (W/K)

References

  1. Koomey, J.G. Growth in Data Center Electricity Use 2005 to 2010; Analytics Press: Oakland, CA, USA, 2011. [Google Scholar]
  2. Schlichting, A.D. Data Center Energy Efficiency—Technologies and Methodologies; The MITRE Corporation: McLean, VA, USA, 2016. [Google Scholar]
  3. Laganà, D.; Mastroianni, C.; Meo, M.; Renga, D. Reducing the Operational Cost of Cloud Data Centers through Renewable Energy. Algorithms 2018, 11, 145. [Google Scholar] [CrossRef] [Green Version]
  4. Andrae, A. Total Consumer Power Consumption Forecast. In Proceedings of the Nordic Digital Business Summit, Helsinki, Finland, 5 October 2017. [Google Scholar]
  5. Bruschi, J.; Rumsey, P.; Anliker, R.; Chu, L.; Gregson, S. Best practices guide for energy-efficient data center design. Natl. Renew. Energy Lab. 2011, 1–28. [Google Scholar] [CrossRef] [Green Version]
  6. Lia, J.; Jurasza, J.; Li, H.; Tao, W.Q.; Duan, Y.; Yan, J. A new indicator for a fair comparison on the energy performance of data centers. Appl. Energy 2020, 276, 115497. [Google Scholar] [CrossRef]
  7. Song, M.; Chen, K.; Wang, K. Numerical Study on the Optimized Control of CRACs in a Data Center Based on a Fast Temperature-Predicting Model. J. Energy Eng. 2017, 143–145. [Google Scholar] [CrossRef]
  8. Zhang, S.; Ma, G.; Zhou, F. Experimental Study on a Pump Driven Loop-Heat Pipe for Data Center Cooling. J. Energy Eng. 2015, 141. [Google Scholar] [CrossRef]
  9. Kahsay, M.T.; Bitsuamlak, G.; Tariku, F. Effect of localized exterior convective heat transfer on high-rise building energy consumption. Build. Simul. 2020, 13, 127–139. [Google Scholar] [CrossRef]
  10. Tian, H.; Liang, H.; Li, Z. A new mathematical model for multi-scale thermal management of data centers using entransy theory. Build. Simul. 2019, 12, 323–336. [Google Scholar] [CrossRef]
  11. Choo, K.; Galante, R.M.; Ohadi, M.M. Energy consumption analysis of a medium-size primary data center in an academic campus. Energy Build. 2014, 76, 414–421. [Google Scholar] [CrossRef]
  12. Phan, L.; Lin, C.-X. A multi-zone building energy simulation of a data center model with hot and cold aisles. Energy Build. 2014, 77, 364–376. [Google Scholar] [CrossRef]
  13. Cupertino, L.; Da Costa, G.; Oleksiak, A.; Piatek, W.; Pierson, J.-M.; Salom, J.; Siso, L.; Stolf, P.; Sun, H.; Zilio, T. Energy-Efficient, Thermal-Aware Modeling and Simulation of Datacenters: The CoolEmAll Approach and Evaluation Results. Ad. Hoc. Netw. 2015, 25, 535–553. [Google Scholar] [CrossRef] [Green Version]
  14. Fu, Y.; Zuo, W.; Wetter, M.; VanGlider, J.W.; Yang, P. Equation-based object-oriented modeling and simulation of data center cooling systems. Energy Build. 2019, 198, 503–519. [Google Scholar] [CrossRef] [Green Version]
  15. Dvorak, V.; Zavrel, V.; Galdiz, J.I.T.; Hensen, J.L.M. Simulation-based assessment of data center waste heat utilization using aquifer thermal energy storage of a university campus. Build. Simul. 2020, 13, 823–836. [Google Scholar] [CrossRef] [Green Version]
  16. High-Performance Computing Data Center Power Usage Effectiveness Webpage. Available online: https://www.nrel.gov/computational-science/measuring-efficiency-pue.html (accessed on 17 March 2021).
  17. Green, M.; Karajgikar, S.; Vozza, P.; Gmitter, N.; Dyer, D. Achieving energy efficient data centers using cooling path management coupled with ASHRAE standards. In Proceedings of the 28th IEEE Semi thermal Symposium, San Jose, CA, USA, 18–22 March 2012; pp. 288–292. [Google Scholar]
  18. Siriwardana, J.; Halgamuge, S.K.; Scherer, T.; Schott, W. Minimizing the thermal impact of computing equipment upgrades in data centers. Energy Build. 2012, 50, 81–92. [Google Scholar] [CrossRef]
  19. Seymour, M.; Ikemoto, S. Design and management of data center effectiveness, risks and costs. In Proceedings of the 2012 28th Annual IEEE Semiconductor Thermal Measurement and Management Symposium (SEMI-THERM), San Jose, CA, USA, 18–22 March 2012; pp. 64–68. [Google Scholar]
  20. Ahuja, N. Datacenter power savings through high ambient datacenter operation: CFD modeling study. In Proceedings of the 2012 28th Annual IEEE Semiconductor Thermal Measurement and Management Symposium (SEMI-THERM), San Jose, CA, USA, 18–22 March 2012; pp. 104–107. [Google Scholar]
  21. Almoli, A.; Thompson, A.; Kapur, N.; Summers, J.; Thompson, H.; Hannah, G. Computational fluid dynamic investigation of liquid rack cooling in data centers. Appl. Energy 2012, 89, 150–155. [Google Scholar] [CrossRef]
  22. ASHRAE TC9.9 2011. Thermal Guidelines for Data Processing Environments—Expanded Data Center Classes and Usage Guidance. Available online: https://eehpcwg.llnl.gov/documents/infra/01_ashraewhitepaper-2011thermalguidelines.pdf (accessed on 11 November 2020).
  23. Miller, R. Google: Raise Your Data Center Temperature Data Center Knowledge. Available online: https://www.datacenterknowledge.com/archives/2008/10/14/google-raise-your-data-center-temperature (accessed on 11 November 2020).
  24. Ghahramani, A.; Zhang, K.; Dutta, K.; Yang, Z.; Becerik-Gerber, B. Energy savings from temperature setpoints and deadband: Quantifying the influence of building and system properties on savings. Appl. Energy 2016, 165, 930–942. [Google Scholar] [CrossRef] [Green Version]
  25. Hoyt, T.; Arens, E.; Zhang, H. Extending air temperature setpoints; simulated energy savings and design consideration for new and retrofit buildings. Build. Environ. 2015, 88, 89–96. [Google Scholar] [CrossRef] [Green Version]
  26. Fernandez, N.; Katipamula, S.; Wang, W.; Huang, Y.; Liu, G. Energy savings modeling of standard commercial building re-tuning measures; large office building. Pac. Northwest Natl. Lab. 2012, 1–94. [Google Scholar] [CrossRef] [Green Version]
  27. Khankari, K. Thermal Mass Availability for Cooling Data Centers during Power Shutdown. ASHRAE Trans. 2010, 116, 205–218. [Google Scholar]
Figure 1. Baseline model of the data center room (a) isometric view (b) top view.
Energies 14 02820 g001
Figure 2. Baseline model temperature distribution: (a) isometric view; (b) server rack inlet.
Energies 14 02820 g002
Figure 3. Sever inlet conditions in the ASHRAE guideline [22].
Energies 14 02820 g003
Figure 4. Temperature distribution: (a) ECM #2.1; (b) ECM #2.2.
Energies 14 02820 g004
Figure 5. Sever inlet conditions in the ASHRAE guideline for ECMs #2.1 and #2.2 [22].
Energies 14 02820 g005
Figure 6. Failure analysis: (a) baseline model; (b) ECM #1; (c) ECMs #2.1 and #2.2.
Energies 14 02820 g006
Figure 7. Variation of room air and rack temperatures over time.
Energies 14 02820 g007
Publisher’s Note: MDPI stays neutral with regard to jurisdictional claims in published maps and institutional affiliations.

