Article

A Solution to the Problem of Electrical Load Shedding Using Hybrid PV/Battery/Grid-Connected System: The Case of Households’ Energy Supply of the Northern Part of Cameroon

by
Ruben Zieba Falama
1,2,*,
Felix Ngangoum Welaji
2,
Abdouramani Dadjé
3,
Virgil Dumbrava
4,*,
Noël Djongyang
5,
Chokri Ben Salah
6 and
Serge Yamigno Doka
7
1
Faculty of Mines and Petroleum Industries, University of Maroua, Maroua P.O. Box 46, Cameroon
2
Laboratory of Energy Research, Institute for Geological and Mining Research, Yaoundé P.O. Box 4110, Cameroon
3
School of Geology and Mining Engineering, University of Ngaoundéré, Ngaoundéré P.O. Box 454, Cameroon
4
Department of Power Systems, Faculty of Power Engineering, University POLITEHNICA of Bucharest, Splaiul Independentei, no 313, District 6, 060042 Bucharest, Romania
5
Department of Renewable Energy, National Advanced Polytechnic School, University of Maroua, Maroua P.O. Box 46, Cameroon
6
LASEE Laboratory, ISSAT of Sousse, Department of Electrical Engineering, University of Sousse, ENIM, Monastir, Tunisia
7
Faculty of Sciences, University of Ngaoundéré, Ngaoundéré P.O. Box 454, Cameroon
*
Authors to whom correspondence should be addressed.
Energies 2021, 14(10), 2836; https://doi.org/10.3390/en14102836
Submission received: 19 April 2021 / Revised: 6 May 2021 / Accepted: 11 May 2021 / Published: 14 May 2021

Abstract

:
A techno-economic study of a hybrid PV/Battery/Grid-connected system for energy supply is carried out in this paper to respond to the problem of electrical load shedding. An optimal design of the system is realized thanks to a double-objective optimization based on a proposed operational strategy of the system and on Firefly Algorithm (FA). The system is designed for household energy supply in three different towns of the northern part of Cameroon. For different LPSP (Loss of Power Supply Probability), the double objective simulation determines the optimal configurations of the system with their related cost. The optimal and reliable PV/Battery subsystem configuration corresponding to LPSP of 0% obtained for one household is composed for the towns of Maroua and Garoua by 8 PV modules and a battery capacity of 11.304 kWh with 1-day autonomy. For the town of Ngaoundéré, it is composed by 10 PV modules and battery capacity of 11.304 kWh with 1-day autonomy. The related investment costs corresponding to these optimal configurations are USD 6225.6 for Maroua and Garoua and USD 7136.6 for Ngaoundéré. The great proportion of the monthly energy demand consumed by the load is provided by the PV/Battery system. The monthly PV/Battery energy represents 60.385% to 72.546% of the load consumed in Maroua, 58.371% to 71.855% of the load consumed in Garoua, and 61.233% to 74.160% of the load consumed in Ngaoundéré. The annual main grid energy consumed for one household is 1299.524 kWh in Maroua, 1352.818 kWh in Garoua, and 1260.876 kWh in Ngaoundéré. Moreover, the annual PV/Battery energy consumed for one household is 1580.730 kWh in Maroua, 1527.815 kWh in Garoua, and 1619.530 kWh in Ngaoundéré. Thus, the PV/Battery system, by reducing the grid energy consumption, acts as the principal source of energy of the whole system. The time the PV/Battery/Grid-connected system needs to be economically more advantageous than the electric grid without blackouts is 17 years for Maroua and 18 years for both Garoua and Ngaoundéré. It is demonstrated in this paper that the hybrid PV/Battery/Grid-connected system is an effective solution for electrical load shedding in sub-Saharan zones. This system is very useful for grid energy consumption reduction. For a long-term investment, the PV/Battery/Grid-connected system is more economically advantageous than the main grid alone.

1. Introduction

The problem of the availability of electrical energy still remains a very serious problem in developing countries. Since electricity is at the center of development, it is very difficult for these countries to take off amid this deficit. The situation is even more serious in the countries of sub-Saharan Africa, where poverty is often accentuated because of the lack of electrical energy. According to forecasts by the World Bank, 650 million people will still lack access to electricity in 2030, and nine out of 10 of those people will be in sub-Saharan Africa [1]. Electricity is involved in almost all aspects of daily life. Electricity is needed for heating, for cooking, for transport, for telecommunications, for lighting, to power machines in industries, etc. To summarize, electricity is essential for the socio-economic development of a country, and it improves the living conditions of populations.
It is true that some countries in sub-Saharan Africa have made great progress related to urban and rural electrification. However, these countries face the problem of electrical load shedding (electricity interruption) due to natural phenomena, to forecast failure, or to the aging of the facilities that have lost their performance, thus influencing electricity production. By mentioning natural phenomena as the cause of electrical load shedding, one refers to a lack of natural resources that play a determining role in the process of producing electrical energy such as water, wind, sun, etc. Failure forecasting is the lack of planning electricity production according to future needs because the population is expected to grow. If this detail is not initially taken into account, then the installed power supply system will be unable to meet the load demand after some time, resulting in network disturbances and frequent electricity interruption.
Cameroon, a country of sub-Saharan Africa, has shown significant progress concerning electrification in recent years. However, since 2020, the northern part of Cameroon has faced a real problem of electrical load shedding due to a hydrological deficit. A weekly program of daily access to electricity is broadcast on social media every weekend by the national electricity distribution company. This partial daily availability of electricity is not without consequences for the socio-economic life of this part of the country. Nighttime, with no electricity available, are favorable for thefts and assaults. Some factories are shut down or are operating part time. Keeping food in the refrigerator is no longer an absolute guarantee. Small and large-scale economic activities are often at a standstill at times when there is no electricity. Many households use a diesel generator (DG) for electricity supply at the time when the grid connection is interrupted. Note, however, that the use of DGs is very polluting.
Previous studies have been carried out to improve the availability of electrical energy in some localities facing the issues of electrical load shedding or electrical blackouts based on a proper load shedding scheduling program [2,3,4,5,6,7]. Syadly et al. [2] have proposed an improved load shedding scheduling strategy to tackle the problem of power outages occurring in the locality of Sumatra. The proposed strategy is based on the Round Robin method. They have shown in their work that a proper scheduling program could overcome the energy deficit problem. Hirodontis et al. [3] studied the load shedding in a distribution network. Based on Swing equation (for the evaluation of the magnitude of the disturbance) and on dynamic simulation using PSCAD (Power System Analysis Package), they have demonstrated the improvement of the stability and the reliability of the distribution network submitted to load shedding. Faranda et al. [4] developed a new load shedding control strategy called “distributed interruptible load shedding”. This approach for load shedding programs is a powerful tool to ensure improvement of the energy supply’s reliability.
Smart grids based on hybrid systems also appear as a promising concept for electrical blackout problems [8,9,10,11,12,13,14,15,16,17,18,19,20,21,22]. Mansour et al. [9] developed an optimal operation of hybrid PV-battery system considering grid scheduled blackouts and battery lifetime. The PV-battery system is considered to replace the grid during blackouts periods. By applying an economic model predictive control (EMPC) to optimize the operation of the system, the obtained results have shown that the proposed method leads to the reduction in the grid energy consumption, the decrease in the PV generated power, and the maximization of the battery lifetime. Bastholm and Fiedler [10] performed a techno-economic study of a PV-diesel hybrid system connected to the national power grid of Tanzania subject to frequent blackouts. The aim of their work was to study the impact of the blackouts on the viability of the system. The obtained results based on simulation in HOMER (a software now produced by UL in USA) have demonstrated that the PV-diesel hybrid system connected to the grid with blackouts is economically more important than the grid without blackouts. Alibakhsh et al. [11] studied the feasibility of a hybrid photovoltaic/diesel/biogas to meet the energy demand of a grid-connected village located in the east of Iran. An optimal design and technical analysis of the system has been realized under different economic conditions using HOMER software. The obtained results showed that the proposed hybrid system is reliable and economically feasible at a low cost. Samy et al. [12] proposed a hybrid PV-wind-fuel cell system as a backup system to replace the grid during blackout periods in Hurghada, Egypt. An optimal economic study of the proposed system is realized using hybrid search optimization technique. Simulation results have shown that the proposed system is economically viable and more cost-effective than electricity from the grid for commercial users in Egypt. Murphy et al. [13] proposed a hybrid solar/diesel system connected to an unreliable electric grid to provide more reliable electricity in a village in Uganda. Thanks to HOMER simulation software and a developed method, the optimal system configurations and the electricity costs for reliable power generation were determined. Simulation results showed that diesel is the most economical choice for a backup system, yet hybrid solar/diesel is the most reliable backup system and could be economically competitive with diesel backup systems in the long-term. Ali Saleh Aziz et al. [14] studied the feasibility of grid-connected and islanded operation of a solar PV micro-grid system in Iraq. The analysis of the system is based on HOMER software using five different control strategies. The obtained results showed that the hybrid PV grid-connected system can provide clean, economical, and continuous electricity production in countries with daily blackouts. Adefarati and Bansal [15] studied the impacts of a PV/wind/diesel/electric storage hybrid system on the reliability of a power system. A modified Roy Billinton test system (RBTS) distribution network was used to perform this study. It was demonstrated that the proposed hybrid system could increase the reliability of the system and reduce the power outages associated with the distribution network. An optimal operation strategy of a hybrid PV-battery system under grid scheduled blackouts was performed by Mansour et al. [23]. The city of Gaza in Palestine was considered for a real case study. The optimization is based on multi-objective genetic algorithm. The obtained results demonstrated the reliability and the cost-effectiveness of the system based on the proposed optimization model.
Based on previous studies, it can be determined that the connection of the hybrid system on the grid is a reliable and cost-effective solution for electrical blackout problems. A proper scheduling program for electrical load shedding could also improve the availability of the main grid energy. The present work has the particularity to combine both hybrid national grid-connected system and a variable load shedding scheduling program to overcome the problem of power outages occurring in the locality of northern Cameroon. Because of the great solar potential in this part of the country, the use of a photovoltaic solar energy system, which is pollution-free, could be a promising alternative solution. The proposed PV/Battery system is used to supply the load not only during blackout periods but also when the grid energy is available. This proposed strategy could allow the reduction in the grid energy consumption and thus the reduction in the energy cost of the system. After presenting the real situation that prevails in this part of Cameroon, a techno-economic study is carried out on the proposed power supply system based on a multi-objective firefly optimization. Several possible scenarios could be envisaged to efficiently meet the electrical demand of households.

2. Presentation of the Current Energy Situation

2.1. Presentation of the Study Area

Cameroon is a country of Central Africa located at the bottom of the Gulf of Guinea, between the 2nd and 13th degrees of north latitude and the 9th and 16th degrees of east longitude. Initially, when the electrical energy production equipment installed in Cameroon were new, the gross production and the consumption were equivalent. However, few years later, a gap was created between production and consumption. Today, this gap has widened considerably due to the failure and aging of the electricity production, transmission, and distribution equipment. Electricity losses have increased, so that households’ and companies’ electricity demand, which is growing continuously, is not satisfied. Indeed, the country’s hydrological resources are amongst the most important in sub-Saharan Africa. Hydroelectricity represents around 77% of the installed capacity [24], but the recent drop in water levels of major dams has lowered this production capacity. As a result, the electricity power supplied remains far below the demand.
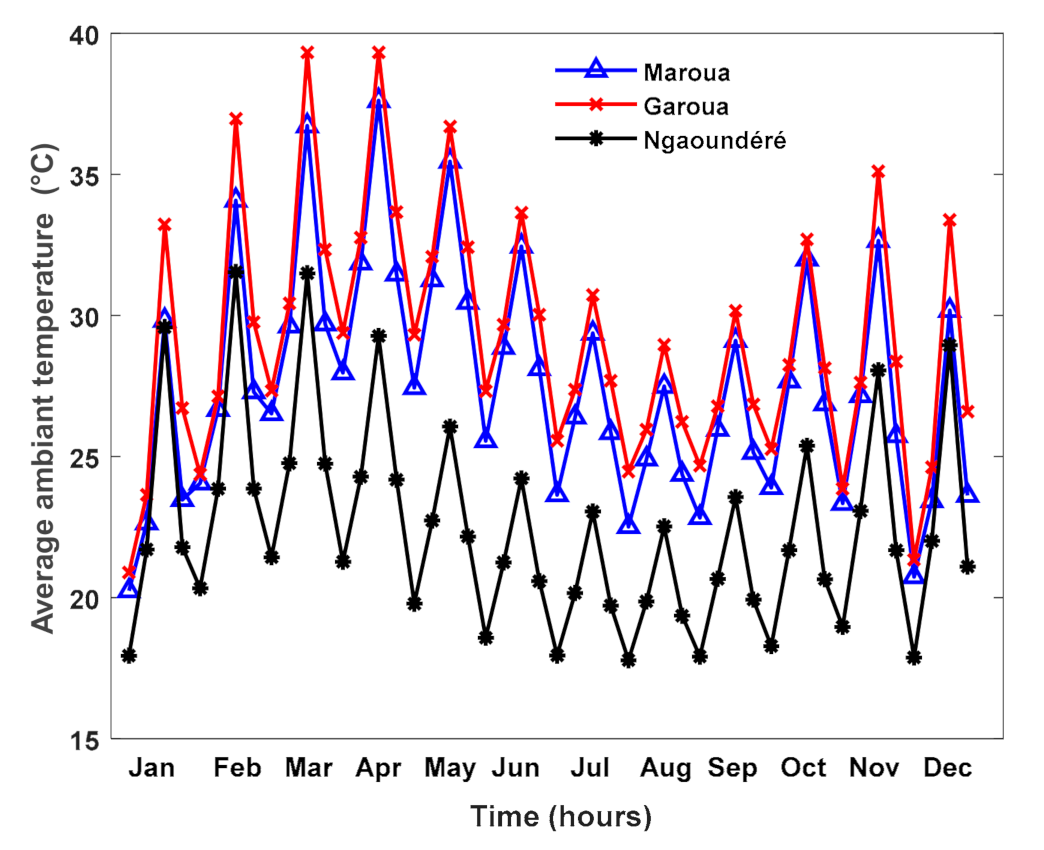
Cameroon’s natural environment is diverse. It is made up of different natural areas including the northern Sudano-Sahelian part, which is an area of savannas and steppes. Most of this area is characterized by a hot and dry tropical climate with increasingly limited rainfall the closer you get to Lake Chad. The geographical location of the northern part of Cameroon chosen as the study area is presented in Figure 1. The irradiance and ambient temperature data for the three cities that make up this part of Cameroon (Maroua, Garoua, and Ngaoundéré) are presented in Figure 2 and Figure 3 [25].

2.2. Current Energy Situation in the Study Area

The northern part of Cameroon is mainly supplied by the Lagdo hydroelectric dam with a total capacity of 72 MW. However, the current production at this plant is estimated at less than 25 MW. Indeed, in October 2019, the volume of water in the Lagdo dam was estimated at 4444 million m3 of water against 1970 million m3 of water in October 2020, representing a deficit of 2470 million m3 of water. Even with the contribution of very expensive—and also very polluting—thermal power plants, the maximum production in this part of Cameroon (less than 45 MW) is not able to meet the electrical demand of the population, estimated to be more than 7,636,555 inhabitants [26]. The current rate of access to electricity is 11.8% for the city of Maroua, 16.6% for the city of Garoua, and 25.5% for the city of Ngaoundéré. While this situation could improve depending on the rainfall recorded, the current energy situation in this part of Cameroon remains a very serious problem for which sustainable solutions must be found independently of rainfall.

3. Methodology

3.1. System Modeling

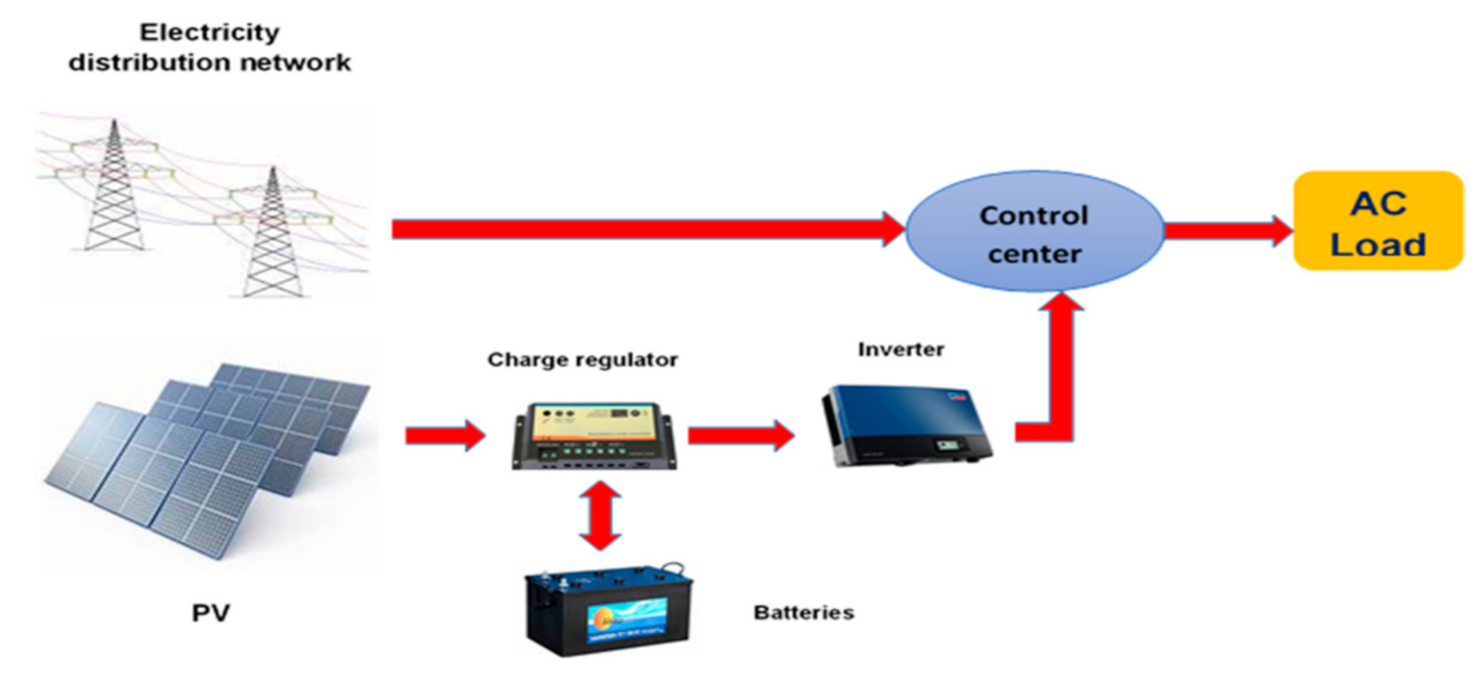
A hybrid system is proposed to solve the load shedding problem encountered in the study site. This hybrid system includes two sources of electrical energy supply (energy from the national interconnection grid and the energy produced by the PV system) for the case of a household whose daily demand is presented in Table 1. A schematic representation of the studied system configuration is given in Figure 4.

3.1.1. PV Output Model

The PV output is calculated by the equation:
E p v , o u t = N p v · E P v , r e f · G G r e f · 1 α T c T c , r e f
where Epv,ref, is the energy of the PV generator corresponding to the standard test conditions.
T c = T a + N O C T 20 800 · G
The total PV electrical energy to supply to the load is given by:
E p v = E p v , o u t · η i n v · η r e g u l

3.1.2. Battery Storage Equation Model

The role of batteries is to store the energy produced by the PV generator and to restore this energy when the energy directly supplied by the PV generator is unable to meet the load demand. The storage capacity of batteries is a function of the energy required by the load. Depending on the load and the type of battery used, a photovoltaic installation may require one or more batteries. In a PV installation, the batteries are arranged in series and/or in parallel.
The storage capacity of the batteries can be determined from the following relationship:
C b a t _ m a x W h = N a d d a y s × M a x i m u m   d a i l y   l o a d   e n e r g y   W h D O D × η b a t t , c × η i n v × η r e g u l
or
C b a t _ m a x A h = C b a t _ m a x   W h U n
In the above equations, Nad is the autonomy days of the batteries and Un is the input/output voltage of the battery bank.

3.1.3. The Main Grid Energy Supply Modeling

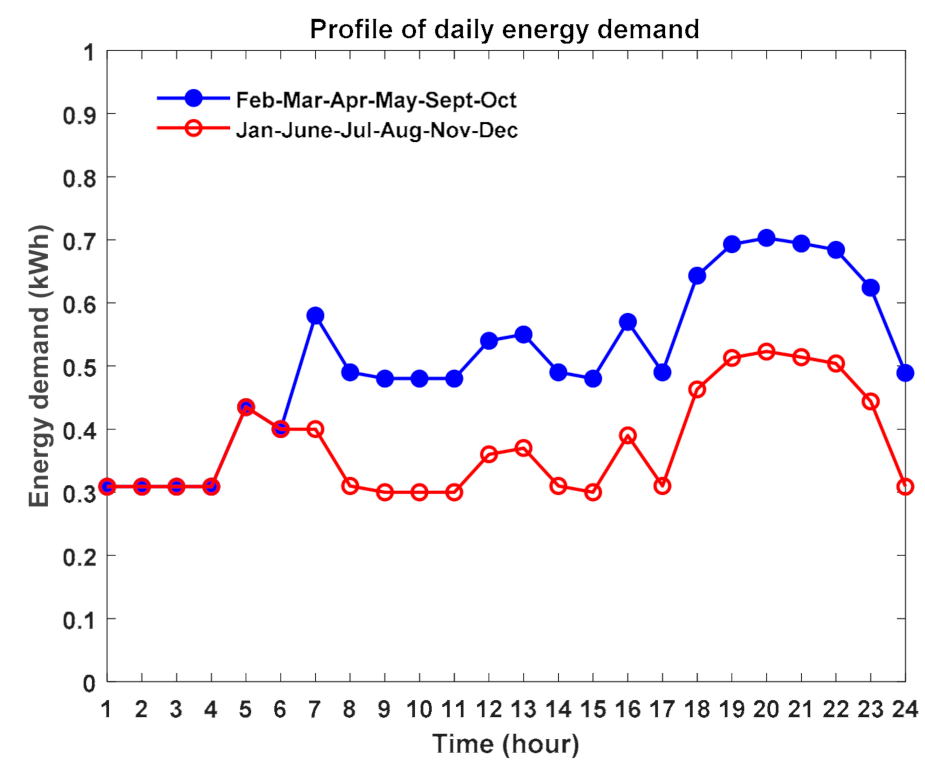
The daily electrical energy demand of one household presented in Table 1 depends on the time of the year because some devices such as ceiling fans will not be used when the weather is cold. Figure 5 presents the profile of the daily energy demand of one household depending on the month of the year. Indeed, for an optimal sizing of the system, the present study considers a variable load influenced by the weather conditions. For the periods of the year spanning from February to May and from September to October, the weather is hot and the use of a ceiling fan is necessary. Conversely, for the periods of the year spanning from June to August and from November to January, the weather is cold and there is no need to use a ceiling fan. The use of the ceiling fan increases the load demand.
In some localities facing the problem of electrical load shedding, there is access programming to the local main grid energy. This program can be daily, weekly, bi-weekly, or even monthly. The objective is to define an automatic programming algorithm for the rotary distribution of energy from the main grid in the case of load shedding over a period of one year. The simulation of the entire electricity production and supply system will be carried out taking into account this annual programming of access to the local energy distribution network.
The electrical energy supplied by the grid is a function of the period of the year since the energy demanded by the load as modeled in this work depends on the month of the year (see Table 1).
In the northern part of Cameroon, over a day of 24 h, the main grid is connected for 6 h (grid energy supply is available) and consecutively disconnected for 6 h (grid energy supply is not available). Thus, to facilitate the simulation of the system, the daily energy demand could be simply defined per time interval of 6 h, as presented in Table 2. Two types of scenarios reflecting the behavior of the connection to the main grid are observed in this part of Cameroon. The two types of scenario occur successively after a duration of 1 week. These two types of scenarios are presented in Table 3. Since the electrical energy demand is not the same over the span of a 24 h day, the main grid energy to supply to the load will depend on the time slots, as defined in Table 3, and therefore it will vary from week to week.
Let us consider k as the number of the months of the year.
When k = 1, 6, 7, 8, 11, 12, the energy demand could be defined as:
D k = x 1 x 2 x 3 x 4
When k = 2, 3, 4, 5, 9, 10, the energy demand could be defined as
D k = x 1 x 2 x 3 x 4
where x 1 ,   x 2 ,   x 3 ,   x 4 , x 1 ,   x 2 ,   x 3 ,   and   x 4 are the energy demands corresponding to each time interval of 6 h over the day.
For two different scenarios of the daily main grid energy supply varying after x number of days over one year, the daily grid energy supply could be defined as follows.
When k = 1, 6, 7, 8, 11, 12:
D 1 , k = x 1 0 x 3 0 D 2 , k = 0 x 2 0 x 4
When k = 2, 3, 4, 5, 9, 10:
D 1 , k = x 1 0 x 3 0 D 2 , k = 0 x 2 0 x 4
D1,k and D2,k represent the daily main grid energy supply of the month k corresponding to the two different scenarios.
The grid energy supply corresponding to the month k for the combined two types of scenarios each lasting x days could be defined as:
ε k = E 1 , k E 2 , k
where
E 1 , k = r e p m a t D 1 , k , 1 , x
and
E 2 , k = r e p m a t D 2 , k , 1 , x
The monthly grid energy supply is defined as:
E k = X 1 X 2 X 3 X 4
where
X 1 = r e p m a t D 2 , k , 1 , x w k 1
X 2 = r e p m a t ε k , 1 , m k  
X 3 = r e p m a t D 1 , k , 1 , z k  
X 4 = r e p m a t D 2 , k , 1 , w k  
z k + w k = N k x 2 m k + 1 + w k 1
In the above equations, wk, mk, and zk are constants to be determined, Nk is the number of the days corresponding to the month k, and repmat is a MATLAB (a software produced by Mathworks in USA) function which repeats copies of array.
In Equation (18), if z k + w k x , then:
z k = N k x 2 m k + 1 + w k 1 w k = 0
If z k + w k < x , then:
z k = x w k = N k 2 x m k + 1 + w k 1
mk is the integer part of the real N k x + w k 1 / 2 x .
The annual grid energy supply is given by the array:
E g r i d _ a n n u a l = E 1 E 2 E 3 E 4 E 5 E 6 E 7 E 8 E 9 E 10 E 11 E 12
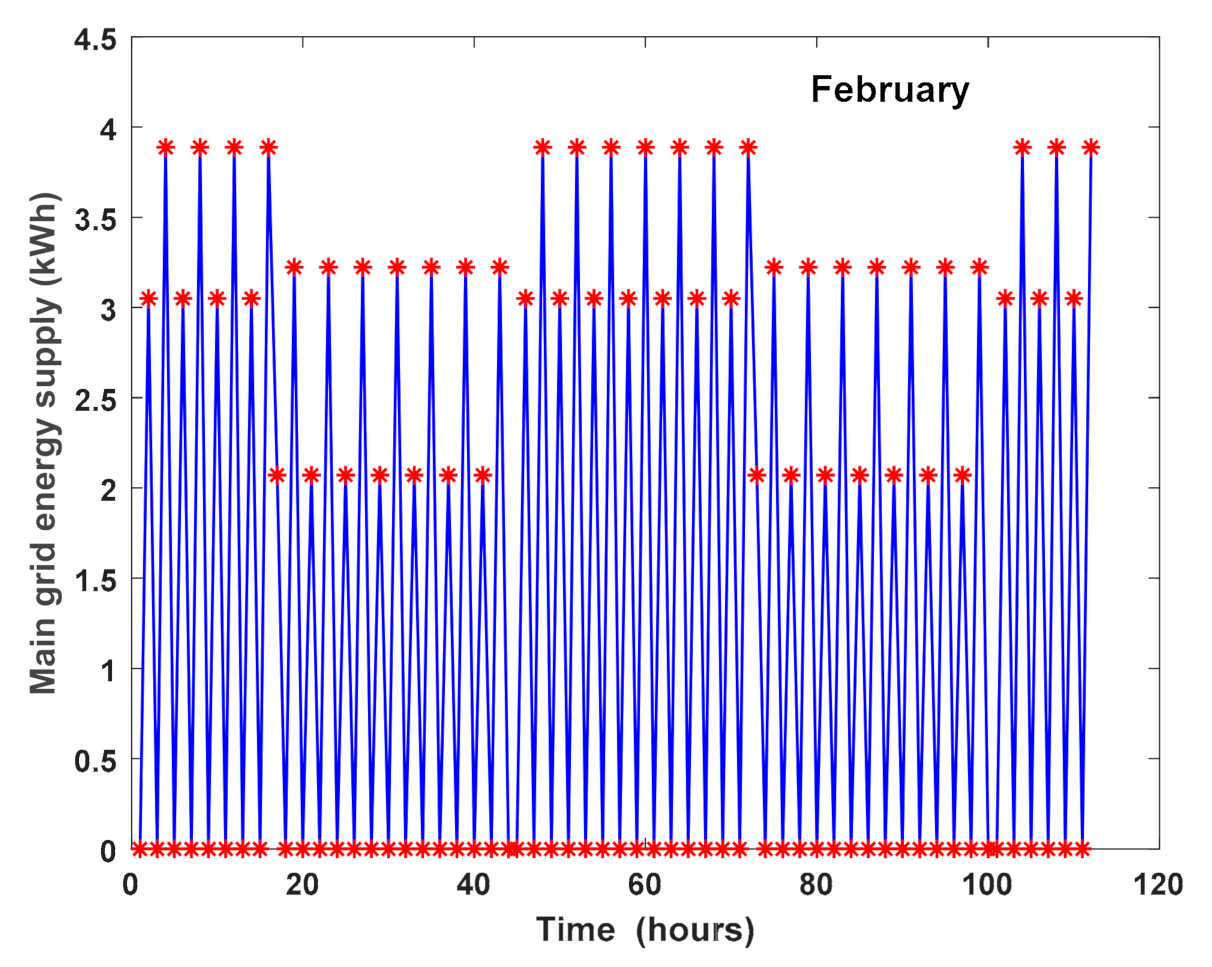
Figure 6 and Figure 7 present the daily distribution of the main grid energy supply for the months of January and February, respectively, corresponding to two interchangeable scenarios after a duration of 1 week. For the month of January (corresponding to k = 1), the first scenario is defined by x1 = 0, x2 = 1.970, x3 = 0, x4 = 2.807; the second scenario is defined by x1 = 2.071, x2 = 0, x3 = 2.143, x4 = 0. For the month of February (corresponding to k = 2), the first scenario is defined by x’1 = 0, x’2 = 3.050, x’3 = 0, x’4 = 3.887; the second scenario is defined by x’1 = 2.071, x’2 = 0, x’3 = 3.223, x’4 = 0. The stars in red color correspond to each 6 h time interval and reflect either the availability of energy or the electrical load shedding (blackouts).

3.2. System Sizing and Optimization

The Objective Functions

This study is based on a multi-objective optimization to determine the optimal key parameters of the system while minimizing the cost and ensuring an efficient satisfaction of the load energy required. Multi-objective optimization appears as a powerful tool for the optimal sizing of stand-alone PV and hybrid systems [27,28,29,30,31,32,33,34,35]. Recently, the multi-objective optimization using evolutionary algorithms has emerged as a promising optimization technique for energy systems [28,29,30,31,32,33,34,35,36]. The most used evolutionary algorithms for energy systems optimization are genetic algorithm and particle swarm optimization methods [28]. However, because of its good and rapid convergence to the solution, this study focused on a multi-objective optimization based on a firefly algorithm [37,38,39,40]. The flowchart of the firefly algorithm is presented in Figure 8. The algorithm is used to minimize two objective functions. The first objective function defined by Equation (22) is based on the net present cost (NPC) of the energy system, including the initial costs, the installation costs, the operation and maintenance costs, and the replacement costs of the system components. It is given by:
f i t n e s s 1 = N P C U S D = C o s t P V + C o s t b a t t e r i e s + C o s t i n v e r t e r + C o s t r e g u l a t o r
The second objective function is used to evaluate the system reliability based on the loss of power supply probability (LPSP) index. In the case of this study, this index is defined by:
f i t n e s s 2 = L P S P % = t = 1 365 h o u r s E s u p p l y Δ t < E d Δ t 365
Table 4 presents the details concerning the cost and the lifetime of the key components of the studied system used for simulation and matching with the Cameroonian market. These costs include the initial and installation costs. The operation and maintenance for PV module are negligible. For some batteries such as gel batteries, the operation and maintenance costs are also negligible.

3.3. Operational Strategy

The primary objective is to use the PV/Battery sub-system to cover the hours of electrical load shedding. However, since these load shedding times are not fixed, we often end up with an overproduction of PV energy. In order to use the most of the available PV energy and thus reduce the cost of consumption of grid energy, in the defined operational strategy, the main grid is sometimes used as a “backup” system. This means that the main grid is requested only when the energy of the PV/Battery subsystem is unable to meet the energy demand.
The operational strategy is described as follows:
1.
When the grid connection is on, the grid energy supplies the load and the PV energy system charges the batteries. In this case, the energy charge of batteries and the grid energy supplied at the time interval Δt are given, respectively, by:
E b a t _ c Δ t = E p v Δ t · η b a t _ c η i n v · η r e g u l
and
E G Δ t = E d Δ t
The capacity and the state of charge (SOC) of the batteries at the time interval Δt are given, respectively, by:
C b a t Δ t + 1 = C b a t Δ t + E b a t _ c Δ t
and
S O C Δ t = C b a t Δ t C b a t _ m a x
However, if the PV energy is greater than the maximum allowable battery energy charge (Cbat_maxCbattt)), then the energy charge of the batteries is:
E b a t _ c Δ t = C b a t _ m a x C b a t Δ t · η b a t _ c η i n v . η r e g u l
When the batteries are fully charged (SOCt) ≥ 1), the excess energy of the PV system is used to supply the load.
If this excess PV energy is greater than or equal to the energy demand, then the grid energy supplied is zero because the total energy demand is satisfied by the PV energy system;
Whereas, if the excess PV energy is less than the energy demand, the grid energy supplied is the difference between the energy demand and the PV excess energy:
E G Δ t = E d Δ t E p v Δ t
2.
When the main grid is off, the total energy demand is supplied by the PV system.
If the PV energy is greater than or equal to the energy demand, the surplus PV energy charges the batteries. The energy charge of the batteries at the time interval Δt is then given by:
E b a t _ c Δ t = E p v Δ t E d Δ t · η b a t _ c η i n v . η r e g u l
If the PV surplus energy is greater than the maximum allowable battery energy charge, then refer to Equation (26) for the battery energy charge equation.
If the PV energy is less than the energy demand, the energy deficit is provided by the batteries:
  • If the state of charge of the batteries is less than or equal to the minimum permissible state (0.2Cbat_max), the energy discharge of the batteries is zero;
  • If the state of charge of the batteries is greater than the minimum permissible state and if the maximum dischargeable battery energy at the time interval Δt (Cbatt) − 0.2Cbat_max) is greater than the energy deficit, then the energy supplied by the batteries and the capacity of the batteries at the time t are given by Equations (29) and (30), respectively.
    E b a t _ d i s c h Δ t = E d Δ t E p v Δ t
    C b a t Δ t + 1 = C b a t Δ t E d Δ t E p v Δ t η i n v . η r e g u l . 1 η b a t _ d i s c h
  • If the state of charge of the batteries is greater than the minimum permissible state, and if the maximum dischargeable battery energy at the time interval Δt is less than the energy deficit, then the energy supplied by the batteries and the capacity of the batteries at the time interval Δt are given by Equations (31) and (32), respectively.
    E b a t _ d i s c h Δ t = C b a t Δ t 0.2 C b a t _ m a x · η b a t _ d i s c h · η i n v
    C b a t Δ t + 1 = C b a t Δ t C b a t Δ t 0.2 C b a t _ m a x

4. Results and Discussion

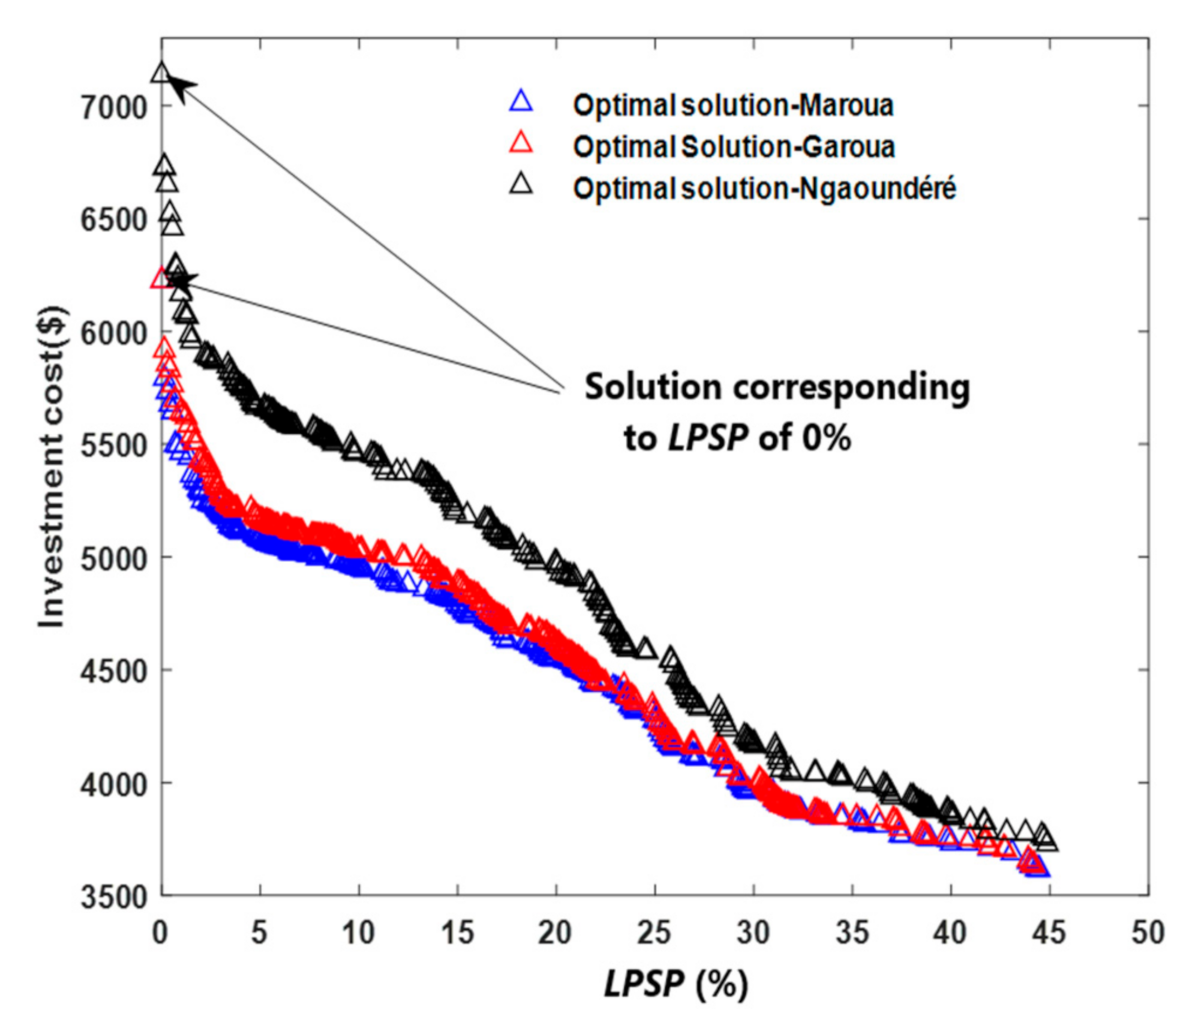
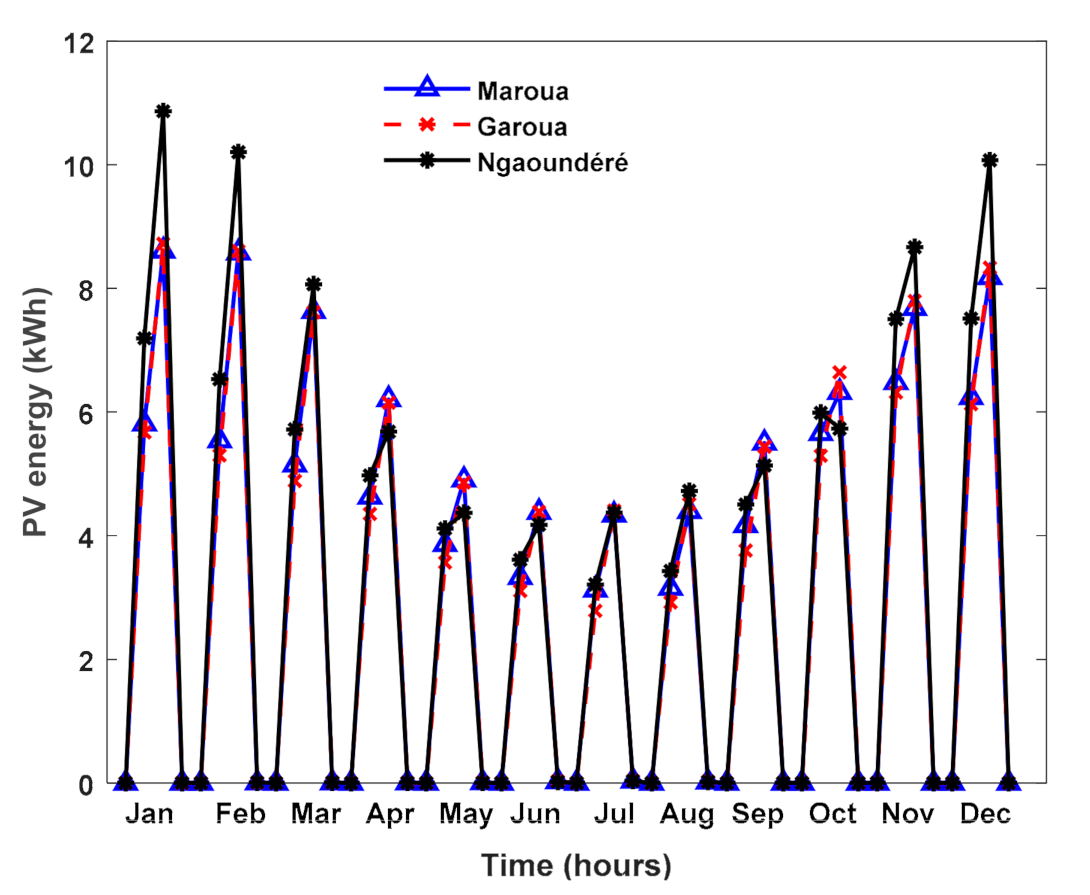
The hybrid PV/Battery/Grid-connected system considered in this study, taking into account the electrical load shedding, was simulated for three different cities in the northern part of Cameroon. Two different electrical load shedding configurations were taken into account and interchanged after a period of 7 days (1 week), as shown in Table 2. Each day (lasting 24 h) is divided into 4 time slots of 6 h each. These time slots define the periods of availability and non-availability of electrical currents. Indeed, for a 24 h day, electrical energy is available every 6 h of elapsed time, followed by 6 h of electrical blackouts. Each 6 h of unavailability of electrical energy is covered either directly by the PV generator or by the batteries. The Pareto front is used to determine the optimal configurations of the studied system, thus making it possible to define the size of these components. The simulation is performed with a maximum number of 10 iterations and the initial population size (or the number of fireflies) is 1000. In Cameroon, electrical energy supplied by the national electricity distribution company is billed at 79 Fcfa/kWh (Cameroonian currency), or USD 0.15/kWh. Figure 9 shows different optimal solutions obtained depending on the reliability and the investment cost of the system for the cities of Maroua, Garoua, and Ngaoundéré. It emerges from this obtained result that the investment costs of the system are higher in Ngaoundéré compared to Maroua and Garoua. However, a slight difference is observed between the investment costs in Maroua and Garoua. The implementation of this system would be less expensive in Maroua and Garoua compared to Ngaoundéré. However, it is noted in Table 5 (which shows the optimal configuration of the system studied corresponding to LPSP of 0% for the three cities considered) that for an LPSP of 0%, the investment costs in Maroua and Garoua are equal (of USD 6225.6); this cost is higher in Ngaoundéré (USD 7136.6). Figure 10 presents the monthly time variation interval of PV energy production for the optimal configuration corresponding to LPSP of 0% for Maroua, Garoua, and Ngaoundéré. Although the solar potential of Garoua and Maroua is greater than that of Ngaoundéré (see Figure 2), their high ambient temperatures also limit the energy production. There is not much difference between PV energy produced in Maroua and Garoua due to almost similar weather conditions in the two areas. In Figure 10, PV energy production in Ngaoundéré is higher than that of Maroua and Garoua because the number of PV modules for the optimal solution corresponding to LPSP of 0% is 10 in Ngaoundéré, while it is eight in both Maroua and Garoua for the same type of module.
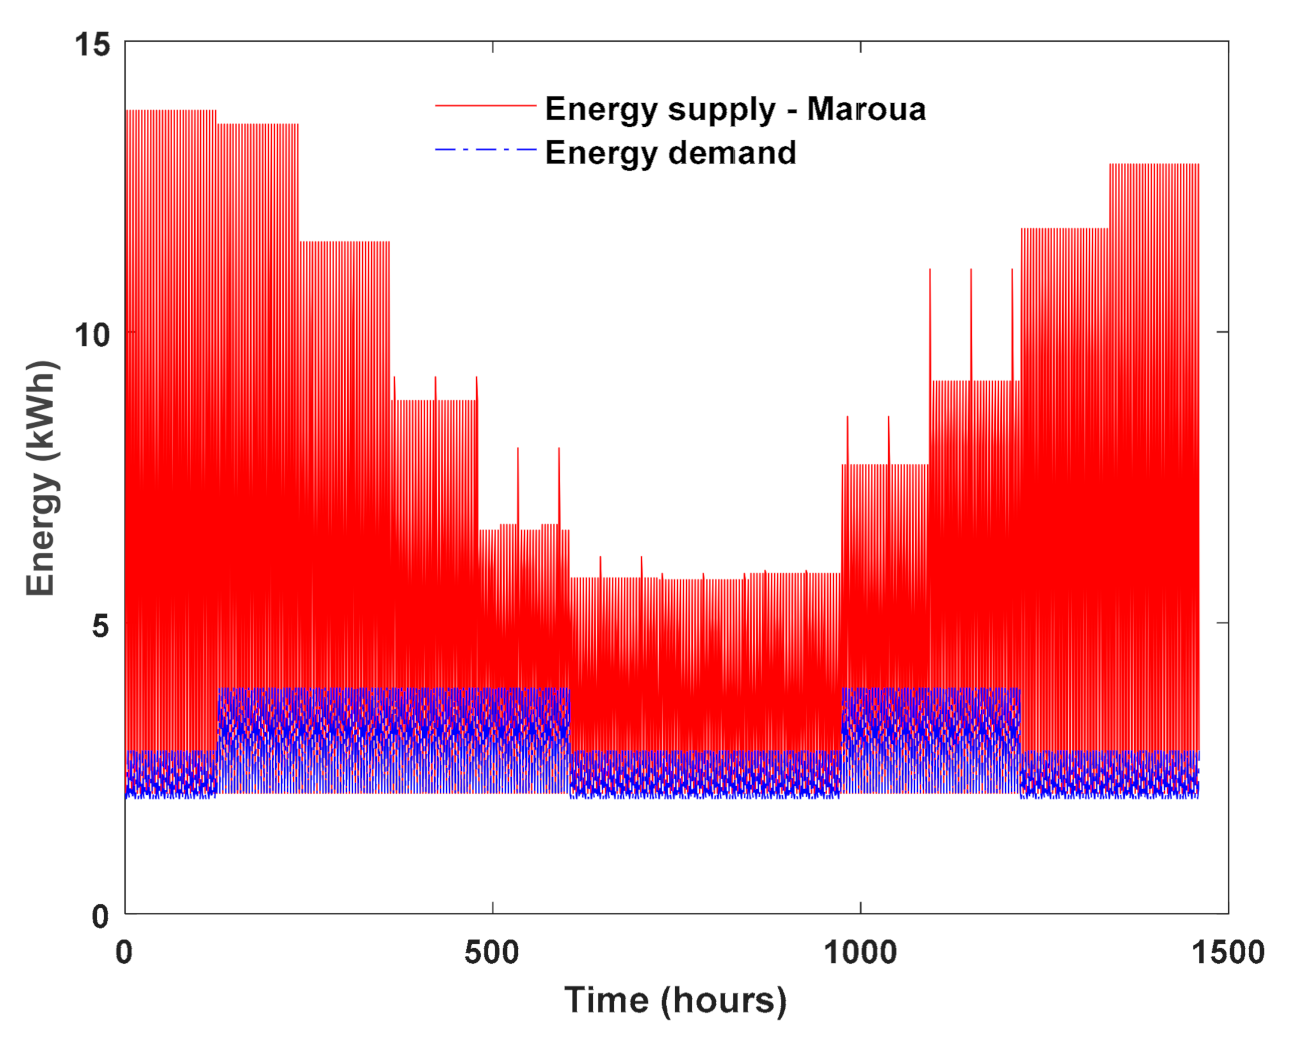
A comparison between the energy supply (which is the sum of the PV energy, the discharge energy of the batteries, and the grid energy) and the energy demand is presented in Figure 11, Figure 12 and Figure 13 for Maroua, Garoua, and Ngaoundéré, respectively. It is shown in these figures that for each time interval over a year, the energy supply is greater than or equal to the energy demand. These results demonstrate the good reliability of the designed systems for the three zones considered where the energy demand is totally satisfied.
The energy balance of the entire hybrid system for each month of the year in the three study areas is presented in Table 6. It emerges from this balance that the monthly demand for electrical energy is fully satisfied in the three cities considered despite the load shedding phenomenon.
Table 7 presents the monthly contribution of each energy supply component of the system to the total energy consumed. For the town of Maroua, the contribution of the main grid is between 27.453% and 44.615%, the direct contribution of the PV generator is between 31.772% and 48.197%, and the contribution of the battery storage is between 23.612% and 27.523%. Since the energy supplied by the batteries is typically provided by the PV generator, the PV energy represents 60.385% to 72.546% of the energy demand (load consumed). For the town of Garoua, the contribution of the main grid is between 28.144% and 47.031%, the direct contribution of the PV generator is between 29.363% and 47.379%, and the contribution of the battery storage is between 23.605% and 27.523%. The PV energy represents from 58.371% to 71.855% of the energy demand (load consumed). For the town of Ngaoundéré, the contribution of the main grid is between 25.839% and 44.985%, the direct contribution of the PV generator is between 31.391% and 49.575%, and the contribution of the battery storage is between 23.622% and 27.510%. The PV energy represents from 61.233% to 74.160% of the energy demand (load consumed). Based on the proposed operational strategy for cost reduction, the obtained results from Table 7 show that the main energy supply component in a PV/Grid-connected system submitted to variable load shedding is the PV generator.
Table 8 presents the monthly percentage of surplus of energy released by the PV generator. This energy is lost by the system. The average annual energy lost by the system represents 34.439%, 34.556%, and 36.741% of the total PV energy produced in Maroua, Garoua, and Ngaoundéré, respectively. The amount of energy lost could be reduced by increasing the battery storage size, thus resulting in a reduction in the main grid energy demand contribution. Although this solution could reduce the main grid energy consumed cost, it could also increase the battery storage cost. Another alternative to harness the excess PV energy produced would be to sell this energy to the nearest users.
Table 9 presents a comparison of the total energy investment cost between an autonomous main grid system without electrical load shedding, an autonomous system main grid system with electrical load shedding, and a hybrid system combining the main grid with electrical load shedding and the PV energy system. For a lifespan of the system of 25 years, the autonomous main grid with electrical load shedding will always be the least expensive system but will not be able to meet the energy demand in the cities considered. At the initial investment, the stand-alone main grid system without power shedding is more cost effective compared to the hybrid PV/Battery/Grid-connected system with power shedding. However, the hybrid PV/Battery Grid-connected system with electrical load shedding becomes more economically advantageous from the 17th year for the city of Maroua, and the 18th year for both the cities of Garoua and Ngaoundéré. Thus, for a long-term investment, the hybrid PV/Battery/Grid-connected system is economically more profitable. Indeed, this conclusion is the same made by previous works [9,10]. It can be seen in Figure 14 that the optimal hybrid system required to cover the household energy demand in Ngaoundéré is more expensive compared to Maroua and Garoua for the same energy demand. The system investment costs are almost the same in Maroua and Garoua, although Maroua has a slightly lower investment cost advantage than Garoua.
Although the proposed PV/Battery system connected to an unreliable electric grid to face the problem of electrical blackouts is efficient, clean, and economically feasible, it is, however, still very expensive in the short term compared to other proposed solutions, such as the diesel generator grid-connected system [13]. Likewise, it emerges from this work that the energy consumption of a PV/Battery/Grid-connected system with electrical load shedding is for the users more expensive than the energy consumption of the main electric grid without electrical load shedding or blackouts, this for an investment over a period of 17 years maximum. This is to say that, in this context, the PV/Battery system, although allowing a reduction in the grid energy consumption, makes the cost of energy more expensive for the user while ensuring continuous availability and satisfactory energy to the load. It is the concern to make the system 100% reliable that increases its investment cost, also resulting in an increase in the excess of PV energy produced since the distribution of the energy demand is disproportionate. The grid energy consumed could be further reduced by using this excess energy from a storage system that is relatively less expensive than batteries to allow a net decrease in the investment cost and thus allow the system to be economically more competitive. If, for example, the electrical blackouts were planned only during the day, the excess PV energy produced, which is also a function of solar irradiation, would be considerably reduced.
The rotary variation of the electrical load shedding scheduling program between users (as carried out by the national electricity distribution company of Cameroon) leads to a sizing of the PV system so that the total energy produced is greater than or equal to the grid energy consumed by the load in the absence of any electrical blackouts. Thus, the PV/Battery system sized and corresponding to an LPSP of 0% would be technically able to meet the load requirement on its own, which will, however, require a fairly large storage system and therefore an increase in the investment cost, which will no longer be only USD 6225.6 for Maroua and Garoua and USD 7136.6 for Ngaoundéré, but much more. It is therefore difficult to predict that the stand-alone PV/Battery system would be economically more advantageous than the electric grid alone without blackouts. However, as demonstrated in this work, with regard to the PV/Battery system connected to the grid, it is competitive in the long term. It comes out that a proper load shedding scheduling strategy for the users could economically improve the PV/Battery/Grid-connected system in the presence of electrical blackouts.

5. Conclusions

The objective of this work was to propose an effective solution to the problems of electrical load shedding encountered by some populations of the world in general and of northern Cameroon, in particular. This solution consists of connecting a PV system to the local main grid. The hybrid system formed is able to respond efficiently to the requested energy demand. Thanks to a double objective optimization based on a defined operational strategy, the optimal system configurations were determined. A method of annual evaluation of the daily energy supplied by the grid per time interval according to its availability and the energy demand was carried out in this work. The energy supplied by the PV system not only helps fill off-peak hours without electricity, but also reduces grid energy consumption even when the grid energy is available. A comparative cost study was carried out between the hybrid PV/Grid system and the grid system without power shedding. It was found that for a certain period of time, the cost of grid energy consumed by the load is less expensive than the cost of energy consumed from the PV/Grid-connected system. However, from the 17th year of consumption, the PV/Grid-connected system becomes economically more profitable in the case of the city of Maroua and from the 18th year in the case of the cities of Garoua and Ngaoundéré. Thus, for a long-term investment, the PV/Battery/Grid-connected system is economically more advantageous. As demonstrated in this work, it is certain that the implementation of the PV/Battery/Grid-connected system is an effective solution to circumvent the problem of electrical load shedding (electrical blackouts), which negatively influences the socio-economic life of some populations. Developing in the near future a proper scheduling program for electrical blackouts could improve the system both technically and economically.

Author Contributions

Conceptualization, investigation, and writing, R.Z.F.; resources, F.N.W., V.D; validation, V.D., C.B.S. and A.D.; supervision, V.D., N.D. and S.Y.D.; revision, R.Z.F. and S.Y.D. All authors have read and agreed to the published version of the manuscript.

Funding

This research received no external funding.

Institutional Review Board Statement

Not applicable.

Informed Consent Statement

Not applicable.

Data Availability Statement

Data sharing not applicable.

Conflicts of Interest

The authors declare no conflict of interest.

Nomenclature

Abbreviations
PVPhotovoltaic
NOCTNominal operating cells temperature (°C)
SOCState of charge of water in the reservoir
LPSPLoss of power supply probability
NPCNet present cost
FAFirefly algorithm
Symbols
NpvNumber of photovoltaic modules
Epv,outPhotovoltaic energy production (kW)
EpvPhotovoltaic energy supplied (kW)
Epv,refPhotovoltaic energy at reference condition (25 °C or 298 K) (kW)
TaAmbient temperature (°C)
GSolar radiation (kWh/m2)
GrefIrradiance at reference condition (kW/m2)
GNOCTSolar radiation at NOCT (kWh/m2)
TcCell temperature (°C or K)
Tc,refCell temperature at reference condition (25 °C or 298 K)
EpvPhotovoltaic daily energy production
IterIteration
Iter_maxMaximum number of iterations
CbatStorage capacity of batteries (kWh or kAh)
Cbat_maxMaximum storage capacity of batteries (kWh or kAh)
UnNominal voltage of battery bank (V)
Ebat_cEnergy of charge of batteries (kWh)
Ebat_dischEnergy of discharge of batteries (kWh)
Epv,sPV energy supplied (kWh)
Epv,cPV energy consumed (kWh)
EsEnergy supplied to load (kWh)
EsurplusSurplus of enery (kWh)
Esurplus_marouaMonthly surplus of energy corresponding to Maroua
Esurplus_garouaMonthly surplus of energy corresponding to Garoua
Esurplus_ngaoundéréMonthly surplus of energy corresponding to Ngaoundéré
Eb,dBattery energy discharged (kWh)
CbattStorage capacity of batteries (kWh or kAh)
EsupplyEnergy supplied to load
EdEnergy demand
EGGrid energy supplied
NadNumber of autonomy days of batteries
CostpvCost of photovoltaic modules
CostreservoirCost of reservoir
CostregulatorCost of regulator
Greek symbols
αTemperature coefficient of short-circuit current (A/K)
ηinvInverter efficiency
ηregulRegulator efficiency
ηbat_cEfficiency of charge of batteries (%)
ηbat_dischEfficiency of discharge of batteries (%)
USDAmerican US dollar

References

  1. World Economic Forum. Available online: https://www.weforum.org/agenda/2019/05/patchy-progress-on-electricity-access-casts-shadow-on-global-goal (accessed on 25 March 2021).
  2. Husna, S.; Abdullah, M.P.; Faridiansyah, I. An improved load shedding scheduling strategy for solving power supply defisit. J. Teknol. 2016, 78, 5–7. [Google Scholar]
  3. Hirodontis, S.; Li, H.; Crossley, P.A. Load shedding in a distribution network. In Proceedings of the International Conference on Sustainable Power Generation and Supply, Nanjing, China, 6–7 April 2009. [Google Scholar]
  4. Faranda, R.; Pievatolo, A.; Tironi, E. Load shedding: A new proposal. IEEE Trans. Power Syst. 2007, 22, 2086–2093. [Google Scholar] [CrossRef]
  5. Crampes, C.; Léautier, T.O. Distributed load-shedding in the balancing of electricity markets. In Proceedings of the 9th International Conference on the European Energy Market, Florence, Italy, 10–12 May 2012. [Google Scholar]
  6. Emar, W.; Al-Barami, G.S. Economical Motivation and Benefits of using Load Shedding in Energy Management Systems. Int. J. Adv. Comput. Sci. Appl. 2019, 10, 204–209. [Google Scholar] [CrossRef]
  7. Margaret, V.; Rao, K.U.; Ganeshprasad, G.G. Intelligent load shedding using ant colony algorithm in smart grid environment. Power Electron. Renew. Energy Syst. 2015, 1149–1162. [Google Scholar] [CrossRef]
  8. Ullah, I.; Rasheed, M.B.; Alquthami, T.; Tayyaba, S. A Residential Load Scheduling with the Integration of On-Site PV and Energy Storage Systems in Micro-Grid. Sustainability 2019, 12, 184. [Google Scholar] [CrossRef] [Green Version]
  9. Alramlawi, M.; Gabash, A.; Mohagheghi, E.; Li, P. Optimal operation of hybrid PV-battery system considering grid scheduled blackouts and battery lifetime. Solar Energy 2018, 161, 125–137. [Google Scholar] [CrossRef]
  10. Bastholm, C.; Fiedler, F. Techno-economic study of the impact of blackouts on the viability of connecting an off-grid PV-diesel hybrid system in Tanzania to the national power grid. Bastholm, Caroline, and Frank Fiedler. Techno-economic study of the impact of blackouts on the viability of connecting an off-grid PV-diesel hybrid system in Tanzania to the national power grid. Energy Convers. Manag. 2018, 171, 647–658. [Google Scholar]
  11. Alibakhsh, K.; Rahdan, P.; Rad, M.A.V.; Yan, W.M. Optimal design and technical analysis of a grid-connected hybrid photovoltaic/diesel/biogas under different economic conditions: A case study. Energy Convers. Manag. 2019, 198, 111810. [Google Scholar]
  12. Samy, M.M.; Mosaad, M.I.; Barakat, S. Optimal economic study of hybrid PV-wind-fuel cell system integrated to unreliable electric utility using hybrid search optimization technique. Int. J. Hydrog. Energy 2021, 46, 11217–11231. [Google Scholar] [CrossRef]
  13. Murphy, P.M.; Ssennoga, T.; Murphy, I.S. Analysis of the cost of reliable electricity: A new method for analyzing grid connected solar, diesel and hybrid distributed electricity systems considering an unreliable electric grid, with examples in Uganda. Energy 2014, 66, 523–534. [Google Scholar] [CrossRef]
  14. Saleh, A.A.; NaimTajuddin, M.F.; Adzman, M.R.; Mohammed, M.F.; Ramli, M.A.M. Feasibility analysis of grid-connected and islanded operation of a solar PV microgrid system: A case study of Iraq. Energy 2020, 191, 116591. [Google Scholar]
  15. Adefarati, T.; Bansal, R.C. The Impacts of PV-Wind-Diesel-Electric Storage Hybrid System on the Reliability of a Power System. Energy Procedia 2017, 105, 616–621. [Google Scholar] [CrossRef]
  16. Maleki, A.; Rosen, M.A.; Pourfayaz, F. Optimal operation of a grid-connected hybrid renewable energy system for residential applications. Sustainability 2017, 9, 1314. [Google Scholar] [CrossRef] [Green Version]
  17. Miceli, R. Energy management and smart grids. Energies 2013, 6, 2262–2290. [Google Scholar] [CrossRef] [Green Version]
  18. Oyekale, J.; Petrollese, M.; Tola, V.; Cau, G. Impacts of Renewable Energy Resources on Effectiveness of Grid-Integrated Systems: Succinct Review of Current Challenges and Potential Solution Strategies. Energies 2020, 13, 4856. [Google Scholar] [CrossRef]
  19. Javaid, N.; Ullah, I.; Akbar, M.; Iqbal, Z.; Khan, F.A.; Alrajeh, N.; Alabed, M.S. An intelligent load management system with renewable energy integration for smart homes. IEEE Access 2017, 5, 13587–13600. [Google Scholar] [CrossRef]
  20. Armin, R.A.; Sumper, A.; Davarpanah, A. Energy sustainability analysis based on SDGs for developing countries. Energy Sources Part A Recovery Util. Environ. Eff. 2020, 42, 1041–1056. [Google Scholar] [CrossRef]
  21. Chakir, A.; Tabaa, M.; Moutaouakkil, F.; Medromi, H.; Alami, K. Smart multi-level energy management algorithm for grid-connected hybrid renewable energy systems in a micro-grid context. Energy 2020, 12, 055301. [Google Scholar]
  22. Armin, R.A.; Sumper, A.; Davarpanah, A. Development of sustainable energy indexes by the utilization of new indicators: A comparative study. Energy Rep. 2019, 5, 375–383. [Google Scholar] [CrossRef]
  23. Mansour, A.; Gabash, A.; Li, P. Optimal Operation Strategy of a Hybrid PV-Battery System under Grid Scheduled Blackouts. In Proceedings of the2017 IEEE International Conference on Environment and Electrical Engineering and 2017 IEEE Industrial and Commercial Power Systems Europe (EEEIC/I&CPS Europe), Milan, Italy, 6–9 June 2017. [Google Scholar]
  24. Le problème de l’industrialisation du Cameroun. Available online: http://georepere.e-monsite.com/medias/files/chap.26.industrialisation.dun.cameroun.pdf (accessed on 7 April 2021).
  25. Photovoltaic Geographical Information System. Available online: https://re.jrc.ec.europa.eu/pvg_tools/fr/#PVP (accessed on 7 February 2021).
  26. PopulationData.net. Available online: https://www.populationdata.net/pays/cameroun/ (accessed on 25 March 2021).
  27. Yahia, B.; Arab, A.H.; Azoui, B. Optimal sizing of photovoltaic pumping system with water tank storage using LPSP concept. Sol. Energy 2011, 85, 288–294. [Google Scholar]
  28. Fadaee, M.; Radzi, M.A.M. Multi-objective optimization of a stand-alone hybrid renewable energy system by using evolutionary algorithms: A review. Renew. Sustain. Energy Rev. 2012, 16, 3364–3369. [Google Scholar] [CrossRef]
  29. Ma, T.; Yang, H.; Lu, L.; Peng, J. Pumped storage-based standalone photovoltaic power generation system: Modeling and techno-economic optimization. Appl. Energy 2015, 137, 649–659. [Google Scholar] [CrossRef]
  30. Mahmoudimehr, J.; Shabani, M. Optimal design of hybrid photovoltaic-hydroelectric standalone energy system for north and south of Iran. Renew. Energy 2018, 115, 238–251. [Google Scholar] [CrossRef]
  31. Yang, H.; Zhou, W.; Lu, L.; Fang, Z. Optimal sizing method for stand-alone hybrid solar–wind system with LPSP technology by using genetic algorithm. Sol. Energy 2008, 82, 354–367. [Google Scholar] [CrossRef]
  32. Koutroulis, E.; Kolokotsa, D.; Potirakis, A.; Kalaitzakis, K. Methodology for optimal sizing of stand-alone photovoltaic/wind-generator systems using genetic algorithms. Sol. Energy 2006, 80, 1072–1088. [Google Scholar] [CrossRef]
  33. Abdelkader, A.; Rabeh, A.; Ali, D.M.; Mohamed, J. Multi-objective genetic algorithm based sizing optimization of a stand-alone Wind/PV power supply system with enhanced battery/supercapacitor hybrid energy storage. Energy 2018, 163, 351–363. [Google Scholar] [CrossRef]
  34. Mahesh, A.; Sandhu, K.S. A genetic algorithm based improved optimal sizing strategy for solar-wind-battery hybrid system using energy filter algorithm. Front. Energy 2020, 14, 139–151. [Google Scholar] [CrossRef]
  35. Chandel, S.S.; Nagaraju, N.M.; Chandel, R. Review of solar photovoltaic water pumping system technology for irrigation and community drinking water supplies. Renew. Sustain. Energy Rev. 2015, 49, 1084–1099. [Google Scholar] [CrossRef]
  36. Niknam, P.H.; Talluri, L.; Fiaschi, D.; Manfrida, G. Improved Solubility Model for Pure Gas and Binary Mixture of CO2-H2S in Water: A Geothermal Case Study with Total Reinjection. Energies 2020, 13, 2883. [Google Scholar] [CrossRef]
  37. Yang, X.S. Firefly algorithm, stochastic test functions and design optimization. Int. J. Bio-Inspired Comput. 2010, 2, 78–84. [Google Scholar] [CrossRef]
  38. Yang, X.S. Nature-Inspired Optimization Algorithms; Elsevier: Amsterdam, The Netherlands, 2014; ISBN 978-0-12-416743-8. [Google Scholar] [CrossRef]
  39. Yang, X.S. Firefly Algorithms for Multimodal Optimization, International Symposium on Stochastic Algorithms; Springer: Berlin/Heidelberg, Germany, 2009; pp. 169–178. [Google Scholar]
  40. Yang, X.S. Multiobjective firefly algorithm for continuous optimization. Eng. Comput. 2013, 29, 175–184. [Google Scholar] [CrossRef] [Green Version]
Figure 1. Geographical location of northern Cameroon.
Energies 14 02836 g001
Figure 2. Time variation of irradiance over the year for Maroua, Garoua, and Ngaoundéré. The time variation interval is Δt = 6 h.
Energies 14 02836 g002
Figure 3. Time variation of ambient temperature over the year for Maroua, Garoua, and Ngaoundéré. The time variation interval is Δt = 6 h.
Energies 14 02836 g003
Figure 4. Hybrid PV/Battery/Grid-connected system.
Energies 14 02836 g004
Figure 5. Profile of the daily energy demand for the different months of the year.
Energies 14 02836 g005
Figure 6. Time variation of the main grid energy supply for the month of January corresponding to two interchangeable scenarios after a duration of 1 week. The first scenario is defined by x1 = 0, x2 = 1.970, x3 = 0, x4 = 2.807; the second scenario is defined by x1 = 2.071, x2 = 0, x3 = 2.143, x4 = 0. The time variation interval is Δt = 6 h.
Energies 14 02836 g006
Figure 7. Time variation of the main grid energy supply for the month of February corresponding to two interchangeable scenarios after a duration of 1 week. The first scenario is defined by x’1 = 0, x’2 = 3.050, x’3 = 0, x’4 = 3.887; the second scenario is defined by x’1 = 2.071, x’2 = 0, x’3 = 3.223, x’4 = 0. The time variation interval is Δt = 6 h.
Energies 14 02836 g007
Figure 8. Flowchart of the firefly algorithm.
Energies 14 02836 g008
Figure 9. Pareto front solutions based on a double-objective optimization.
Energies 14 02836 g009
Figure 10. Time variation of PV energy production over the year for the optimal configuration corresponding to LPSP of 0%. The time variation interval is Δt = 6 h.
Energies 14 02836 g010
Figure 11. Comparison between 1-year time variation of energy supply (PV energy supply + discharge energy of batteries + grid connection energy supply) and energy demand for the optimal configuration corresponding to LPSP of 0%, in the case of Maroua. The time variation interval is Δt = 6 h.
Energies 14 02836 g011
Figure 12. Comparison between one year time variation of energy supply (PV energy supply + discharge energy of batteries + grid connection energy supply) and energy demand for the optimal configuration corresponding to LPSP of 0%, in the case of Garoua. The time variation interval is Δt = 6 h.
Energies 14 02836 g012
Figure 13. Comparison between one year time variation of energy supply (PV energy supply + discharge energy of batteries + grid connection energy supply) and energy demand for the optimal configuration corresponding to LPSP of 0%, in the case of Ngaoundéré. The time variation interval is Δt = 6 h.
Energies 14 02836 g013
Figure 14. Comparison of the total investment cost between the hybrid PV/Battery/Grid-connected system and the only main grid (without electrical load shedding) for the sites of Maroua, Garoua, and Ngaoundéré.
Energies 14 02836 g014
Table 1. Estimation of the daily electrical energy demand of one household.
DesignationQuantityPower (W)
Unit
February–MayJune–AugustSeptember–OctoberNovember–January
h/dWh/dh/dWh/dh/dWh/dh/dWh/d
Lighting797441744174417441
Television1606360636063606360
Radio110990990990990
Ceiling fan4451832400018324000
Computer24510900109001090010900
Refrigerator1300247200247200247200247200
Total 12,231 8991 12,231 8991
Table 2. Daily energy demand per time interval of 6 h.
Time Variation (Hours)Δt1
(1 h–7 h)
Δt2
(7 h–13 h)
Δt3
(13 h–19 h)
Δt4
(19 h–1 h)
Energy demand (kWh)
(Feb.-Mar.-Apr.-May-Sept.-Oct.)
2.0713.0503.2233.887
Energy demand (kWh)
(Jan.-June-July-Aug.-Nov.-Dec.)
2.0711.9702.1432.807
Table 3. Daily distribution of the connection to the electricity network in a household.
Time Slots1 h–7 h7 h–13 h13 h–19 h19 h–1 h
Grid connection: week 1YesNoYesNo
Grid connection: week 2NoYesNoYes
Table 4. Cost of the key components.
DesignationUnitCost (USD)Lifetime (year)
PV arrayW125
BatteriesAh1.638
InverterkW89615
Charge regulatorkW45015
Table 5. Optimal system configuration corresponding to LPSP of 0% for different cities.
CityLPSP (%)Number of PV ModulesAutonomy of Batteries (Days)Capacity of Batteries (kWh)Investment Cost (USD)
Maroua08111.3046225.6
Garoua08111.3046225.6
Ngaoundéré010111.3047136.6
Table 6. Energy balance of the system for each month of the year.
CityMonth
(mth)
Ed
(kWh)
EG
(kWh)
EPV,s
(kWh)
Epv,c
(kWh)
Eb,d
(kWh)
Es = EG + Epv,c + Eb,d
(kWh)
Esurplus = Epv,s − Epv,c − Eb,d
(kWh)
MarouaJanuary278.72178.445446.970123.56376.713278.721246.694
February342.46894.019395.270165.06183.388342.468146.821
March379.161104.898396.260179.27994.984379.161121.997
April366.930125.821325.020151.81889.291366.93083.911
May379.161169.164271.820120.46989.528379.16161.823
June269.730102.668231.94094.94172.121269.73064.878
July278.721110.412232.31093.55374.756278.72164.001
August278.721105.078234.37097.21776.426278.72160.727
September366.930143.614289.890132.13091.186366.96066.574
October379.161107.878371.240181.65889.625379.16199.957
November269.73076.374424.740119.45073.906269.730231.384
December278.72181.151446.870121.59375.977278.721249.300
GarouaJanuary278.72178.445446.150123.56376.713278.721245.874
February342.46896.869389.341162.26083.339342.468143.742
March379.161107.983387.659176.22494.954379.161116.481
April366.930133.995315.216143.64489.291366.93082.281
May379.161178.326261.487111.33389.502379.16160.652
June269.730107.785225.55189.89972.046269.73063.606
July278.721116.028224.18488.01974.674278.72161.491
August278.721108.781231.08093.60476.336278.72161.140
September366.930154.133275.978121.63991.158366.93063.181
October379.161112.949369.930176.58789.625379.161103.718
November269.73076.374423.488119.45073.906269.730230.132
December278.72181.151448.428121.59375.977278.721250.858
NgaoundéréJanuary278.72177.529559.851124.51476.678278.721358.659
February342.46889.394468.794169.78083.294342.468215.720
March379.16197.973427.605186.25994.929379.161146.417
April366.930124.216319.846153.43989.275366.93077.132
May379.161170.568263.116119.02689.567379.16154.523
June269.73098.434234.20599.12472.172269.73062.909
July278.721108.049236.09895.92874.744278.72165.426
August278.72196.235253.322106.08976.397278.72170.836
September366.930140.516289.226135.22891.186366.93062.812
October379.161104.223363.278185.31389.625379.16188.340
November269.73074.873485.050120.95173.906269.730290.193
December278.72178.866545.147123.87875.977278.721345.292
The marked numbers in blue, red and green color indicate how the energy demand is fully satisfied by the energy supply respectively in Maroua, Garoua and Ngaoundéré.
Table 7. Monthly contribution of each energy supply component of the system to the total energy consumed.
CityMonthEd
(kWh)
EG
(kWh)
Epv,c
(kWh)
Eb,d
(kWh)
EG/Ed
(%)
Epv,c/Ed
(%)
Eb,d/Ed
(%)
PV + Batt
(%)
MarouaJanuary278.72178.445123.56376.71328.14444.33227.52371.855
February342.46894.019165.06183.38827.45348.19724.34972.546
March379.161104.898179.27994.98427.66547.28225.05172.334
April366.930125.821151.81889.29134.29041.37524.33465.709
May379.161169.164120.46989.52844.61531.77223.61255.384
June269.730102.66894.94172.12138.06335.19826.73861.936
July278.721110.41293.55374.75639.61433.56526.82060.385
August278.721105.07897.21776.42637.70034.87927.4262.299
September366.930143.614132.13091.18639.13936.00924.85160.860
October379.161107.878181.65889.62528.45147.91023.63771.548
November269.73076.374119.45073.90628.31444.28527.39971.685
December278.72181.151121.59375.97729.11543.62527.25970.884
GarouaJanuary278.72178.445123.56376.71328.14444.33227.52371.855
February342.46896.869162.26083.33928.28547.37924.33471.714
March379.161107.983176.22494.95428.47946.47725.04371.520
April366.930133.995143.64489.29136.51739.14724.33463.482
May379.161178.326111.33389.50247.03129.36323.60552.968
June269.730107.78589.89972.04639.96033.32926.71060.039
July278.721116.02888.01974.67441.62831.57926.79158.371
August278.721108.78193.60476.33639.02833.58327.38760.971
September366.930154.133121.63991.15842.00633.15024.84357.993
October379.161112.949176.58789.62529.78946.57323.63770.210
November269.73076.374119.45073.90628.31444.28527.39971.685
December278.72181.151121.59375.97729.11543.62527.25970.884
NgaoundéréJanuary278.72177.529124.51476.67827.81544.67327.51072.184
February342.46889.394169.78083.29426.10249.57524.32173.897
March379.16197.973186.25994.92925.83949.12425.03674.160
April366.930124.216153.43989.27533.85241.81624.33066.147
May379.161170.568119.02689.56744.98531.39123.62255.014
June269.73098.43499.12472.17236.49336.74926.75763.506
July278.721108.04995.92874.74438.76634.41726.81661.233
August278.72196.235106.08976.39734.52738.06227.40965.472
September366.930140.516135.22891.18638.29436.85324.85161.705
October379.161104.223185.31389.62527.48748.87423.63772.512
November269.73074.873120.95173.90627.75844.84127.39972.241
December278.72178.866123.87875.97728.29544.44427.25971.704
In each column, the marked numbers in color represent the minimum and the maximum percentage of energy contribution of the different components of the system. Blue color is used for the town of Maroua, red color is used for the town of Garoua and green color is used for the town of Ngaoundéré.
Table 8. Percentage of surplus of energy released by the PV generator.
MonthEpv,s/Esurplus_maroua
(%)
Epv,s/Esurplus_garoua
(%)
Epv,s/Esurplus_ngaoundéré
(%)
January55.19255.11064.063
February37.14436.91946.015
March30.78730.04734.241
April25.81726.10324.115
May22.74423.19420.722
June27.97228.20026.860
July27.55027.42827.711
August25.91126.45827.963
September22.96522.89321.717
October26.92528.03724.317
November54.47654.34259.827
December55.78855.94163.339
Annual average percentage of surplus of energy (%)34.43934.55636.741
Table 9. Comparison of the total energy investment cost between different energy supply configurations.
Energy Supply
Configuration
Only Grid Connection without Power SheddingOnly Grid Connection with Power SheddingPV Energy Production SystemGrid Connection with Power Shedding + PV System
CityYearEnergy Consumed (kWh)Total Cost of Energy
(USD)
Energy Consumed (kWh)Total Cost of Energy (USD)Total Investment Cost (USD)Total Cost (USD)
Maroua13868.155558.7361299.524187.7106225.66413.310
27736.3101117.4732599.049375.4206225.66601.020
311,604.4651676.2093898.573563.1306225.66788.730
415,472.622234.9465198.098750.8406225.66976.440
519,340.7752793.6836497.622938.5506225.67164.150
623,208.933352.4197797.1471126.2606225.67351.860
727,077.0853911.1569096.6711313.9716225.67539.571
830,945.244469.89310,396.1961501.6816225.67727.281
934,813.3955028.62911,695.7201689.3916225.67914.991
1038,681.5505587.36612,995.2451877.1016225.68102.701
1142,549.7056146.10314,294.7692064.8116225.68290.411
1246,417.8606704.83915,594.2942252.5216225.68478.121
1350,286.0157263.57616,893.8182440.2316225.68665.831
1454,154.1707822.31318,193.3432627.9426225.68853.542
1558,022.3258381.04919,492.8672815.6526225.69041.252
1661,890.4808939.78620,792.3923003.3626225.69228.962
1765,758.6359498.52222,091.9163191.0726225.69416.672
1869,626.79010,057.25923,391.4413378.7826225.69604.382
1973,494.94510,615.99624,690.9653566.4926225.69792.092
2077,363.10011,174.73225,990.4903754.2036225.69979.803
2181,231.25511,733.46927,290.0143941.9136225.610,167.513
2285,099.41012,292.20628,589.5394129.6236225.610,355.223
2388,967.56512,850.94229,889.0634317.3336225.610,542.933
2492,835.72013,409.67931,188.5884505.0436225.610,730.643
2596,703.87513,968.41632,488.1124692.7536225.610,918.353
Garoua13868.155558.7361352.818195.4086225.66421.008
27736.3101117.4732705.636390.8166225.66616.416
311,604.4651676.2094058.455586.2246225.66811.824
415,472.6202234.9465411.273781.6326225.67007.232
519,340.7752793.6836764.092977.0416225.67202.641
623,208.9303352.4198116.9101172.4496225.67398.049
727,077.0853911.1569469.7281367.8576225.67593.457
830,945.2404469.89310,822.5471563.2656225.67788.865
934,813.3955028.62912,175.3651758.6736225.67984.273
1038,681.5505587.36613,528.1841954.0826225.68179.682
1142,549.7056146.10314,881.0022149.4906225.68375.090
1246,417.8606704.83916,233.8202344.8986225.68570.498
1350,286.0157263.57617,586.6392540.3066225.68765.906
1454,154.1707822.31318,939.4572735.7146225.68961.314
1558,022.3258381.04920,292.2762931.1236225.69156.723
1661,890.4808939.78621,645.0943126.5316225.69352.13
1765,758.6359498.52222,997.9123321.9396225.69547.539
1869,626.79010,057.25924,350.7313517.3476225.69742.947
1973,494.94510,615.99625,703.5493712.7556225.69938.355
2077,363.10011,174.73227,056.3683908.1646225.610,133.764
2181,231.25511,733.46928,409.1864103.5726225.610,329.172
2285,099.41012,292.20629,762.0044298.9806225.610,524.580
2388,967.56512,850.94231,114.8234494.3886225.610,719.988
2492,835.72013,409.67932,467.6414689.7966225.610,915.396
2596,703.87513,968.41633,820.4604885.2056225.611,110.805
Ngaoundéré13868.155558.7361260.876182.1277136.67318.727
27736.3101117.4732521.752364.2557136.67500.855
311,604.4651676.2093782.629546.3827136.67682.982
415,472.6202234.9465043.505728.5107136.67865.110
519,340.7752793.6836304.382910.6387136.68047.238
623,208.9303352.4197565.2581092.7657136.68229.365
727,077.0853911.1568826.1341274.8937136.68411.493
830,945.2404469.89310087.0111457.0207136.68593.620
934,813.3955028.62911,347.8871639.1487136.68775.748
1038,681.5505587.36612,608.7641821.2767136.68957.876
1142,549.7056146.10313,869.6402003.4037136.69140.003
1246,417.8606704.83915,130.5162185.5317136.69322.131
1350,286.0157263.57616,391.3932367.6597136.69504.259
1454,154.1707822.31317,652.2692549.7867136.69686.386
1558,022.3258381.04918,913.1462731.9147136.69868.514
1661,890.4808939.78620,174.0222914.0417136.610,050.641
1765,758.6359498.52221,434.8983096.1697136.610,232.769
1869,626.79010,057.25922,695.7753278.2977136.610,414.897
1973,494.94510,615.99623,956.6513460.4247136.610,597.024
2077,363.10011,174.73225,217.5283642.5527136.610,779.152
2181,231.25511,733.46926,478.4043824.6797136.610,961.279
2285,099.41012,292.20627,739.2804006.8077136.611,143.407
2388,967.56512,850.94229,000.1574188.9357136.611,325.535
2492,835.72013,409.67930,261.0334371.0627136.611,507.662
2596,703.87513,968.41631,521.9104553.1907136.611,689.790
The marked rows in color represent the time when the hybrid PV/Battery/Grid-connected system becomes more advantageous than the only grid without electrical blackouts. The blue, red and green colors are used to indicate this time respectively for the towns of Maroua, Garoua and Ngaoundéré.
Publisher’s Note: MDPI stays neutral with regard to jurisdictional claims in published maps and institutional affiliations.