Article

Heat Transfer by Natural Convection in a Square Enclosure Containing PCM Suspensions

1
Department of Mechanical Engineering, National Cheng-Kung University, Tainan City 701, Taiwan
2
Green Energy and Environment Research Laboratories, Industrial Technology Research Institute, Hsinchu 310, Taiwan
3
Department of Civil Engineering, National Cheng-Kung University, Tainan City 701, Taiwan
*
Authors to whom correspondence should be addressed.
Energies 2021, 14(10), 2857; https://doi.org/10.3390/en14102857
Submission received: 5 April 2021 / Revised: 8 May 2021 / Accepted: 13 May 2021 / Published: 15 May 2021

Abstract

:
Research on using phase change material (PCM) suspension to improve the heat transfer and energy storage capabilities of thermal systems is booming; however, there are limited studies on the application of PCM suspension in transient natural convection. In this paper, the implicit finite difference method was used to numerically investigate the transient and steady-state natural convection heat transfer in a square enclosure containing a PCM suspension. The following parameters were included in the simulation: aspect ratio of the physical model = 1, ratio of the buoyancies caused by temperature and concentration gradients = 1, Raleigh number ( R a T ) = 103–105, Stefan number (Ste) = 0.005–0.1, subcooling factor (Sb) = 0–1.0, and initial mass fraction (or concentration) of PCM particles ( c i ) = 0–0.1. The results showed that the use of a PCM suspension can effectively enhance heat transfer by natural convection. For example, when R a T = 103, Ste = 0.01, c i = 0.1, and Sb = 1, the steady-state natural convection heat transfer rate inside the square enclosure can be improved by 70% compared with that of pure water. With increasing Sb, the Nusselt number can change nonlinearly, resulting in a local optimal value.

1. Introduction

Heat transfer is widely used in industry and daily life, and changes in the latent heat or sensible heat of heat transfer media are used to transfer heat to the external environment. Performance improvements of a thermal system can be achieved not only by modifying the system main body itself [1], but also by either enhancing the accessories [2,3] or by changing the working fluid [4,5]. Eisapour et al. [1] numerically simulated the exergy and energy efficiencies of photovoltaic-thermal (PV-T) systems with various cooling tube configurations, including straight tubes, wavy tubes, and variable wave-amplitude wavy tubes. The influence of the geometrical parameters, the sensitivity of the operating conditions, and the working fluid effects were studied as well. Wijayanta et al. [2] experimentally investigated a double-pipe heat exchanger equipped with double-sided delta-wing (T-W) tape inserts. Liu et al. [3] numerically studied vortex flow and heat transfer enhancement in pipes with a segmented twisted element under constant wall temperature and different Reynolds numbers, ranging from 10,000 to 35,000. Muruganandam et al. [4] conducted experiments on the thermal performance enhancement of a heat exchanger by incorporating nano-particles of the natural Glay at the cold end. Ghalambaz et al. [5] aimed to improve the thermal charging performance of the conical shell-and-tube LHTES (latent heat thermal energy storage) unit by optimizing the shell shape and fin inclination angles.
Regarding the choice of working fluid, after the addition of suspended particles of the phase change material (PCM) to a working fluid, fine solid–liquid PCM particles are dispersed in a carrier or suspending working fluid (PCM slurries [6] or PCM suspensions), and the absorption and release of latent heat by PCM particles at different positions can be utilized to reduce the maximum temperature of the target facility or improve the heat transfer efficiency of the system. The manufacturing methods of PCM particles can be divided into the categories of microencapsulation technology [7] and emulsion technology [8]. In microencapsulation technology, PCM is encapsulated by polymer materials to separate the dispersed phase (PCM) and the dispersion medium (such as water and glycerin), so that the PCM particles can be suspended in the dispersion medium. Emulsion technology reduces the surface tension between the dispersed phase and the dispersion medium by adding appropriate emulsifiers, so that the PCM is uniformly suspended in the dispersion medium to form a stable emulsion.
Using a PCM suspension as a working fluid to improve heat transfer performance in forced convection in tubes, ducts, micro-channels, etc. [9,10], has been extensively displayed. Previously, studies applying the PCM suspension to natural convection were limited, and could be traced back to [11], who performed a natural convection experiment on an enclosure containing PCM particles. The heating surface was at the bottom of the enclosure, and the PCM particles were cylinders with a diameter of 3.2 mm and a height of 1.6 mm. The heat transfer coefficient obtained in this experiment was 1.9 times higher than that of pure water. Datta et al. [12] conducted a follow-up study on the experiment of [11]. The experimental model was a 150 mm × 150 mm × 150 mm cubic enclosure. The difference between these two experiments is that [12] used PCM microcapsules to replace the PCM particles used in [11]. The results showed that under low PCM concentrations (0.5% and 1%), the Nusselt number increased by approximately 80% compared with that of pure water; however, with a further increase in PCM concentration, the heat transfer efficiency gradually decreased, possibly because with increasing the PCM concentration, the uniform dispersion of the microcapsules in the fluid becomes progressively worse, and the microcapsules easily adhere to the high- or low-temperature walls, thus reducing the heat transfer efficiency. Harhira et al. [13] conducted a numerical simulation on the natural convection heat transfer from a vertical flat plate with PCM suspensions, and the results showed that the use of a working fluid containing PCM suspensions increased the Nusselt number to approximately eight times that of pure water.
Recently, PCM and PCM suspensions in natural convection have been the subject of various engineering applications, such as thermal energy storage [14,15], thermal management of buildings [16,17], heat pump and air-conditioning systems [18], electronic cooling [19,20,21], and food industry [22], and research on the use of PCM suspensions in natural convection is booming. Ho [20] investigated the heat transfer of a rectangular thermosyphon loop containing a PCM suspension using numerical simulations. The results showed that a flow regime exists where the latent heat absorption or release of the PCM suspension can effectively enhance the heat transfer, which should be defined through more extensive parametric simulations. Therefore, Ho et al. [21] investigated the effects of the loop size, the heating section proportion, and the cooling section height on the heat transfer characteristics of a rectangular thermosyphon containing a PCM suspension. The results showed that under some conditions (the aspect ratio of the rectangular loop, length of the heated section, and relative elevation of the cooled section compared to the heated section), the best heating efficiency and the cooling efficiency can be obtained.
Ghalambaz et al. [23] numerically investigated the natural convective behavior of nano encapsulated PCMs (NEPCMs) in a cavity. They showed that heat transfer enhancement is strongly related to the non-dimensional melting point. Zadeh et al. [24] numerically investigated the conjugated natural convection heat transfer and entropy generation in a square cavity composed of a porous matrix and PCM suspension with two solid blocks in it. The results illustrate that the heat transfer rates and the average Bejan number are maximized and the generated entropy is minimized when the PCM melting point is 0.5. Hajjar et al. [25] numerically studied the natural convection of a NEPCM suspension in a cavity with a hot wall with a time-periodic temperature. They indicated that the average Nusselt number in the enclosure follows a periodic variation with the same frequency as for the hot wall temperature.
Investigations on natural convection heat transfer with a PCM suspension in rectangular enclosures are gradually increasing, but most of them deal with steady-state behavior. In this context, the objective of this study is to provide insights into details of the transient buoyant flow and heat transfer in a square enclosure containing a PCM suspension, for which little information is currently available. Of particular emphasis in this study is the effects of the subcooling factor (Sb), initial concentration ( c i ), Raleigh number ( R a T ), and Stefan number (Ste).

2. Problem Formulation

A mathematical model for the heat transfer of a square enclosure containing a PCM suspension is established, which is discretized via numerical methods and simulated using the iterative method. The physical model and boundary conditions are shown in Figure 1. The square enclosure (aspect ratio AR = H/W = 1) is filled with an aqueous fluid containing PCM particles. The upper and lower walls of the enclosure are adiabatic, the left side is a hot isothermal wall (Th), and the right side is a cold isothermal wall (Tc). The buoyancy generated by the differences in the wall temperatures and PCM particle concentrations drive the fluid to flow in the enclosure, resulting in heat convection.
In the mixed continuum formula for the buoyancy-driven circulation flow of the PCM suspension, the simplified assumptions used are as follows.
  • Suspended PCM particles are rigid spheres of a uniform size, whose size is much smaller than the characteristic dimension of flow.
  • PCM suspension is a dilute solution and is treated as a Newtonian fluid.
  • The dispersed PCM particles are neutrally buoyant in the mixture.
  • The flow of the PCM suspension is a two-dimensional laminar flow.
  • Except for the phase change process of particles, the hypothesis of local thermal equilibrium between the particles and base fluid is established.
  • The melting and freezing of the PCM particles occur at a fixed temperature.
  • There are no chemical or nuclear reactions between the particles and the fluid.
  • In the initial stage, the PCM particles are uniformly suspended in the fluid, which is a two-phase fluid.
  • The interface effect of the surfactants coated on the PCM is ignored.
  • In addition to the buoyancy caused by the density differences, the thermal properties of the fluid can be regarded as constants.
  • The density change associated with the solid–liquid phase change in the particles is negligible.
  • The thermal radiation and viscous dissipation in the flow are neglected.
  • The relative velocity between the particles and the fluid is quite low compared with the overall solution velocity, and can be ignored.
Based on the above assumptions and dimensionless variables and parameters, the governing equations can be expressed as follows:
Continuity equation
U X + V Y = 0
Momentum equations
U F o + U U X + V U Y = P X + Pr ( 2 U X 2 + 2 U Y 2 )
V F o + U V X + V V Y = P Y + Pr ( 2 V X 2 + 2 V Y 2 ) + R a T Pr [ θ + N ( C 1 ) ]
Energy equation
θ F o + U θ X + V θ Y = ( 2 θ X 2 + 2 θ Y 2 ) c i S t e   ( 1 + Sb ) ( C p , f C p , b ) { ( C ξ l ) F o + [ U ( C ξ l ) X + V ( C ξ l ) Y ] }
Concentration equation
C F o + U C X + V C Y = 1 L e ( 2 C X 2 + 2 C Y 2 )
The dimensional forms and the process of derivation of the above equations can be obtained in Ho [20]. The liquid-phase volume fraction of the PCM particles can be obtained from the following equation [26]:
ξ l F o + U ξ l X + V ξ l Y = 12 α p α b C p , p C p , b B i p D p 2 S t e   ( 1 + S b )   ( θ + ε ) 1 3 B i p C p , b C p , f S t e   ( 1 + S b ) τ θ F o
B i p = h p r p k p = k e k p 2 ( 1 c v ) ( 2 3 c v 1 / 3 + c v )
The effective thermal conductivity is a function of the particle concentration ( c v ) and the Peclet number (Pep), which varies as the local shear rate is varying. Charunkyakorn et al. (1991) suggests the correlation that accounts for different values of particle Peclet number as follows:
k e k p = 1 + b   c v   Pe p m
where
P e p = e d p 2 α f
e = u y + v x
The constants (b, m) that depend on the Peclet number are as follows:
  • when P e p 0.67 ; b = 3, m = 1.5;
  • when 0.67 < P e p < 250 ; b = 1.8, m = 0.183;
  • when P e p 250 ; b = 3, m = 0.09091.
The dimensionless continuity and momentum equations can be further arranged as follows: [27]
Stream function
2 ψ X 2 + 2 ψ Y 2 = ω
Vorticity function
ω F o + U ω X + V ω Y = Pr ( 2 ω X 2 + 2 ω Y 2 ) + R a T Pr ( θ X + N C X )
The initial conditions are set as follows:
F o = 0
ψ = 0 ,   ω = 0 ,   θ = S b 1 + S b ,   C = 1 ,   ξ l = 0
The boundary conditions are set as follows:
F o > 0
0 < X < 1 ,   Y = 0 ,   ψ = 1 ,   θ Y = 0 ,   C Y = 0 ,   ξ l Y = 0
0 < Y < 1 ,   X = 0 ,   ψ = 1 ,   θ = 1 1 + S b ,   C X = 0 ,   ξ l = 1
0 < X < 1 ,   Y = A R ,   ψ = 1 ,   θ Y = 0 ,   C X = 0
0 < Y < 1 ,   X = 1 ,   ψ = 1 ,   θ = S b 1 + S b ,   C X = 0
The local and average Nusselt numbers on the hot and cold walls are defined as follows:
N u h = θ X | X = 0
N u c = θ X | X = 1
N u ¯ h = 1 A R 0 A R N u h d Y
N u ¯ c = 1 A R 0 A R N u c d Y

3. Numerical Method

In the grid system (as illustrated in Figure 1b), non-uniform orthogonal grid points are used for a fine resolution near the hot and cold walls. On both sides of the x-axis, a tight grid is used, and in the middle of the enclosure, a sparse grid is used; on the y-axis, the equally spaced grid is used. In this paper, the finite difference method is used to discretize the differential equations, and for the terms of time, space, and convection, the first-order backward difference, second-order central difference, and QUICK for two dimensions (QUICK-2D, [28]) are used, respectively. The vorticity on the boundaries of the walls is solved with Thom’s formula. The discretization of the concentration equation on the wall uses the finite volume method. The time discretization method used is implicit discretization, and the problem-solving process is divided into two iterative loops, i.e., a time forward loop and a space iterative loop. At each time step, a spatial calculation is carried out first and must reach iterative convergence (Equation (22)), then the temporal calculation is conducted, using Equation (23) to check. If it also converges, then the iteration can advance to the next time step. The convergence criteria are defined as follows:
I t e r a t i v e   c o n v e r g e n c e   e r r o r = | ϕ i , j n , m + 1 ϕ i , j n , m | ϕ i , j n , m ε i
T e m p o r a l   c o n v e r g e n c e   e r r o r = | ϕ i , j n + 1 , m ϕ i , j n , m | ϕ i , j n , m ε i
where m represents the number of iterations and n represents the number of time steps (the iteration advances).
The spatial and temporal flow field, temperature, concentration, liquid volume ratio, and vorticity are first compared with the iterative convergence criteria, which are 10−8 for temperature and 10−5 for other parameters. In addition, the equilibrium of the inlet and outlet heats ( N u h ¯ and N u c ¯ ) of the high- and low-temperature walls is used to determine whether steady-state convergence is reached. The appropriate time step will depend on the parameter range. After testing, when time step Δ F o is less than 5 × 10⁻⁶, the simulation results of different time steps have very little difference. Therefore, the time step used in this study is set to be 10−6. The spatial grid point tests are carried out for the steady states, and the average discrepancy of E N u and E Ψ m a x are calculated using the changes in the average Nusselt number and the maximum value of the stream function, respectively, due to different grid-point numbers:
E N u = | N u m 1 ¯ N u m 2 ¯ N u m 1 ¯ | ;   E Ψ m a x = | Ψ m a x   m 1 Ψ m a x   m 2 Ψ m a x   m 1 |
where m1 and m2 are the different grid points.
Based on the grid test results (shown in Table 1), this study decided to use a 71 × 71 grid for the calculation.
To validate the formulation and numerical method developed in this study, the steady-state forced convection of the PCM suspension in a circular tube, as shown in Figure 2, which was reported in [29,30], is analyzed. The obtained results are qualitatively and quantitatively compared with the results from the literature.
The basic assumptions of this test are as follows:
(1)
The inlet temperature is uniform.
(2)
The flow field of the fluid is a two-dimensional, hydrodynamically fully developed laminar flow.
(3)
The fluid was regarded as a Newtonian fluid.
(4)
Except for the heat conductivity, which varies with the flow field, the bulk properties of the fluid are homogeneous and fixed.
(5)
The concentration distribution is uniform.
(6)
The buoyancy caused by the temperature differences is negligible.
(7)
The temperature field is axially symmetric.
Based on the above assumptions, the dimensionless governing equations of this problem using the methods in this paper can be expressed as follows:
Energy equation:
θ * F o * + ( 1 η 2 ) θ * X * = 1 η η ( η k e k b θ * η ) 1 S t e b * [ ( C   ξ l ) F o * + ( 1 η 2 ) ( C   ξ l ) X * ]
Liquid-phase volume fraction of the PCM particles:
ξ l F o * + ( 1 η 2 ) ξ l X * = { 1 1 + B i p [ ( p / p c m ) 1 / 3 1 ] } [ 12 α p α b C p , p C p , b B i p D p 2 S t e * ( θ * + ε * ) 1 3 B i p τ C p , b C p , f S t e * θ * F o * ]
The dimensionless velocity of the fluid is completely developed:
U * = 2 ( 1 η 2 )
The initial and boundary conditions for this problem are:
F o = 0 ,   θ = 0 ,   ξ l = 0
F o > 0
θ η = 1 Γ   At   the   end ,   η = 1   X >   0
θ η = 0   At   the   end ,   η = 0   X >   0
θ = θ i   At   the   end ,   η > 0     ξ l = 0   X = 0
.
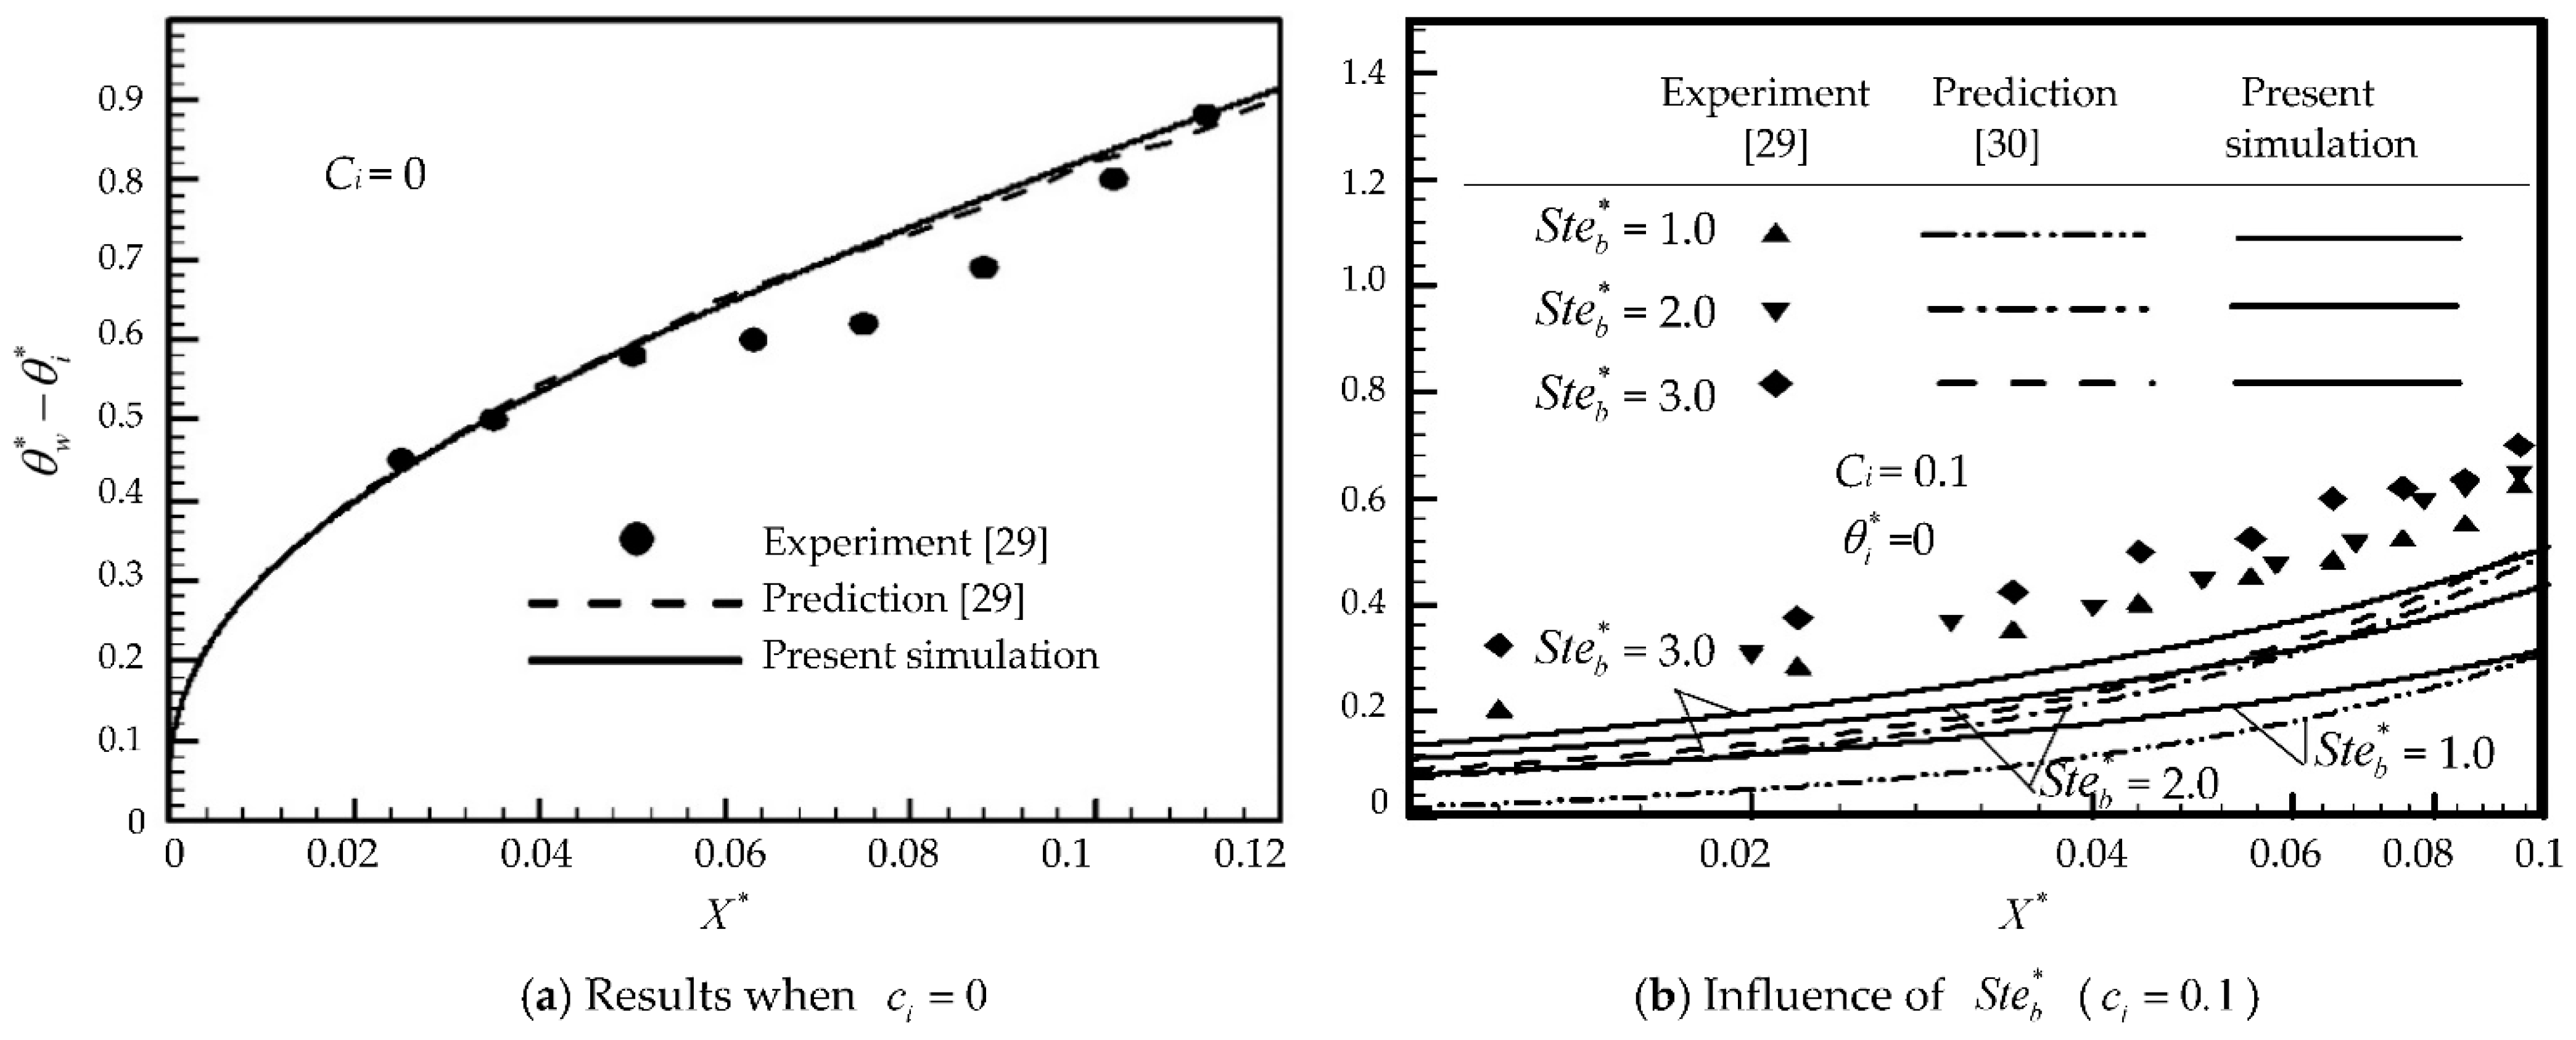
Figure 3a shows the wall temperature distribution of the circular tube with pure water ( c i = 0 ). The numerical simulation results of this validation model are in good agreement with the analytical solution [29] and are roughly consistent with the experimental data [29], but due to the systematic error caused by the experimental equipment, some temperatures are decreased slightly. The maximum deviation is about 20%. Figure 3b shows the influence of the Ste on the wall temperature distribution when c i = 0.1 . Qualitatively, the wall temperature increases with increasing Ste. The wall temperatures obtained in this paper are slightly different from the experimental results [29], but are closer to the experimental results than the analysis results of [30]. Based on the above analysis, the predicted values of the model in this study are qualitatively consistent with the results of the literature. However, quantitatively, the differences are still significant, which may be due to the neglect of the axial heat transfer or other control variables, which is worthy of further discussion.

4. Results and Discussion

The effects of Sb, ci, R a T , and Ste on the transient and steady-state natural convection heat transfer in a square enclosure containing PCM suspension are analyzed. The governing equations used include continuity equation, momentum equations, energy equation, concentration equation, and the liquid-phase volume fraction of the PCM particles. The parameter ranges are as follows: Sb = 0–1.0, c i = 0–0.1, R a T = 10 3 10 5 , and Ste = 0.005–0.1. Other parameters are set as follows: D p = 5 × 10 4 , AR = 1, Pr = 8.5, Le = 3.3 × 10⁶, N = 1, ε = 0 (the effect of PCM supercooling is not considered), and τ = 1 .

4.1. Transient Evolution

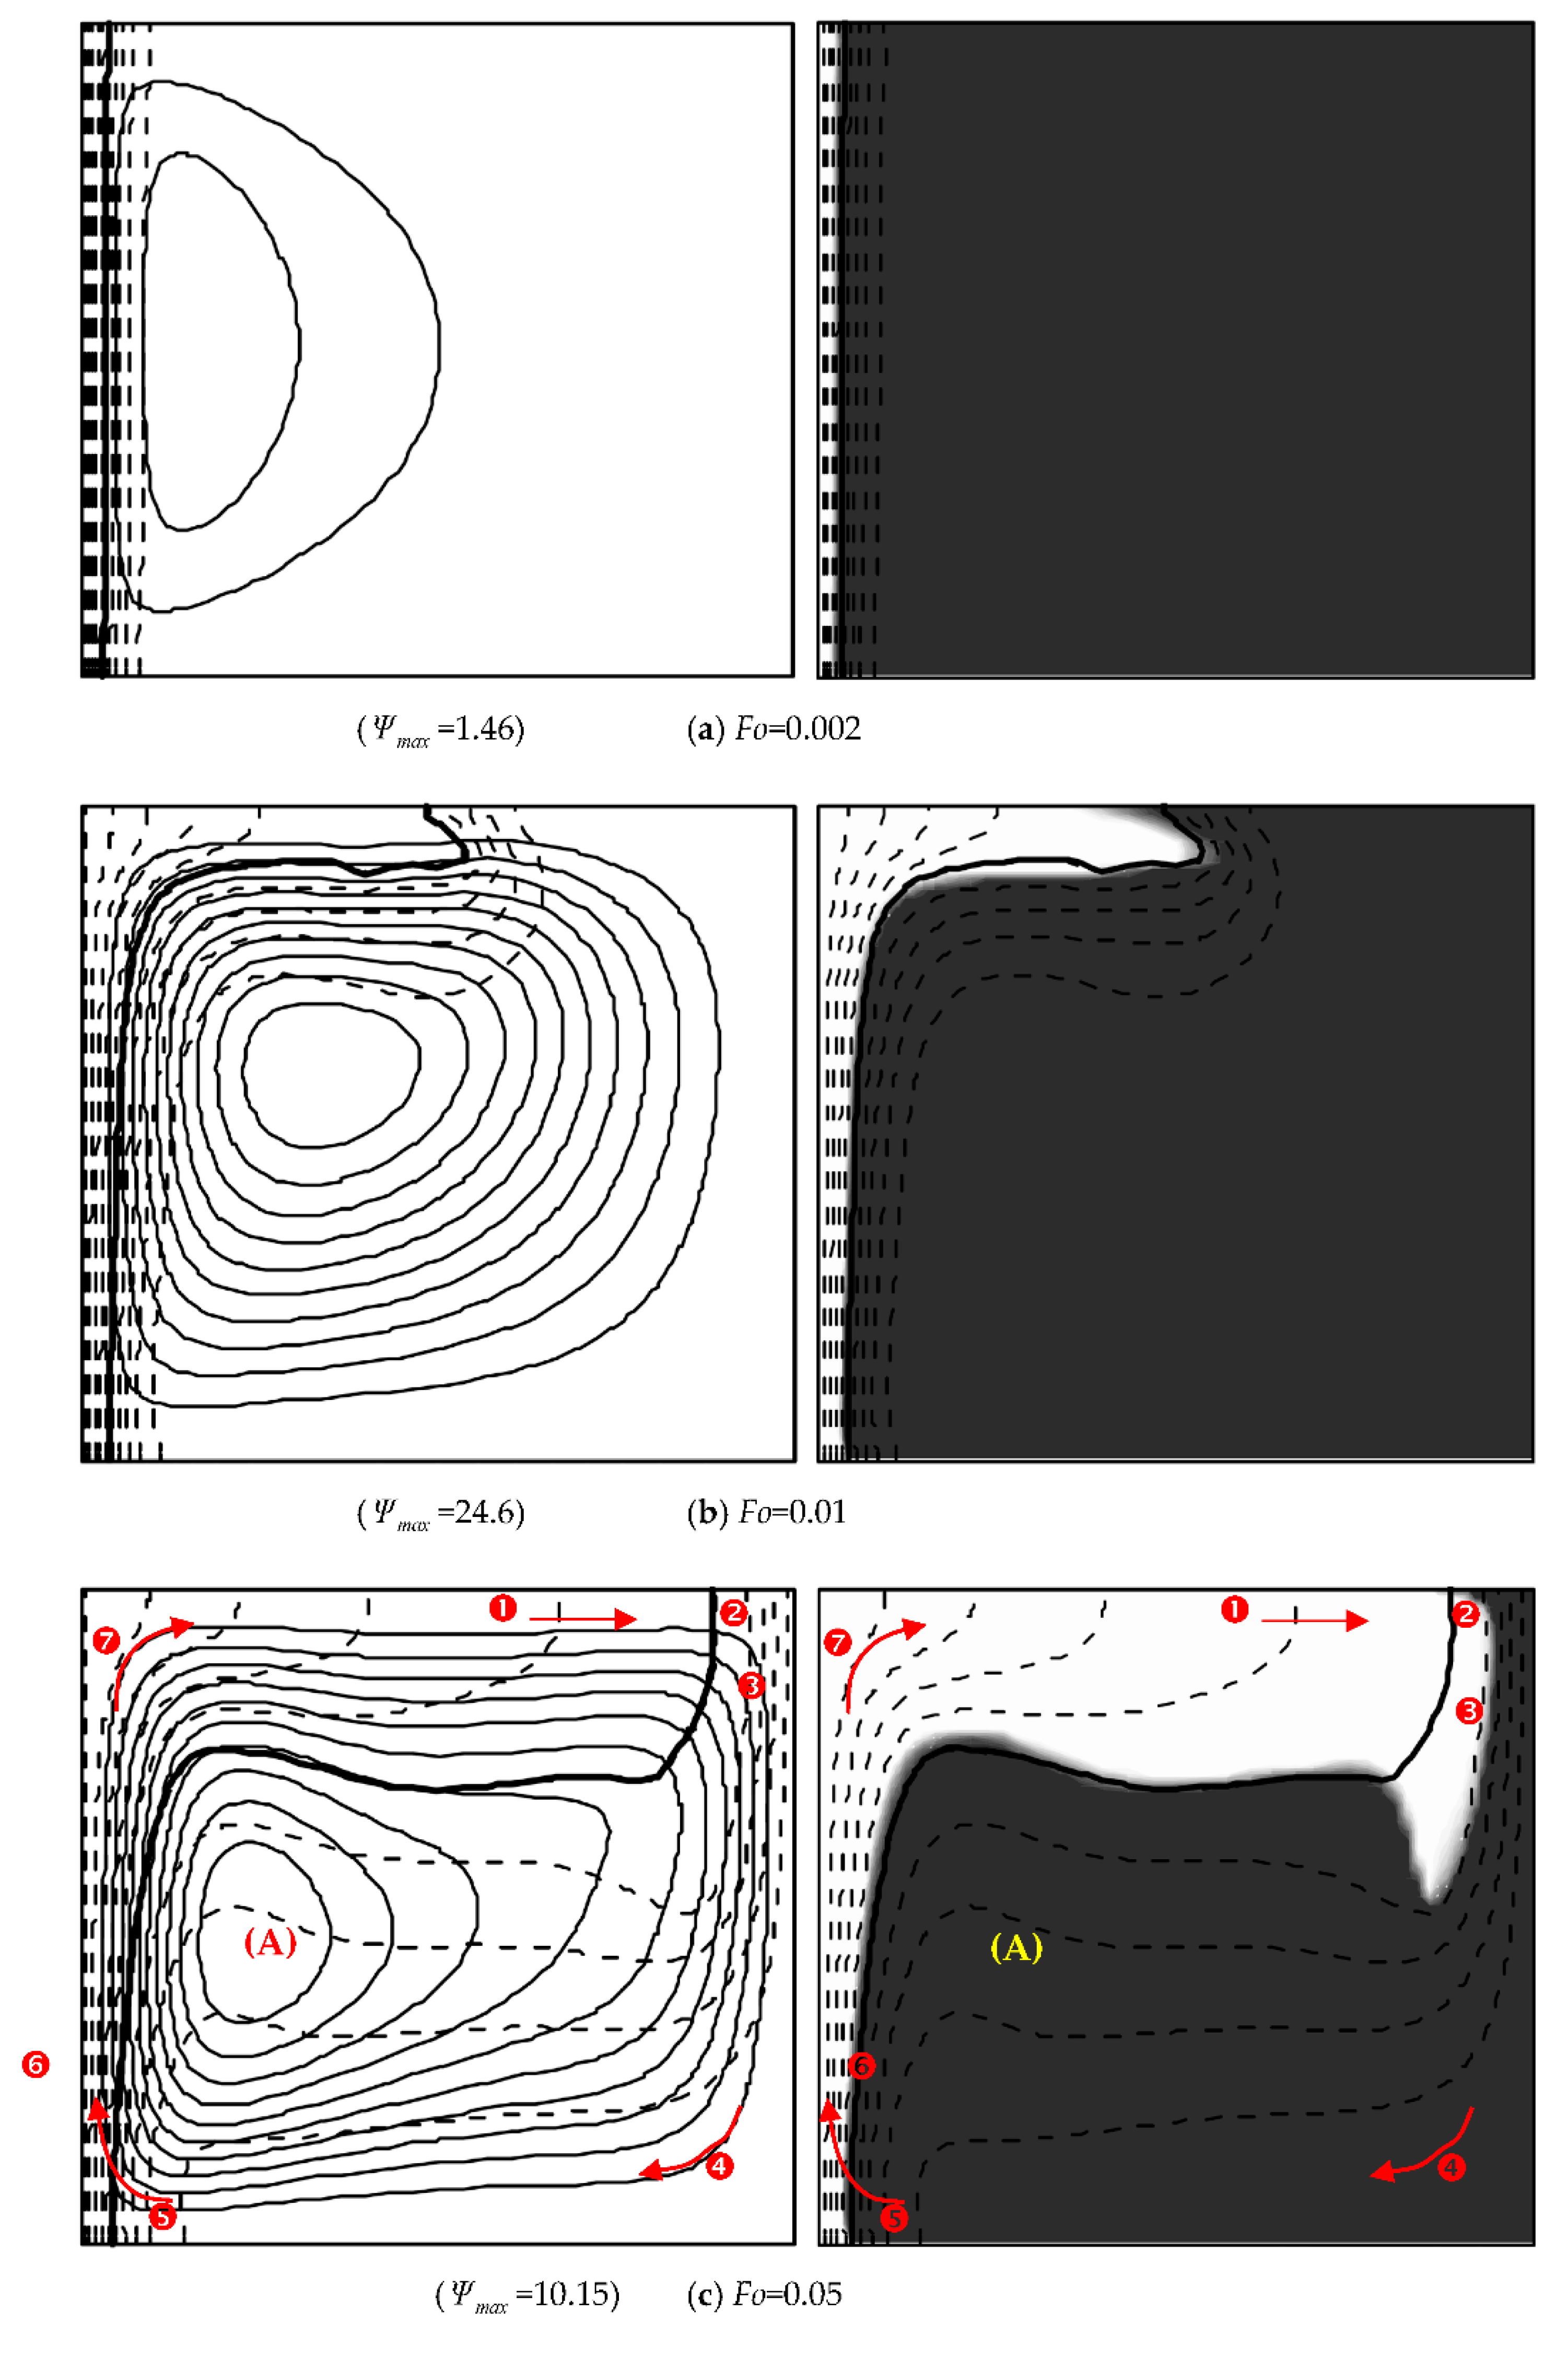
The transient evolution of the natural convection of a PCM suspension in an enclosure is affected not only by the temperature and concentration gradients, but also by the release or absorption of latent heat of the contained PCM particles. Figure 4 shows the transient evolution of the flow field, temperature distribution, and PCM solid–liquid phase distribution with time when R a T = 10 5 , Ste = 0.05, Sb = 1, and c i = 0.05. The dotted line represents the temperature distribution, the solid line represents the flow field, the bold solid line represents the melting point, the shaded area and white area in the right figures represent the solid-phase and the liquid-phase PCM particles respectively, and the grayscale between the shaded and white areas is the phase change region. In the initial stage, the heat of the hot wall mainly transfers to the cold wall by the mechanism of heat conduction, as shown in Figure 4a.
With increasing time, the distance between the melting interface and the hot wall increases, and the heat transfer mechanism changes from heat conduction to heat convection. At this moment, the velocity of PCM suspension gradually increases (Figure 4b, Ψ m a x = 24.6). After the convection is enhanced, the PCM particles cross the melting interface ( θ = 0; Energies 14 02857 i001 in Figure 4c) and expand the melting range to the right ( Energies 14 02857 i002). From the figures on the right panel, the PCM inside the particles at both Energies 14 02857 i001 Energies 14 02857 i002 is liquid. The flow turns downward as it approaches the cold wall on the right side ( Energies 14 02857 i003). During the flow process, the PCM inside the particles is gradually cooled to solid. The downward flowing PCM suspension turns to the left under the influence of the wall below ( Energies 14 02857 i004), then it is directed upward by the thermal buoyancy near the hot wall on the left ( Energies 14 02857 i005). Finally, it returns to the top region ( Energies 14 02857 i006) to form the main circulation.
When Fo = 0.05 (Figure 4c), there is an inner circulation inside the above-mentioned main circulation (symbol (A)), and the right figure of Figure 4c shows that this small circulation is formed by solid PCM particles. As time passes, when Fo = 0.1 (Figure 4d), this internal small circulation becomes two small circulations (symbols (B) and (C)), and the right figure of Figure 4d shows that the left circulation (B) is formed by solid PCM particles, while the right circulation (C) is formed by liquid PCM particles, and there is a solid PCM region inside the small circulation (C). When Fo = 0.2, as shown in the right figure of Figure 4e, the aforementioned solid PCM region is melted, and a small circulation (D) is fully formed by liquid PCM particles. When the circulation crosses the melting interface, the PCM particles in the working fluid could be in different phases before and after the crossing. Figure 4f (steady-state) shows that the internal circulation at (E) is full of liquid PCM particles. When the fluid flows to the right and contacts the low-temperature region, the particles dissipate heat. When the fluid flows back to the left region at (F), the PCM particles have solidified.
Figure 5 illustrates the parameter effects (Sb, c i , R a T , and Ste) on the average Nusselt numbers of hot and cold walls. Figure 5a shows the transient development under different Sb values. When Sb = 0.5–1, compared with other Sb cases, the transient values in N u h ¯ and N u c ¯ are large; however, the differences in N u ¯ between different Sbs are not significant. Both N u h ¯ and N u c ¯ are 1.4 after reaching steady-state, which is higher than the N u ¯ (1.3) when Sb = 0.2 and the N u ¯ (1.13) of pure water. The effect of Sb on N u ¯ is quite special, as detailed in the next section. High c i ( c i = 0.1 ) accompanies transient high values in N u ¯ , as shown in Figure 5b, and the 1.4 of the final steady-state N u ¯ is higher than those under other c i values.
Figure 5c shows the changes in N u ¯ under different R a T s. The increases in R a T can result in a strong convection effect, which further increases the heat transfer rate. As shown in the figure, the time required to reach equilibrium under a large R a T is shorter than that in other cases, and the higher the R a T , the higher the heat transfer rate is. When R a T is increased from 103 to 105, the steady-state N u ¯ is increased from 1.05 to 5.0, showing substantial growth. However, cases with high R a T are more susceptible to the influence of other parameters regarding the generation of oscillatory natural convection. It can be seen from Figure 5d that with decreasing Ste, N u ¯ increases, and when Ste = 0.01, the steady-state N u ¯ is 1.9. According to above analysis, under the condition of high c i , high R a T , and low Ste, the transient and the steady-state values of N u ¯ are high, and the time required to reach steady-state is shortened.

4.2. Steady-State Results

In this section, analyses are performed on the effects of Sb, c i , R a T , and Ste on the steady-state results. It can be seen from Figure 6 that with increasing c i or R a T , N u h ¯ increases; however, with increasing Sb, N u h ¯ increases first then decreases, and there is a local optimum N u ¯ . When R a T = 10 3 (Figure 6a), regardless of c i , the optimal heat transfer ( N u h ¯ ) always occurs at Sb = 0.8; when R a T = 10 4 (Figure 6b, the optimum heat transfer characteristics occur at Sb = 0.5; and when R a T = 10 5 (Figure 6c), the optimal heat transfer characteristics occur at Sb = 0.5. In summary, within the discussed parameter ranges, when R a T = 10 3 , the maximum N u h ¯ is 1.20, which occurs when c i = 0.1 and Sb = 0.8; when R a T = 10 4 , the maximum N u h ¯ is 2.89, which occurs when c i = 0.1 and Sb = 0.5; and when R a T = 10 5 , the maximum N u h ¯ is 5.13, which occurs when c i = 0.1 and Sb = 0.5.
Table 2 shows the effects of R a T and Ste. According to the definition of Ste, a low Ste means that more latent heat than sensible heat is contained in the fluid, and with increasing latent heat, the overall heat transfer characteristics can be improved. According to the data in the table, the lower the Ste, the higher the heat transfer characteristics. When R a T = 10 3 and Ste = 0.01, the maximum increase in the Nusselt number of the high-temperature wall can be approximately 70% higher than that of pure water ( N u h ¯ / N u w ¯ = 1.699, the highest value within the discussed parameter ranges). As R a T increases, the Nusselt number also decreases, which is consistent with the observations by Katz [11]. An increase in R a T means that the convection effect of the PCM particles in the system is increased. As a result of the enhanced convection, the time for the PCM particles to experience a phase change in the phase change region decreases, which reduces the release and absorption of latent heat, thereby reducing the overall heat transfer capability. As R a T increases, Ste increases, which can induce oscillatory natural convection; in other words, low latent heat can induce oscillatory natural convection under high R a T . This phenomenon is not the focus of this study, but it is worthy of subsequent in-depth investigation.

5. Conclusions

Research on natural convection heat transfer with PCM suspension in rectangular enclosures are gradually increasing; however, there are limited studies on the transient behavior. In this context, the objective of this study focused on the transient and steady-state natural convection of PCM suspensions in a square enclosure, mainly influenced by the Raleigh number ( R a T ), Stefan number (Ste), subcooling factor (Sb), and initial concentration ( c i ). The following parameters were included: aspect ratio of the physical model = 1, ratio of the buoyancies caused by temperature and concentration gradients = 1, R a T = 103–105, Ste = 0.005–0.1, Sb = 0–1.0, and c i = 0–0.1. The results can be summarized as follows:
  • Under the condition of high c i , high R a T , and low Ste, the transient and the steady-state values of the Nusselt number ( N u ¯ ) are high, and the time required to reach steady-state is decreased.
  • With increasing Sb, N u ¯ increases first then decreases, and there is a local optimum N u ¯ . Within the discussed parameter ranges, when R a T = 10 3 , the maximum N u h ¯ is 1.20, which occurs when c i = 0.1 and Sb = 0.8; when R a T = 10 4 , the maximum N u h ¯ is 2.89, which occurs when c i = 0.1 and Sb = 0.5; and when R a T = 10 5 , the maximum N u h ¯ is 5.13, which occurs when c i = 0.1 and Sb = 0.5.
  • As R a T increases, N u h ¯ decreases; moreover, as R a T increases, oscillatory natural convection is induced by higher Stes; in other words, the low latent heat of the PCM can induce oscillatory natural convection under high R a T . This phenomenon of oscillatory natural convection has not yet been mentioned in the literature.
The modeling and simulation results in this study are limited to the PCM used, the geometric configuration, and the chosen parameter ranges. An in-depth investigation on the behavior of PCM slurries or suspensions in practical applications is noticeable. This is not what we are exploring in this study, but it is worthy of further consideration.

Author Contributions

C.-J.H. and C.-Y.H. conceived of and designed the model; C.-J.H. and C.-Y.H. performed the simulation works; C.-J.H., C.-Y.H., and C.-M.L. analyzed the data; and C.-J.H. and C.-M.L. wrote the paper. All authors have read and agreed to the published version of the manuscript.

Funding

This research received no external funding.

Acknowledgments

This study is supported by the Ministry of Sciences and Technologies (MOST) of ROC in Taiwan through Projects Nos. NSC 89-2212-E006-160.

Conflicts of Interest

The authors declare no conflict of interest.

Nomenclature

ASurface area of the PCM particle
ARAspect ratio of the rectangular enclosure, H/W
BipBiot number of a PCM particle, h f r p k p
cMass fraction of PCM particles
caConcentration of species a
c i Initial mass fraction of PCM particles
c v Volumetric fraction of PCM particles, c v = ρ b ρ p c
CDimensionless mass fraction of PCM particles, c/ci
CpSpecific heat
dpAverage diameter of PCM particles
DMass diffusivity or diffusion coefficient
DpDimensionless average particle size of PCM particles, Dp/W
EError
FoFourier number, α b t / W 2
F o * Modified Fourier number, α b t / R d 2
gAcceleration due to gravity
hConvection heat transfer coefficient
h l s Latent heat of fusion
HHeight of the rectangular enclosure
iGrid point at the x-axis
jGrid point at the y-axis
kThermal conductivity
LeLewis number, α b / D b
NBuoyancy ratio of mass-to-heat transfer, β c   c i β T   ( T h T c )
NuLocal Nusselt number
N u ¯ Average Nusselt number
pPressure
PDimensionless pressure, p/ ρ b U c 2
PePeclet number, 2 R d u m α
PrPrandtl number, ν b / α b
q Heating flux
RRadical direction
R a T Thermal Raleigh number, g β T ( T h T c ) W 3 ν b α b
R d Tube radius
r p Radius of a PCM particle
SbSubcooling factor, ( T m T c ) / ( T h T m )
SteStefan number, C p , b ( T h T c ) / h l s
S t e b * Modified Stefan number, C p , b ( q R d / k b ) c i h l s
tTime
TTemperature
uVelocity in the X-direction
u m Average flow velocity of the fluid in the tube
UDimensionless velocity in the X-direction, u / U c
U * Modified dimensionless velocity in the X-direction, u / u m
U c Characteristic velocity, α b / W
vVelocity in the Y-direction
VDimensionless velocity in the Y-direction, v / U c
WWidth of a rectangular enclosure
XDimensionless x-coordinate, x/W
X * Modified dimensionless x-coordinate, x R d P e b
YDimensionless y-coordinate, y/W
Δ T l s Difference between the melting and freezing points of the PCM
Greeksymbols
α Thermal diffusivity
β c Concentration expansion coefficient ( 1 ρ ( ρ c a ) T , P )
β T Thermal expansion coefficient
ν Kinematic viscosity
ϕ Variable under investigation
θ Dimensionless temperature, ( T T m ) / ( T h T c )
θ * Modified dimensionless temperature, ( T T m ) q R d / k b
ρ Density
ω Vorticity
τ t Heat transfer time lag of the PCM particles
τ Dimensionless heat transfer time lag of the PCM particles, τ t / [ ( p A p ) 2 / α p ] ( C p , b C p , p )
ξ Liquid-phase volume fraction of the PCM particles
Ψ Stream function
η Dimensionless tube diameter, R / R d
Volume of a PCM particle
ε Supercooling factor, Δ T l s T h T c
ε * Modified supercooling factor, Δ T l s q R d / k b
ε i Comparison criteria
Subscripts
bBulk fluid
cCooled wall
fBase fluid (water)
hHeated wall
iInside
Liquid phase of PCM
mMelting point
m1, m2Different grid points
pPCM particle
pcmPhase change materials
TProperties based on temperature
sSolid phase of PCM
wWater, wall
Superscripts
¯ Averaged quantity
mNumber of iterations
nNumber of time steps (iteration advances)

References

  1. Eisapour, A.H.; Eisapour, M.; Hosseini, M.J.; Shafaghat, A.H.; Sardari, P.T.; Ranjbar, A.A. Toward a highly efficient photovoltaic thermal module: Energy and exergy analysis. Renew Energy 2021, 169, 1351–1372. [Google Scholar] [CrossRef]
  2. Wijayanta, A.T.; Yaningsih, I.; Aziz, M.; Miyazaki, T.; Koyama, S. Double-sided delta-wing tape inserts to enhance convective heat transfer and fluid flow characteristics of a double-pipe heat exchanger. Appl. Therm. Eng. 2018, 145, 27–37. [Google Scholar] [CrossRef]
  3. Liu, G.; Yang, C.; Zhang, J.; Zong, H.; Xu, B.; Qian, J.-y. Internal Flow Analysis of a Heat Transfer Enhanced Tube with a Segmented Twisted Tape Insert. Energies 2020, 13, 207. [Google Scholar] [CrossRef] [Green Version]
  4. Muruganandam, D.; Jayapriya, J.; Ramakrishnan, G.; Puthilibai, G.; Karthick, P.; Sudhakar, M. Enhancing heat transfer rate in heat exchanger using nano particles of the natural Glay. Mater. Today Proc. 2020, 33, 4402–4407. [Google Scholar] [CrossRef]
  5. Ghalambaz, M.; Shirivand, H.; Ayoubloo, K.A.; Mehryan, S.A.M.; Younis, O.; Talebizadehsardari, P.; Yaïci, W. The Thermal Charging Performance of Finned Conical Thermal Storage System Filled with Nano-Enhanced Phase Change Material. Molecules 2021, 26, 1605. [Google Scholar] [CrossRef]
  6. Eisapour, M.; Eisapour, A.H.; Hosseini, M.J.; Talebizadehsardari, P. Exergy and energy analysis of wavy tubes photovoltaic-thermal systems using microencapsulated PCM nano-slurry coolant fluid. Appl. Energy 2020, 266, 114849. [Google Scholar] [CrossRef]
  7. Peng, G.; Dou, G.; Hu, Y.; Sun, Y.; Chen, Z. Phase change material (PCM) microcapsules for thermal energy storage. Adv. Polym. Technol. 2020, 2020, 1–20. [Google Scholar] [CrossRef]
  8. Ho, C.J.; Hsu, H.I.; Ho, T.A.; Lai, C.M. Thermal performance of a vertical U-shaped thermosyphon containing a phase-change material suspension fluid. Energies 2017, 10, 974. [Google Scholar] [CrossRef]
  9. Ho, C.J.; Lee, C.Y.; Yamada, M. Experiments on laminar cooling characteristics of a phase change nanofluid flow through an iso-flux heated circular tube. Int. J. Heat Mass Transf. 2018, 118, 1307–1315. [Google Scholar] [CrossRef]
  10. Ren, Q.; Guo, P.; Zhu, J. Thermal management of electronic devices using pin-fin based cascade microencapsulated PCM/expanded graphite composite. Int. J. Heat Mass Transf. 2020, 149, 119199. [Google Scholar] [CrossRef]
  11. Katz, L. Natural Convection Heat Transfer with Fluids Using Suspended Particles Which Undergo Phase Change. Ph.D. Dissertation, Massachusetts Institute of Technology, Cambridge, MA, USA, 1967. [Google Scholar]
  12. Datta, P.; Sengupta, S.; Roy, S.K. Natural convection heat transfer in an enclosure with suspensions of microencapsulated phase change materials. Am. Soc. Mech. Eng. Heat Transf. Div. 1992, 204, 133–144. [Google Scholar]
  13. Charunkyakorn, P.; Sengupta, S.; Roy, S.K. Forced Convective Heat Transfer in Microencapsulated Phase Change Material Slurries: Flow in Circular Ducts. Int. J. Heat Mass Transf. 1991, 34, 819–833. [Google Scholar] [CrossRef]
  14. Rostami, S.; Afrand, M.; Shahsavar, A.; Sheikholeslami, M.; Kalbasi, R.; Aghakhani, S.; Shadloo, M.S.; Oztop, H.F. A review of melting and freezing processes of PCM/nano-PCM and their application in energy storage. Energy 2020, 211, 118698. [Google Scholar] [CrossRef]
  15. Huang, X.; Alva, G.; Jia, Y.; Fang, G. Morphological characterization and applications of phase change materials in thermal energy storage: A review. Renew. Sustain. Energy Rev. 2017, 72, 128–145. [Google Scholar] [CrossRef]
  16. Dardir, M.; Panchabikesan, K.; Haghighat, F.; El Mankibi, M.; Yuan, Y. Opportunities and challenges of PCM-to-air heat exchangers (PAHXs) for building free cooling applications—A comprehensive review. J. Energy Storage 2019, 22, 157–175. [Google Scholar] [CrossRef]
  17. Rathore, P.K.S.; Shukla, S.K.; Gupta, N.K. Potential of microencapsulated PCM for energy savings in buildings: A critical review. Sustain. Cities Soc. 2020, 53, 101884. [Google Scholar] [CrossRef]
  18. Moreno, P.; Solé, C.; Castell, A.; Cabeza, L.F. The use of phase change materials in domestic heat pump and air-conditioning systems for short term storage: A review. Renew. Sustain. Energy Rev. 2014, 39, 1–13. [Google Scholar] [CrossRef]
  19. Ali, H.M.; Ashraf, M.J.; Giovannelli, A.; Irfan, M.; Irshad, T.B.; Hamid, H.M.; Hassan, F.; Arshad, A. Thermal management of electronics: An experimental analysis of triangular, rectangular and circular pin-fin heat sinks for various PCMs. Int. J. Heat Mass Transf. 2018, 123, 272–284. [Google Scholar] [CrossRef]
  20. Ho, C.J. A continuum model for transport phenomena in convective flow of solid–liquid phase change material suspensions. Appl. Math. Model. 2005, 29, 805–817. [Google Scholar] [CrossRef]
  21. Ho, C.J.; Chen, C.; Lai, C.M. The effects of geometric parameters on the thermal performance of a rectangular natural circulation loop containing PCM suspensions. Numer. Heat Transf. A Appl. 2016, 70, 1313–1329. [Google Scholar] [CrossRef]
  22. Alehosseini, E.; Jafari, S.M. Micro/nano-encapsulated phase change materials (PCMs) as emerging materials for the food industry. Trends Food Sci. Technol. 2019, 91, 116–128. [Google Scholar] [CrossRef]
  23. Ghalambaz, M.; Chamkha, A.J.; Wen, D. Natural convective flow and heat transfer of Nano-Encapsulated Phase Change Materials (NEPCMs) in a cavity. Int. J. Heat Mass Transf. 2019, 138, 738–749. [Google Scholar] [CrossRef]
  24. Zadeh, S.M.H.; Mehryan, S.A.M.; Islam, M.S.; Ghalambaz, M. Irreversibility analysis of thermally driven flow of a water-based suspension with dispersed nano-sized capsules of phase change material. Int. J. Heat Mass Transf. 2020, 155, 119796. [Google Scholar] [CrossRef]
  25. Hajjar, A.; Mehryan, S.A.M.; Ghalambaz, M. Time periodic natural convection heat transfer in a nano-encapsulated phase-change suspension. Int. J. Mech. Sci. 2020, 166, 105243. [Google Scholar] [CrossRef]
  26. Ho, C.J.; Lin, J.F.; Chiu, S.Y. Heat transfer of solid–liquid phase-change material suspensions in circular pipes: Effects of wall conduction. Numer. Heat Transf. A 2004, 45, 171–190. [Google Scholar] [CrossRef]
  27. Currie, I.G. Fundamental Mechanics of Fluids, 2nd ed.; McGraw-Hill: New York, NY, USA, 1993. [Google Scholar]
  28. Leonard, B.P. A stable and accurate convective modelling procedure based on quadratic upstream interpolation. Comput. Methods Appl. Mech. Eng. 1979, 19, 59–98. [Google Scholar] [CrossRef]
  29. Goel, M.; Roy, S.K.; Sengupta, S. Laminar forced convection heat transfer in microencapsulated phase change material suspensions. Int. J. Heat Mass Transf. 1994, 37, 593–604. [Google Scholar] [CrossRef] [Green Version]
  30. Roy, S.K.; Sengupta, S. An evaluation of phase change microcapsules for use in enhanced heat transfer fluids. Int. Commun. Heat Mass Transf. 1991, 18, 495–507. [Google Scholar] [CrossRef] [Green Version]
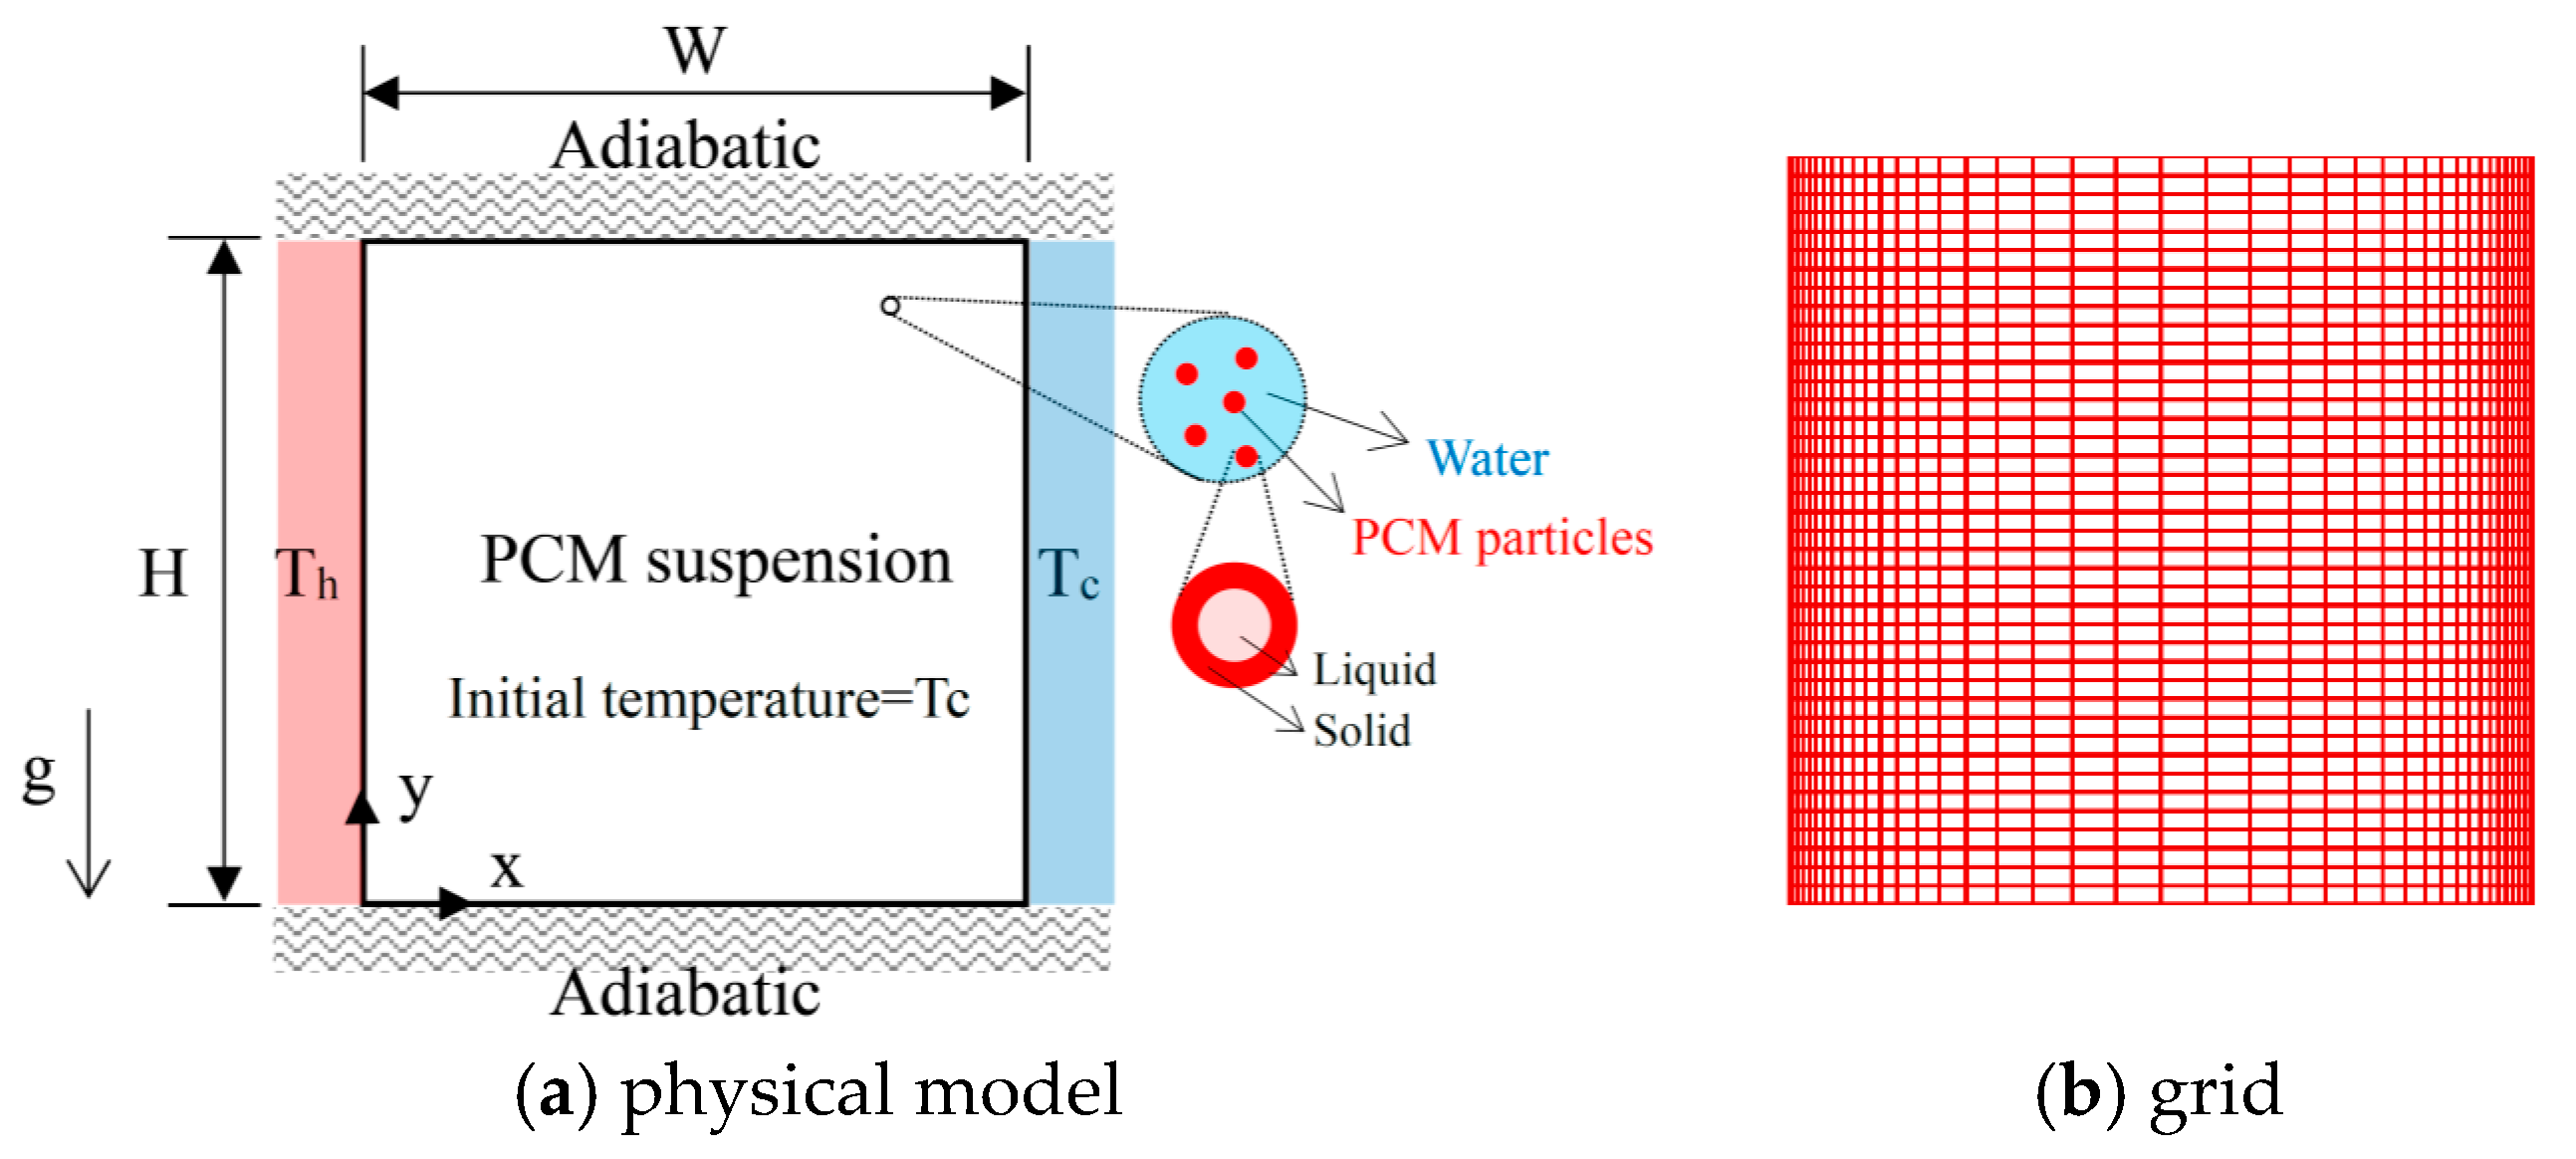
Figure 1. Schematic diagrams of (a) the physical model and (b) grid.
Energies 14 02857 g001
Figure 2. Physical model used for the model validation.
Energies 14 02857 g002
Figure 3. Comparison of the predicted wall temperature with the experimental and analytical results in the literature [29,30] shows that there was no significant difference.
Energies 14 02857 g003
Figure 4. Transient evolution of the flow field (solid line), temperature distribution (dashed line), and PCM solid–liquid phase distribution (shaded area is solid-phase PCM particles; R a T = 10 5 ,   Ste = 0 . 05 ,   Sb = 1 ,   c i = 5 % ).
Energies 14 02857 g004aEnergies 14 02857 g004b
Figure 5. Transient development of the average Nusselt numbers of the hot and cold walls.
Energies 14 02857 g005
Figure 6. The effect of Sb on the average Nusselt numbers of the hot walls. ((a): R a T = 10 3 ,   S t e = 0.05 , (b): R a T = 10 4 ,   S t e = 0.05 , (c): R a T = 10 5 ,   S t e = 0.05 ) .
Energies 14 02857 g006
Table 1. Grid test results.
R a T = 10 3 ,   S t e = 0.05 ,   S b = 1 ,   c i = 10 %
Grid N u h ¯ E N u h N u c ¯ E N u c Ψ m a x E Ψ m a x
71 × 711.3535--1.3535--0.9775--
81 × 811.35150.1521.35140.1550.97700.05
91 × 911.35070.0581.35060.0610.97660.045
R a T = 10 4 ,   S t e = 0.05 ,   S b = 1 ,   c i = 10 %
Grid N u h ¯ E N u h N u c ¯ E N u c Ψ m a x E Ψ m a x
71 × 712.7407--2.7405--3.4018--
81 × 812.73680.1422.73670.1393.40730.16
91 × 912.73290.1432.73280.1443.41910.34
R a T = 10 5 ,   S t e = 0.05 ,   S b = 1 ,   c i = 10 %
Grid N u h ¯ E N u h N u c ¯ E N u c Ψ m a x E Ψ m a x
71 × 715.1342--5.1335--9.6979--
81 × 815.10210.6295.10450.5689.67880.200
91 × 915.08210.3945.08370.4099.65790.412
Table 2. Ratio of the average Nusselt number and the Nusselt number of pure water under different R a T and Ste values.
c i SteSb N u h ¯ / N u w ¯   ( N u h ¯   or   N u c ¯ )
R a T
103104105
0.10.111.103 (1.243)1.111 (2.556)1.084 (5.188)
0.05 1.201 (1.354)1.192 (2.741)1.097 (5.250)
0.01 1.699 (1.915)1.696 (3.900)1.587 (7.600)
0.005 2.046 (2.305)
(The bold numbers indicate the occurrence of oscillatory natural convection).
Publisher’s Note: MDPI stays neutral with regard to jurisdictional claims in published maps and institutional affiliations.