1. Introduction
As fossil fuel resources are limited and their demand is high, the gap can be met with energy generation from renewable resources [
1]. In cities and other urban areas, biomass, geothermal, solar, hydro, and wind energy are currently the leading sources of renewable energy [
2]. Solar energy use is most common, while wind and hydropower are mostly generated outside of densely populated areas. Rapid urban development also leads to increased municipal wastewater production. Wastewater is a rich source of organic fractions and a carrier of energy [
3]. Several researchers have reported developed countries’ experience in recovering biogas and using the produced energy in sewage treatment processes [
4]. The wastewater treatment plant (WWTP) in eastern China applies solar photovoltaic power technology to generate electricity for onsite usage and uses sludge (91%) and food waste (9%) as feedstock to produce biogas. This results in 97% energy self-sufficiency for the WWTP [
5]. Biomethanation or (anaerobic digestion) has recently gained more attention because of its bioenergy production potential [
6]. Anaerobic digestion (AD) of sewage sludge has been in practice in many countries, and the resulting biogas is used for different purposes. Anaerobic co-digestion is defined as the digestion of a combination of different organic wastes with different compositions to make the most of their complementary characteristics for biogas generation.
Anaerobic digestion is a process that has gained prominence as a technology capable of sludge stabilization. It is a biological treatment method in which certain microorganisms convert organic waste into biogas. AD is widely used due to its low cost and ability to degrade organic waste with a high moisture content without reducing the calorific value of the biogas produced. The biogas (a combination of methane and carbon dioxide) collected from the digester can be cleaned and upgraded to generate bio-methane, which can be used instead of natural gas.
Due to the importance of anaerobic digestion as a treatment process, scientific models of the anaerobic digestion process have been developed for almost 40 years, motivated by increasing efficiency [
7]. Modeling anaerobic digestion is complex, with different physicochemical and biological parameters for an unsteady-state process [
6]. The ADM1 model (Anaerobic Digestion Model No 1) was established by the International Water Association (IWA) Task Group for mathematical modeling of the anaerobic digestion process. It uses a large number of constants and coefficients to describe the physical-chemical reactions. Many other models are also available and used, such as mass balance models, black-box models for complex processes, or heuristic models [
8,
9,
10,
11,
12].
Decentralized wastewater treatment can be considered and developed based on source diversion of household wastewater discharges, such as blackwater and kitchen refuse, and treated locally to maximize energy and water recovery [
13]. Daily household waste streams mainly consist of blackwater (BW) and kitchen refuse (KR) [
14]. The feasibility of their co-digestion has been proven in many research studies [
15,
16,
17], and black water enriched with kitchen refuse has a considerable potential to be treated in an anaerobic digestion system [
15]. The quantity of blackwater generated in the urban environment is huge, being the main household liquid waste stream. BW contains high organic nutrients, and together with KR, due to its water content and high biodegradability, are good candidates for bioenergy recovery through anaerobic digestion [
13].
This paper proposes a simplified modeling methodology to calculate the energy generation potential of black water and kitchen refuse streams as part of an integrated district-scale energy model. A kinetic model of anaerobic digestion is presented based on the mass balance of substrate, microorganisms, and methane production to better understand and predict the behavior of anaerobic digestion. The modeling approach is then applied to an eco-district case study.
2. Materials and Methods
2.1. Assessing Blackwater and Kitchen Refuse Generation on a District Scale
Organic loads of blackwater and food waste varied in the different studies. A study in Singapore indicated that 5 L of brown water (only feces) and 200 g of food waste per capita are produced daily [
18]. While Rose et al., 2015, estimated the median fecal wet mass production is 128 g/cap.d for the high-income population and 250 g/cap.d for low-income countries with a large minimum and maximum range of 51–796 g/cap.d and median urine generation rate of 1.42 L/cap.d [
19]. In Canada, in 2018, the produced food waste was 250–340 g/cap.d [
20]. The reported load ratio was with the 5 l BW/cap.d and 500 g FW/cap.d production in China. Reported results from Flintenbreite, a pilot project in Luebeck, Germany, from the year 2000 and with 350 to 400 inhabitants showed that the discharge of vacuum toilets consumes 0.7 to 1 L per flush, and the addition of kitchen refuse to the blackwater assumed 40 g KR per liter BW [
21]. Kujawa-Roeleveld et al., 2003, estimated that daily feces production is 138 g + 0.7 L of flush water of vacuum toilets for one individual, 1.5 L/cap.d of urine, and kitchen refuse generation of 0.2 L/cap.d [
14]. These variations can be associated with the region and toilet type, which shows the BW and KR production rages between 5.2 L/cap.d and 8.5 L/cap.d. In this study, because of a lack of information about BW and KR characteristics in Montreal and reliable related indicators, for this study, there was a lack of a possibility to perform laboratory analysis as well as model validation. The blackwater and kitchen refuse discharge rate for inhabitants is assumed according to German statistical values of 8.5 L/cap.d [
22]. According to Wendland et al., 2007, about 0.60% of the total discharged rate (8.5 L/cap.d) is assumed to be collected and considered as the main discharge (5.2 L/cap.d). Due to Bautista et al., 2020, Otterpohl et al., 2003, consideration of the daily loads of BW, the values were 30 to 45% lower than the loads reported for human excreta. Two factors are primarily responsible for the variations. The housing estate Lachine district is a residential area, so employed residents are not present for the majority of the day, and a fraction of the residents are children, who generate a lower amount of excreta and are not at home for half of the day [
21,
22,
23].
To estimate the inlet flow rate, the total blackwater and kitchen refuse production can be calculated by Equation (1):
where
: Total blackwater and kitchen refuse volume (L.d
−1);
: Number of residences (cap);
: Discharge rates of blackwater (
L/cap.d); and
: kitchen refuse for residential buildings (L/cap.d).
2.2. Mathematical Modeling
In this paper, a biokinetic model of anaerobic digestion is established. Three phenomena describe the model’s biokinetics based on mass balances on the substrate degradation, microorganisms’ growth, and methane production to investigate anaerobic digestion’s observed behavior.
The model was implemented and developed as a user block in the INSEL (available online:
https://insel4d.ca/en/, 1 March 2020), modeling environment, introducing experimental parameters obtained from the literature.
3. Model Description:
Anaerobic digestion modeling allows researchers to monitor biogas generation during the transformation of organic matter over time. The hydrolysis step involves using extracellular enzymes excreted by some bacteria to solubilize the substrate; this is not considered a biological process because there is no metabolism. Acidogenic, acetogenesis, and methanogenesis are metabolic stages in which bacteria absorb and transform organic substrate. Biokinetics is described by three phenomena: substrate consumption, bacterial growth and decay, methane release, and bacterial inhibition [
24].
The simplifying hypotheses considered are:
(1) Complete agitation in the mesophilic condition for sludge in order to maintain the temperature at 35 °C; (2) the biochemical reaction occurs in the bioreactor; (3) the reactor is a closed tank; a uniform composition in the reactor in a continuous stirred-tank reactor (CSTR); and (4) established transitional arrangements, where the organic substrate is the factor limiting bacterial growth. Complete mixing occurs in the bioreactor while endogenous microorganism decay is ignore. The mass conservation law is used to create a mathematical model for microorganism growth, substrate decomposition, and biogas formation [
24,
25].
The schematic diagram of a bioreactor operation with volume
V (l) is represented in
Figure 1.
where Qin, Qu, and Qg are the flowrates of the input and output of the sludge and flowrate of the produced biogas (L.d−1), respectively.
3.1. Volume of Reactor
where
Qi: flowrate of BW and KR (L.d
−1); HRT: hydraulic retention time (d).
3.2. Mass Balance
Si and Su are the concentration of substrate at the inlet and outlet (g.L−1).
Xi and Xu represent the anaerobic microorganism concentration at the entrance and the outlet (g.L−1).
Zg is the methane concentration in the biogas (g.L−1).
The mass conservation law can be applied to each of the components inside the reactor, generating the following equations:
Mass balance of substrate degradation:
where
: substrate degradation rate; and S
i and S
u are the concentration of the substrate at the inlet and outlet (
S concentration of the substrate instant at time step) (g.L
−1)
Mass balance of microorganism’s growth:
where
Xi and
Xu represent the anaerobic microorganism concentration at the entrance and the outlet (g.L
−1);
: anaerobic microorganisms’ growth rate (g/L.d);
: anaerobic microorganisms decay rate (g/L.d).
Mass balance of Methane production:
where
K: coefficient rate of volatile organic compounds transformation into methane (g/L.d);
Zg is the methane concentration in the biogas (g.L
−1).
For modeling purpose, these assumptions are considered: Because methane production is negligible at the beginning and end of the process,
, therefore:
Therefore, by simplifying Equations (3)–(5) based on the assumptions and dividing them by the volume, they become:
The anaerobic microorganism’s growth rate is defined as:
where
µ is the specific microorganism growth rate (d
−1), and the anaerobic microorganisms decay rate is defined as:
The represents the detachment rate constant of microorganisms (d−1).
Then, the equations can be written as:
The Andrew relationship is used for calculating microorganisms’ specific growth rate for substrate inhibition [
25]:
where
: half saturation constant (g.L
−1);
: coefficient of inhibition (g.L
−1).
The substrate degradation rate, where
’ is a set of three various parameters, namely :
: yield coefficient (g.g−1),
: substrate degradation rate to provide energy for growth of microorganisms (g.g−1), : substrate degradation rate to provide energy for the maintenance of microorganisms (g.g−1).
: methane production coefficient (g.g−1).
By applying these parameters to Equation (6), the mass balance of the substrate becomes as follows:
‘
K’ is a coefficient for converting organic substrates into methane, related to microorganism’s growth. It can be defined as in Equation (15):
: methane production ratio (g.g−1)
Thus, the equation for the methane concentration becomes:
4. Energy Production Using Biogas
Anaerobic digestion is usually implemented for sludge stabilization, but its use in energy recovery has recently gained attention. Investigations showed that a significant part of the energy consumed in WWTP units could be supplied by the biogas produced [
26]. For wastewater plants smaller than 10,000 PE, the energy coverage is about 37%, while an energy autonomy between 68% and 100% has been suggested for plants larger than 100,000 PE [
27].
4.1. Energy (Electrical and Thermal) Production from Biogas
The electrical and thermal energy production from biogas was calculated considering a combined heat and power (CHP) engine, or co-generation, which receives the monthly biogas production rates to deliver power (17) and heat (18), as follows:
where
: electrical energy generation (kJ.d
−1);
: Thermal energy generation (kJ.d
−1);
: Biogas production rate (m
3.d
−1);
: methane content (60%)
: methane heating value (34,020 kJ.
);
: electric efficiency of the CHP engine (35%);
: thermal efficiency of the CHP engine (55%);
: the working hours per month of the CHP engine (666.7 h·month
−1, with a total of 8000 h·year
−1);
: the hours that the digester is producing biogas (considering 24 h per day and 30 days per month); and 0.9 is a factor taken into account for the CHP engine’s auto-consumption (10% of the total electric energy generated) (data extracted from [
26]).
4.2. Energy (Thermal) Consumption
The required energy for pasteurization and mesophilic digestion is calculated on a monthly basis considering the average monthly temperature at a given location according to Equations (19) and (20):
where
: energy required for heating the raw sludge (kJ·d
−1)
: BW and KW flowrate (m
3·d
−1);
: BW and KW sludge density (1010 kg·m
−3) [
28];
: is the operating temperature of the digester (mesophilic 35 °C);
: is the sludge’s temperature, which was considered 5 °C higher than the average monthly environmental temperature;
Cp is the specific heat value (4.18 kJ °C
−1·kg
−1);
: energy required for maintaining the anaerobic reactor’s temperature (kJ·d
−1);
is the surface of walls (m
2);
(°C) is the average monthly environmental temperature; and
is the heat transfer coefficients of the walls (
UW = 50 × 10
−4 kJ·s
−1·m
−2 K
−1) [
26].
5. Model Implementation
INSEL is an acronym for Integrated Simulation Environment Language, which provides an integrated environment and a graphical programming language to create simulation applications.
A customized model was developed in INSEL as a new user block that can be integrated into larger energy system models (
Figure 2). The initial concentration of substrates (
Si), microorganisms (
Xi), and methane (
Zi), which are the model’s inputs, and constant parameters introduced within the model, are reported in
Table 1. The model’s outputs are the substrate and microorganism’s concentration, and the concentration of generated methane is displayed graphically.
Characteristics of Blackwater and Kitchen Refuse
According to Elmitwalli et al., 2006, about 71–73% of inlet sludge indicates organic compounds, which fits a typical range of organic matter in municipal wastewater ranging from 65% to 80% [
16,
21,
25]. The majority of biodegradable organic matter in the waste, about 70% to 90%, is converted into biogas in an anaerobic system [
29]. The experiments with untreated blackwater on a bench scale represent 87% of the maximum biodegradability. However, the combination of blackwater and kitchen refuse contains 85–96% biodegradable organic matter [
16,
21,
31].
Therefore, 18.7 g.L−1 Chemical Oxygen Demand (COD) is organic matter, and this value is taken into account for the inlet substrate concentration, and 12.7 g.L−1 is the microorganisms concentration.
Input data and parameters extracted from the literature are summarized in
Table 1.
6. Case Study
In this study, the potential of methane production from co-digestion of blackwater and kitchen waste and associated energy consumption and methane generation via anaerobic digestion was analyzed for a site in the borough of Lachine in Montreal. The borough of Lachine is located on the south shore of Montreal Island, facing Lake Saint-Louis. The site in question is an old industrial site currently undergoing re-zoning for an eco-district development with an estimated 10,000 residents on the east side of Lachine.
7. Results and Discussion
According to the BW and KR generation data, the blackwater and kitchen refuse discharge rate is 5.2 (L/cap.d). The total discharged rate is:
In this study, the amount of sludge was assumed to be equal to the discharged rate. To determine the digester’s volume, the sludge volume accounts for about two-thirds (2/3) of the total volume [
31]. Head spaces ranging from 20% to 50% of the total volume of the reactor are commonly used [
32]:
The equations used for the simulation are (9), (14), and (16) applied for theoretical simulation of the microorganisms, substrate, and methane concentration, respectively, in the scale of time. The simulation inputs were obtained from the literature review. For modeling purposes, one digester was considered.
In the next step, the mass and flowrate of methane and biogas were calculated from the below equations:
Mass of produced methane:
: the mass of methane (kg), Z: Methane concentration g.L−1, V: gas volume (m3).
; methane flowrate (kg.d−1), t: retention time (d).
: biogas flowrate (m3.d−1), 60% is the methane percentage in biogas, is the methane density 0.717 (kg.m−3).
Figure 3 and
Figure 4 represent graphs obtained from the model.
Figure 3 represents the evolution of the organic substrate (
S) and microorganism (
X) concentration, which corresponds to the degradation of the organic substrate by the microorganisms, and
Figure 4 shows the simulation results representing the concentration of produced methane by anaerobic digestion of blackwater and kitchen refuse during the 20 days. In the first step, the microorganisms consume the organic substrate as food to produce biogas, and the trend of the substrate concentration shows a slope due to the degradation of the soluble substrate, causing a slowing in biomass growth. Acidogenesis, acetogenesis, and methanogenesis are the three main biological steps. During these phases, complex organic matter is decomposed by various types of anaerobic microorganisms. Anaerobic digestion is a slow process, and microorganisms need to form new cells and perform bacteria removal as a function of time [
24]. When the organic substrate is fully consumed, the biodegradation is complete. The next step is biogas generation. The biological activity corresponds to the time during which microorganisms decay, leading to increased generated methane. The results show methane production reaches a concentration of about 6.5 g.L
−1 at the end of the period. The volume of biogas based on Equations (21)–(23) was 446 m
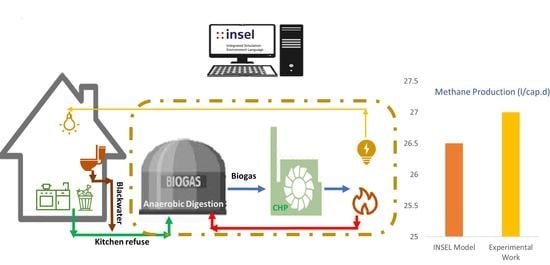
3.d or 44.6 L/cap.d, and the produced methane was 26.5 L/cap.d. The methane yields are related to the degradation of the organic substrate, microorganisms, capita, and day. This simulation allows us to monitor the digestion operation and methane production and design a biogas unit.
7.1. Sensitivity Analysis
Variation of the Concentration of the Methane
The model was validated and calibrated with experimental data.
Table 2 indicates the comparison of obtained results with the model of Robescu et al., 2013, and Fedailaine et al., 2015, and also the methane generation potential from experimental research of mesophilic anaerobic digestion of blackwater (BW) and kitchen refuse (KR), from which the initial concentration of substrate and microorganisms was taken from. The results obtained with the methodology applied in this study are in accordance with the results experimentally obtained with other works. The volume of methane obtained from the simulation is very close to the experimental work and other studies [21,24,25,33]. Results represent that the substrate and microorganism concentration has a significant influence on the production of methane. For example, when the substrate and microorganism concentration increased from 6 to 18.7 g.L
−1 and 3 to 12.7 g.L
−1, production of methane concentration increases from 1.78 to 6.5 g.L
−1, respectively. This activity can be explained by decay phenomena and microorganism detachment following organic matter fermentation reactions in the presence of a significant amount of the organic substrate and increasing biogas production.
7.2. Energy Generation and Consumption
Table 3 and
Figure 5 contains the monthly average temperature information based on the Montreal weather station website [
34].
The thermal energy demands correspond to the energy requirements for maintaining the anaerobic reactor’s temperature (
) and heating the sludge (
). They were calculated on a monthly basis, considering the city’s average temperature, according to Equations (19) and (20) and as shown in
Table 4.
The electricity and thermal energy generation were calculated considering a CHP engine fueled with the produced biogas from anaerobic digestion of BW and KR, in Equations (17) and (18), the electrical energy generation (EEg) is 690.4
, and thermal energy generation (TEg) is 1205.5.
The produced thermal energy provides enough energy for sludge heating for five months (from May to October). As depicted in
Figure 6, the months with higher energy demand for reactor heating (
) correspond to the colder months. The most thermal energy consumption occurs in January (
Table 4), about 2466 kWh.d
−1, as it was the coldest month of 2019. The lowest energy consumption, 396 kWh.d
−1, happens in the warmest month, July, which shows that ambient temperature directly impacts AD energy consumption. The heat demand of an anaerobic digester in warmer months could be compensated with the CHP unit’s energy. Energy production strongly depends on the biogas flow rate, which is directly dependent on the organic matter concentrations in the feed sludge. By considering suitable insulation, the thermal energy consumption can be significantly reduced and became energetically self-sufficient. By reaching this point, the excess
TEg and
EEg can be utilized for other purposes, such as providing heat and electricity for office buildings.
The Sankey diagram (
Figure 7) shows that the total annual energy generation potential from generated biogas is 584 MWh in a year, divided into 213 MWh/year of electricity generation and 371 MWh/year of thermal energy generation. The generated heat can provide about 72% of the required Thermal Energy (
TE) for anaerobic co-digestion of blackwater and kitchen refuse (515.619 MWh/year). Therefore, a significant part of the thermal requirement can be compensated by generated heat from the produced biogas.
8. Conclusions
Detailed modeling of anaerobic digestion is complex due to its unsteady-state behavior and the interaction of different parameters. The AD model in this paper is centered on mass balance equations and presents a basic single-stage mathematical model for anaerobic digestion kinetics. It was proven to be very useful for AD design purposes and to estimate digester volume, methane, and biogas production. In the paper, a simulation model for anaerobic co-digestion of BW and KR is established in the INSEL modeling environment. The model is then used to estimate and predict the methane and biogas production potential for a case study eco-district. The AD model in this study is validated using data from the literature. The results obtained from the model show similar trends and results to the experimental data. The results obtained from the model show that the methane production potential in anaerobic co-digestion of 5.2 L/cap.d of blackwater and kitchen refuse for 10,000 residents is about 26.5 L/cap.d, which correlates with the experimental studies. The amount of generated biogas is about 44.6 L/cap.d, which can supply 72% of the thermal energy consumed by the digester. Energy production strongly depends on the organic matter concentrations in sludge, while energy consumption mainly depends on the system’s operation.
The model is capable of monitoring the operation of the digester over time, including the organic matter degradation, evolution of biomass, and biogas and methane production. The simulation results help to design the biogas units and investigate the energy consumption and energy generation potential of AD, which is of great significance for the organic waste stream treatment of households on a decentralized scale. In this study, the energy production potential of BW and KR and required energy for anaerobic digestion were investigated, and digestate management and the energy use of downstream processes remain open for further evaluation.


