Article

A Reliability Evaluation Method for Independent Small Offshore Electric Systems

1
School of Electrical Engineering, Xi’an Jiaotong University, Xi’an 710049, China
2
CNOOC, Beijing 100028, China
*
Author to whom correspondence should be addressed.
Energies 2021, 14(11), 3035; https://doi.org/10.3390/en14113035
Submission received: 16 March 2021 / Revised: 21 May 2021 / Accepted: 21 May 2021 / Published: 24 May 2021

Abstract

:
As an independent power system, the reliability of offshore electric system is closely related to the smooth progress of offshore oil production. There are two major characteristics of this type of power system. One is that it includes a generation system, transmission system, as well as a distribution system, and the other is that the load shedding measures in the event of a fault are different from that of the onshore power grid. Therefore, traditional reliability assessment models and algorithms cannot be used directly. Based on the theory of overall reliability evaluation, a reliability evaluation method suitable for offshore electric systems and the corresponding reliability indicators are proposed in this paper. In state sampling, the overall system sampling is divided into generation system sampling, transmission system sampling, and distribution system sampling based on the hybrid sampling theory. In state assessment, the priority decoupling load shedding model and the cascade fault model are established considering the actual production. At the end of this paper, the power system of an offshore oil platform is taken as an actual example to calculate the reliability index. Based on the failure analysis, relevant measures to improve the reliability of the system are proposed.

1. Introduction

With the growing global energy gap and the further decline in onshore oil and gas production, the development and utilization of offshore oil and gas resources are becoming increasingly important [1]. As the energy supplier, the reliable and stable operation of the offshore electric system is a prerequisite for the normal oil exploration [2].
The electric system of offshore oil platforms mainly includes power supplies composed of generating sets, transmission lines responsible for long-distance transmission of power, distribution grids used for distributing power to the internal equipment of platforms, and the corresponding loads of specific oil extraction equipment [3], etc. All subsystems are connected together according to the requirements of oil extraction to constitute a typical independent small electric system. Offshore platforms consist of the central platform (CEP) and the wellhead platform (WHP). In the case of offshore oil platforms, for example, CEP is equipped with generator sets and other facilities. It is mainly responsible for the production of electricity. WHP, on the other hand, does not have a generating set and is mainly responsible for extraction operations. There are two forms of offshore platform power systems, single-platform systems and multi-platform systems. In a single-platform system, the only CEP transmits power to several WHPs through bridges. In a multi-platform system, multiple CEPs and multiple WHPs are interconnected in the form of an electrical network to achieve increased reliability. The subject of this paper is a multi-platform system. Compared with onshore grids and island power systems, this type of power system owns unique features.
Different from onshore grids, some equipment of the offshore electric system, especially transmission lines, are greatly affected by ocean currents and fishing. Moreover, with the purpose of ensuring the continuous progress of oil production, the system has a small system capacity and relatively large spinning reserve ratio.
The load of the island power system is mainly domestic installation [4], while the load of the offshore electric system is mostly motor load, which is mainly used for production. In addition, the high construction cost, high failure rate, and long maintenance time of submarine cables are critical factors that limit the reliability of offshore electric systems. The reliability of a power supply for offshore electric systems is generally lower than that for island power systems.
In addition, the offshore platform power system has several characteristics of its own. The first is that it contains both generation, transmission and distribution systems that are closely linked. Secondly, the system is characterized by an unconcentrated distribution of generator sets and a large number of distribution networks, which makes its interconnection of power complex. In addition, the production importance of the equipment in the system is requested to be taken into account when the load is shed to ensure the stable operation of the system due to a generator failure or grid disconnection [5]. Based on the characteristics of this type of power system and the aforementioned differences from the onshore grids and island power systems, the traditional reliability assessment methods are no longer fully applicable. In order to effectively evaluate and analyze the reliability of the power system of offshore platforms, it is necessary to improve the traditional reliability evaluation algorithms to propose new reliability evaluation ideas and methods.
At present, there are few studies on the reliability evaluation of offshore electric systems, but the reliability assessment of onshore power systems is relatively mature. In terms of evaluation objects, theoretical researches on power system reliability are grouped in three levels [6]: The reliability assessment of a single system is at the first level; the reliability evaluation of the bulk power system is at the second level; the reliability assessment of the entire system with each subsystem included is at the third level. The current power system reliability evaluation research basically adopts the method of evaluating different voltage classes separately. Certain research results have been obtained in the first two levels. Reference [7] established a generator capacity model based on Bayesian networks, which could conveniently describe the equilibrium relationship between the maximum capacity of the system and the load demand, thus enabling quantitative analysis of the reliability of the generation system. Reference [8] modified the component reliability parameters by means of connection numbers to account for the effects of weather when performing transmission system reliability assessments. Reference [9] applied an index search method to analyze the consequences of failure modes for complex distribution systems. This method improved the calculation speed while ensuring the accuracy of the calculation. Reference [10] achieved an effective assessment of the reliability of the composite system by applying the anticipatory assessment and screening techniques to the simulation method and pre-treating multiple faults based on the concept of concentric relaxation. A reliability model for distributed generators is proposed in [11]. Based on this model, different distribution system planning schemes containing distributed generators are analyzed, leading to a solution that balances operating costs and system reliability. Reference [12] established a random output model for distributed generators and a time-series model for loads to assess and analyze the reliability of the islanded operation state of a distribution system containing distributed generators.
However, due to the difficulty of harmonizing subsystem reliability assessment methods and the large calculation involved in conducting a third-level evaluation, the overall power system reliability evaluation and related research are rarely carried out for onshore power grids. Roy Billinton took the reliability assessment results of the composite generation and transmission system as the power supply parameters for the reliability assessment of the distribution system [12], assembling the overall power system reliability evaluation theory. Reference [6] aimed at the problem of insufficient analysis of the relationship between the distribution system and the superior power grid, establishing the connection of them by the substation equivalent model. In reference to the reliability of micro-grid with distributed generation, Reference [13] established an equivalent model of wind turbines and analyzed all sequential simulation of the system reliability. However, considering the tight integration of subsystems in the offshore electric system, its grid structure, together with recovery processing, is quite different from the onshore power system. In this situation, the traditional onshore reliability assessment method is not necessarily applicable anymore.
The power system of offshore oil platforms is different from the onshore grid in that it has a smaller capacity, fewer buses, lower voltage class, and weaker grid structure [14]. In the traditional power system reliability evaluation, subsystems are assessed on the assumption that other subsystems are completely reliable [15], whereas this assumption no longer exists in the case of offshore power system reliability assessments. The reliability calculated under traditional evaluation methods could be exaggerated, which has an influence on the objectivity of the power system reliability assessment. Therefore, it is required that the offshore electric system should be assessed by the overall power system reliability evaluation methods to consider the interaction between the subsystems.
In terms of evaluation methods, there are two typical types of power system reliability evaluations: Analysis methods and simulation methods. The analysis method has clear physical concepts and precise models [16], yet its computational effort increases sharply with the complexity of the system, which makes it susceptible to dimensional disasters. The simulation method determines the state of the system by random sampling, in which the computational effort is independent of the size of the assessment object and the mathematical model is relatively simple [17]. However, the accuracy of the method is related to the amount of calculations. More calculations are required to achieve the higher accuracy [18]. Simulation methods are mainly divided into the Sequential Monte Carlo method as well as the Non-Sequential Monte Carlo method, depending on whether or not the time scale is taken into account [19].
The hybrid method combines the advantages of the above two methods [20]. Since its model is accurate and a physical concept is clear, the analysis method should be adequately utilized. Where the solution scale exceeds the capacity of the analysis method, the simulation method is applied [21]. At present, the research on the hybrid method of power system reliability assessment is in the development stage. Considering the limitation of the complexity of the assessment object on the convergence of reliability assessment and the calculation speed, the hybrid method is mostly applied in the distribution system.
Reference [13] utilized the analysis method to reduce the complex network to a simple main feeder system and performed Monte Carlo sampling of the resulting main feeder system to finally obtain the reliability-related indicators in the system. Reference [22] introduced the frequency and duration (FD) method in the state transition process and combined it with the time sequential simulation to achieve the reliability assessment of AC-DC networks. Reference [23] applied the analysis method to determine and process the load shedding state of the system, followed by a sampling of system states that did not lead to load shedding through the simulation method. Reference [24] proposed an analysis method that took into account the capacity constraints of feeders and combined it with the time Sequential Monte Carlo method to assess the reliability of a distribution network with distributed generators. A fuzzy probabilistic modelling approach for system component failure parameters and load profiles was proposed in [25], which established fuzzy affiliation functions for system components through statistical records. Based on the fuzzy probabilistic model, a hybrid method for the power system risk assessment that integrated fuzzy sets and Monte Carlo simulation was proposed, which could capture both the randomness and fuzziness of load and component failure parameters. In response to the characteristics of system reliability assessment and the problem that the data were easily overwhelmed in the traditional Bayesian method, reference [26] proposed a hybrid Bayesian assessment method for the reliability of complex systems based on unit reliability data. Reference [27] blended state-of-charge models from the simulation method and the analysis method to finally obtain an equivalent averaging model. Based on this model, the wind integrated power system was evaluated in terms of seasonal accumulation and diversion of energy. Reference [28] described a range of methods to reduce the sampling variance of the simulation method. In the reliability assessment, the generator with the highest power rating in the system was chosen to apply the analysis method, thus reducing the variance of the test.
It could be concluded from the related research that, for the hybrid evaluation method of power system reliability, the key to the research is to utilize the analysis method in each stage of the simulation method to evaluate the power system. In this article, the hybrid method is operated in the simulation sampling process, which is mainly reflected in the application of the analysis method to attain partial information before sampling. Specifically, it is achieved by first developing the outage table for each distribution network through the analysis method and then accomplishing Monte Carlo simulations on the main grid to acquire the results of the overall power system reliability evaluation. This method of compressing the state space simplifies the subsequent sampling and judgment to a large extent, accelerating the calculation process.
Studies on the assessment of the reliability of power systems on offshore platforms are scarce and mostly refer to reliability indirectly. For example, the configuration of relay protection for offshore oil platform power systems was studied based on the characteristics of their equipment and structure [29]. The configuration of energy management systems was analyzed [30], and a rating system for offshore oil platform power systems was established to resolve issues such as grid planning and modification [31]. In traditional offshore oil exploration planning, the reliability of the power system of offshore oil platforms has not been placed at a critical position. Moreover, most of the related researches to improve its reliability have only been qualitatively explained from an empirical point of view, without describing its specific effects from a quantitative point of view [32]. Therefore, the foci of this paper are calculating the reliability of the power system of offshore oil platforms and quantifying the degree of reliability improvement of different measures.
Firstly, an overall power system reliability assessment method based on a non-sequential hybrid approach is proposed, which accelerates the convergence by establishing the outage table in advance. Secondly, a hierarchical priority load shedding model based on the AC power flow is proposed for the actual production requirements of offshore platforms. Thirdly, taking an offshore oil platform power system as an example, the overall system reliability indicators are calculated and the fault contribution of each subsystem is analyzed. Finally, relevant measures to improve the system reliability are discussed. The rest of this article is organized as follows: Section 2 provides a detailed description of the proposed method. Section 2.1 presents the component and system reliability models and Section 2.2 proposes a hybrid method for the overall system reliability assessment. Section 2.3 establishes an overall reliability index system and Section 2.4 discusses the load shedding model. Section 3 presents an analysis of the results of the calculations. Lastly, Section 4 summarizes the conclusions and provides an outlook on future research directions.

2. Materials and Methods

The electric system of offshore oil platforms is a typical independent small power system. The entire system could be divided into the generation system, transmission system, distribution system, etc. Its topologic relations are expressed by node and component models for the analysis of the overall power system reliability assessment results.

2.1. Method for Subsystem Modelling and Division

In the electric system of offshore oil platforms, transformers, generators, etc. are mostly enclosed type electrical equipment, and their fault factors are basically the same as those of onshore grids [3]. Hence, the reliability models and parameters of corresponding apparatus in onshore grids such as transformers are still applicable to offshore components. Significantly, the offshore oil platforms are connected by submarine cables or bridges [33]. In practice, the laying and repair of submarine cables are extremely difficult, and bridges are generally not overhauled. Accordingly, two-state models with normal and fault states are appropriate for submarine cables and bridges. Three-state models that contain normal, fault, and maintenance states are appropriate for breakers, transformers, generators, as well as buses. The reliability models of the components are connected to each other through the actual electric topologic relations.
The division of subsystems could contract the amount of each sample and the calculation of the state assessment. Furthermore, it is conducive to analyzing the failure proportion of each subsystem in the overall system. The division proposed in this paper is as follows:
  • Generation system: Turbine generator sets on platforms;
  • Transmission system: Submarine cables and bridges between platforms;
  • Distribution system: Distribution grids on platforms, buses of different voltage classes, step-up (down) transformers, etc.;
  • The division of each subsystem is shown in Figure 1.

2.2. Overall Power System Reliability Assessment Method

The hybrid method is utilized in this paper to procure the long-term average reliability index of the whole system and each subsystem, which is shown in Figure 2.
The proposed overall power system reliability assessment method is based on the following three assumptions:
Assumption 1.
Faults of the overall power system are composed of the superposition of the faults of each subsystem.
Assumption 2.
Multiple faults between subsystems do not occur simultaneously.
Assumption 3.
Multiple faults within the subsystem occur simultaneously, and repairs of them commence simultaneously.
Based on Assumptions 1 and 2, the occurrence of a system-wide fault is equated to the occurrence of each subsystem failure separately in order to divide the whole system sampling into an independent sampling of each subsystem [34].
Based on Assumption 2, if the sampled generation and transmission system fails at the same time, the fault will be decomposed respectively into generation and transmission system failures, and the loss will be counted into the loss of the corresponding subsystem.
Based on Assumption 3, the process of multiple faults within the subsystem is simulated from the time they occur until the faults are repaired, which enables separate statistics for fault indexes and load cutting indexes.
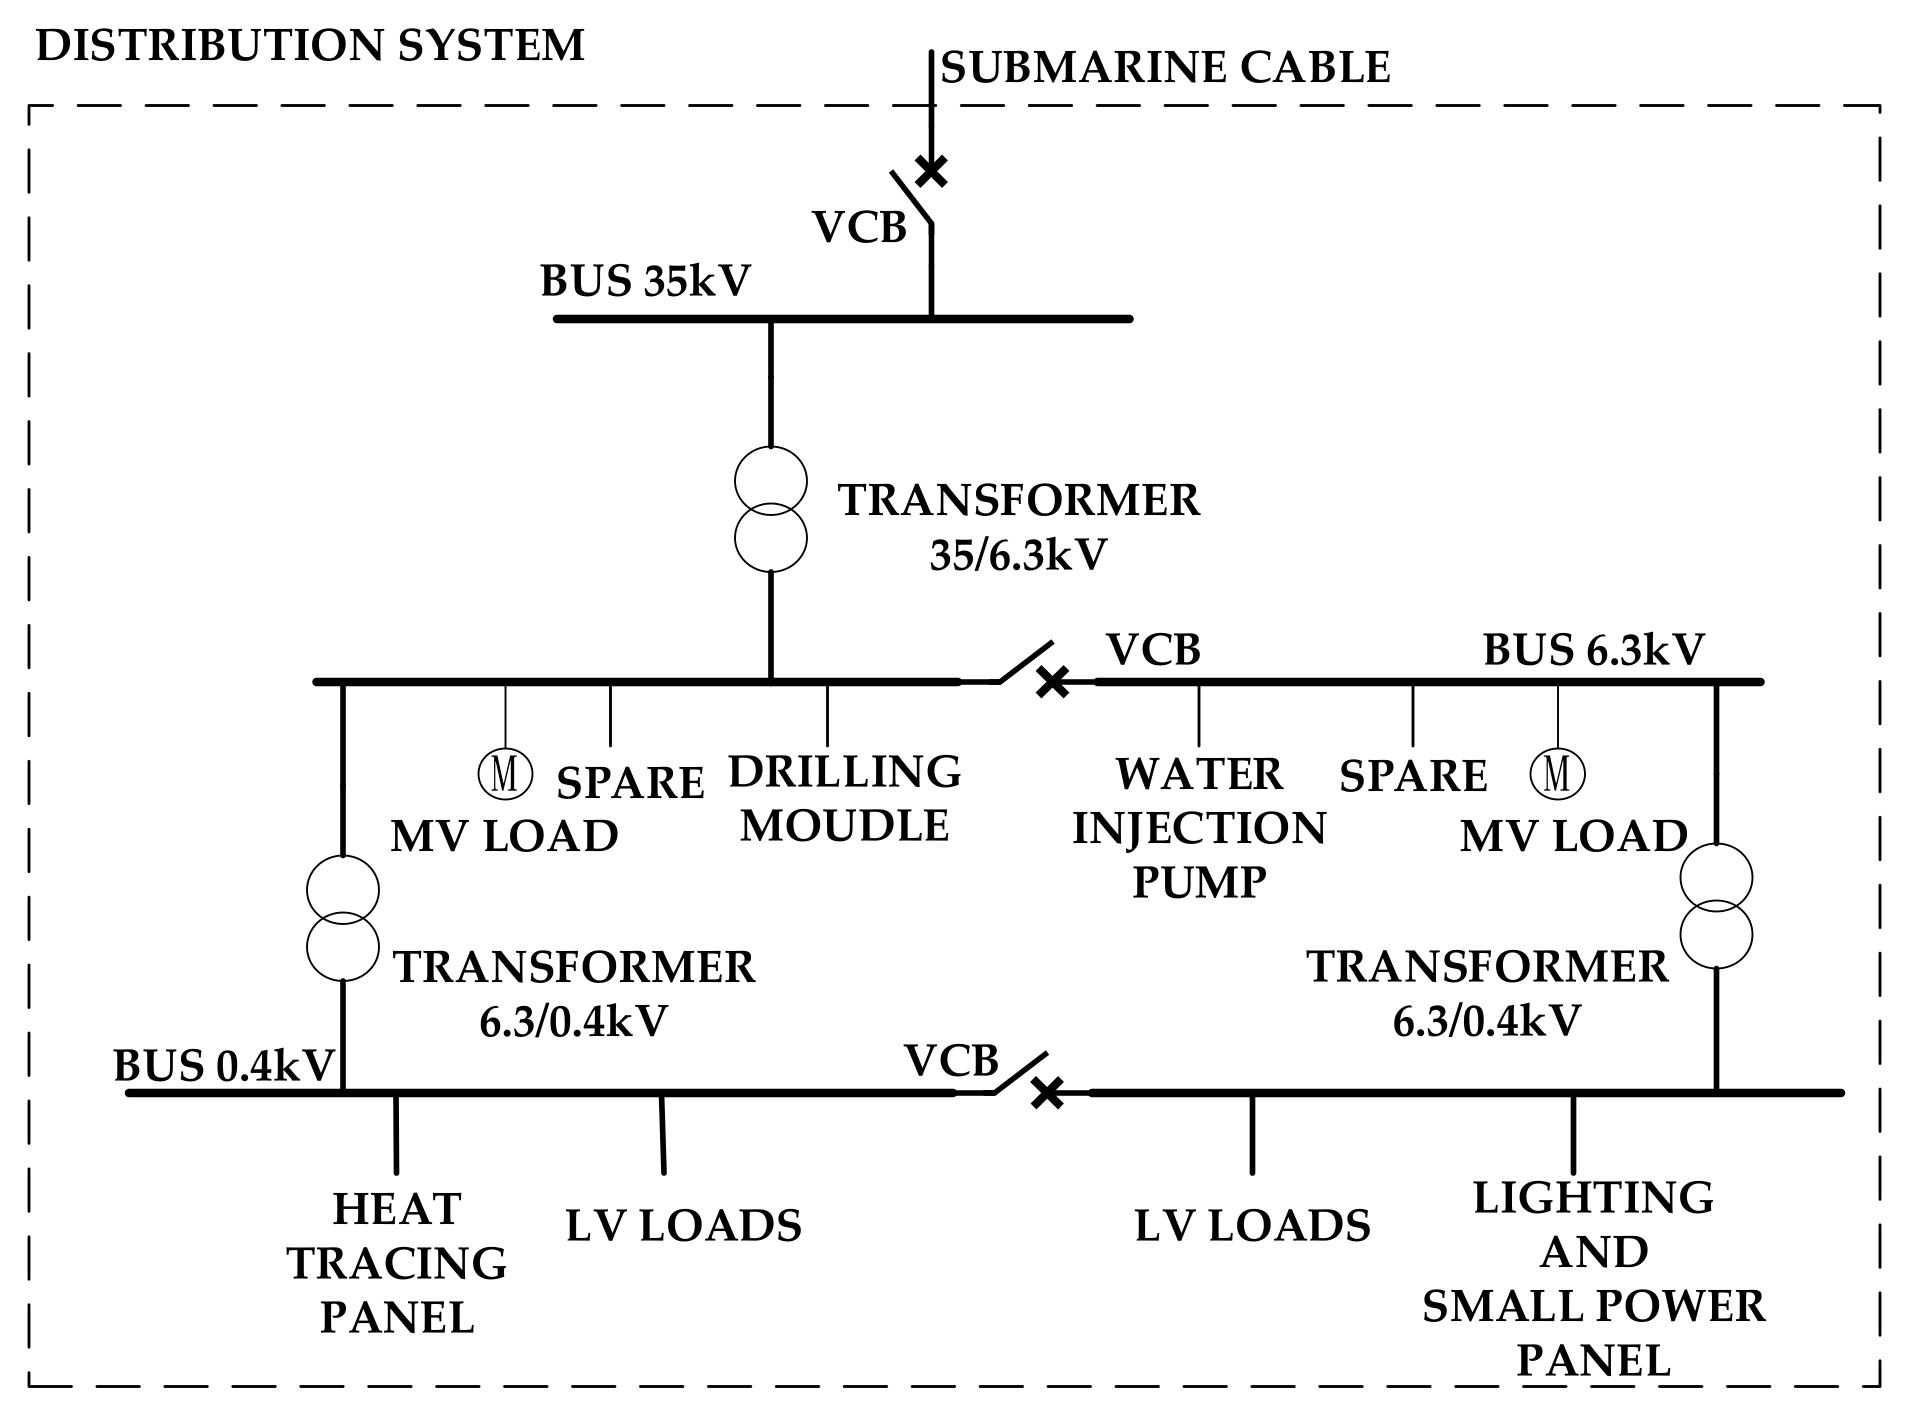
In this paper, the distribution system outage table is acquired by the state enumeration method [35]. The wellhead platform (WHP) generally obtains electricity from the central platform (CEP) through submarine cables. A small number of high power devices are connected to the medium voltage bus, while the rest of the common devices are connected to the low voltage bus. The low-voltage equipment has a large number but a small total power. Once the submarine cable fails, especially in winter, temporary low-voltage generators could be transferred to the WHP by ships to protect the oil pipeline from freezing and blockage. In addition, in order for its important loads to operate smoothly, WHP is equipped with emergency generators and energy storage batteries for the central control system. Moreover, redundant control is normally adopted on offshore platforms. Therefore, line capacity constraints are no longer relevant. Its reliability is equivalent to the graph connectivity. A typical distribution system is shown in Figure 3.
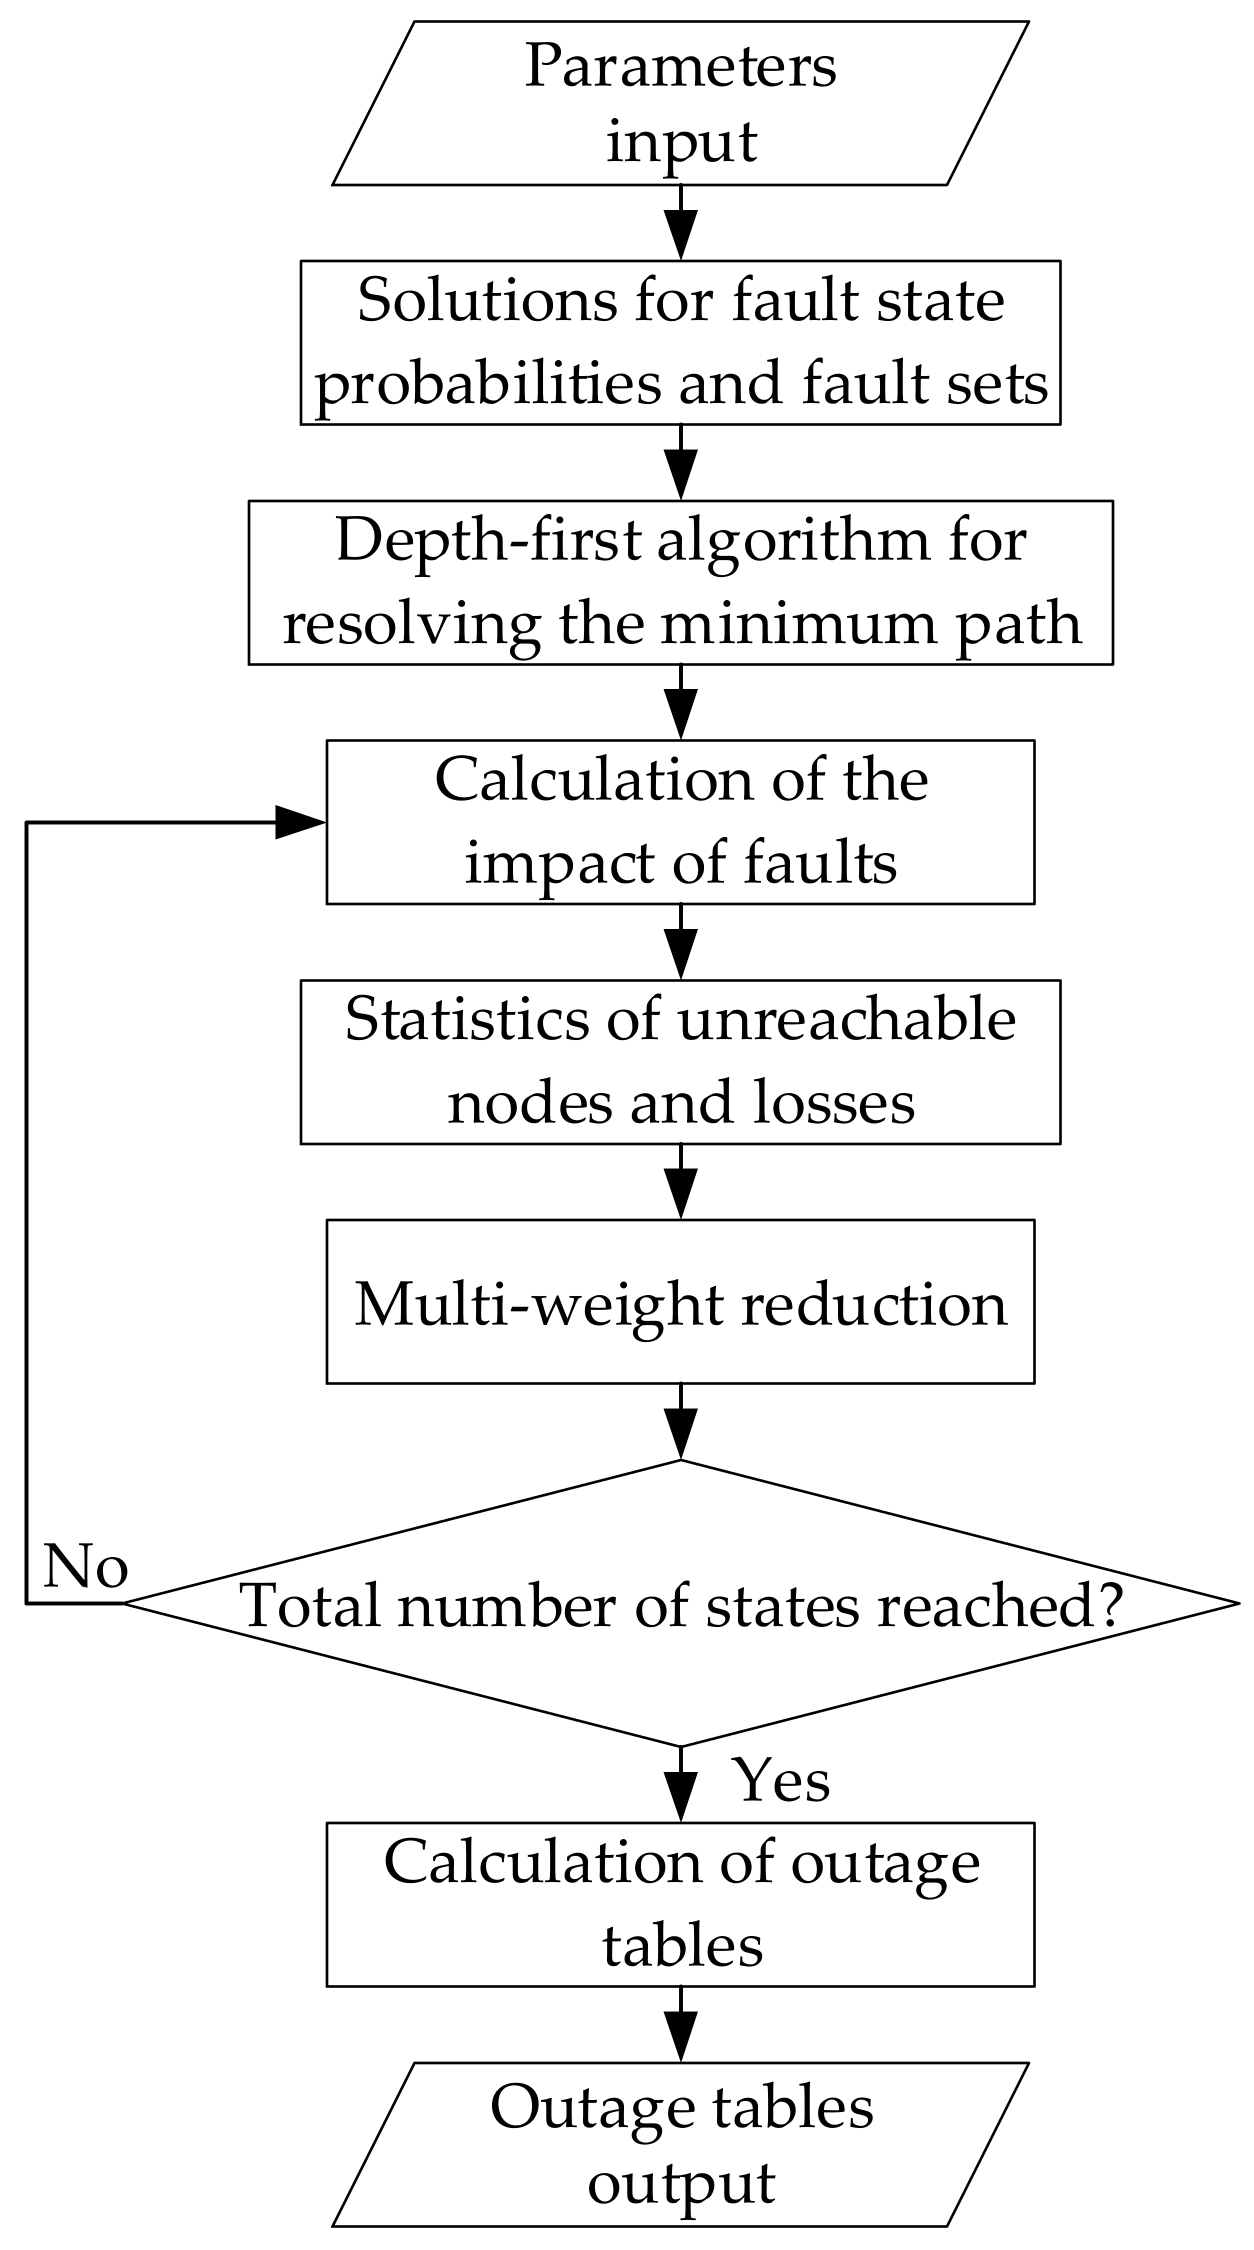
The relatively small amount of buses on each WHP and CEP signifies the low computation of state enumeration method. Correspondingly, it is convenient to apply the state enumeration method to establish the distribution system outage table. Firstly, the path sets are attained by the depth-first algorithm. Secondly, the various possible states of all components are enumerated and combined from one to multiple faults. Thirdly, the output power and probability for each state are calculated. Finally, the outage table is composed by summarizing the system status according to the output power.
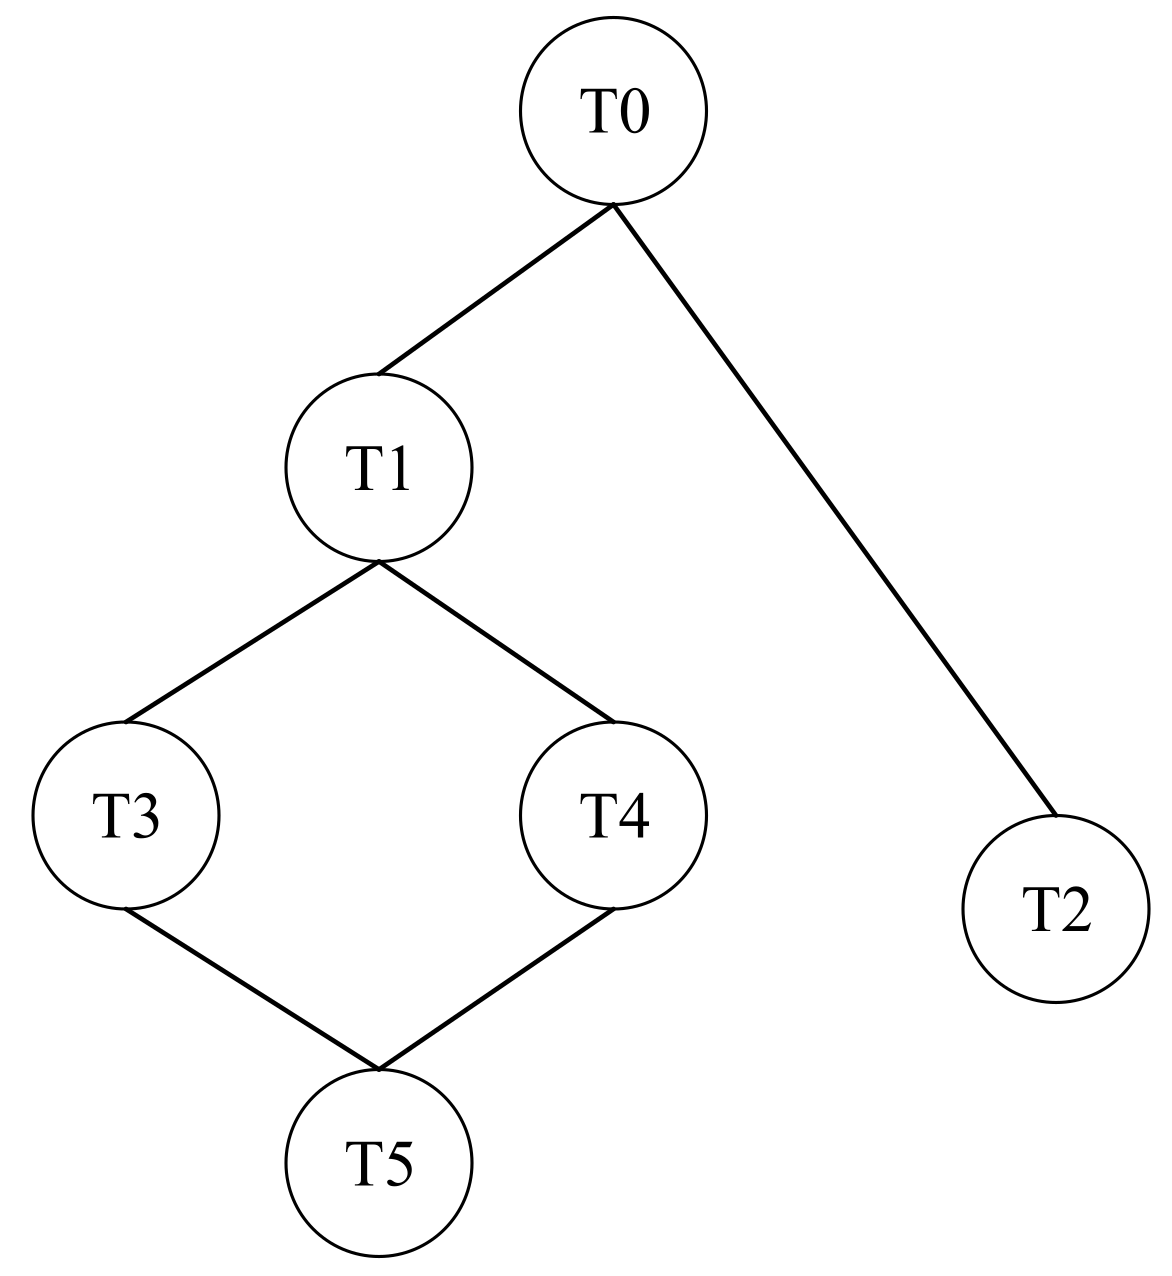
The depth-first algorithm is a type of search method [36], the basic principle to traverse all the points in a topological graph along a path from a vertex. Each point is traversed only once. Taking Figure 4 as an example, the traversal order in the diagram is T0 → T1 → T3 → T5 → T4 → T2.
In accordance with the above algorithm analysis, the flow chart of the state enumeration method based on the depth-first algorithm proposed in this article is shown in Figure 5. The outage table of the distribution system is acquired by this method.

2.3. Overall Power System Reliability Index Structure

The overall power system reliability index structure is established in this paper. In the index structure, the fault indicators and load shedding indicators are separately counted, as shown in Table 1. The first two columns in Table 1 show the system indicators and their definitions. The third and fourth columns show the indicators obtained at each sampling. The fifth column shows the formulae for calculating the system indicators with the sampled indicators.

2.4. Optimal Load Shedding Model

2.4.1. Priority Decoupling Scheme

When the generator set fails or the system splitting occurs due to the transmission line failure, a number of loads should be shed to maintain the stability of the overall system. There is a large amount of mature research on load shedding models, especially those targeting onshore grids.
In [30], a load shedding model was developed based on the DC power flow by combining the linear programming method with the sensitivity analysis. The number of control variables and branch capacity constraints in the model was reduced, achieving a simplification of the problem. Literature [37] proposed a method for load shedding based on the principle of regional proximity, which solved the minimum load shedding based on the DC power flow. According to the regional proximity principle, the load shedding nodes were no longer searched for on a system-wide basis, which decreased time for the system state analysis. Literature [38] presented an algorithm for calculating the worst load growth direction based on the saddle point bifurcation theory and the singular value decomposition theory of the trend Jacobi matrix. The corresponding optimal load shedding model could obtain more load margin increase with less amount of load shedding.
Literature [39] took into account the influence of frequency and voltage stability on the load shedding process and investigated the relevant shedding methods. Literature [40] investigated load shedding models for power systems containing distributed generators and proposed a hierarchical partitioned emergency load shedding system architecture. A load shedding optimization model considering the external network equivalence was developed in each partition. Literature [41] proposed a hierarchical load shedding model for different voltage levels in the power system. An improved particle swarm algorithm is applied to build an optimal load shedding scheme for systems of voltage levels below 500 kV. In addition, there are many studies on optimal load shedding models based on different objectives [42,43].
As can be seen from the above studies, the load shedding model mainly takes the minimum load shedding amount as the objective function, while the constraints change depending on the focus of the research problem. For the offshore oil platform power system, in addition to considering the general constraints, the operation process that is different from the large onshore grid makes it necessary to establish a load shedding model integrated with actual production.
In view of the fact that everything in the offshore power system is centered on ensuring production safety, when a fault requiring load shedding occurs, the measure taken is to apply the principle of priority decoupling for load shedding [44].
The priority decoupling operates on all types of equipment of the offshore electric system. In principle, the equipment with a power of more than 50 kW is included in the scope of decoupling. The equipment can be summarized by function into several systems of varying importance, as shown in Table 2. Smaller values in the first column of Table 2 indicate that the equipment is of lower importance and is preferentially removed in actual load shedding.
When formulating the priority of these devices in decoupling, it is generally set in the order of safety, production, and auxiliary. Furthermore, the loads of some specific equipment cannot be heavily cut to prevent the entire platform from being decoupled.
During load shedding, all lower priority loads are removed before higher priority loads are removed. Generally speaking, the heating equipment is cut first, followed by the water injection system equipment, the gas system equipment, the utility system equipment, the main process system equipment and electric pumps on WHP, the main process system equipment and drilling system on CEP. In this paper, a total of 15 decoupling levels from 1 to 15 are arranged.

2.4.2. DC and AC Constraints

According to the above-mentioned features of the load, the minimum load shedding model based on the priority decoupling sequence of DC power flow and AC power flow are established separately by modifying the minimum load shedding model of DC power flow.
  • Objective function:
    min o = 1 N d r o
    where ro is the load shedding amount of the node o; Nd is the amount of load nodes.
The DC constraints are as follows:
  • DC power flow equation constraint
    B θ = P g P d + r
    where θ is the node phase angle vector; B is the node admittance matrix; Pg is the generator output vector; Pd is the active load vector; r is the load shedding vector; ro is the element of r.
  • Decoupling level constraint
It is indicated from Constraint (3) that loads in the s+1 decoupling level cannot be cut off before all loads in the s decoupling level are cut off.
U s + 1 , n U s , m U s , m 0 , 1
where Us,m is a 0–1 variable, which demonstrates whether the m-th load in the s-th level is permitted to be decoupled; s = 1,…,smax-1; m = 1,…,Ns; n = 1,…,Ns+1; smax is the maximum level in the priority decoupling; Ns is the number of the s-th level loads.
  • Composition constraint
Constraint (4) indicates which levels of load in the priority decoupling sequence the load shedding vector consists of.
r = s = 1 s max m = 1 N s U s , m R s , m R s , m R
where Rs,m is the vector represented by the m-th load of the s-th level in the priority decoupling sequence. This vector is a column vector with only one non-zero element, which represents the amount of load shedding at a node, corresponding to a certain device or a certain type of low voltage load on the platform. R is the vector set representing all loads in the priority decoupling sequence.
  • Remaining DC constraint
    P g min P g P g max
    0 r P d
    P l P l max
    where P g min and P g max are the lower and upper limits of output vectors for generators; P l and P l max are the branch power flow vector and the branch power flow upper limit vector, respectively.
Depending on the power flow calculation method, optimal load shedding schemes are divided into the load shedding scheme with the DC power flow calculation and the load shedding scheme with the AC power flow calculation. Currently, the state evaluation model based on the DC power flow is more common. It is due to the reality that the DC power flow constraints are equational, making the optimal load shedding problem a linear optimization problem that could be solved speedily. However, the influence of factors such as node voltage and reactive power on the optimization results is not taken into consideration in this approach [45].
As the overall power system reliability assessment is much larger in a computational scale than a single subsystem, it is required that the power flow results in the state evaluation should be closer to the actual situation. The AC power flow state evaluation model takes into account conditions such as reactive power and node voltage, which is more acceptable to the accuracy required for the overall power system reliability evaluation. However, in the large-scale power system reliability evaluation, the amount of component constraints increases with the growth of system scale. The optimal load shedding problem becomes a non-linear programming problem with a huge amount of calculation, which is difficult to attain a convergent solution. Therefore, it is rarely utilized in the overall power system reliability assessment of large power systems.
In contrast, the offshore electric system is a small power system compared to the onshore power grid. It does not suffer from convergence problems. In this paper, according to the grid structure of the offshore oil platform and the actual production situation, the optimal load shedding model based on the AC power flow is further proposed by improving the DC power flow load shedding model. Among its constraints, the objective function, the decoupling level constraint, and the composition constraint remain consistent. The different constraints are as follows:
  • AC power flow equation constraints
    P gi P d i + c i V i j i V j G i j cos θ i j + B i j sin θ i j = 0
    Q gi Q d i + ω i c i V i j i V j G i j sin θ i j B i j cos θ i j = 0
    ω i = Q d i P d i
    where θ is the node phase angle vector; B and G are the node admittance matrices; Pg is the generator output vector; Pd is the active load vector; c is the load shedding vector.
  • Generator output constraint
    P g min P g P g max
    Q g min Q g Q g max
    where P g min and P g max are the lower and upper limits of active outputs for generators, respectively; Q g min and Q g max are the lower and upper limits of reactive outputs of generators, respectively.
  • Active load constraint
    0 c P d
This constraint indicates that the load shedding amount does not exceed the active load of the node.
  • Branch capacity constraint
    P l P l max
    where P l and P l max are the branch flow vector and its upper limit, respectively.
  • Node voltage constraint
    V min V V max
    where V min and V max are the lower and upper limits of node voltages, respectively.
By solving the above non-linear model, the optimal load shedding volume is acquired for a fault condition where load shedding is requested.

2.4.3. Subsystem Simulation Characteristics

The influence of standby units and system splitting on the decoupling sequence should be considered in the simulation of generation and transmission systems. After validating the amount of shutdown units and the duration of the outage, the status of standby units would be judged to confirm the startup amount of standby units and remove the same number of failed units. In the event of islanding of the power system, the priority decoupling sequence is separated according to the subsystem after islanding.
The impact of cascading faults on the overall power system is involved in the distribution system simulation. The cascading fault is the fault that spreads from the distribution system into the composite system [46]. It specifically refers to the failure of the generation or transmission system connected to a platform as a result of a fault or overhaul of the breakers and buses on the generator outlet side and terminals of the transmission line in the distribution system of that platform [47,48]. This fault could lead to the loss of power to that faulty platform itself or even to the power failure to adjacent platforms and the entire system splitting.
At the end of the distribution system simulation, the status of the components associated with the cascading fault is assessed based on the current sampled distribution system status to determine whether a cascade failure has occurred or not. If it occurs, the corresponding generator and submarine cable faults and fault duration are entered into the generation and transmission system state assessment to record the relevant indicators.

3. Results

3.1. Introduction to the Calculation Example

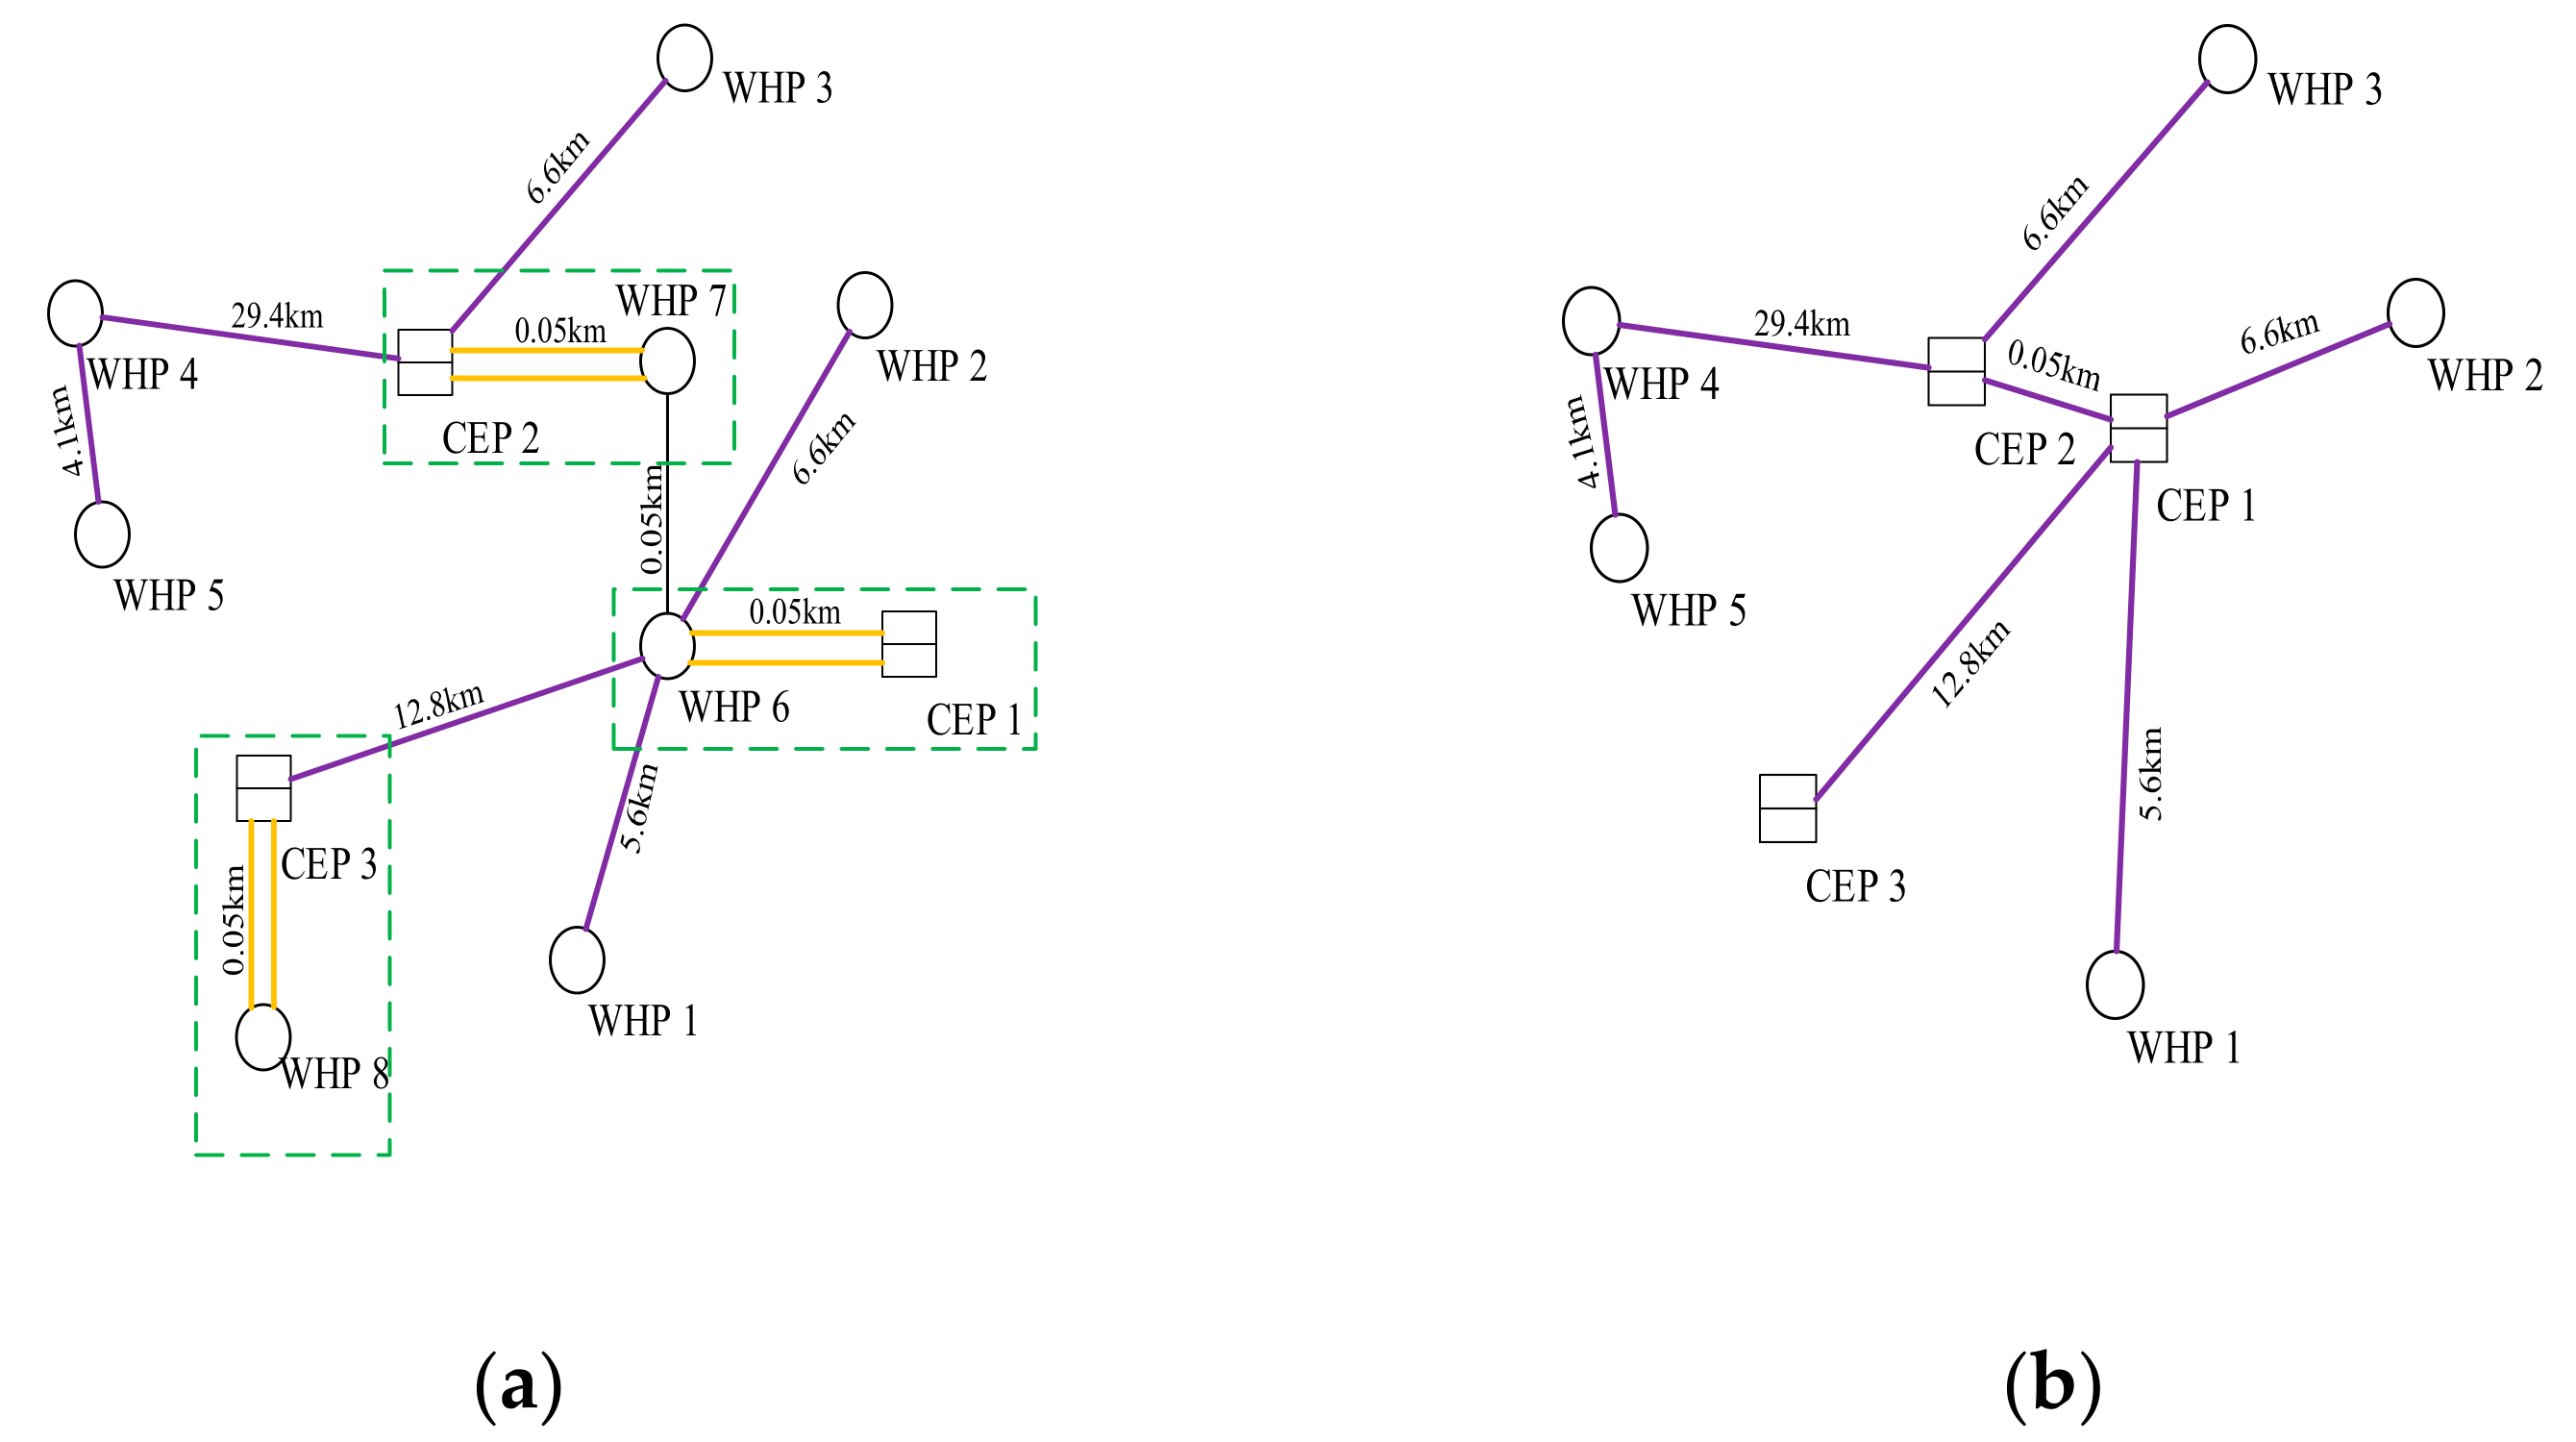
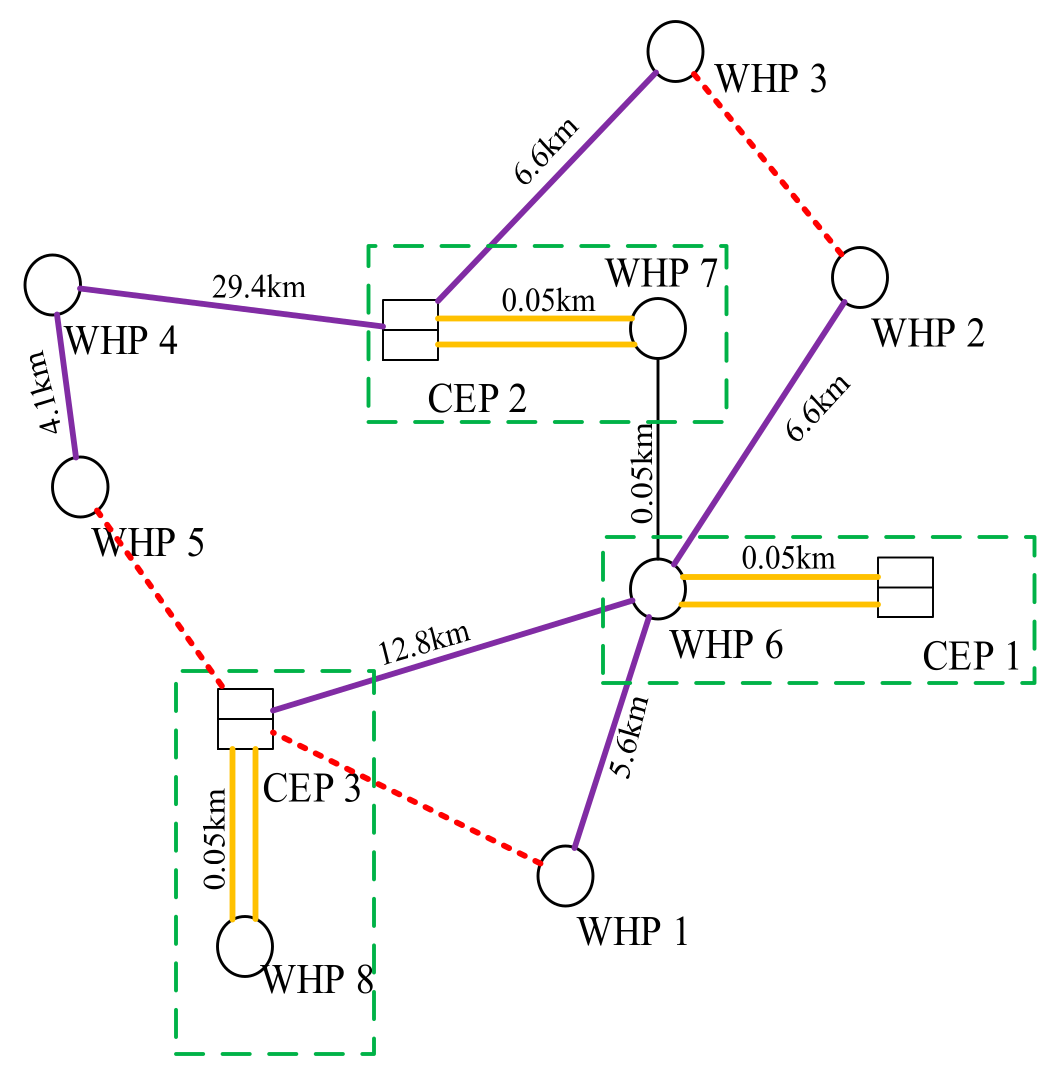
The power system of an example offshore oil platform is employed to validate the proposed method. As shown in Figure 6b, the simplified system contains three CEP platforms and five WHP platforms.
In Figure 6, each purple single line represents a submarine cable, connecting two platforms far apart, while each orange double line represents a bridge, connecting two platforms close together. The installed capacity of the generator sets is 4 × 13 MW, 2 × 13 MW, and 3 × 13 MW at CEP1, CEP2, and CEP3, respectively.
The individual generation capacity is based on the maximum summer output and the load on the platform is based on the maximum summer load, as shown in Table 3.
The reliability parameter in the evaluation is obtained from the statistics of fault logs and maintenance schedules of oil fields within a bay [49,50], which is shown in Table 4. The submarine cable model is a linear model related to length, with L denoting the actual length.

3.2. Example Results and Analysis

The non-sequential hybrid method is adopted to assess the reliability of the example, and the number of sampling is 100,000. The partial outage table of the distribution system is shown in Table 5.
The assessment results of the overall system are shown in Table 6, where they are calculated by the DC power flow and AC power flow priority decoupling schemes separately.
It can be seen from Table 6 that in the index (AC power flow), the LEEENS of the overall system is 980.89 MWh, and ASAI is 98.36%. According to the annual development report of Chinese power industry, the national average power supply reliability rate in 2019 is 99.84% [51]. It is indicated that the ASAI of offshore power system in the example is relatively low, and LEEENS accounts for a higher proportion of annual electricity consumption. Therefore, some measures are requested to be taken to improve the system reliability. It is necessary to analyze the weakness in the overall system to efficiently improve its reliability.
In addition, there are differences between indicators (AC power flow) and indicators (DC power flow). The difference mainly arises from the power flow constraints in the load shedding model. Firstly, in the DC power flow, it is assumed that the node voltages are around the rated voltage value when the power system is in operation. The node voltages are simplified to 1. Therefore, the more the node voltages deviate from the rated voltage in the actual operation, the greater the resulting error. Secondly, the branch resistance in the DC power flow is considered to be extremely smaller than the reactance. Accordingly, the resistance is normally ignored. In practice, however, the line resistance does not converge to 0 infinitely. It could cause large errors, which is related to the ratio of line reactance to resistance. Finally, the simplified process of DC power flow makes both the reactive power and network losses zero, which might be different from the actual situation, and ultimately result in errors in indicators.
As shown in Table 7 and Figure 7, the PREPSF of the distribution system is exceedingly higher than that of other subsystems, accounting for 78.94% of the total number of failures. The reason for this phenomenon is that the distribution system in the offshore electric system is more complex and contains a greater number and variety of components than the other subsystems. The DADSF of the transmission system is the highest and accounts for the largest proportion of the total failure time. It is due to the significant amount of time required for fault location, submarine cable procurement, and reassembly as a submarine cable fails, which far exceeds the fault repair time for any other component.
The load shedding indexes of each subsystem are listed in Table 8. Since there are certain cold and hot backups in the offshore power system, PREPLC and DADLC of the generation system are considerably smaller than PREPSF and DADSF. Correspondingly, LEEENS caused by them is also smaller. For the distribution system, there is the complex network structure that allows for the occurrence of diversions. Although the percentage of failure numbers is relatively higher, the PREPSF and DADSF of the distribution system are larger than PREPLC and DADLC, and the resulting LEEENS is comparatively small.
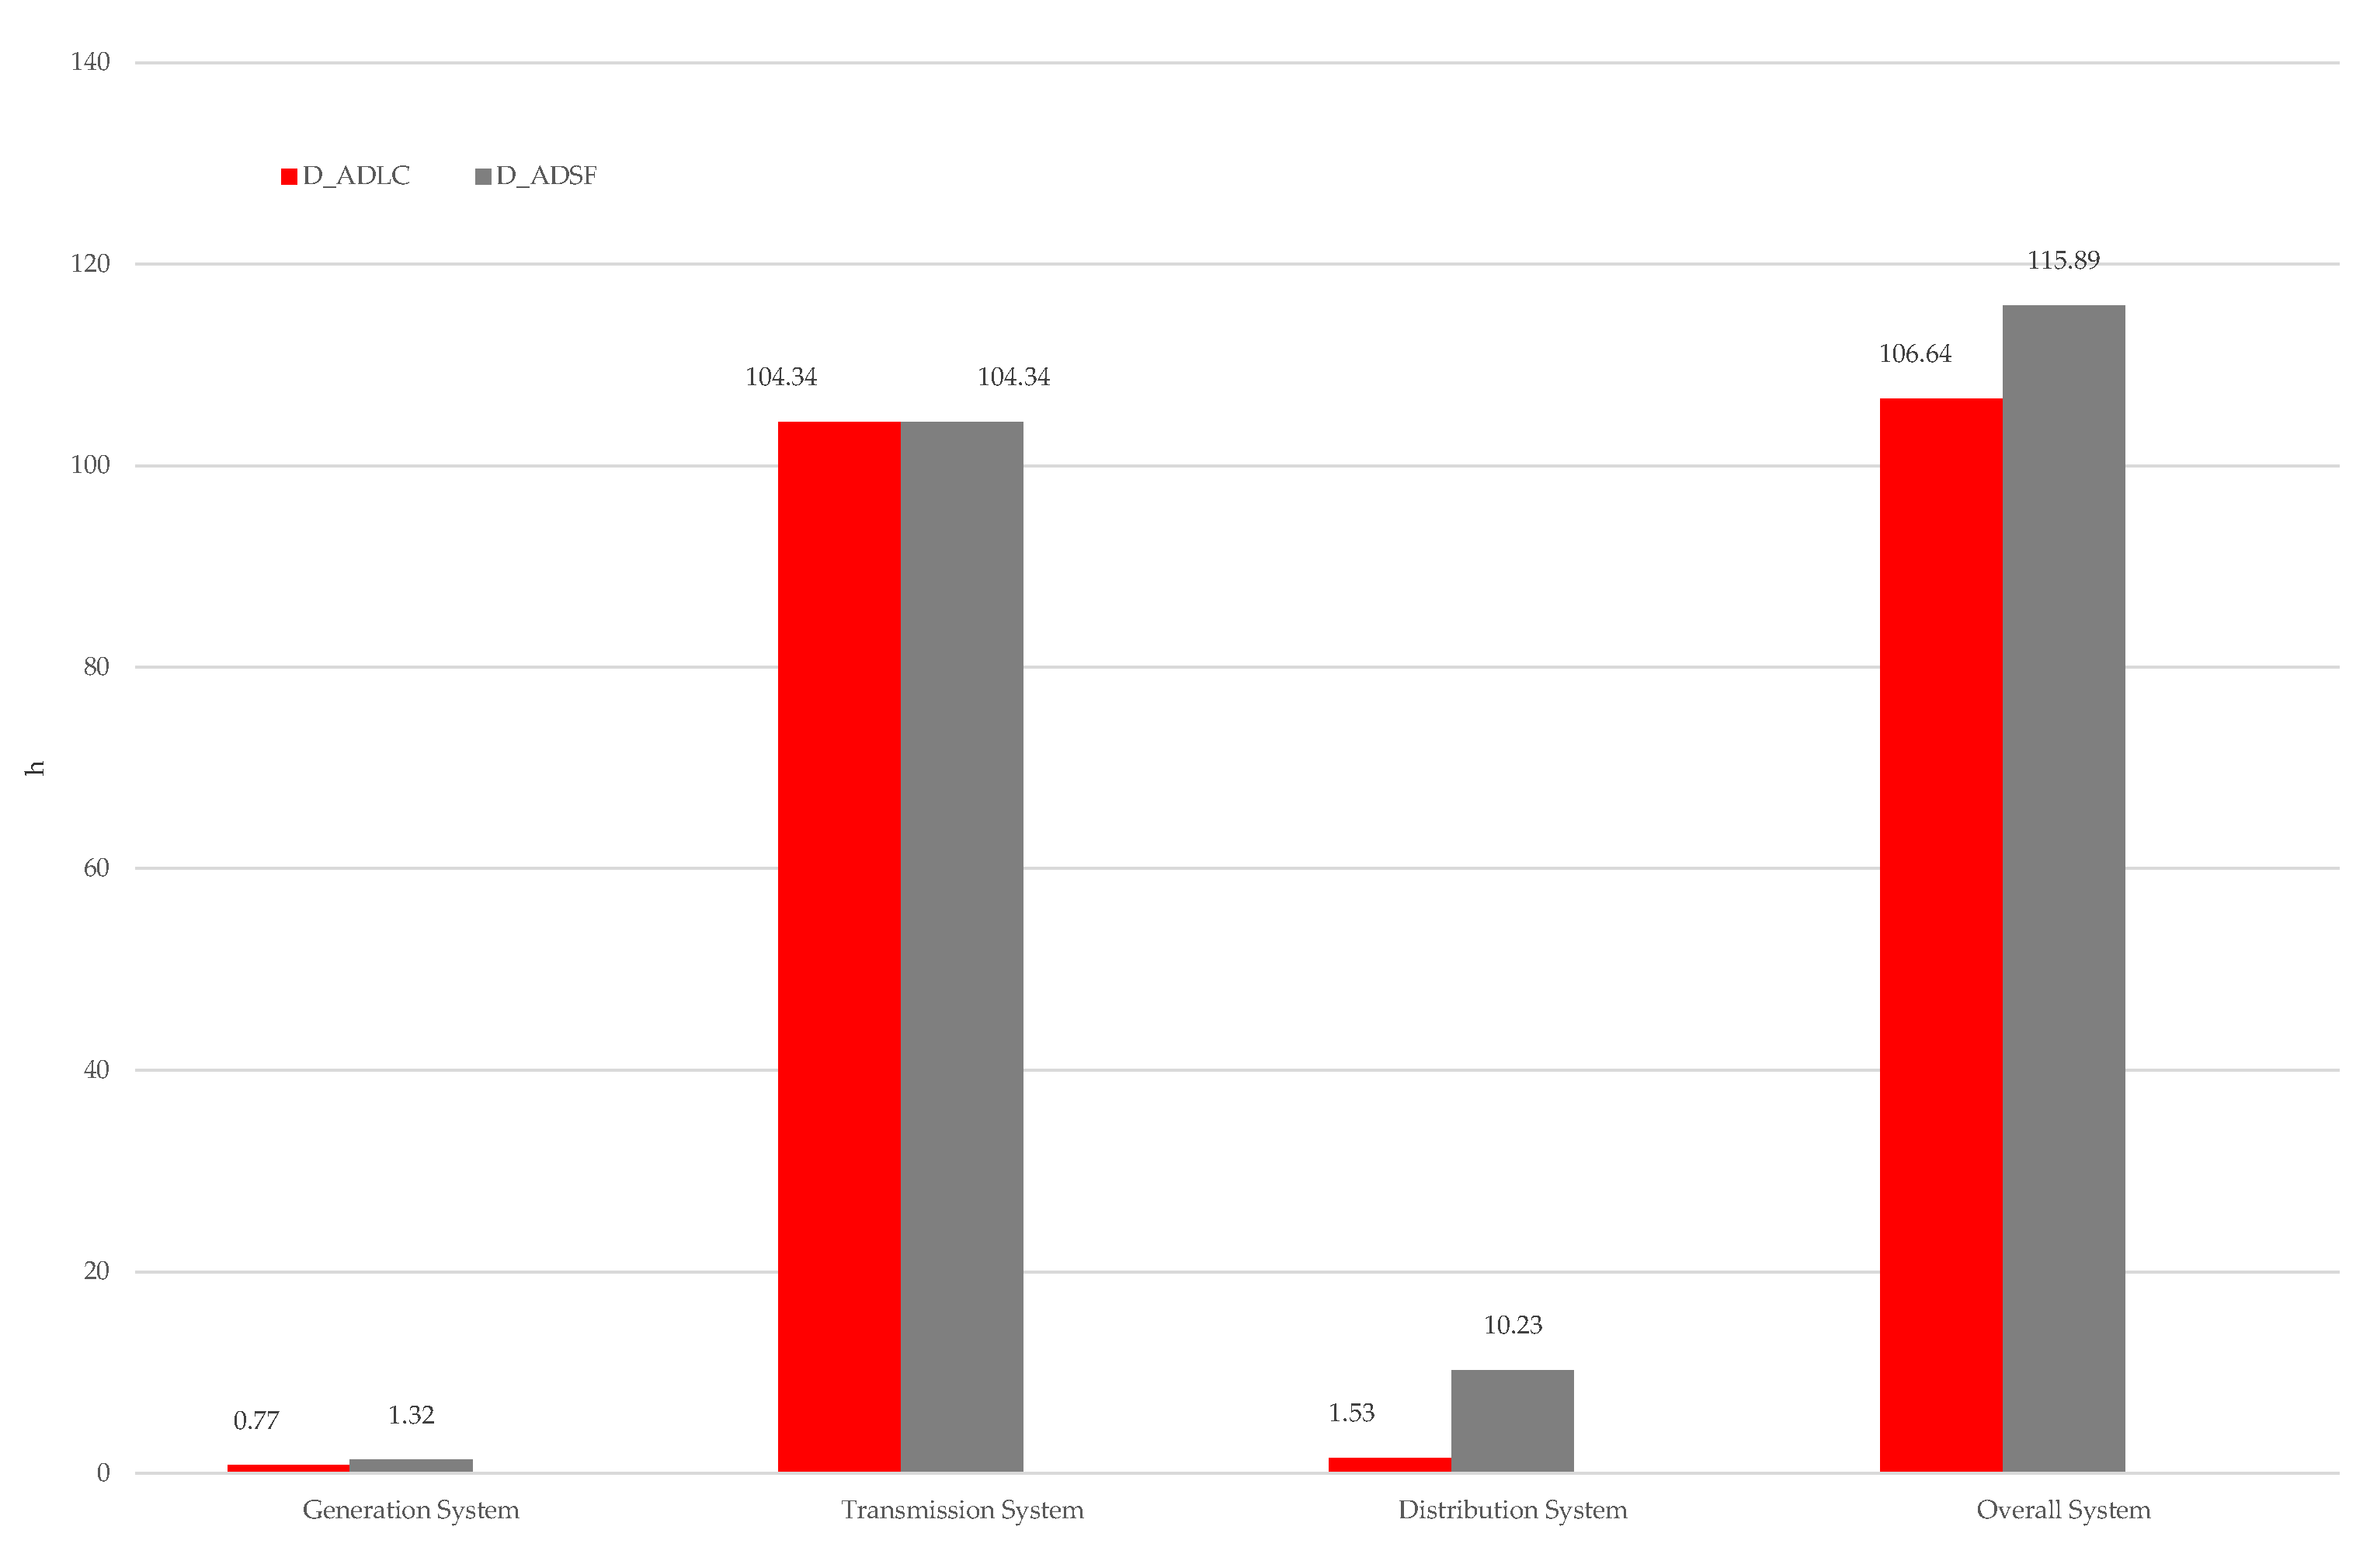
The weak overall electrical interconnection of the offshore power system in the example suggests that a failure of any of submarine cables could lead to the system splitting. Hence, in the event of a fault on the transmission system, the overall system stability would be maintained through load shedding. As shown in Figure 8 and Figure 9, for the transmission system, its PREPSF is equal to PREPLC and its DADSF is equal to DADLC. Compared to the distribution system, there is a lower PREPSF but a higher DADSF in the transmission system due to the fact that the fault location and repair of submarine cables in special operating environments is time consuming. It is also the reason why there is a lower percentage of PREPSF, but a higher percentage of DADLC and LEEENS in the transmission system.
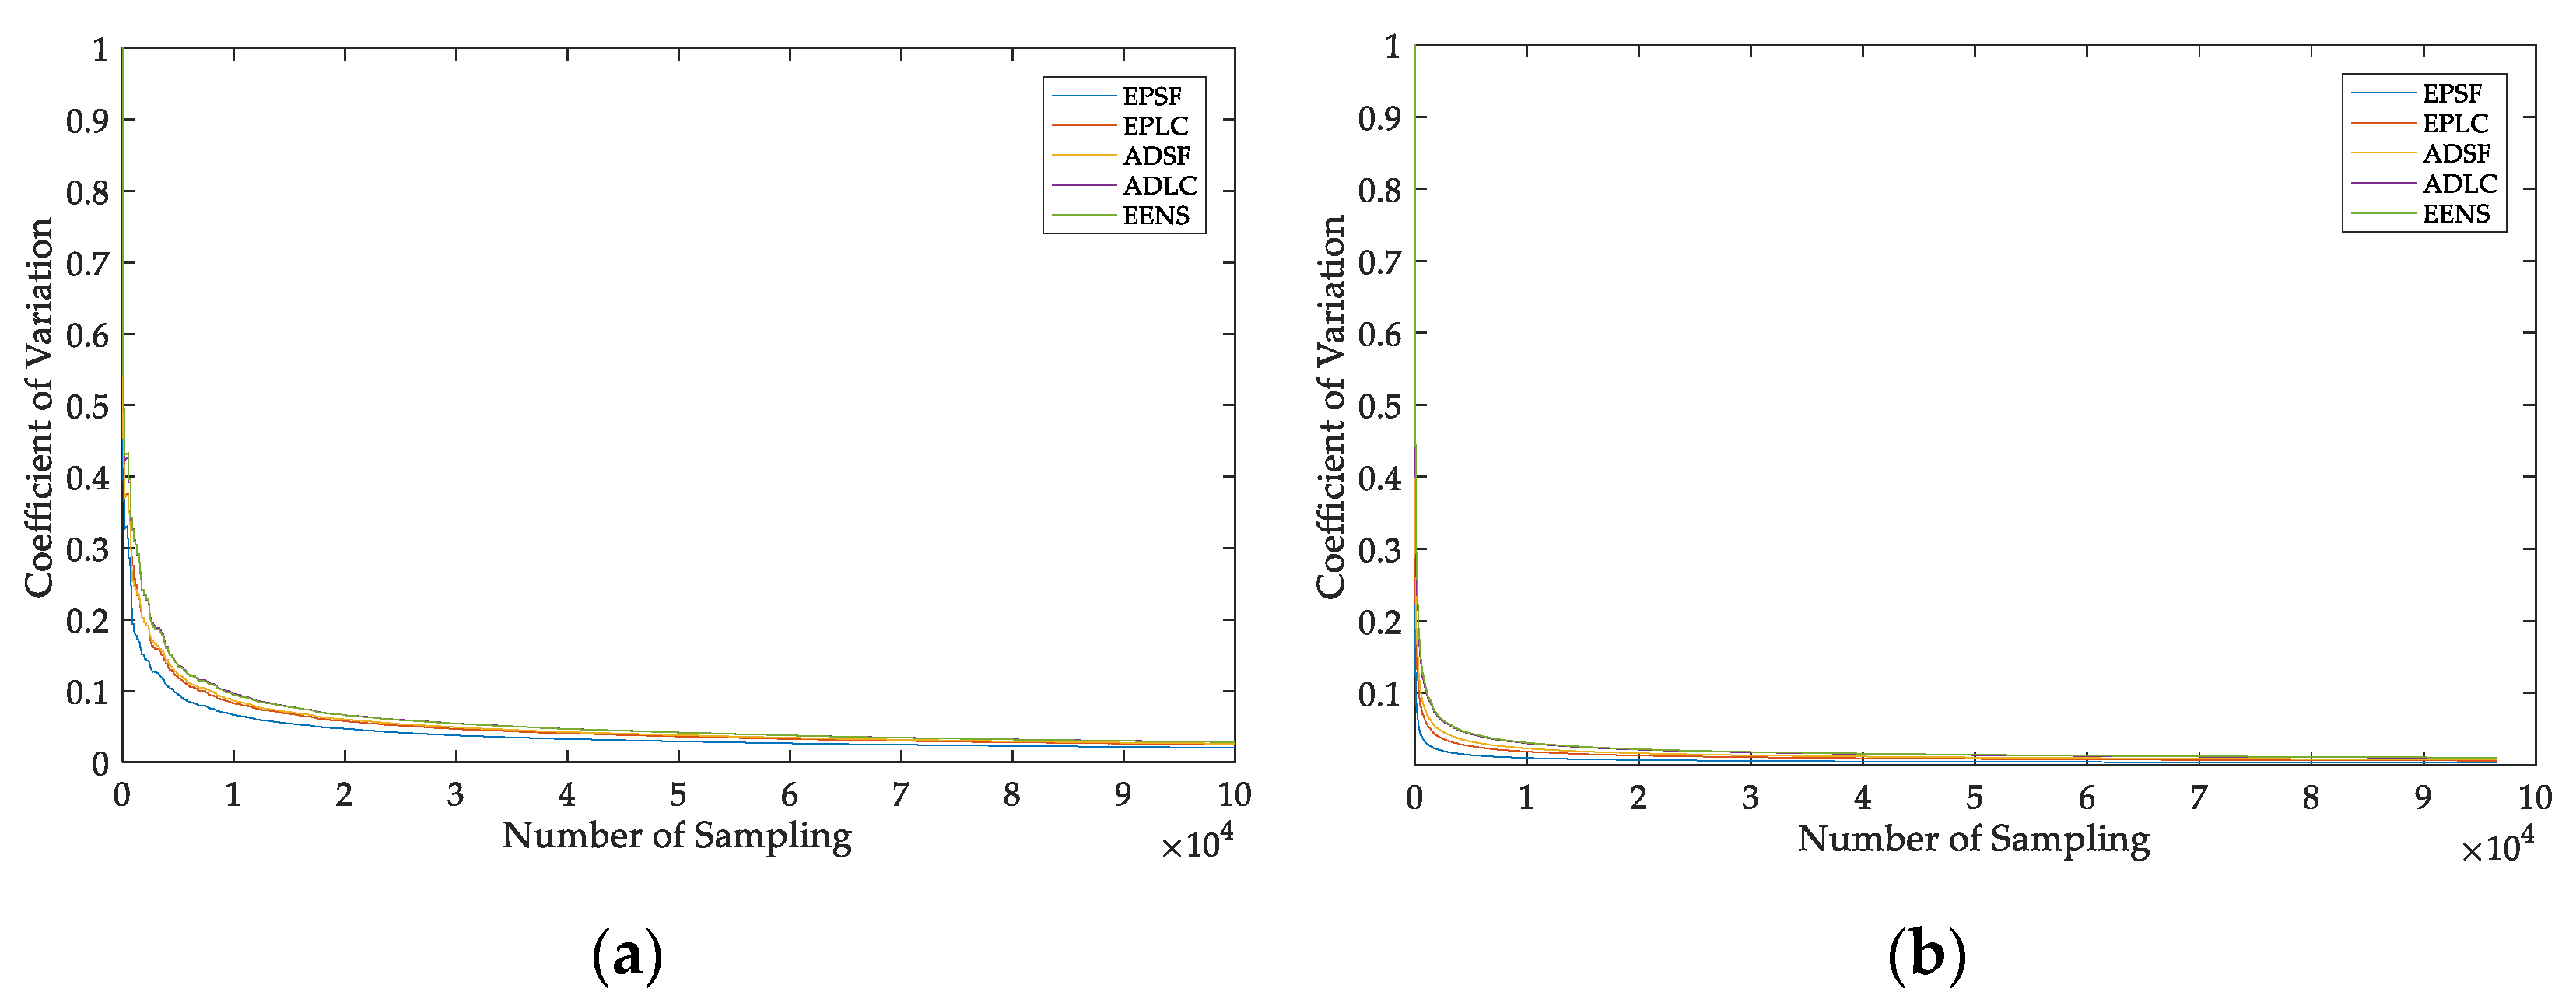
The convergence process for 100,000 samples is shown in Figure 10, with all upper bounds on the variance set as 0.01. As 100,000 samplings are performed on the same type of computer, the CPU calculation time was 15,468.6 s for the simulation method and 1593.1 s for the hybrid method.
Compared to the simulation method, for the same sampling accuracy, the hybrid method proposed in this paper requires less sampling. It contributes to a swifter convergence of the evaluation process and a shorter computation time.

3.3. Measures to Improve Reliability

The above analysis reveals that the generation, transmission, and distribution systems all have an impact on the reliability of the overall power system, with the transmission system having the greatest impact. From the perspective of components, reducing the failure rate of essential system equipment such as turbine units, electric submersible pumps and submarine cables, conducting fault diagnosis and prediction, and adopting targeted operation and maintenance measures are beneficial to reduce the incidence of faults and improve the system reliability. For example, the stock regulation before a fault expands or a shutdown could reduce the outage preparation time [52]. This is particularly important for submarine cables. Submarine cables are not normally stocked for offshore oil platforms. In the event of a transmission line failure resulting in a power failure on the platform, it would take a significant amount of time to reacquire and install the submarine cable. Anticipating faults shorten the acquisition time, which in turn indicate that the repair time for submarine cable faults is reduced.
From the perspective of structure, measures such as the conversion of the distribution system from single to double bus sections are conductive to improving system reliability. The related measures of the transmission system at the structural level are mainly discussed in this paper.
The transmission line connection modes adopted by the onshore power system to improve the reliability are mainly triple chain, double chain, double ring network, single ring network, and double radial network [53]. However, the chain connection modes have power supplies at both ends. The mutual support between the power supplies is weak and does not solve the problem of low spare capacity of a single subsystem in the case of line failure.
The single ring network, double ring network, and double radial network are the line connection modes that could be considered for this system. A schematic diagram of the line connection modes is shown in Figure 11.
In this system, the double radial connection requires a new 12.8 km submarine cable between WHP 6 and CEP 3 in addition to the existing submarine cable. The single ring connection requires a 13 km submarine cable from WHP 1 to CEP 3 or a 4 km submarine cable from WHP 2 to WHP 3 or a 17.5 km submarine cable from WHP 5 to CEP 3. The double ring connection refers to the installation of any two submarine cables in the single ring connection.
Although the double ring connection mode is highly reliable, the large construction costs of submarine cables contribute to the low economic viability. The double radial connection mode increases the transmission capacity of the line between CEP 3 and CEP 1, reducing the load factor on the line in the event of a total outage of the generators of CEP 3. Furthermore, the double radial connection requires a spare line for the bridge between WHP 7 and WHP 6 to address the lack of spare capacity on CEP 2 in the event of a bridge failure. The single ring connection enables the three CEPs to support each other. It solves the problems of insufficient spare capacity and insufficient transmission capacity of the lines. Both single ring connections and double radial connections involve the installation of an additional submarine cable. However, the length of the additional cable is long with the double radial connection. In addition, the single ring connection mode eliminates the requirement to provide spare lines for the bridge, which reduces the volume of construction work.
Among the additional submarine cables, the 13 and 17.5 km submarine cable type is 3 × 300 mm2 and the construction unit price is 1.75 million yuan/km, while the 4 km submarine cable type is 3 × 120 mm2 and the construction unit price is 1.05 million yuan/km. Considering the relationship between the geographical location of each platform and the cost of submarine cables, the single ring connection mode is the optimal mode for this system. The overall system reliability results before and after the ring network and the construction cost of the submarine cables are shown in Table 9.
According to Table 9, the addition of one or more submarine cables to the system results in a slight increase in DADSF, but a significant decrease in DADLC and LEEENS of the overall power system. It is indicated that the power supply and reliability of the entire system after the ring network are improved. The reliability enhancement varies between connection modes. The option with the largest reliability improvement as assessed in Table 9 is the laying of a 17.5 km long submarine cable at WHP 5 and CEP 3. It is indicated that the ring network with the largest reliability improvement implies larger construction costs. However, the reliability of the power system of an offshore oil platform is closely related to the crude oil productivity as it is both a producer and consumer of electricity. Therefore, the ring network is feasible from a reliability point of view as well as from an economic point of view due to the long-term economic benefits it could provide.

4. Conclusions

In this paper, the overall power system reliability assessment method based on the non-sequential hybrid theory is proposed, which focuses on the composition feature and the operation characteristic of offshore electric systems. As the reliability of the generation, transmission, and distribution systems are assessed simultaneously, it is possible to acquire accurate reliability indicators for the overall system and each subsystem by this approach. The conclusions are as follows:
  • In the process of condition assessment, an optimal AC power flow load shedding model is developed in this article, which reflects the characteristics of the offshore platform power system structure and its load equipment. Meanwhile, it takes into account the decoupling priority level of the offshore oil platform, which covers the requirements of the process of oil and gas production for the load shedding process. Compared to the DC load shedding model where simplified conditions exist, the ASAI obtained by the AC load shedding model in the overall system reliability assessment is lower, which is more realistic;
  • The hybrid method is utilized in this article for the simulation sampling process of the overall system. The analytical method is applied to obtain partial information before sampling, which enables the speed of sampling to be increased. It is achieved by establishing the outage table of each distribution network through the analysis method and conducting the Monte Carlo simulation on the overall system to derive final results. The CPU computation time for the overall system reliability assessment with the simulation method is 15,468.6 s, while the CPU computation time with the hybrid method is merely 1593.1s. It is indicated that the hybrid method compresses the state space, which largely simplifies the sampling and judgment of the simulation method with an efficient computation;
  • DADSF of the overall system is larger than DADLC, and PREPSF is larger than PREPLC. The reasons for this phenomenon are, on the one hand, the majority of sectionalized configuration applied for power supply in the distribution system and, on the other hand, the large adequacy of the generation system;
  • PREPLC of the overall system is relatively small. However, DADLC is quite large. The transmission system accounted for the largest proportion of DADLC at 97.84%. The particularities of the marine environment result in submarine cables being difficult to repair. Therefore, DADLC are largely due to submarine cable failures. It is indicated that submarine cables are the most vulnerable part of an offshore platform power system in terms of reliability;
  • The ASAI of the offshore platform power system is 98.36%. In contrast, the ASAI onshore China in 2019 is 99.84%. It is evident that the ASAI of the example system is relatively low, which indicates that there is potential for its reliability improvement;
  • Structural improvements to the system led to a significant reduction in DADLC, from 106.64 h to as low as 50.71 h. It demonstrates that the ring network is an effective measure to improve system reliability. Considering the relationship between system reliability improvement and the cost of additional submarine cables, the single ring network connection mode is the optimal connection mode for the system. With the reliability of the offshore platform power system directly related to crude oil productivity, the long-term economic benefits of the ring network could be balanced against the cost of construction.
In summary, it is convenient to calculate the reliability index of the overall power system and distinguish the weakness of the system related to reliability by this approach. In addition to the power system of offshore oil platforms, it could also be applied to small-scale independent power systems with similar structures such as ship power systems. In view of the development schedule for offshore power systems to be connected to the shore power, the overall power system reliability assessments taking into account the shore power connection will be the next research direction.

Author Contributions

Conceptualization, J.G. and W.D.; methodology, J.G.; validation, J.G., W.D. and X.W.; formal analysis, J.G.; investigation, W.D., J.G. and X.L. (Xingyang Liu); resources, X.L. (Xue Li); data curation, J.G. and W.D.; writing—original draft preparation, J.G.; writing—review and editing, X.W., X.L. (Xianjue Luo) and X.L. (Xingyang Liu); supervision, X.W. and X.L. (Xianjue Luo); project administration, X.W.; funding acquisition, X.L. (Xue Li). All authors have read and agreed to the published version of the manuscript.

Funding

This research was funded by the National Key Research and Development Program of China, grant number 2018YFB0904800.

Data Availability Statement

Not applicable.

Acknowledgments

This research was supported by the National Key Research and Development Program of China, grant number 2018YFB0904800, through the China National Offshore Oil Corporation (CNOOC).

Conflicts of Interest

The authors declare no conflict of interest. The funders had no role in the design of the study; in the collection, analyses, or interpretation of data; in the writing of the manuscript, or in the decision to publish the results.

Nomenclature

WHPWellhead platform
CEPCentral platform
P R EPSF Probability of component failure in the system
D ADSF Mean duration of failure of components in the system
P R EPLC Probability of load cut due to failure of components in the system
D ADLC Average load shedding duration caused by component failure in the system
L P EDNS System loss power expectation in the system
L E EENS System loss energy expectation in the system
DCDirect current
ACAlternating current
ASAIAverage service availability index
LLength of submarine cable

References

  1. Li, X.; Zhang, A.; Jing, J.; Han, H. Overview of Offshore Electric Systems. Power Syst. Clean Energy 2016, 32, 1–7. [Google Scholar] [CrossRef]
  2. Gao, X.; Liu, G.; Li, X. Analysis of Shore Power Application in Offshore Oil and Gas Field. Electrotech. Appl. 2020, 39, 81–84. [Google Scholar]
  3. Du, W.; Luo, X.; Li, X.; Guan, J.; Xiong, C.; Li, D. Reliability Evaluation of Offshore Oil Platform Power System. In Proceedings of the 2019 IEEE Innovative Smart Grid Technologies—Asia (ISGT Asia), Chengdu, China, 21–24 May 2019; pp. 2754–2759. [Google Scholar] [CrossRef]
  4. Mei, S.; Zhang, X.; Cao, M. Power Grid Complexity; Springer: Berlin, Germany, 2011; pp. 161–178. [Google Scholar]
  5. Hao, K.; Khatib, A.R.; Herbert, N.; Shah, N. Case study: Integrating the power management system of an existing oil production field. In Proceedings of the 2016 Petroleum and Chemical Industry Technical Conference (PCIC), Philadelphia, PA, USA, 19–22 September 2016; pp. 1–9. [Google Scholar] [CrossRef]
  6. Cheng, L.; Liu, M.; Ye, C.; Li, Q.; Zhao, Q.; Zhou, Q.; Huang, B. Overall Voltage Level Reliability Assessment of Power System Based on Equivalent Model of Substations. Power Syst. Technol. 2015, 39, 29–34. [Google Scholar] [CrossRef]
  7. Wu, L.; Yang, M.; Wu, X.; Zhu, L.; Wang, T. Reliability Evaluation of Generation System Based on Bayesian Network Algorithms. Telecom Power Technol. 2019, 36, 5–11. [Google Scholar] [CrossRef]
  8. Wang, L.; Zhao, S.; Zhang, M. Reliability Evaluation of Transmission System Considering Weather Change. Power Syst. Technol. 2011, 35, 66–70. [Google Scholar] [CrossRef] [Green Version]
  9. Zhao, Y. Research on Complex Distribution System Reliability Evaluation. Master’s Thesis, Huazhong University of Science and Technology, Wuhan, China, January 2011. [Google Scholar]
  10. Xiao, K.; Guo, Y.; Xi, Y.; Yang, H. New Algorithm for Large Power System Reliability Evaluation. J. Tsinghua Univ. (Sci. Tech) 1999, 39, 12–15. [Google Scholar] [CrossRef]
  11. Chowdhury, A.A.; Agarwal, S.K.; Koval, D.O. Reliability Modeling of Distributed Generation in Conventional Distribution Systems Planning and Analysis. IEEE Trans. Ind. Appl. 2002, 39, 1493–1498. [Google Scholar] [CrossRef]
  12. Billinton, R.; Kumar, S.; Chowdhury, N.; Chu, K.; Debnath, K.; Goel, L.; Khan, E.; Kos, P.; Nourbakhsh, G.; Oteng-Adjeiet, J. A Reliability Test System for Educational Purposes: Basic Result. Ieee Trans. Power Syst. 1990, 5, 319–325. [Google Scholar] [CrossRef]
  13. Wang, Y.; Wan, L.; Hu, B.; Xie, K.; Xiang, B. Isolated Island Operating Characteristics Based Analysis on Reliability of Microgrid. Power Syst. Technol. 2014, 38, 2379–2385. [Google Scholar] [CrossRef]
  14. Wei, C.; Du, W.; Wang, X.; Luo, X.; Li, Q. Reliability Assessment of Offshore Oil Platform Power System Based on State Enumeration Method. In Proceedings of the 2019 3rd International Conference on Power and Energy Engineering, Qingdao, China, 25–27 October 2019. [Google Scholar] [CrossRef]
  15. Xiao, F.; Xia, Y.; Zhou, Y.; Zhou, K.; Zhang, Z.; Yin, X. Comprehensive Reliability Assessment of Smart Distribution Networks Considering Centralized Distribution Protection System. IEEJ Trans. Electr. Electron. Eng. 2019, 15, 40–50. [Google Scholar] [CrossRef]
  16. Chen, J.; Yu, T.; Xu, Y.; Cheng, X. Analytic Method for Power Supply Reliability Assessment of Electricity-Gas Coupled Energy System. Autom. Electr. Power Syst. 2018, 42, 59–69. [Google Scholar] [CrossRef]
  17. Hou, Y.; Wang, X.; Zhang, Y.; Guo, J. Dimensional Importance Based Quasi-Monte Carlo Method for Power System Reliability Evaluation. Autom. Electr. Power Syst. 2016, 40, 31–37. [Google Scholar] [CrossRef]
  18. Bie, Z.; Wang, X. The Application of Monte Carlo Method to Reliability Evaluation of Power Systems. Autom. Electr. Power Syst. 1997, 21, 68–75. [Google Scholar]
  19. Zhao, L.; Mao, T.; Xu, W.; Luan, J.; Wu, J.; Qi, G. A Review of Risk Assessment Methods for Power System. In Proceedings of the 2017 3rd International Conference on Mechanical, Electronic and Information Technology Engineering (ICMITE 2017), Chengdu, China, 16–17 December 2017. [Google Scholar] [CrossRef] [Green Version]
  20. Bie, Z.; Wang, X.; Wang, X. Study of Hybrid Method on Power System Reliability Evaluation. Electr. Power 2001, 34, 25–28. [Google Scholar]
  21. Li, Y.; Yuan, S.; Liu, W.; Zhang, G.; Teng, Y.; Chen, X. A Fast Method for Reliability Evaluation of Ultra High Voltage AC/DC System Based on Hybrid Simulation. IEEE Access 2018, 6, 19151–19160. [Google Scholar] [CrossRef]
  22. Ren, Z.; He, J.; Chen, J.; Huang, W.; Li, B. Monte Carlo-FD Comprehensive Method For Reliability Evaluation of AC/DC Hybrid Network Systems. Power Syst. Technol. 2000, 24, 13–19. [Google Scholar] [CrossRef]
  23. Yang, B. Research on Reliability Evaluation of the composite Generation and Transmission System Based on the Hybrid Method and the Control Variable Method. Master’s Thesis, Taiyuan University of Science and Technology, Taiyuan, China, May 2013. [Google Scholar]
  24. Xu, P.; Chen, Q.; Shi, D.; Zhang, H. Reliability Evaluation of Distribution System Including DG Based on Hybrid Method. Electr. Energy Manag. Technol. 2018, 6, 42–46. [Google Scholar]
  25. Li, W.; Zhou, J.; Xie, K.; Xiong, X. Power System Risk Assessment Using a Hybrid Method of Fuzzy Set and Monte Carlo Simulation. IEEE Trans. Power Syst. 2008, 23, 336–343. [Google Scholar] [CrossRef]
  26. Du, H.; Cao, J.; Shen, Y.; Teng, S. Evaluation of System Reliability by Adopting the Mixed Bayes Method. J. Ordnance Eng. Coll. 2016, 28, 22–26. [Google Scholar] [CrossRef]
  27. Bhattarai, S.; Karki, R.; Piya, P. Reliability Modelling of Compressed Air Energy Storage for Adequacy Assessment of Wind Integrated Power System. Iet Gener. Transm. Distrib. 2019, 13, 4443–4450. [Google Scholar] [CrossRef]
  28. Wang, J.; Li, Y.; Zhang, H.; Shi, X. Power Generation System Reliability Evaluation Based on the Improved Sampling Methods. Instrum. Technol. 2015, 9, 40–42. [Google Scholar]
  29. Ying, Y. Layout and Research on the Protection of Power System of Marine Petroleum Platform. Master’s Thesis, Tianjin University, Tianjin, China, June 2007. [Google Scholar]
  30. Chen, J.; Zhang, Z.; Li, T. On Operation Reliability of Power Grid for Offshore Oil Platform. J. Chang. Eng. Vocat. Coll. 2012, 29, 5–7. [Google Scholar] [CrossRef]
  31. Li, Y.; Gong, J.; Chen, L. Power System Evaluation and Decision Analysis of Offshore Oil Platform. Chin. Energy Environ. Prot. 2017, 39, 105–108. [Google Scholar] [CrossRef]
  32. Goel, L.; Billilton, R. Utilization of Interrupted Energy Assessment Rates to Evaluate Reliability Worth in Electric Power Systems. IEEE Trans. Power Syst. 1993, 8, 929–936. [Google Scholar] [CrossRef]
  33. Zhai, D. Application of the Complex Power Network on Offshore Platforms. Oil Gasfield Surf. Eng. 2018, 37, 70–74. [Google Scholar] [CrossRef]
  34. Zhang, W.; Che, Y.; Liu, Y. Improved Latin Hypercube Sampling Method for Reliability Evaluation of Power Systems. Autom. Electr. Power Syst. 2015, 39, 52–57. [Google Scholar] [CrossRef]
  35. Manabe, Y.; Hara, R.; Kita, H.; Tanaka, E. Two Control Areas Reliability Assessment Method based on the State Enumeration Method Considering Mass Penetration of Intermittent Generation. IEEJ Trans. Power Energy 2014, 134, 328–335. [Google Scholar] [CrossRef]
  36. Cai, H. Distribution Network Reliability Analysis Considering the Impacts of Distributed Generation. Master’s Thesis, Nanjing University of Science and Technology, Nanjing, China, June 2010. [Google Scholar]
  37. Sun, T.; Cheng, H.; Zhang, L.; Zhou, Q.; He, H.; Zeng, P. Reliability Evaluation Based on Modified Mixed Sampling and Minimum Load-cutting Method. Power Syst. Prot. Control 2016, 44, 96–103. [Google Scholar] [CrossRef]
  38. Rong, Y.; Ma, X.; Yang, W. Model of Optimal Load Shedding Program for Reliability Assessment of Composite Generation and Transmission System. Adv. Technol. Electr. Eng. Energy 2015, 34, 58–62. [Google Scholar] [CrossRef]
  39. Li, S.; Jiang, B.; Jiang, D. Optimal Load-shedding Algorithm based on Minimum Load Margin Calculation Approach. J. Chongqing Inst. Technol. 2011, 25, 29–32. [Google Scholar] [CrossRef]
  40. Kundur, P. Power System Stability and Control; China Electric Power Press: Beijing, China, 1994; pp. 58–96. [Google Scholar]
  41. Zhang, Y.; Wu, W.; Li, Z.; Yuan, Y.; Wang, L. Hierarchical Load Shedding Method Considering Influence of Distributed Generators. Power Syst. Technol. 2019, 43, 998–1005. [Google Scholar] [CrossRef]
  42. Wang, Z.; Zhu, S.; Wang, T.; Qin, H. Research on Stratified Optimal Load Shedding Strategy for Receiving End Power Grid. Trans. China Electrotech. Soc. 2020, 35, 1128–1139. [Google Scholar] [CrossRef]
  43. Angalaeswari, S.; Sanjeevikumar, P.; Jamuna, K.; Leonowicz, Z. Hybrid PIPSO-SQP Algorithm for Real Power Loss Minimization in Radial Distribution Systems with Optimal Placement of Distributed Generation. Sustainability 2020, 12, 5787. [Google Scholar] [CrossRef]
  44. Zhao, Y.; Zhou, J.; Liu, Y. Analysis on Optimal Load Shedding Model in Reliability Evaluation of Composite Generation and Transmission System. Power Syst. Technol. 2004, 28, 34–37. [Google Scholar] [CrossRef]
  45. Li, Q.; Li, X.; Wei, C. Power Grid Interlinking Technology for Offshore Oil Fields. Shipbuild. China 2011, 52, 218–223. [Google Scholar]
  46. Jin, X.; Ning, G.; Li, R.; Hua, B. Composite System Reliability Evaluation with AC Power Flow Analysis Based on Interior Point Method. Power Syst. Clean Energy 2014, 30, 87–92. [Google Scholar]
  47. Francesco, C.; Gian, L.A.; Enrico, Z. A Modeling and Simulation Framework for the Reliability/Availability Assessment of A Power Transmission Grid Subject to Cascading Failures Under Extreme Weather Conditions. Appl. Energy 2017, 185, 267–279. [Google Scholar] [CrossRef] [Green Version]
  48. Alexander, E.D.; Blazhe, G.; Giovanni, S. Quantitative Comparison of Cascading Failure Models for Risk-based Decision Making in Power Systems. Reliab. Eng. Syst. Saf. 2020, 198, 106877. [Google Scholar] [CrossRef]
  49. The RRPA Subcommittee Working Group PACME; Papic, M.; Agarwal, S.; Allan, R.N.; Billinton, R.; Dent, C.J.; Ekisheva, S.; Gent, D.; Jiang, K.; Li, W.; et al. Research on Common-Mode and Dependent (CMD) Outage Events in Power Systems: A Review. IEEE Trans. Power Syst. 2017, 32, 1528–1536. [Google Scholar] [CrossRef] [Green Version]
  50. Chen, Y.; Zhang, Y. Assessment System for Transmission Network Reliability Considering Substation Bus Arrangement. Mod. Electr. Power 2007, 24, 60–63. [Google Scholar] [CrossRef]
  51. China Power Industry Annual Development Report 2020. Available online: https://cec.org.cn/detail/index.html?3-284219 (accessed on 12 June 2020).
  52. Zhang, P. Application of Electrical Automation Technology in Offshore Oil Production. Telecom Power Technol. 2020, 37, 147–148. [Google Scholar] [CrossRef]
  53. Wang, J.; Zhong, H.; Xia, Q.; Kang, C. Transmission Network Expansion Planning with Embedded Constraints of Short Circuit Currents and N-1 Security. J. Mod. Power Syst. Clean Energy 2015, 3, 312–320. [Google Scholar] [CrossRef] [Green Version]
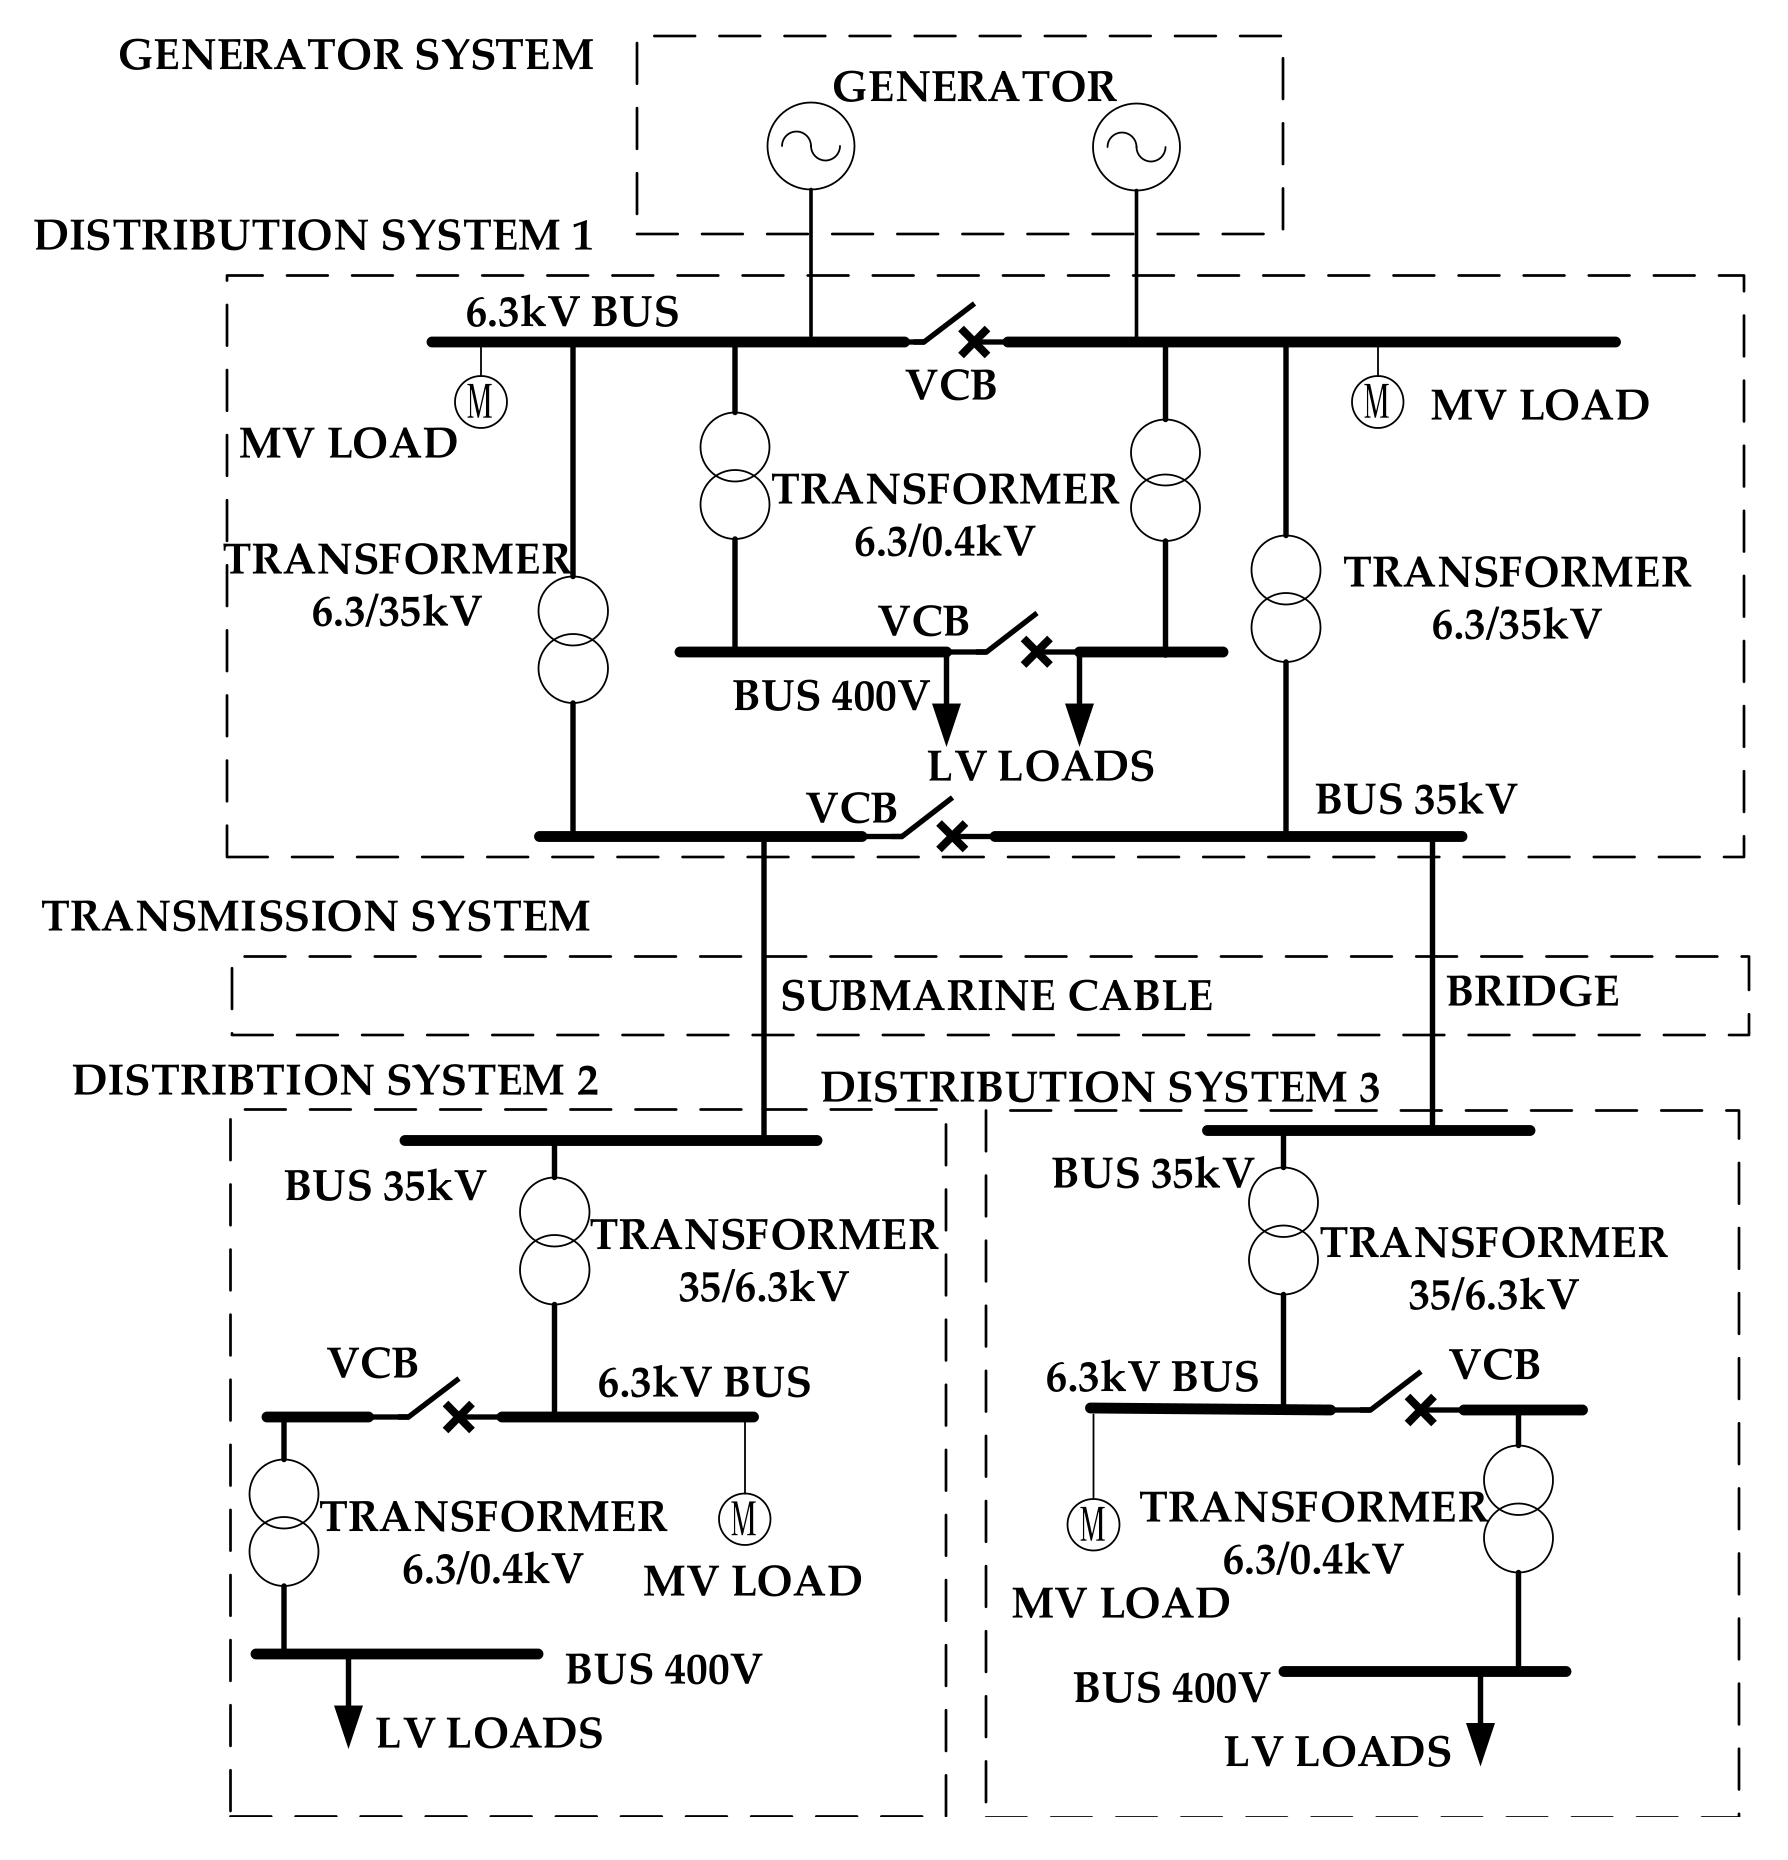
Figure 1. Schematic diagram of subsystem division.
Energies 14 03035 g001
Figure 2. Reliability assessment flowchart.
Energies 14 03035 g002
Figure 3. Schematic diagram of a typical distribution system.
Energies 14 03035 g003
Figure 4. Topology example.
Energies 14 03035 g004
Figure 5. Flow chart for the distribution system outage table.
Energies 14 03035 g005
Figure 6. Actual topology diagram of the example power system. (a) Topology before simplification; (b) topology after simplification.
Energies 14 03035 g006
Figure 7. Percentage of subsystem indicators. (a) Percentage of PEPSF for subsystems; (b) percentage of PADSF for subsystems.
Energies 14 03035 g007
Figure 8. Comparison of subsystem count indicators.
Energies 14 03035 g008
Figure 9. Comparison of subsystem duration indicators.
Energies 14 03035 g009
Figure 10. 100,000 sampling coefficient of variance. (a) Coefficient of variance of simulation method; (b) coefficient of variance of hybrid method.
Energies 14 03035 g010
Figure 11. Ring network diagram, for example.
Energies 14 03035 g011
Table 1. Overall power system reliability index structure.
System IndexIndex MeaningSample
Index
Index MeaningCalculation
P R EPSF , i Probability of component failure in the system i P R EPSF , i ( k ) This variable indicates whether system i fails in the k-th sampling P R EPSF , i = k = 1 k max P R EPSF , i ( k ) k max
D ADSF , i Mean duration of failure of components in the system i D ADSF , i ( k ) Duration of components of system i in the k-th sampling D ADSF , i = k = 1 k max D ADSF , i ( k ) k max
P R EPLC , i Probability of load cut due to failure of components in the system i P R EPLC , i ( k ) This variable indicates whether system i experienced load shedding in the k-th sampling P R EPLC , i = k = 1 k max P R EPLC , i ( k ) k max
D ADLC , i Average load shedding duration caused by component failure in the system i D ADLC , i ( k ) Duration of load shedding caused by the failure of i system in the k-th sampling D ADLC , i = k = 1 k max D ADLC , i ( k ) k max
L P EDNS , i System loss power expectation in the system i L P EDNS , i ( k ) Power loss value of the k-th sampling in the system i L P EDNS , i = k = 1 k max L P EDNS , i ( k ) k max
L E EENS , i System loss energy expectation in the system i L E EENS , i ( k ) Energy loss value of the k-th sampling in the system i L E EENS , i = k = 1 k max L E EENS , i ( k ) k max
k max refers to the maximum sampling times; k represents the k-th sampling; i = 0 , 1 , 2 , 3 , 4 refers to the overall power, generation, transmission, and distribution systems, as well as the distribution cascade fault, respectively.
Table 2. The equipment and its subordinate system.
ImportanceEquipment NameSubordinate System
1Water injection pumpWater injection system
2Medium pressure/high pressure compressor, associated gas compressorNatural gas system
3Air compressor, on/off discharge system Crane, air conditioner, etc.Public system
4Electric submersible pump, crude oil export pump, separator, fuel gas systemMain process system
5Drilling module, workover rigsDrilling system
Table 3. Summer general calculation conditions, for example.
Platform NameActive Load/(MW)Generation Capacity/(MW)Platform NameActive Load/(MW)Generation Capacity/(MW)
CEP 121.40111.974*3WHP 25.7860
CEP 28.09411.974*3WHP 34.6690
CEP 325.23511.974*2WHP 414.5420
WHP 19.3210WHP 53.7380
Table 4. Component reliability parameters.
ElementFailure Rate/(Time∙a−1)Repair Time/(h)
Submarine Cable/(km)L*0.0037926.201*L + 597.75
Bridge/(km)L*0.03L*30
ElementFailure Rate
/(time∙a−1)
Repair Time
/(h)
Maintenance Rate
/(time∙a−1)
Maintenance Time/(h)
Turbine Unit2.222.4372
Breaker0.18240.248
Transformer0.042001120
Bus0.0960.18
Table 5. Part of the power distribution system outage table.
StateState ProbabilityLEEENS/(MWh)DADSF/(h)DADLC/(h)
10.951233000
20.00879201200
30.0086230480
40.0065980150
50.0038870240
60.00218224.692424
70.00218228.872424
80.00218238.642424
90.00218124.342424
100.00218127.472424
110.00218134.802424
120.00109231.692424
130.00109242.862424
140.00109230.642424
150.00109239.022424
160.00027347.974848
170.00013670.374848
180.00006024.8788
Table 6. System reliability index.
Index (DC Power Flow)Overall System Results
LEEENS/(MWh)980.89
Percentage of Annual Electricity Consumption/(%)0.12
ASAI/(%)98.49
Index (AC Power Flow)Overall System Results
LEEENS/(MWh)1116.50
Percentage of Annual Electricity Consumption/(%)0.14
ASAI/(%)98.36
Table 7. System failure indicators.
IndexGeneration SystemTransmission SystemDistribution SystemOverall System
PREPSF/(time∙a−1)0.050.130.67 0.85
Percentage/(%)6.5114.5578.94100
DADSF/(h)1.32104.3410.23115.89
Percentage/(%)1.1490.038.83 100
Table 8. Subsystem load shedding index.
IndexGeneration SystemTransmission SystemDistribution SystemOverall System
PREPLC/(time∙a−1)0.010.120.100.23
Percentage/(%)4.9153.0942.01100
DADLC/(h)0.77104.341.53106.64
Percentage/(%)0.7297.841.44100
LEEENS/(MWh)4.581108.243.681116.50
Percentage/(%)0.4199.260.33100
Table 9. Comparison of indexes before and after the ring network.
IndexDADSF
/(h)
DADLC
/(h)
LEEENS
/(MWh)
Installation Costs
/(Million Yuan)
Ring Network
None115.89106.641116.500
4 km128.6763.08922.374.2
13 km133.6452.82618.3022.76
17.5 km137.8450.71783.6230.625
Publisher’s Note: MDPI stays neutral with regard to jurisdictional claims in published maps and institutional affiliations.