Article

Pore Type, Pore Structure, and Controlling Factors in the Late Triassic Lacustrine Yanchang Shale, Ordos Basin, China

1
Institute of Geology and Geophysics, Chinese Academy of Sciences, Beijing 100029, China
2
Key Laboratory of Petroleum Resources Research, Institute of Geology and Geophysics, Chinese Academy of Sciences, Beijing 100029, China
3
Shaanxi Key Laboratory of Lacustrine Shale Gas Accumulation and Exploitation, Xi’an 710075, China
4
Research institute of Shaanxi Yanchang Petroleum (Group) Co., Xi’an 710075, China
*
Author to whom correspondence should be addressed.
Energies 2021, 14(11), 3053; https://doi.org/10.3390/en14113053
Submission received: 26 March 2021 / Revised: 27 April 2021 / Accepted: 6 May 2021 / Published: 25 May 2021

Abstract

:
Organic-rich lacustrine shales in the Upper Triassic Yanchang Formation with thermal maturity mainly in the oil window are the main shale oil and shale gas system in the lacustrine strata of the Ordos Basin, China. Pore systems are important for the storage and transfer of shale oil and gas. The main objectives of this study are to identify the pore types and pore structures and investigate the controlling factors for pore types, pore structures, and total porosities of the lacustrine Yanchang Shale. In this study, organic-rich mudstones, mudstones with siltstone interlayers, siltstone, and sandstones were selected from 15 wells in the southern Ordos Basin. X-ray diffraction, pyrolysis, scanning electron microscopy (SEM), low-pressure nitrogen adsorption analysis, and helium porosimetry were conducted to investigate the mineral compositions, pore types, pore structures, porosities, and controlling factors. Siltstone and sandstone interlayers heterogeneously developed in the Yanchang Shale. The petrology, mineral composition, geochemistry, pore type, pore structure, and porosity of siltstone interlayers are different from those of mudstones. The siltstone and sandstone interlayers usually have more quartz and feldspars, greater detrital grain sizes, and relatively better grain sorting but are lower in clay minerals, total organic carbon (TOC), amount of free liquid hydrocarbons values (S1), and total residual hydrocarbons values (S2), compared to mudstones. Interparticle (interP), intraparticle (intraP) pores, and organic pores (OPs) were developed in both siltstones and mudstones. OPs were observed in samples with lower thermal maturity (e.g., 0.5–0.85%). The inorganic pore size is greater than that of OPs. Additionally, the inorganic pore diameters in siltstone interlayers are also greater than those in mudstones. Organic-rich mudstones generally have higher pore volumes (PVs) of pores with sizes less than 10 nm, pore volumes of pores with sizes between 10 and 50 nm (PV, 10–50 nm), and specific surface area (SSA), but they have lower PVs of pores with sizes greater than 50 nm, total PV, and porosity when compared to siltstone and sandstone interlayers. The dominant pore type in mudstones is OPs and TOC (first order), sources and OM types (second order), and thermal maturity (third order), while the abundances of rigid grains with greater sizes and grain sorting are the main controlling factors of pore structures, SSA and PV. Both inorganic pores and organic pores are abundant in the siltstone interlayers. The pore size distribution (PSD), PV, and porosity of siltstone interlayers are related to the abundance of rigid grains (first order), grain sorting (second order), grain size (third order), and carbonate cement content. The total PV and porosity of Yanchang Shale reservoirs may have increased with the increased abundance of siltstone and sandstone interlayers.

1. Introduction

Pore systems in organic matter-rich shales that comprise nanometer- to micrometer-scale interP pores, intraP pores, and organic pores, and fractures play an important role in both the storage and migration of shale oil and gas [1,2,3,4]. The pore type, pore size distribution, SSA, and porosity are crucial to the connectivity and permeability of pore systems and are also important in modeling geophysical, petrophysical, and fluid flow behaviors of porous media [5,6]. Therefore, characterizing the pore types and PSDs and investigating the factors that control the different pore types and PSDs have been a popular topic, and many studies have been conducted [2,3,4,7,8].
The Upper Triassic lacustrine Yanchang Shale in the southern Ordos Basin is an organic-rich shale within the oil window and has been recognized as one of the most promising hybrid unconventional resource plays in the lacustrine strata of China [9,10]. Several studies have documented the pore types, pore structures, and porosities of the Yanchang Shale [7,8,11,12,13,14,15,16,17]. However, the conclusions regarding the dominant pore type and controlling factors of pore structure are contradictory. Several studies showed that the inorganic mineral-hosted pores and microfractures are the dominant pore types, whereas very few OPs developed in Yanchang Shale because of the OMs within the oil-generating window [11,12,13,18,19]. Loucks et al. [13] reported that the dominant pores are intraparticle pores and that there is a lesser abundance of organic matter pores, while interparticle pores are rare in the Yanchang Shale. They proposed that clay mineral content, thermal maturity, and lithology are the major controls of pore type and pore structure [18,20]. Other studies have reported that abundant OPs developed in the Yanchang Shale [7,8,15,16,21], and Ko et al. [7] even concluded that OP was the most important pore type in the Yanchang Shale with lesser abundances of interP and intraP pores. They also proposed that the rock texture and fabric, OM types, and compaction are related to the pore types and pore structures and may affect the abundance of different pore types [7,13]. In fact, some studies have observed that the pore types and pore structures of organic-rich mudstones are different from those of the siltstone interlayers [12,20]. The different conclusions regarding the dominant pore type and controlling factors of pore structure and porosity of the Yanchang Shale may be due to shale heterogeneity. Lei et al. [12] and Yu et al. [20] identified that the pore types, pore size distributions, and porosities are different between silty laminae and mudstones and concluded that the silty laminae are dominated by macropores (>50 nm), whereas mudstones without silty laminae are dominated by mesopores. What are the differences in the dominant pore type, pore structure, and its controlling factors between different shale lithotypes? This is the key issue to understand the development of reservoir storage space in the lacustrine shale formation.
In this study, mudstone samples without siltstone interlayers, siltstones, and sandstones separated from the samples with siltstone or sandstone interlayers from 15 wells with different burial depths and thermal maturities were selected, and their mineral compositions, geochemistry, pore types, pore structures, and porosities are characterized, and the main controlling factors of pore types and pore structures are discussed.

2. Geological Setting

The Ordos Basin, which is located in the western part of the North China Craton, is one of the richest fossil-fuel producing basins in China, and the study area is located on the southern part of Ordos Basin (Figure 1). During the late Upper Triassic, a freshwater lake formed in the Ordos Basin and the Yanchang Formation, with thicknesses ranging from 800 to 1000 m, was deposited and can be subdivided into 10 members [22,23]. At the early stage of the Chang 7 Member, the lacustrine basin expanded significantly, and the widespread organic-rich shale with thicknesses ranging from 30 to 100 m was deposited in the deep to semideep waters of the lake [24]. The shale contains types I and II1 organic matter with a TOC of 0.4–28.3% and the vitrinite reflectance of OMs (VRo) is 0.62–1.28% [7,8,16,20,24]. The Yanchang Shale is characterized by frequent litho-type alteration [12]. The measurement results from the outcrop, core, and thin section show that the siltstone interlayers can occupy 7–26% of the shale formation [25]). Most of the siltstone interlayers are distributed in the top and bottom sections of the shale formation [12]. The Yanchang Shale is the dominant source rock for the Mesozoic hydrocarbon reservoirs and is also the main target for shale oil and gas exploration in the Ordos Basin.

3. Samples and Methods

In total, 12 mudstone samples with siltstone interlayers not visible to the naked eye (named mudstones), 11 mudstone samples with siltstone interlayers visible to the naked eye (named mudstones with interlayers), and 11 siltstone and sandstone samples of the Yanchang Shale from 15 wells were selected in this study (Figure 1). The siltstones and sandstones were separated from the samples with siltstone or sandstone interlayers.

3.1. X-ray Diffraction Analysis

The samples were prepared for mineralogical composition determinations by crushing and sieving to 200 mesh size (<0.075 mm) and were then subjected to X-ray diffraction analysis by a Rigaku D/MAX-2500 diffractometer (Rigaku, Tokyo, Japan). The results were converted to weight percentages of quartz and feldspar, clay minerals, carbonate, and pyrite (Table 1).

3.2. TOC and Rock–Eval Pyrolysis

Shale cores were crushed to 200 mesh and approximately 100 mg was decalcified with a 5% HCl solution at 80 °C for one hour to remove inorganic carbon. TOCs were determined with a Leco C230 carbon analyzer.
An additional 70 mg was weighted for Rock–Eval pyrolysis. The hydrogen index (HI), S1, S2, and value of the temperature of maximal hydrocarbon release (Tmax) were determined with a Vinci Rock–Eval 6 instrument. The results are listed in Table 2.

3.3. Scanning Electron Microscopy

The shale samples for SEM observations were prepared with an argon polishing system (Leica EM TIC 3X, Leica, Solms, Germany) and were imaged using SEM microscopy (MERLIN FE-SEM, ZEISS, Jena, Germany) at 1.2 keV, and the minerals in the SEM images were identified by energy dispersive spectroscopy (EDS). The resolution is approximately 4 to 7 nm per pixel. The organic matter and the pores are identified based on the greyscale region. The minerals have a higher greyscale level, compared to the organic matter. Additionally, the greyscale level of the pores is the lowest. The pores located inside the organic matter are extracted as the organic pores in SEM images. Pore diameters and the ratios of the total area of organic pores (OPs) to the total area in a single OM (Ra) were measured on SEM images using Image-Pro Plus software [26].

3.4. Low-Pressure Nitrogen Adsorption

Low-pressure nitrogen adsorption analysis was performed on a Micromeritics ASAP 2020 HD88 system at −196 °C. All samples were crushed to 60 mesh and were degassed under a vacuum at 120 °C for 24 h to remove adsorbed moisture and volatile matter. Nitrogen adsorption volumes were measured over a relative equilibrium adsorption pressure (P/Po) range from 0.0001 to 0.995, where Po is the condensation pressure of nitrogen at laboratory conditions, and P is the actual gas pressure. Specific surface areas (SSAs) were calculated based on Brunauer–Emmet–Teller (BET) theory [27]. Pore volumes (PVs) and pore size distributions (PSDs) for pore diameters from 1.7 to 250 nm were calculated based on Barrett–Joyner–Halenda (BJH) model [28].

3.5. Porosity Analysis

Porosity was measured from core plugs with diameters of approximately 2.54 cm and 3–5 cm lengths based on API40 Standards. The analyses were performed with a PoroPDP helium porosimeter.

4. Mineral Composition and Organic Geochemistry

4.1. Petrology and Mineral Composition

The Yanchang Shale is heterogeneous in its petrology and mineral composition. Siltstone and sandstone interlayers were observed (Figure 2a) with thicknesses ranging from several microns to several millimeters and up to tens of centimeters. The detrital grain sizes of the siltstone and sandstone interlayers are greater than those of the mudstones (Figure 2b–e), which vary from several micrometers to 100 µm and up to several hundreds of micrometers. The detrital grain sizes of the mudstones are usually less than 10 µm. The grain sizes of detrital particles in mudstones are greater in parts neighboring the siltstone and sandstone interlayers (Figure 2e). Compared to the adjacent black mudstones, the siltstone and sandstone interlayers are commonly grayish to grayish-white with coarser grain sizes and relatively better grain sorting (Figure 2).
Quartz, feldspar, and clay minerals are major components of the samples, and pyrite and calcite can also be observed in thin sections, while the mineral types and abundances vary widely (Figure 2, Table 1). The shale has 21.8–45.0 wt.% quartz contents, with an average of 32.9 wt.%, and 8–51 wt.% of feldspar, with an average of 28.6 wt.%. Clay mineral contents vary from 15.0 to 53.0 wt.% with an average of 35.0 wt.%. Pyrite and siderite are common in the Yanchang Shale, and their contents are less than 5.0 wt.% and their average values are 1.3 wt.% and 1.2 wt.%, respectively. Calcite and dolomite were observed and tested in some samples and their contents were usually less than 5.0 wt.%.
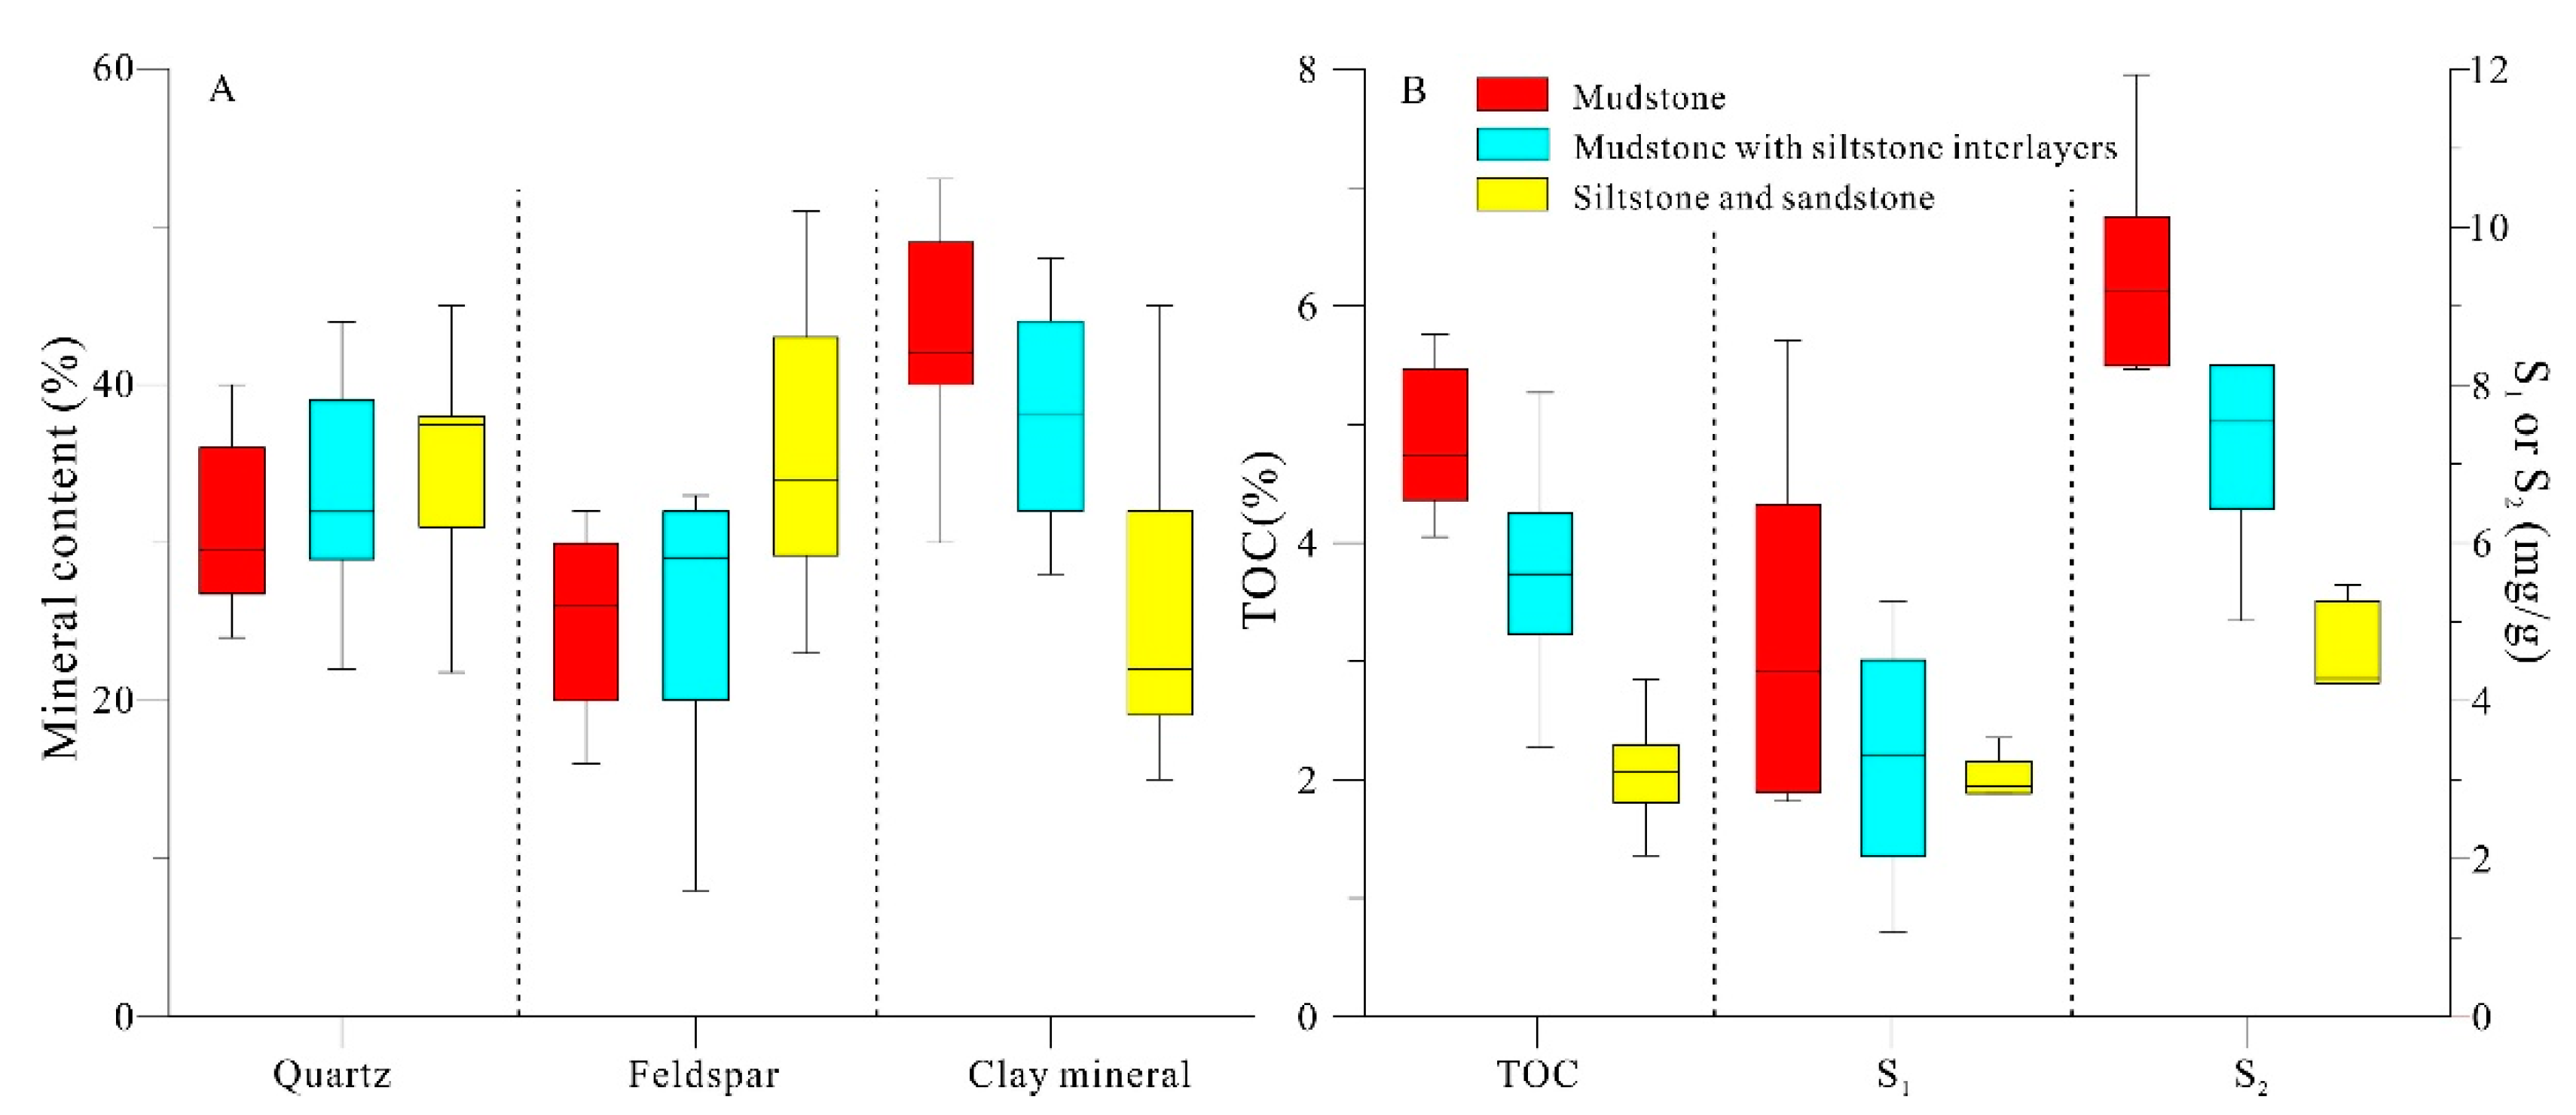
Generally, when compared to mudstones, siltstones and sandstone interlayers have more quartz and feldspar and fewer clay minerals (Figure 3A and Table 1).

4.2. Organic Geochemistry

The values of TOC, S1, and S2 of siltstone interlayers are different from those of mudstones (Figure 3B and Table 2). Siltstone interlayers have the lowest TOCs, which range ranging from 1.36 wt.% to 2.85 wt.% with an average of 2.02 wt.%. Mudstones have the highest TOCs, which vary from 4.05 wt.% to 5.76 wt.% with an average of 4.86 wt.%. The TOCs of mudstones with interlayers range from 2.28 wt.% to 5.27 wt.% with an average of 3.76 wt.%. Compared to mudstones, the siltstones and sandstone interlayers usually have lower S1 and S2 values. The vitrinite reflectance (VRo) values range from 0.5% to 1.25%. The hydrogen index (HI) ranges between 115 and 314 mg/g TOC. The Rock–Eval Tmax values range mainly from 425 °C to 457 °C (Table 2). Thermal maturation analyses from Rock–Eval pyrolysis and vitrinite reflectance (VRo) data indicate that these samples are in the oil maturation window.

5. Pore Types and Morphology

Pore systems in organic-rich shales consist of interP, intraP, Ops, and microfractures.

5.1. Interparticle Pores (InterP)

Pores between detrital particles and secondary mineral crystals are classified as interP pores [1]. InterP pores usually develop among rigid grains such as quartz, calcite, feldspar, and pyrite (Figure 4a), while some residual interP pores were preserved in compaction-protected shadows adjacent to rigid grains (Figure 4b–d). Some intercrystalline pores among secondary minerals such as quartz, calcite, and dolomite are observed (Figure 5e).
The geometries and pore sizes of interP pores vary significantly. The shapes of interP pores between rigid grains show little to no preferential orientation and are generally polyhedral with straight margins (Figure 4a). However, if the edges of soluble feldspar and calcite are dissolved, the edges of the modified pores are commonly sawtooth-shaped (Figure 4f). InterP pores between rigid grains and clay minerals have complex pore morphologies and wide variations of pore size, which vary from 20 nm to hundreds of nanometers (Figure 4b). The interP pores developed between clay platelets have triangular, polygonal, elongate, or linear morphologies and some show preferential orientations due to compaction (Figure 4c,d). The size of triangular and polygonal pores between clay particles can be up to hundreds of nanometers. The widths of the elongate or linear pores generally range from 10 nm to 50 nm and up to 200 nm, while the ratio of length to width varies from 1.5 to 200.
Compared to mudstones, residual interP pores among rigid grains are more abundant in siltstone or sandstone interlayers and the pore sizes are larger (Figure 4a). InterP pores among clay platelets, rigid grains, and clay platelets are more abundant, but their pore sizes are relatively smaller (Figure 4d).

5.2. Intraparticle Pores (IntraP)

IntraP pores are also abundant in the Yanchang Shale; they are defined as pores that developed within particles and cements [1].
Soluble grains and cements such as feldspar and siderite are abundant in the Yanchang Shale; hence, secondary dissolution pores are common. IntraP dissolution pores and moldic pores are abundant in feldspars, and their geometry and pore size vary significantly (Figure 4g–i). When feldspar is slightly dissolved, the dissolution and moldic pores are probably isolated and have sizes ranging from several nanometers to hundreds of nanometers (Figure 4g). If feldspars underwent strong dissolution, the dissolution pores merged to form larger pores with complex morphology and finally resulted in an interconnected permeable pore network with good connectivity (Figure 4i). The pore sizes of the dissolution pores were up to several micrometers.
Many intraP pores are observed in secondary clay aggregates or clay platelets (Figure 4d,j). When these clay aggregates or clay platelets filled the intraP pores adjacent to rigid grains or in dissolution pores, the pores were rectangular, triangular, ellipsoidal, or polygonal (Figure 4j), and these pore sizes vary from tens of nanometers to hundreds of nanometers. If the clay aggregates or clay platelets lacked compaction sheltering, lots of pores were destroyed, leaving only a few elongated pores (Figure 4d). There are also some intercrystalline pores in pyrite framboids (Figure 4k) and remnant intraP pores within fossil grains (Figure 4l).
Generally, there are more dissolution pores with larger sizes in sandstone or siltstone interlayers than in mudstones due to the more soluble feldspars with larger grain sizes. The intraP pores in clay aggregates or clay platelets and pyrite framboids in mudstones are more abundant.

5.3. Organic Pores

Organic pores are intraP pores that developed within OM [1]. According to their morphologies and origins, OPs in the Yanchang Shale can be classified as organic spongy pores, bubble pores, and slit pores.
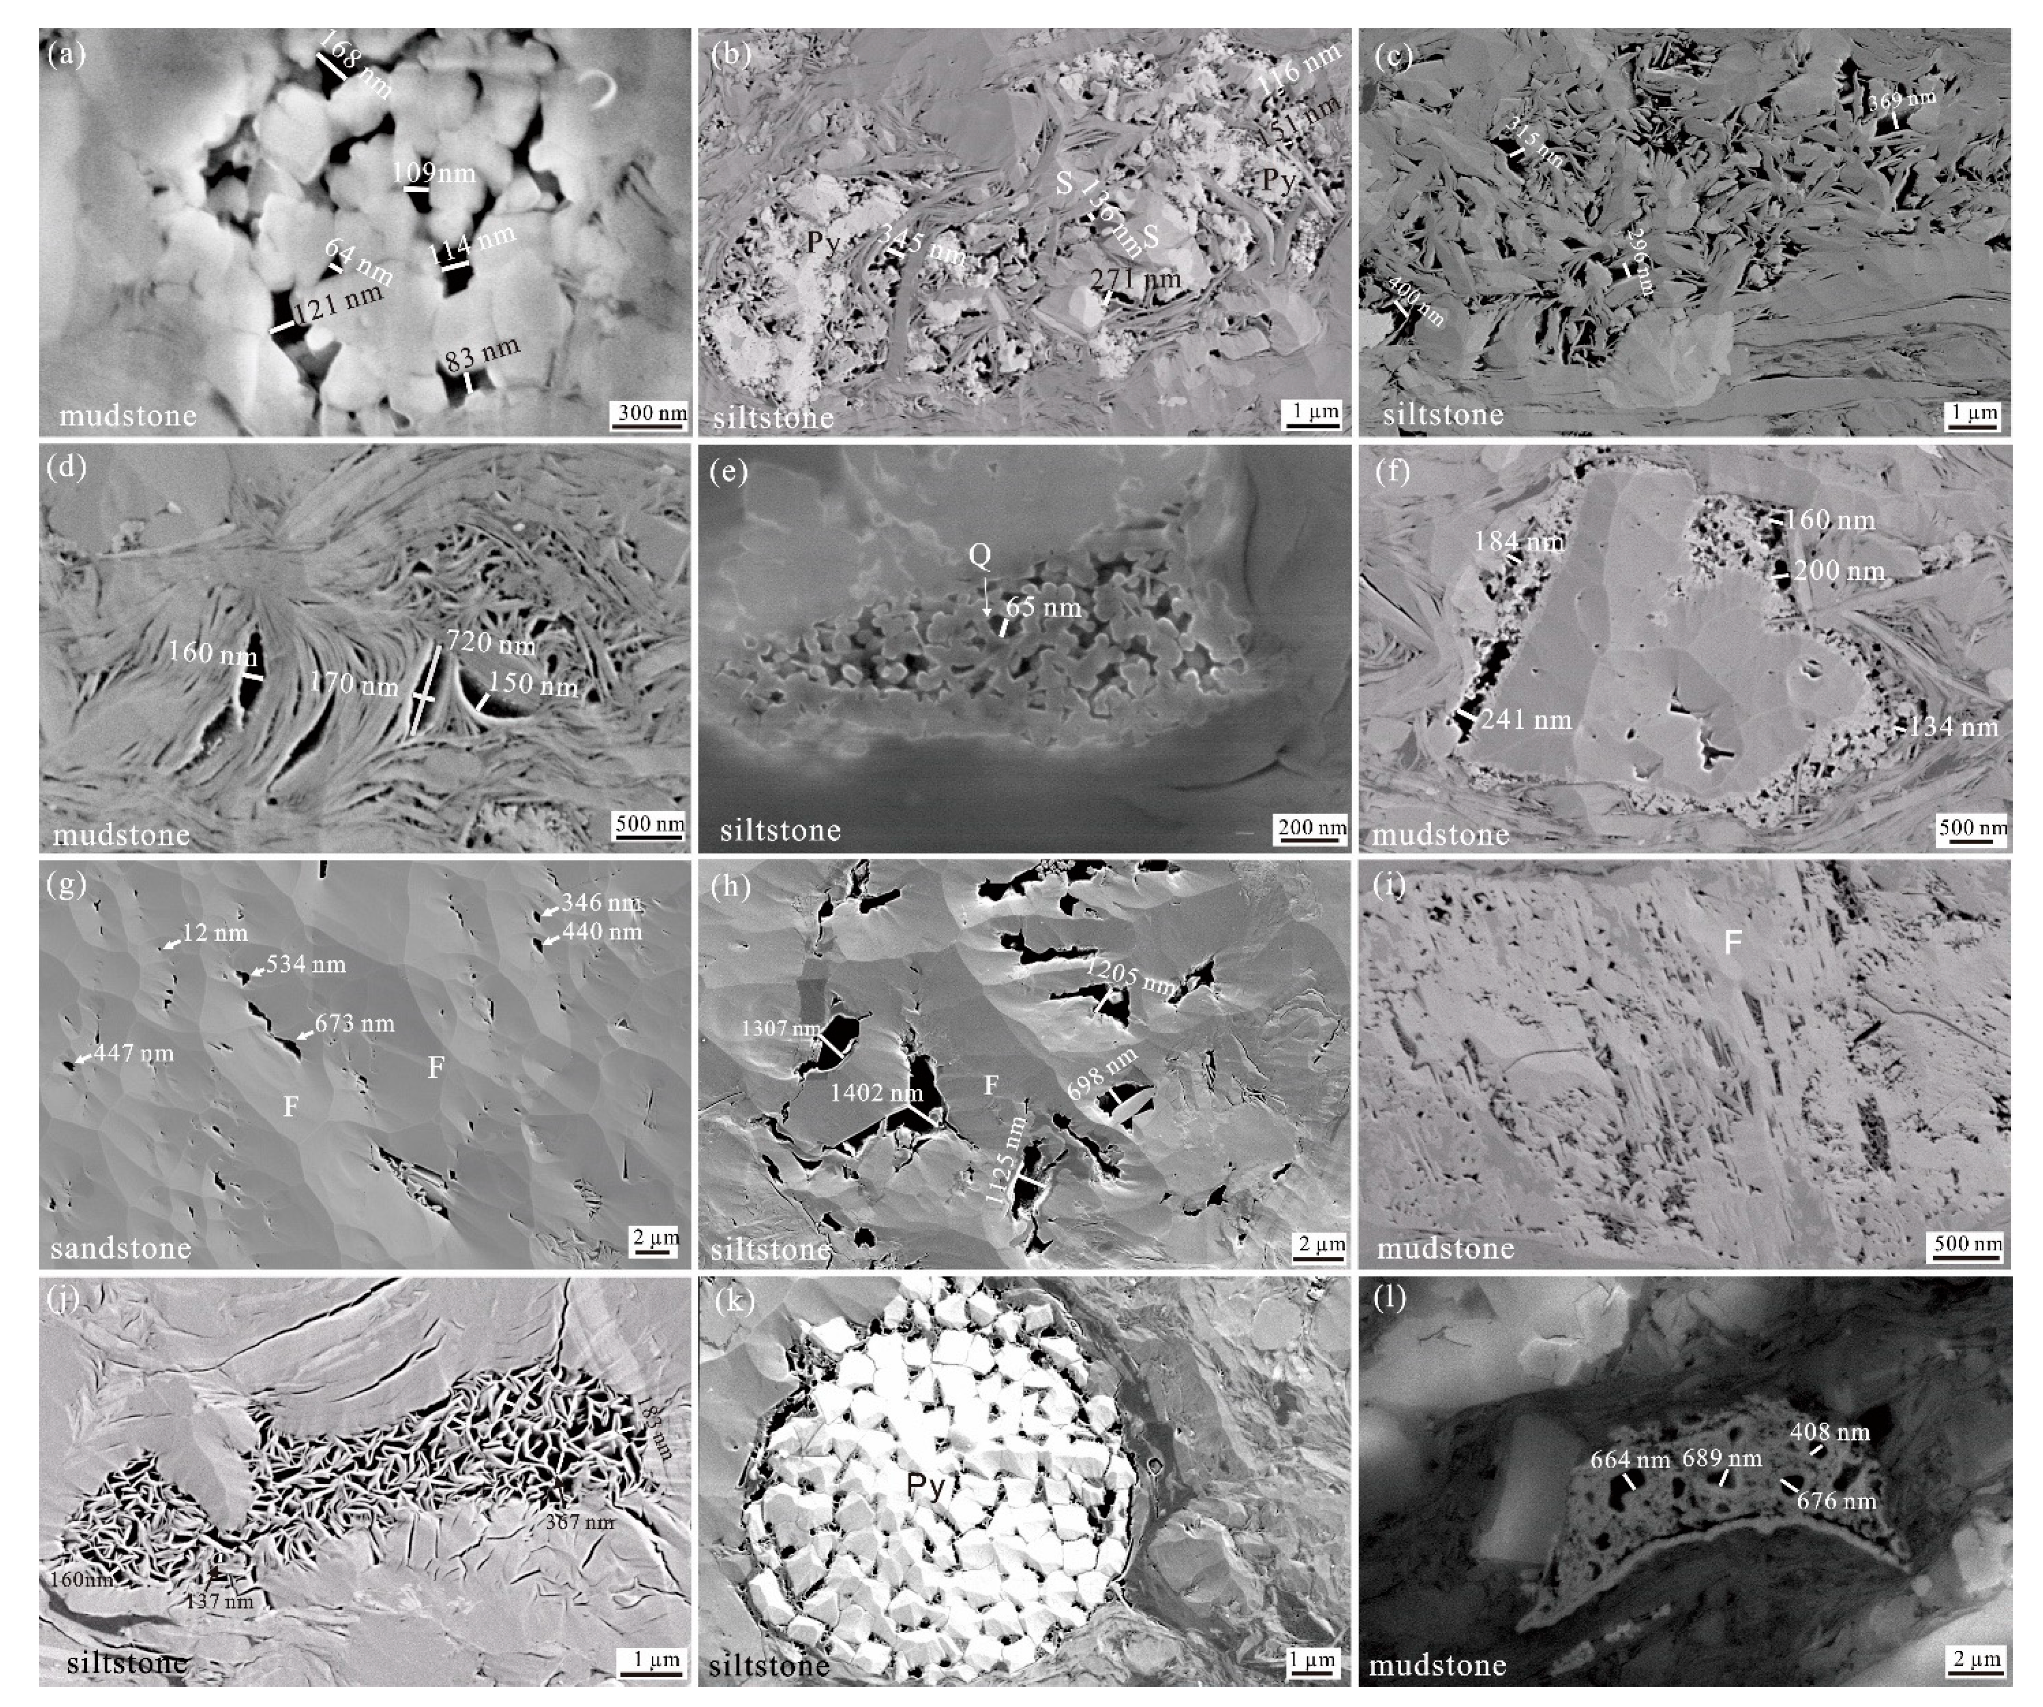
Bubble OPs are generally rounded to subrounded and range from tens of nanometers to hundreds of nanometers in size (Figure 5a,b). Bubble OPs are related to bitumens cracking to oil and gas [7,29]. Bubble organic pores are usually observed in mudstones and are not very common in siltstone interlayers.
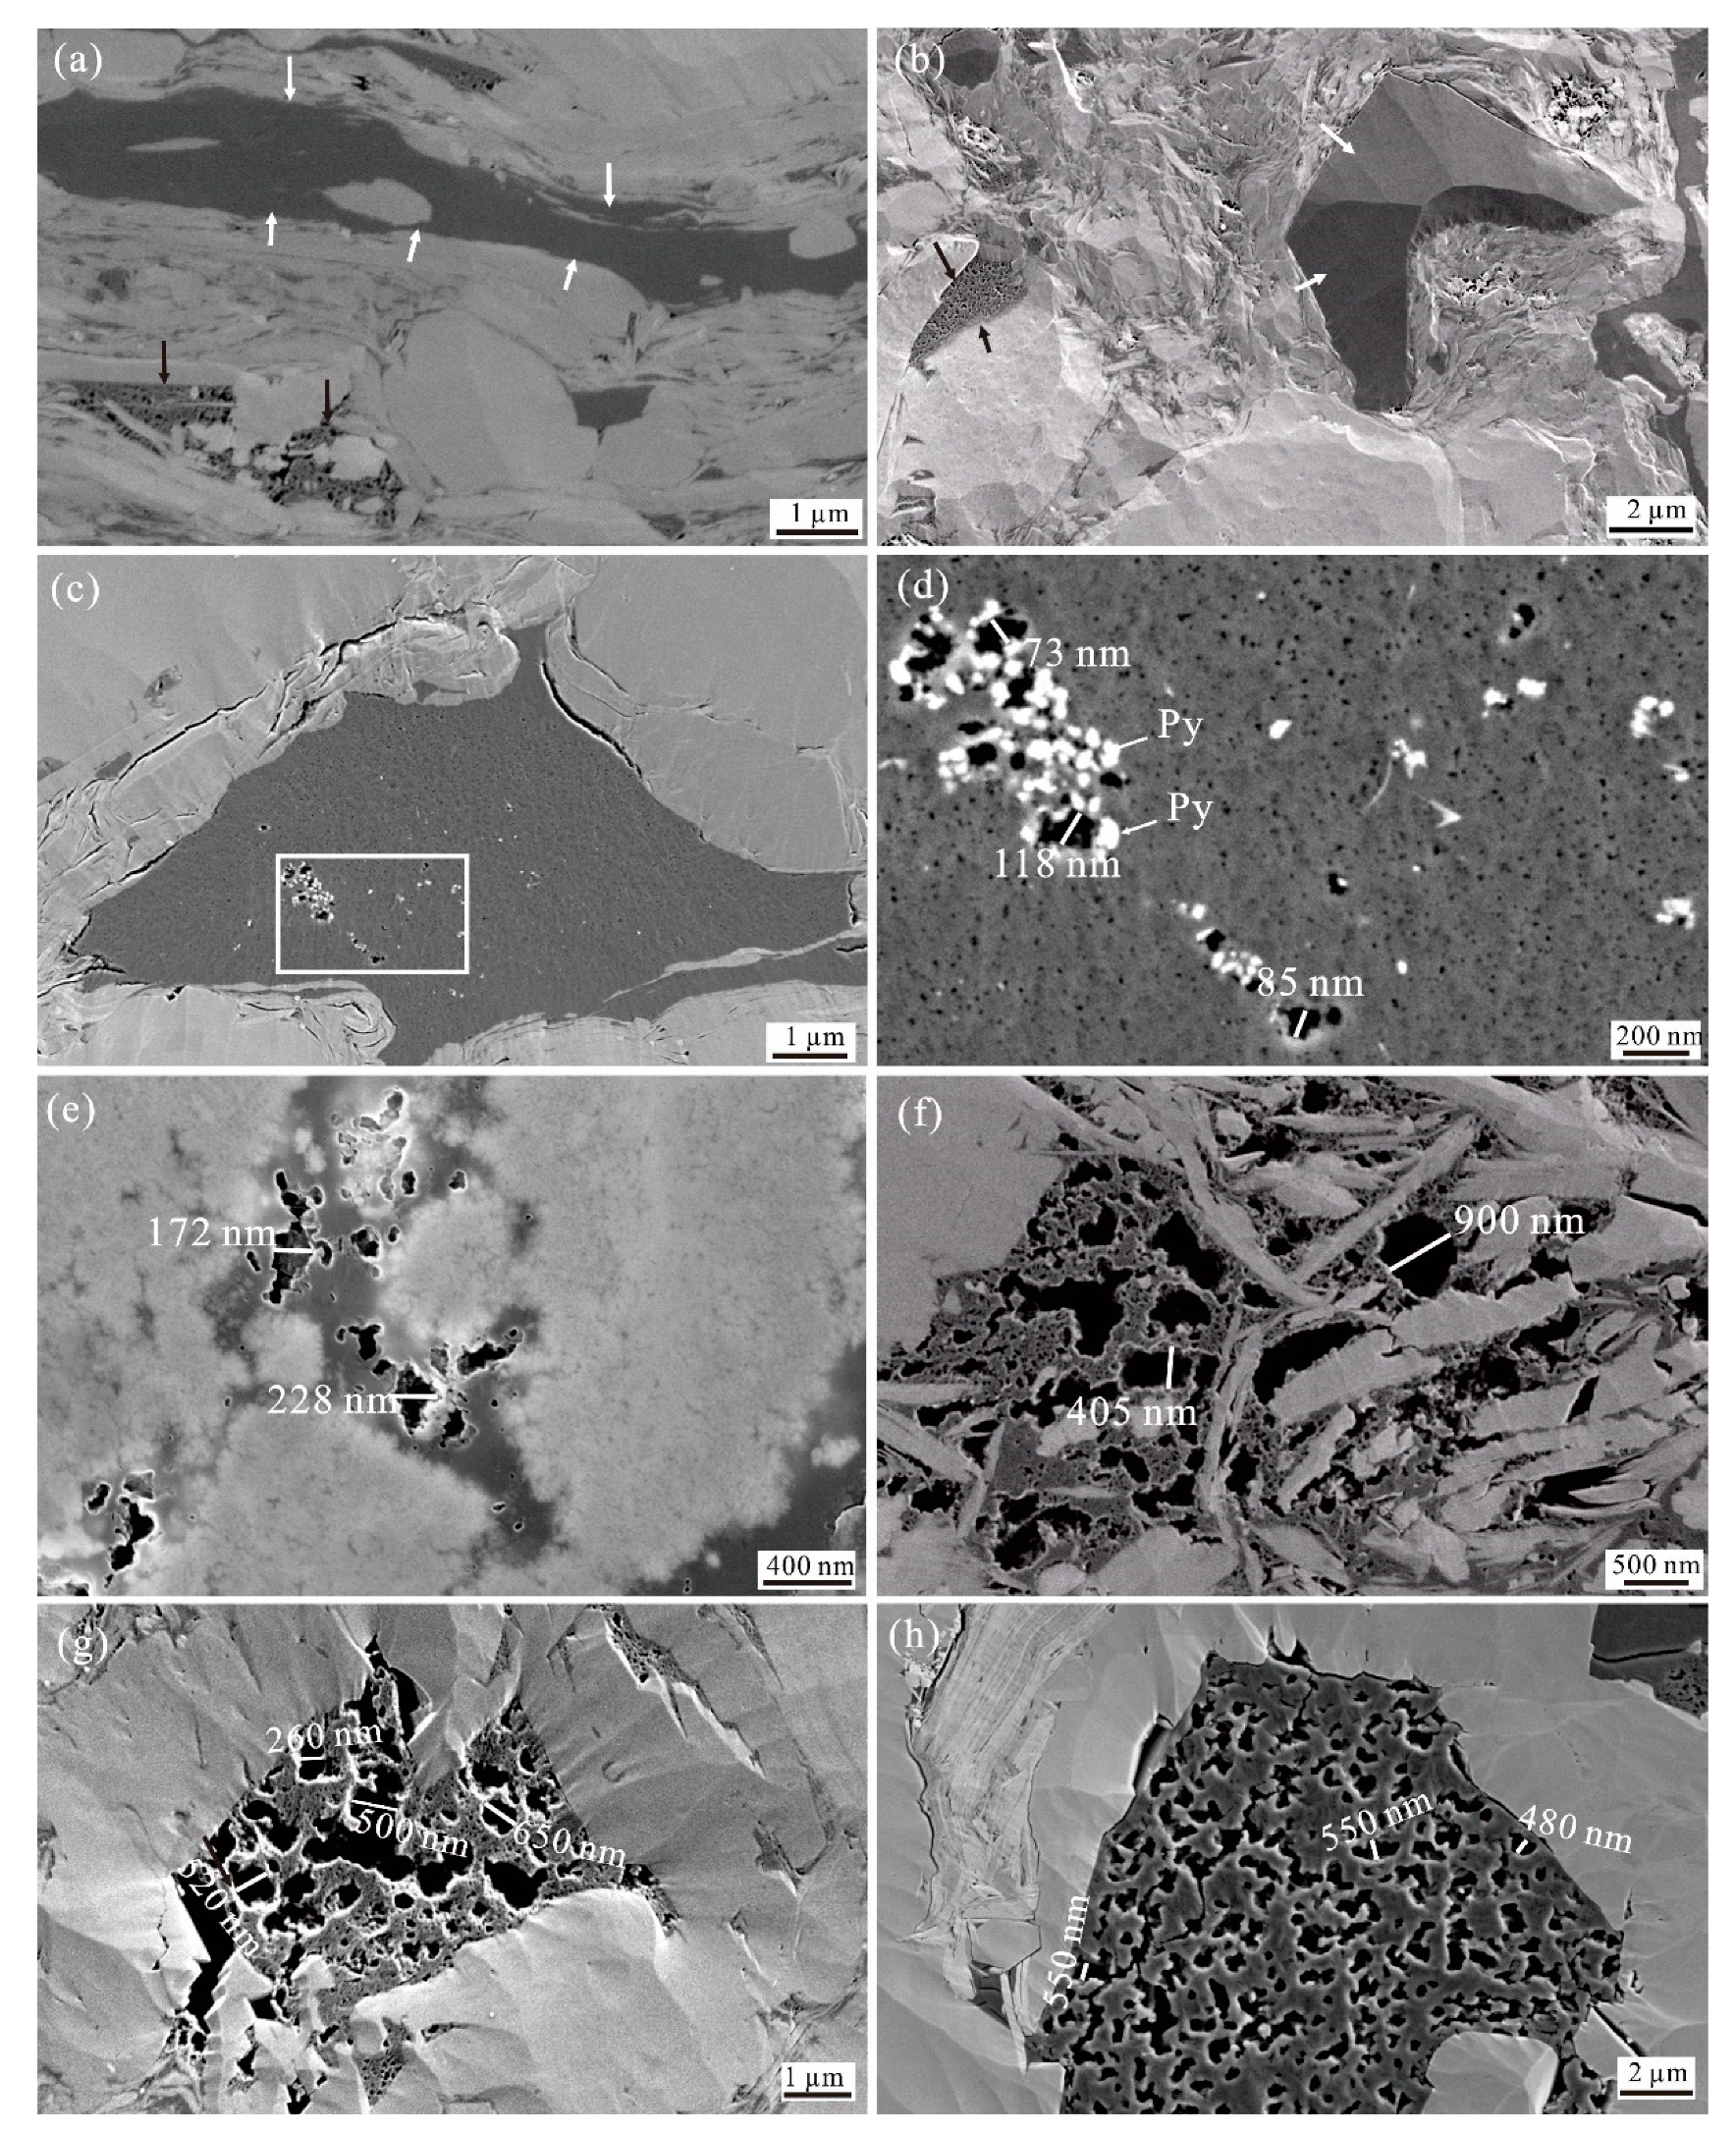
Spongy OPs are abundant (Figure 5b–e), especially in the organic matter filling interP pores or in dissolution pores adjacent to rigid grains in sandstone or siltstone interlayers (Figure 5c,d). Spongy OPs have rounded, subrounded, or subangular, elliptical, irregular polygonal shapes and are generally approximately 10 nm to 400 nm in diameter (Figure 5b–e). Spongy pores have been interpreted to be related to gas generation at higher stages of maturation [1,7]. However, spongy OPs are abundant in samples with oil window maturities (Figure 5b–h). OM devolatilization cracks are commonly observed (Figure 5c,d). Several neighboring pores can merge and form larger and complex pores or a complex pore network and the size of the merged OPs may be up to several micrometers (Figure 5f–h).
OPs in OMs fill the filaments and bundles of clay minerals that are interconnected to form slit OPs with complex shapes (Figure 5i). These slit OPs are oriented roughly parallel to the direction of the distributed clay minerals.

5.4. Pore Networks

A pore network is the sum of interP pores, intraP pores, Ops, and fissures and how these different pore types are connected [13]. When the pores are few, isolated, and scattered, they do not form an effective pore network (Figure 4g). On the other hand, pores form an effective pore network when they are abundant and interconnected (Figure 4h,i). A lot of inorganic pores are observed under the shadows of large sections of rigid grains and most of these pores are filled by OMs with abundant OPs in mudstones, which interconnected to form an OP-dominated pore network (Figure 6a,b). However, pore networks dominated by inorganic pores are observed in the same field of view that contains OP-dominated pore networks (Figure 6c).
If there are abundant soluble grains with large sizes such as feldspar, especially in siltstone or sandstone interlayers, dissolution pores will be abundant and connected to other pores to form effective pore networks h,i and Figure 6d,e). Parts of the dissolution pores were filled by OMs with abundant OPs and formed more complex effective pore networks (Figure 5c and Figure 6d–f).

6. Pore Surface Area, Pore Volume, Pore Size Distribution, and Porosity

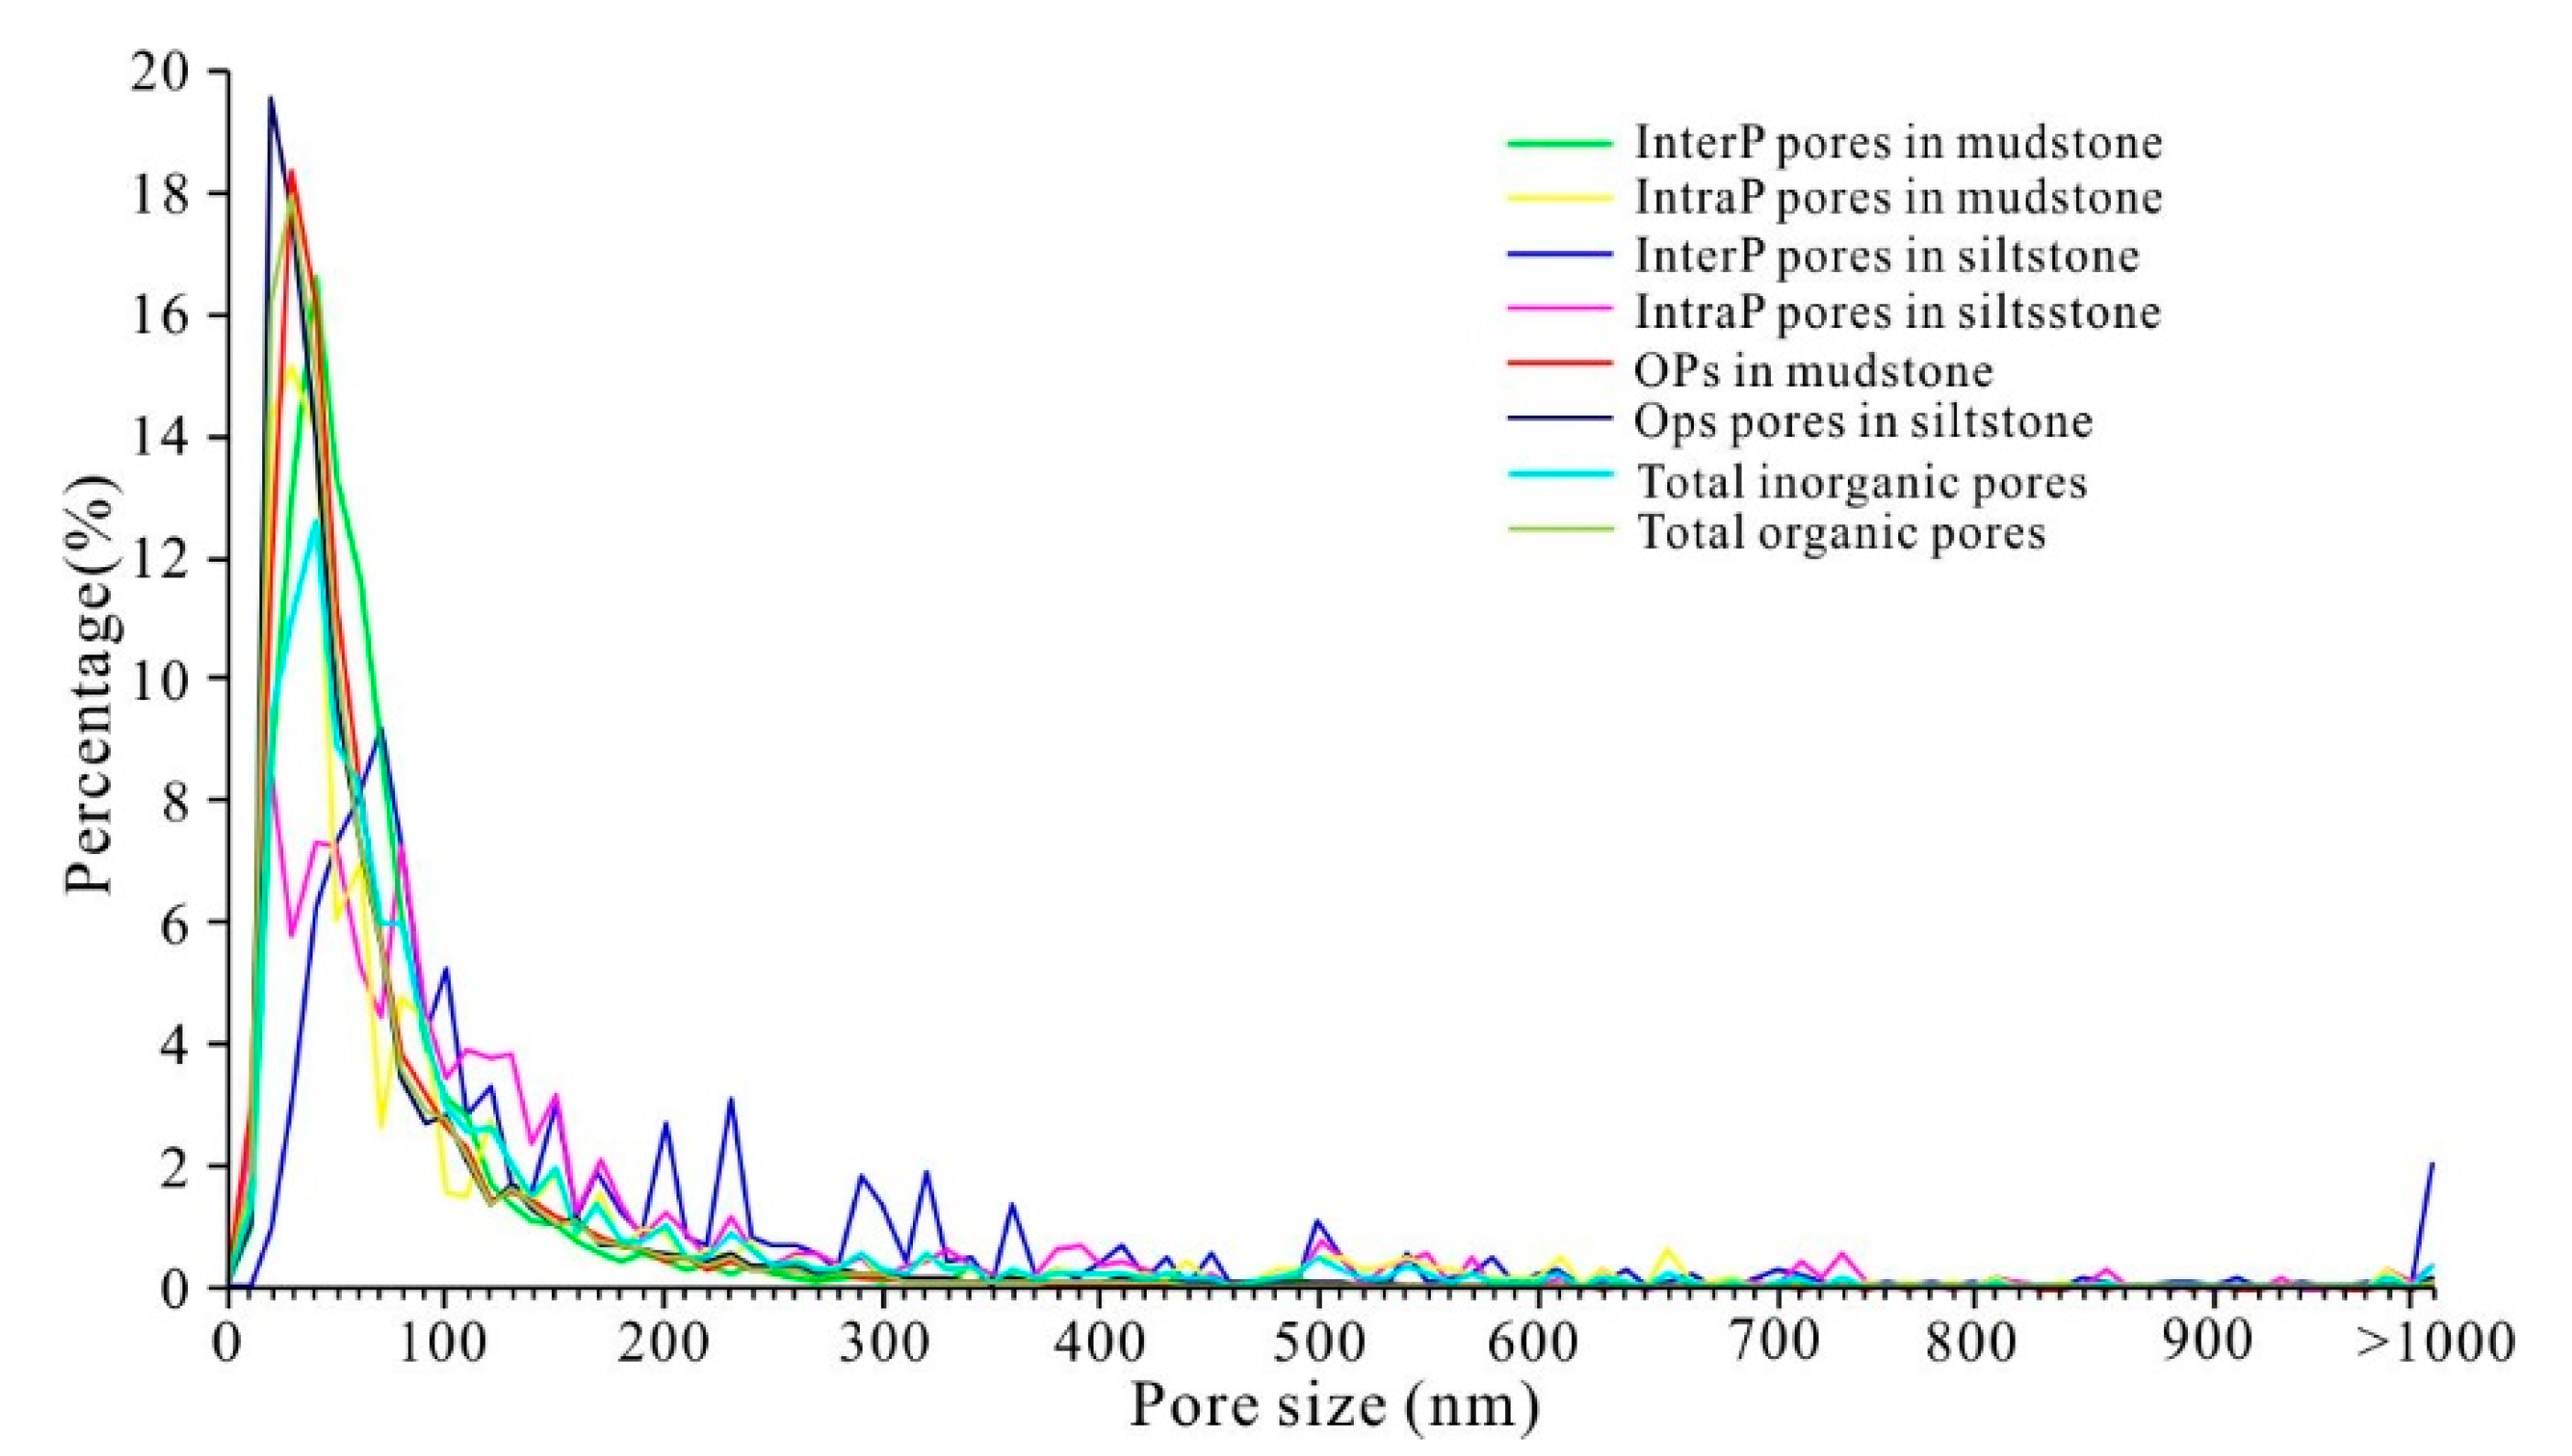
The pore sizes of interP and intraP pores and OPs of siltstone and mudstone were estimated from the SEM images (Figure 7). Most of the diameters of inorganic and OPs are less than 100 nm, which accounts for 81.3%, 70.1%, respectively, of the total. The median pore sizes of inorganic pores and OPs are 58 and 43 nm, respectively. Inorganic pores with sizes greater than 100 nm are more abundant in the siltstone interlayers than those of OPs (Figure 7). The interP and intraP pores with sizes greater than 200 nm are more abundant in siltstones, and the median pore sizes of interP and intraP pores in siltstones are 100 and 89 nm, respectively, while those in mudstones are 47 and 50 nm, respectively (Figure 7).
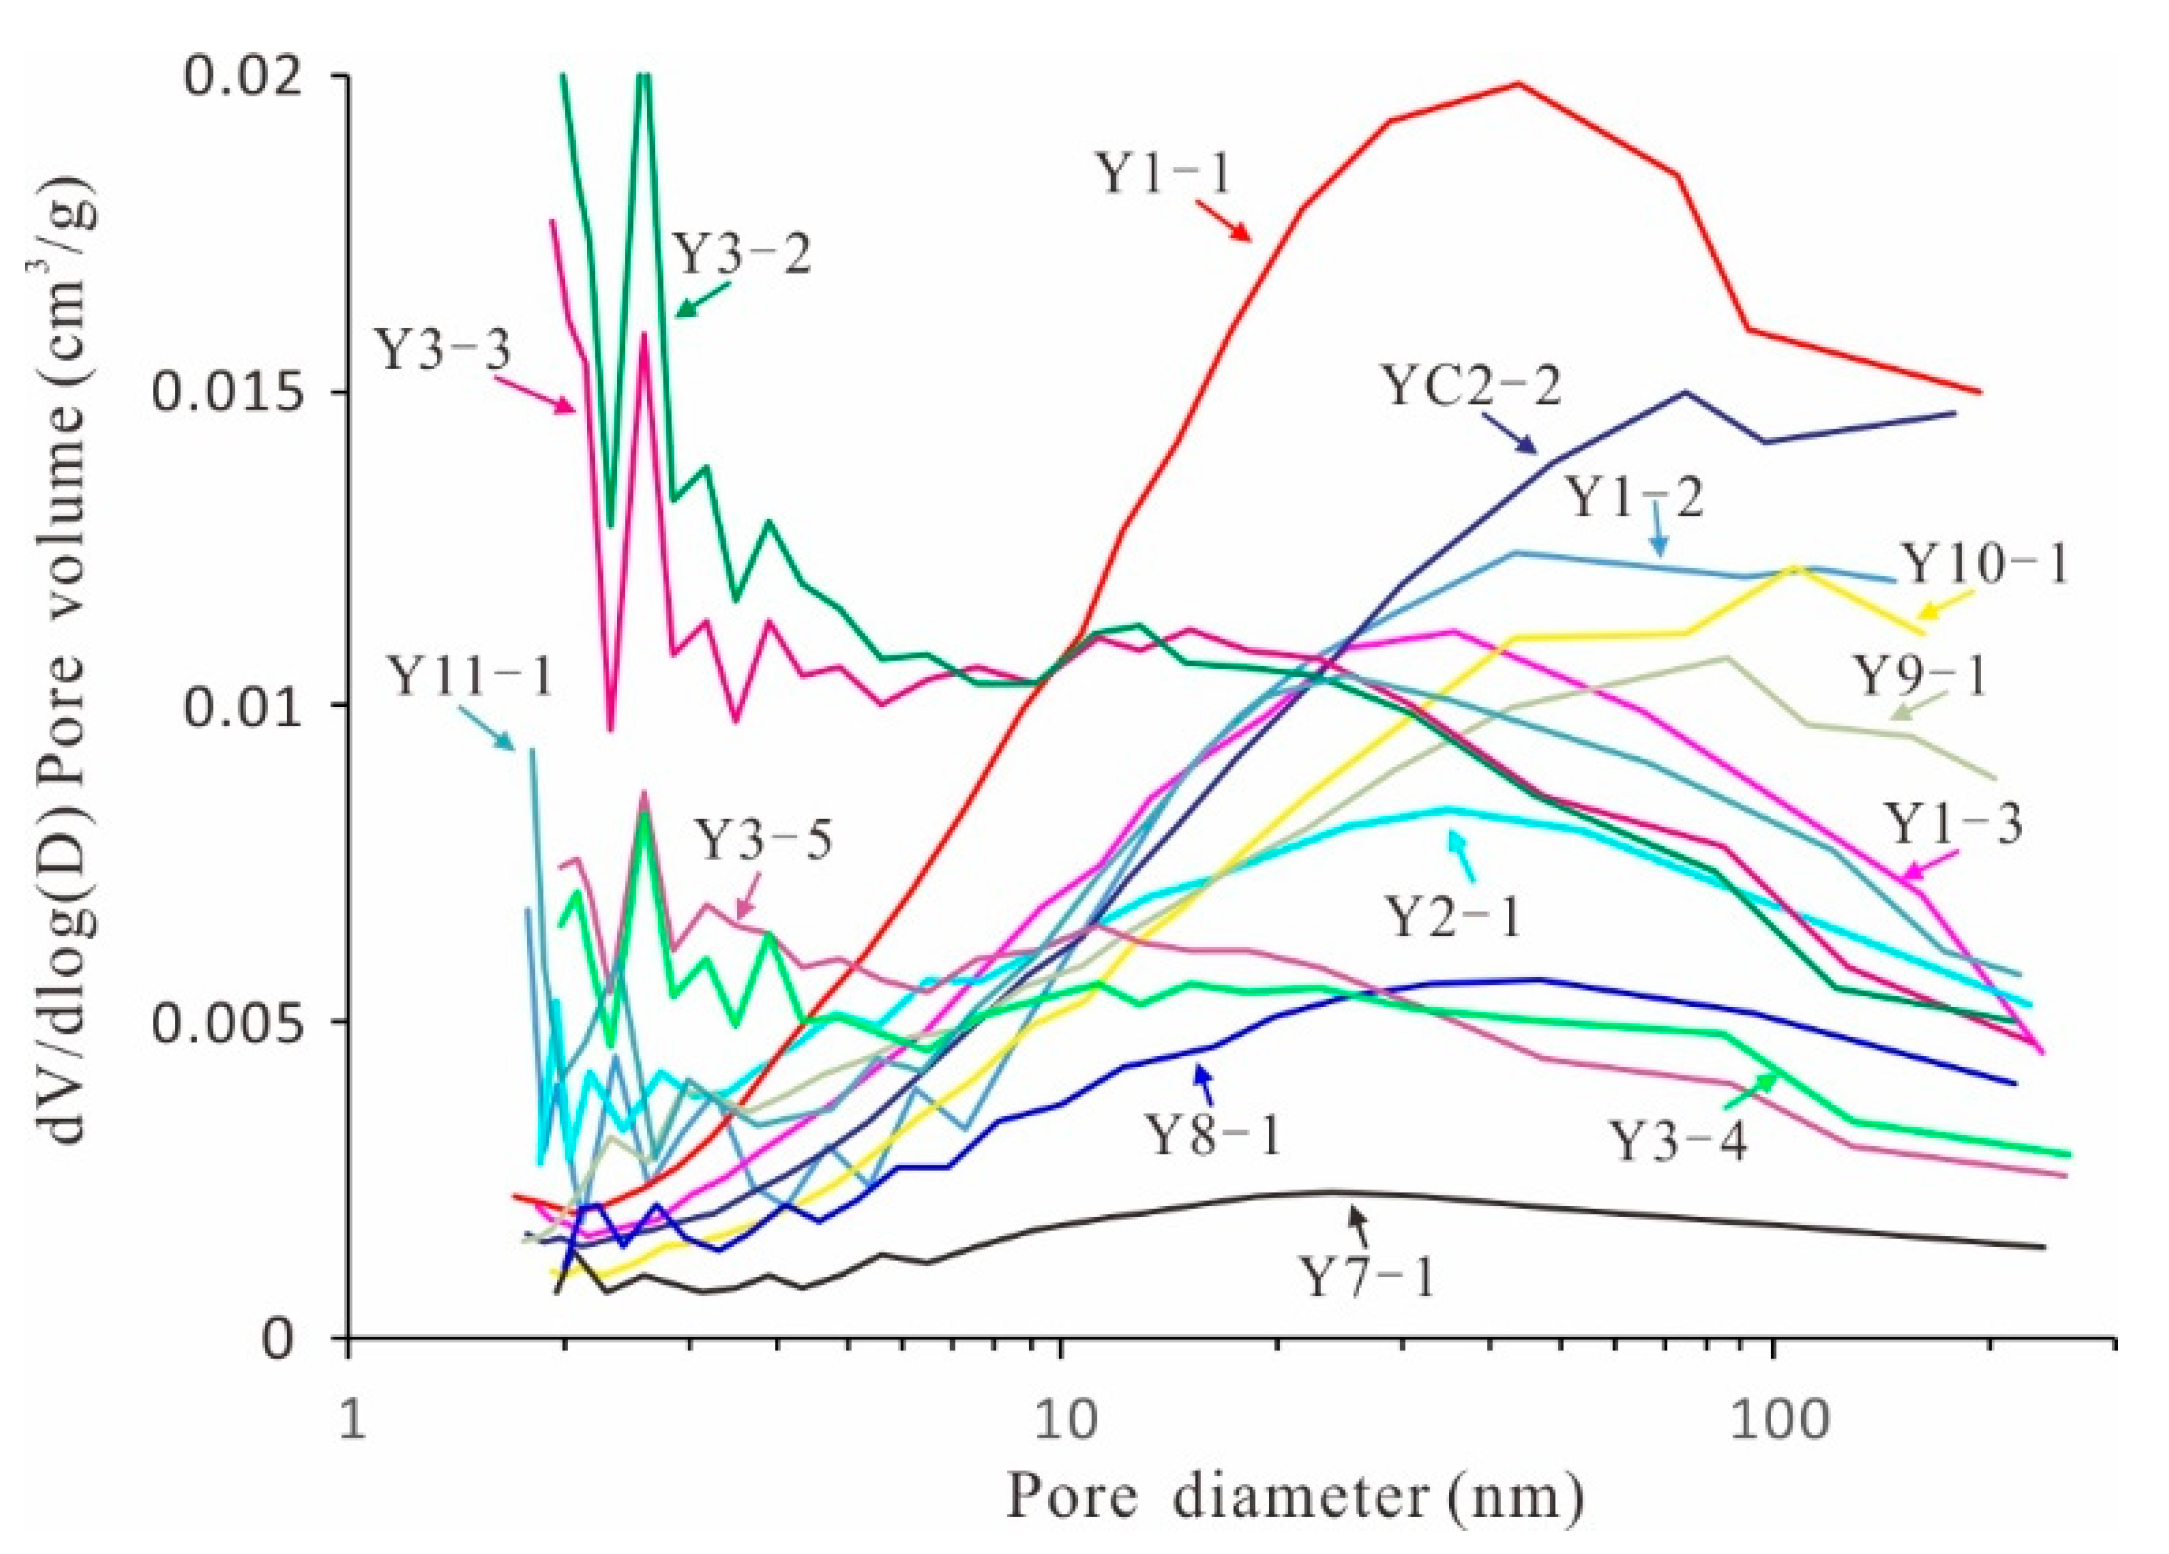
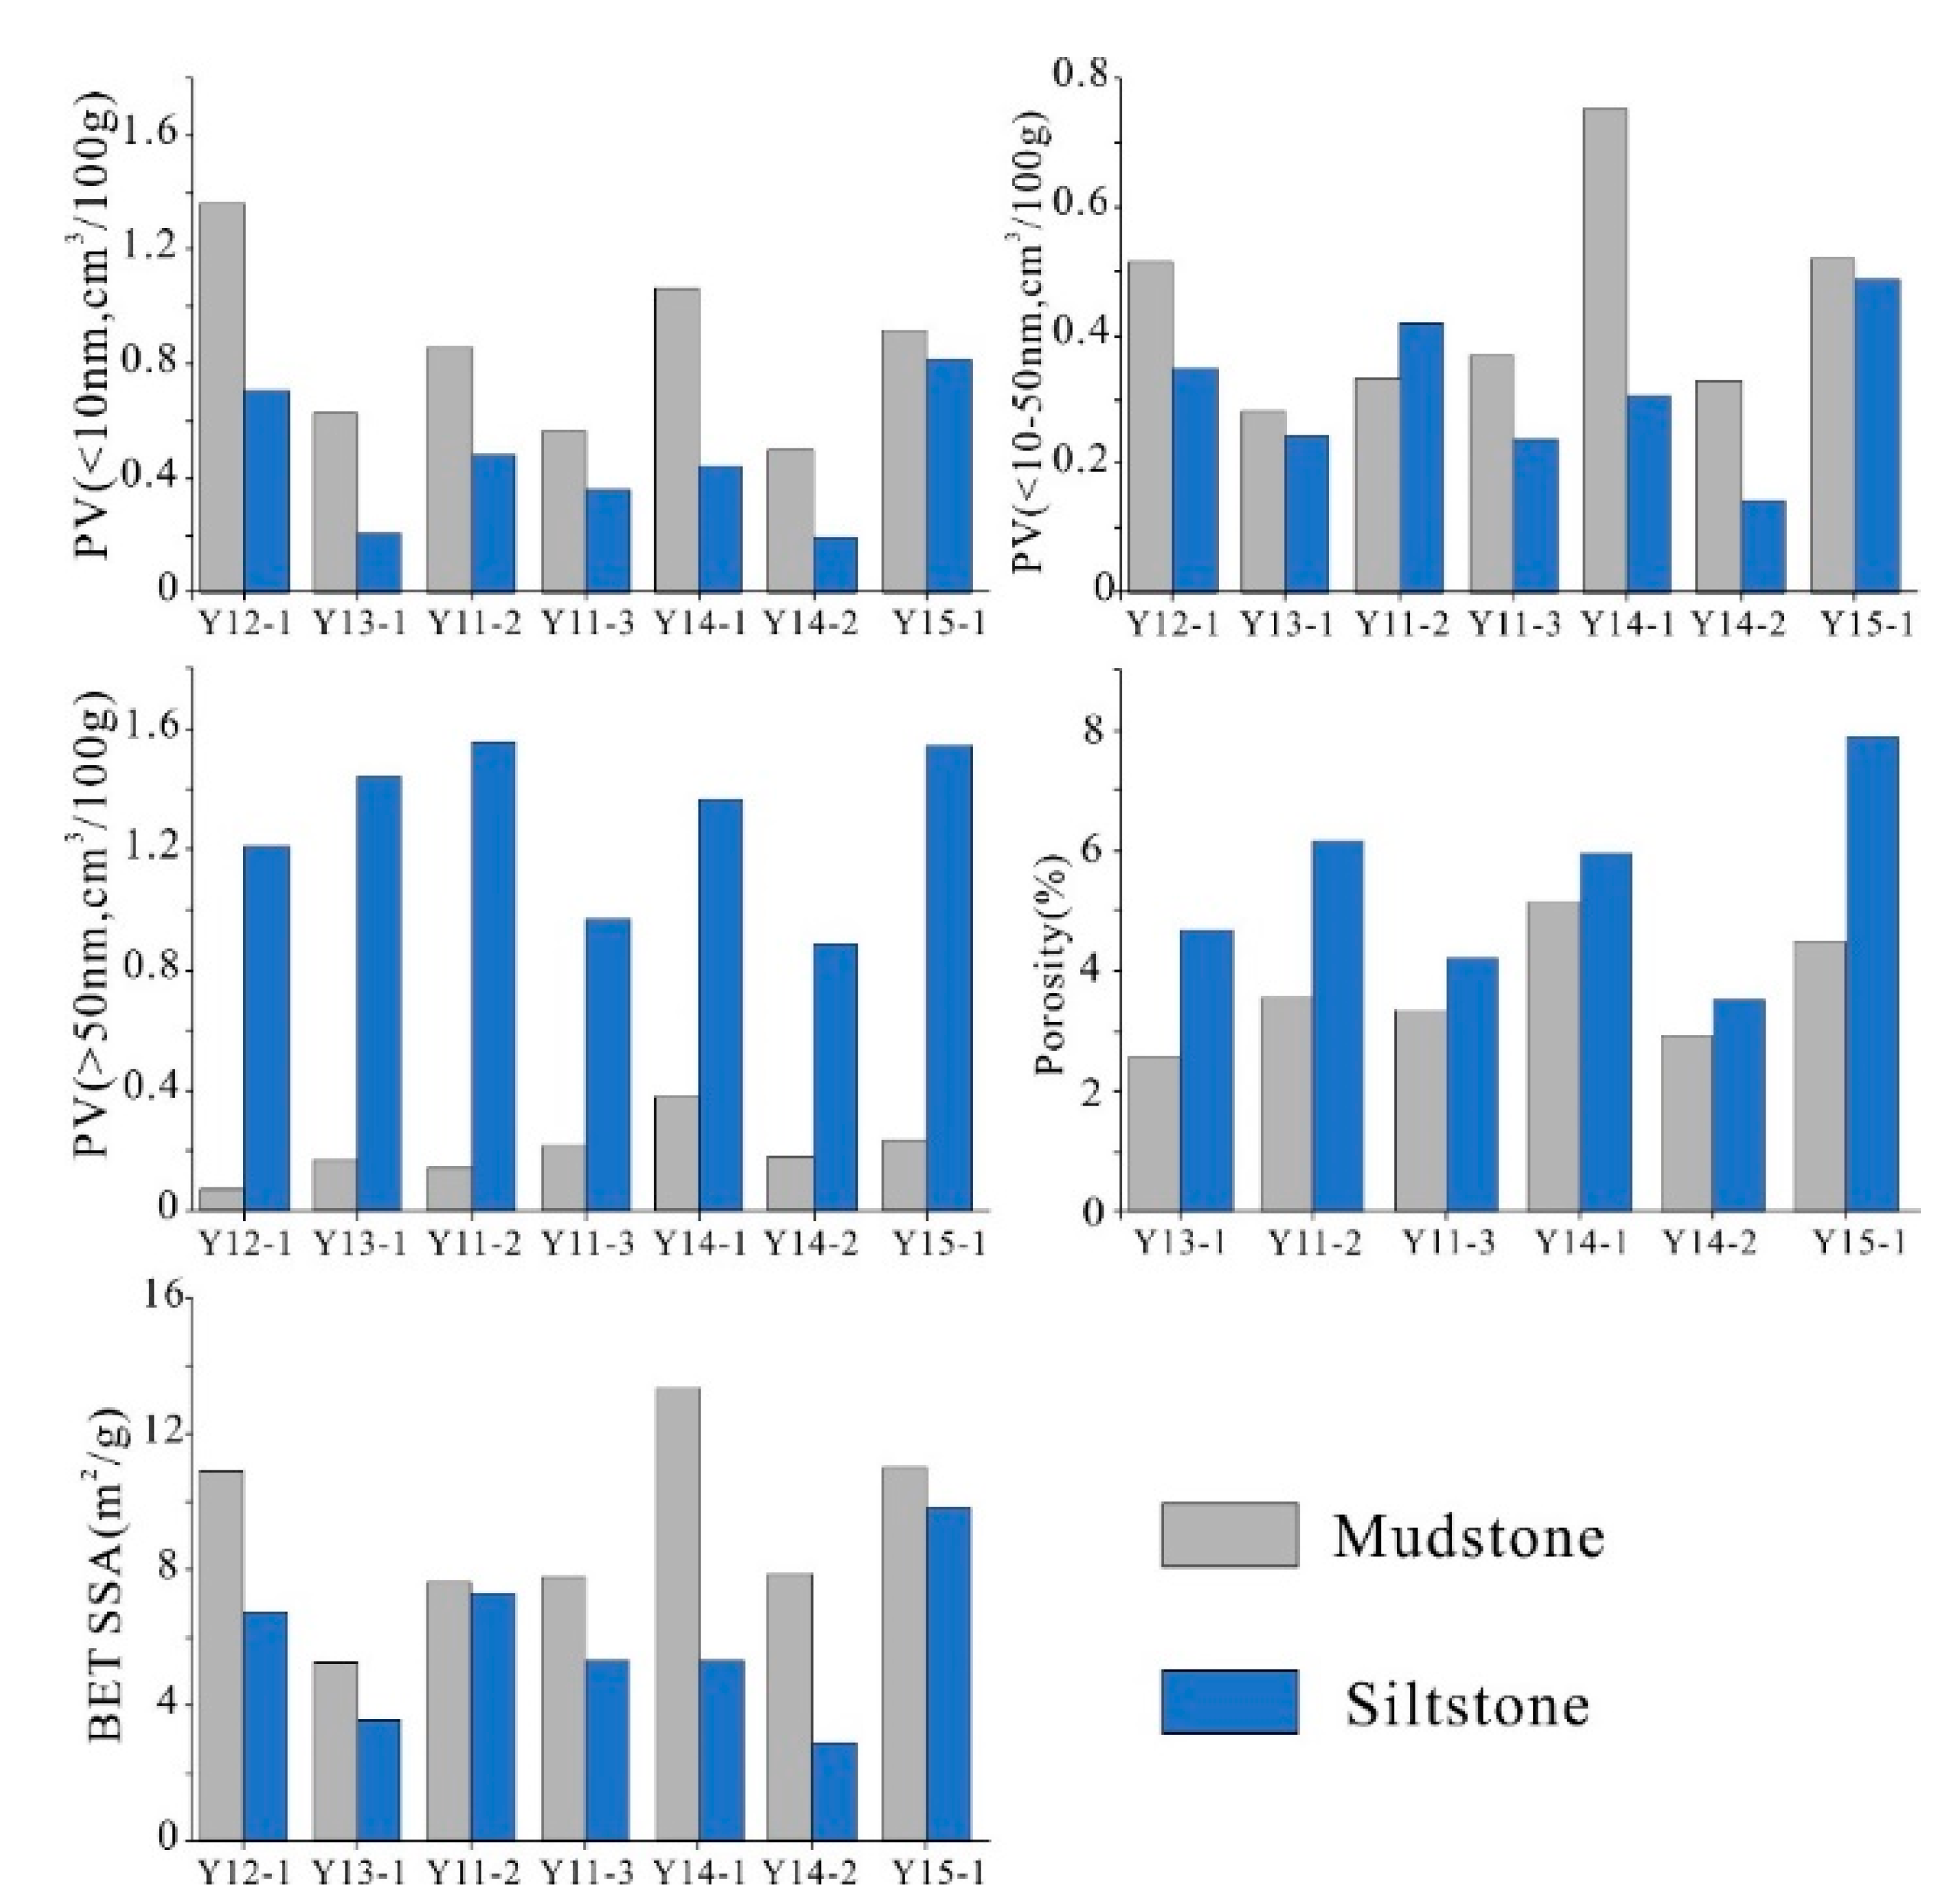
BET SSA, PV, and PSD of the samples were determined by low-pressure nitrogen adsorption analysis (Figure 8, Table 3). The PV, BET SSA, PSD, and porosity of mudstones with relatively higher TOCs are different from those of the siltstone interlayers. Mudstones with higher TOCs usually have more pores with sizes less than 10 nm, higher PV (size < 10 nm), BET SSA but less PV (size > 50 nm), and relatively lower porosity. The siltstone interlayers usually have smaller PV (<10 nm) and BET SSA but relatively higher PV (size > 50 nm) and porosity. For example, the PV (size < 10 nm) of mudstone samples Y3-2 (TOC ~5.67%) and Y3-3 (TOC ~5.46%) are 0.936 and 0.832 cm3/100 g, respectively, and the BET SSA are 13.87 and 10.16 m2/g, respectively. The PV (<10 nm) of siltstone samples Y7-1 (TOC ~1.36%) and Y8-1 (TOC ~2.24%) are 0.187 and 0.145 cm3/100 g, respectively, and the BET SSA are 0.93 and 1.78 m2/g, respectively (Table 3). Mudstones have mean PV (size < 10 m), PV (size between 10–50 nm), PV (size > 50 nm), SSA, and porosity of 0.877 cm3/100 g, 0.482 cm3/100 g, 0.278 cm3/100 g, 9.23 m2/g and 3.89%, respectively, while those of siltstones are 0.392 cm3/100 g, 0.311 cm3/100 g, 1.045 cm3/100 g, 4.85 m2/g, and 5.09%, respectively. The differences are more clearly illustrated by comparisons of the PV, BET SSA, and porosity of siltstones and mudstones separated from the same sample (Figure 9, see the PSD of these samples in Lei et al., 2015). The PV (size < 10 m) and BET SSA of each mudstone are higher than those of the corresponding siltstones from the same sample and the PV (size > 50 m) and porosity are less than those of the siltstones (Figure 9).

7. Controls on Pore Morphology, SSA, and PSD

7.1. Controls on PV and SSA of Organic Matter

Previous studies have documented that TOCs are positively correlated with porosity and SSA and have a significant effect on pore types, pore structures, and porosities in organic-rich shales [30,31]. Smaller pores with a pore size less than 10 nm and especially less than 5 nm, cannot be observed clearly by SEM imaging because of resolution limitations while the PSD and SSA results show that the small pores with sizes less than 10 nm are abundant, especially in shales with higher TOCs (Figure 7, Figure 8 and Figure 9, Table 3). Ross and Bustin [32] and Kuila et al. [33] argued that pores with sizes less than 5 nm in the organic-rich shales are the dominant OPs.
TOCs have good positive correlations with PV (size < 10 nm), BET SSA (size < 10 nm), and total BET SSA of mudstone (Figure 10a,e,f), which indicate that most of the smaller pores (size < 10 nm) are OPs, which contribute to most of the BET SSA (and account for 82% on average), and PV (size < 10 nm) in mudstones. TOCs are also positively correlated with the PV (sizes between 10 and 50 nm) and BET SSA (sizes between 10 and 50 nm) (Figure 10b,d,f) of mudstones (Figure 10c,g). These results indicate that OPs are the most important pore type and provide an important contribution to pore volume and SSA of pores with diameters between 10 and 50 nm in mudstones. PV (size > 50 nm) and BET SSA (size > 50 nm) have no obvious correlations with TOC, which indicates that there are abundant inorganic pores with sizes greater than 50 nm in addition to OPs that may provide a greater contribution to the pore volumes with sizes greater than 50 nm than OPs in mudstones.
Not all OMs in the samples host OPs. Even in the same photomicrograph, OPs are abundant in some OMs while there are few or no OPs in others, as is illustrated in Figure 11a,b. The secondary OM filling the pore space with sheltering by rigid grains develops large numbers of OPs (black arrows), whereas no OPs are observed in the large piece of bedding-parallel OM in Figure 11a (white arrows) or in the terrestrial organic matter OM in Figure 11b (white arrows). The possible explanations for the differences of OPs in OMs are (1) Organic pores were destroyed after hydrocarbon expulsion by compaction due to a lack of sheltering, while those in OMs neighboring compaction-resistant grains were preserved and (2) some terrestrial organic matter (TOM) including vitrinite and inertinite did not develop SEM-visible pores [1,4,13,33]. There are some liquid hydrocarbons and inorganic pores in mudstones and, along with the abovementioned reasons, result in the correlation coefficients (R2) between TOC and PV, SSA, and porosity lower than 0.8 (Figure 10). In summary, TOC is an important factor that affects the PSD, SSA, and PV of mudstones.
Except for PV (>50 nm) and SSA (<10 nm), the other parameters of PV, SSA, and porosity of siltstone interlayers have slight positive correlations with TOC (Figure 10). The possible explanations are that (1) there were more liquid hydrocarbons in the siltstones (see Figures 11 and 15 in Lei et al. [12]); (2) porous OMs filled some of the inorganic pores (Figure 5 and Figure 6); and (3) more inorganic pores developed in the siltstones (Figure 4, Figure 6b, and Figure 9) and had greater contributions to the pore volume than OPs, especially to PV (>50 nm). According to the pore types observed and diameters measured by the SEM images and PV, SSA, and PSD tested by gas adsorption, it can be inferred that OPs were not the predominant pore type, and TOC was not the most important controlling factor of PV, SSA, and PSD in siltstone interlayers.
The PV (size <10 nm), PV (10–50 nm), SSA (size <10 nm), and total BET SSA of mudstone with siltstone interlayers have positive correlations with TOC (Figure 10). The PV and PSD of mudstones with siltstone interlayers vary significantly and the predominant pore types and main controlling factors of PV, SSA, PSD are uncertain. These probably depend on the TOC and the abundance of siltstone interlayers.

7.2. The Effect of Thermal Maturity on OPs

Some studies have documented that secondary OPs commonly develop in gas window maturity or oil window samples with maturities greater than 0.9% and that organic porosity and SSA in OMs increase with thermal maturity [34,35,36]. However, other studies have reported that organic pores were observed in low-thermal-maturity OMs (Ro < 0.9%) and even immature OMs [29,37,38], which suggest that organic porosity is not restricted to thermal maturity.
To investigate whether the OPs that developed in shales with maturities below 0.9% and how thermal maturity controls OPs, OPs were observed in samples with VRo values ranging from 0.5% to 1.25% by SEM imaging (Figure 11). The results show that OPs were observed in all samples with different maturities, while there were some differences in pore size, morphology, and organic porosity (Figure 11c–h).
The OMs in sample Y5-1, with a thermal maturity of approximately 0.5%, developed abundant spongy OPs with round, subround, and elliptical pore shapes, while bubble OPs are also observed (Figure 11c,d). The pore sizes are usually less than 30 nm and Ra values are generally less than 10%. Most OPs are isolated and exhibit small sizes in two dimensions. The OPs that neighbor pyrite, siderite, or clay minerals may have exhibit greater pore sizes (Figure 11d), which are probably due to the catalytic reaction of minerals in the thermal degradation process of OM [4]. SEM-visible bubble and spongy OPs are commonly observed in Y6-1 (VRo ~0.85%), while some neighboring pores merged to form larger and complex pores (Figure 5a and Figure 11e). The diameters generally vary from several nanometers to 300 nm, while most are less than 50 nm and the Ra value is generally less than 15% but can range up to 20%. The pore sizes and Ra values of OPs are greater than those of Y5-1. The OPs are more abundant in samples with thermal maturities greater than ~0.9% and have larger pore sizes and Ra values (Figure 5b–i, Figure 6, and Figure 11f–h). Some of the OPs in the samples with VRo values higher than 0.9% merged to form complex pores with sizes greater than 1 µm and the Ro values are usually higher than 20% (Figure 5b–i, Figure 6, and Figure 11f–h). It seems that the abundance of OPs in the Yanchang Shale increased with increasing thermal maturity. However, the SEM observation results show that the pore sizes and abundance of OPs in samples with VRo values of approximately 1.0% are not significantly different from samples Y7-1 (VRo ~1.1%) and Y4-1 (VRo ~1.25%) (Figure 11f–h). This may be because the size, morphology, and abundance of organic pores are related to both maturity and the OM types, origin, and occurrences (OMs fill which types of pores or voids and whether they are sheltered by compaction-resistant pressure shadows).

7.3. Controls on Pore Volume and SSA of Mineral Composition

Feldspar and quartz are the main rigid components in Yanchang lacustrine shales, which form a sheltering effect to inhibit compaction and then preserve residual pores [39,40]. Soluble minerals such as feldspar, siderite, and calcite commonly develop dissolved pores (Figure 3f–i and Figure 6d–f). Clay minerals are also one of the main components hosting interP and intraP pores in Yanchang lacustrine shales (Figure 4c,d,j). Therefore, mineral compositions may likely have important effects on porosity.
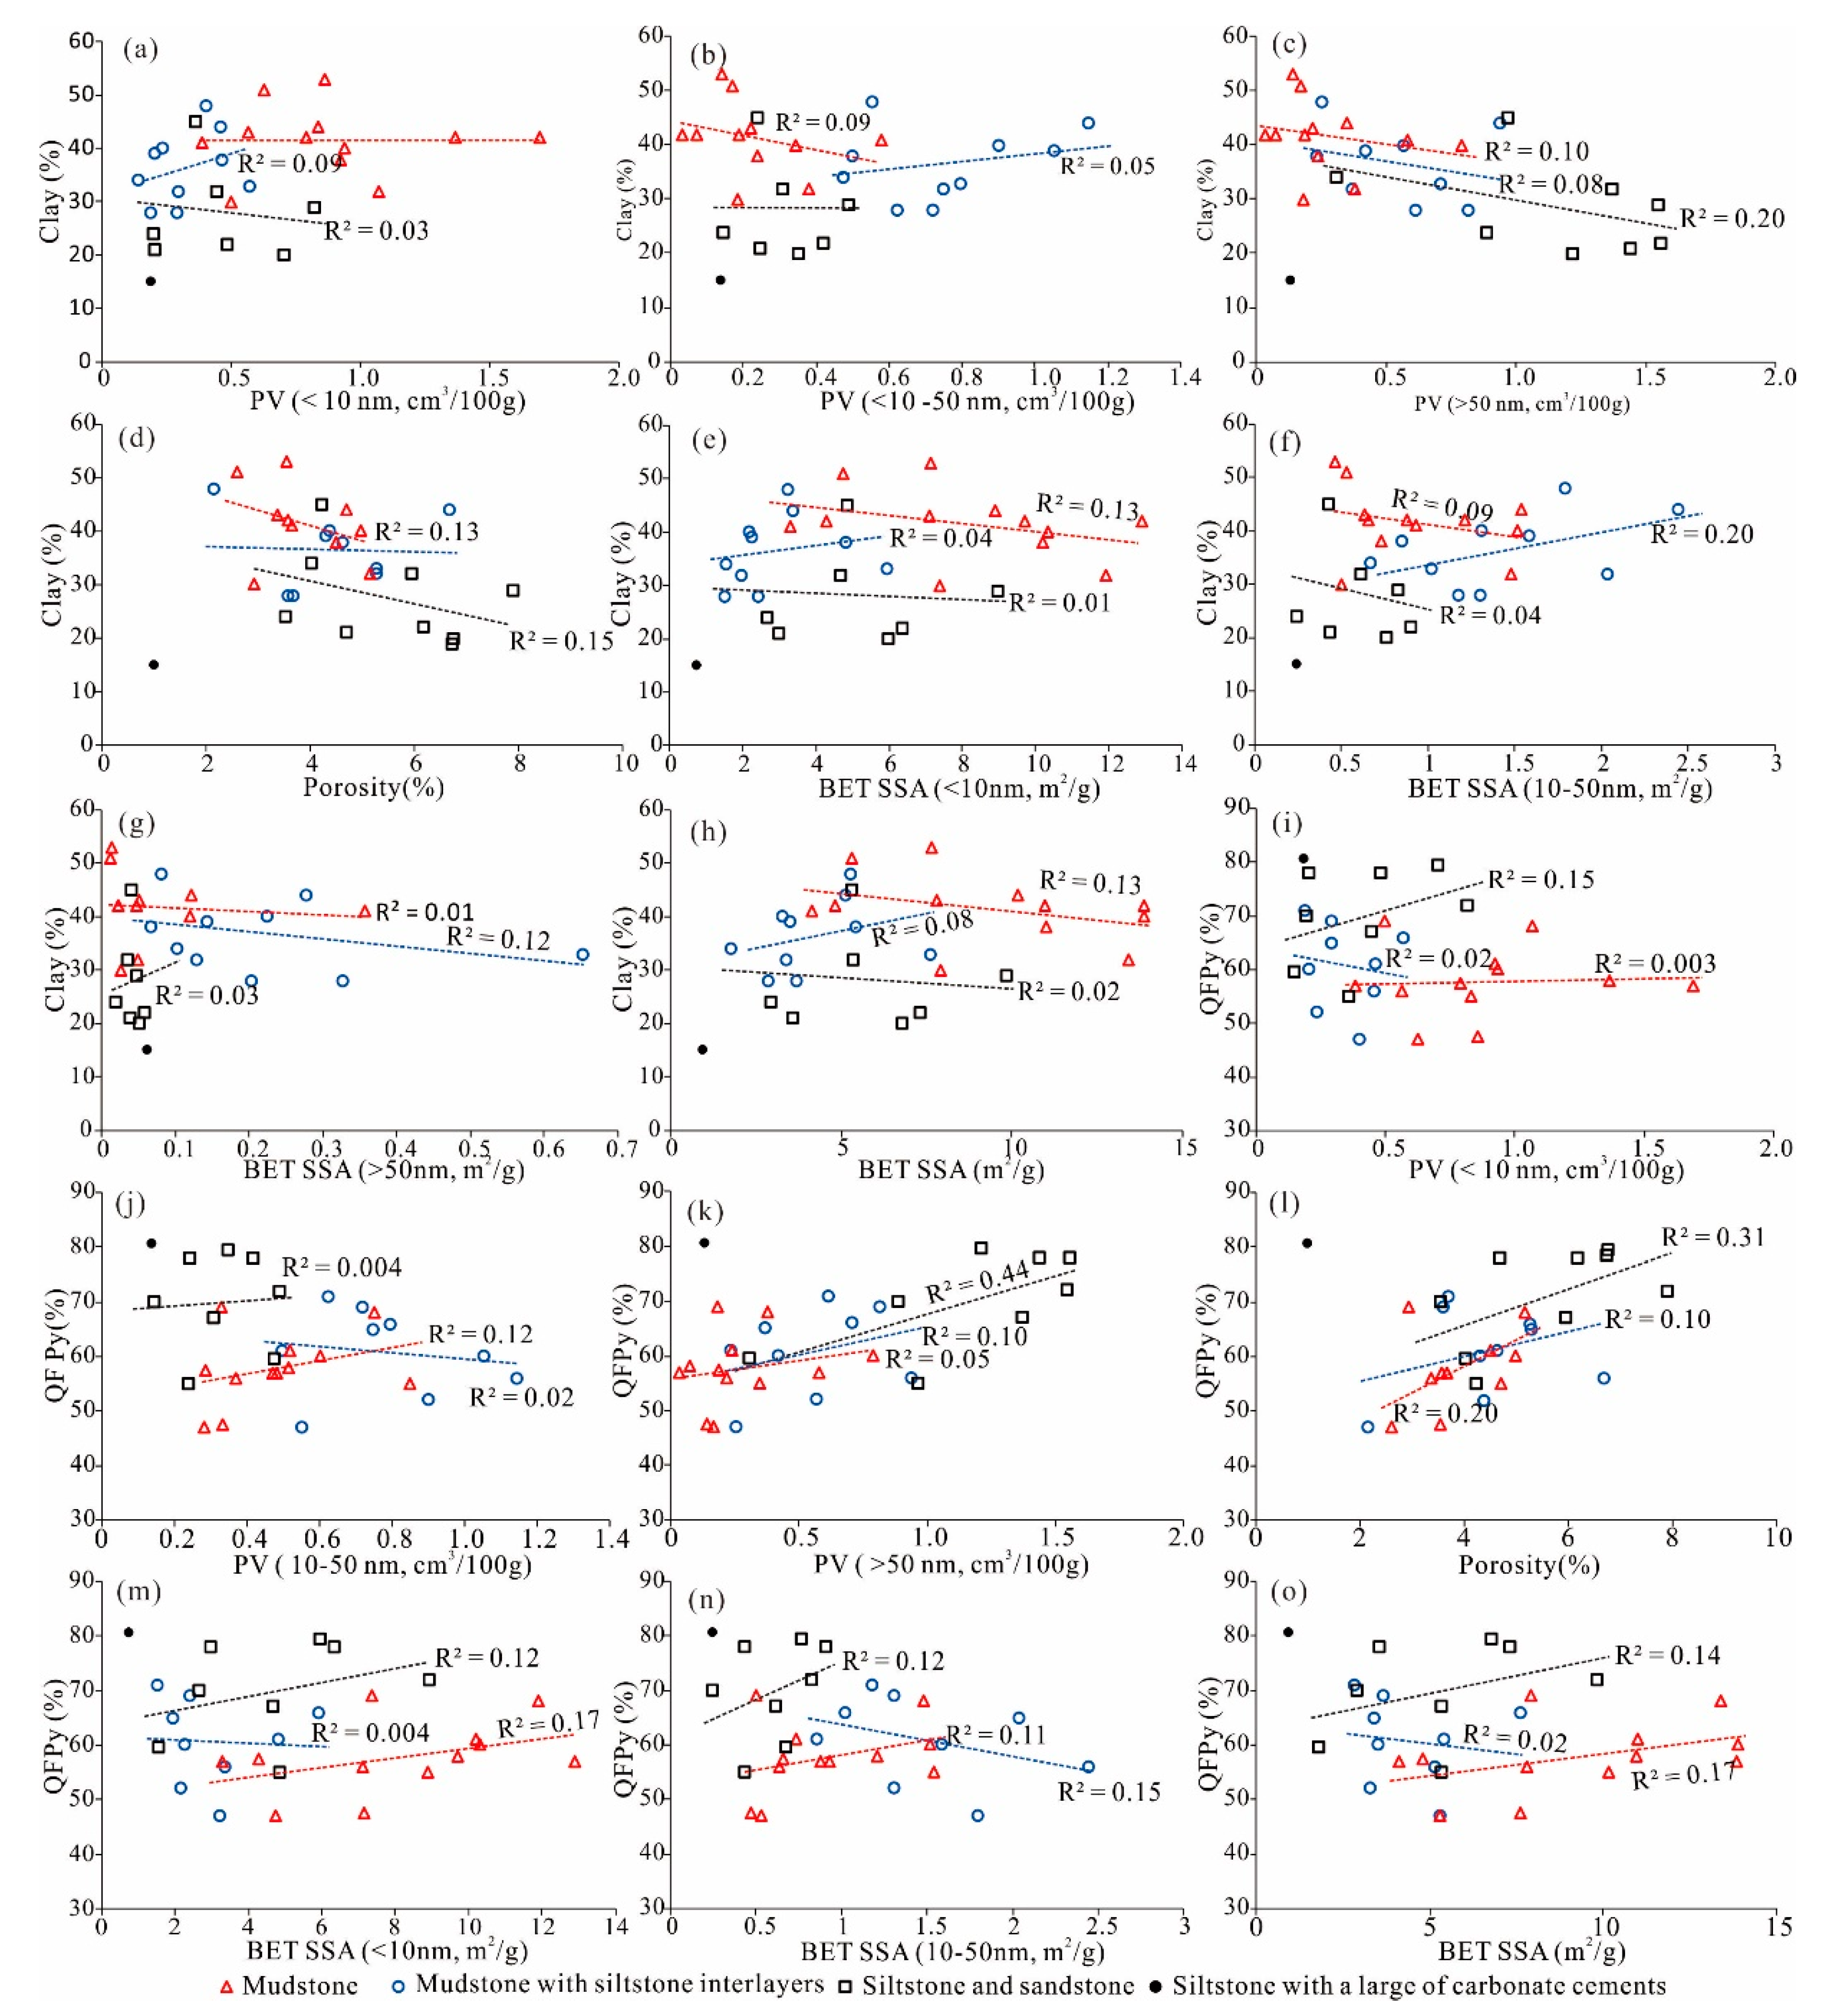
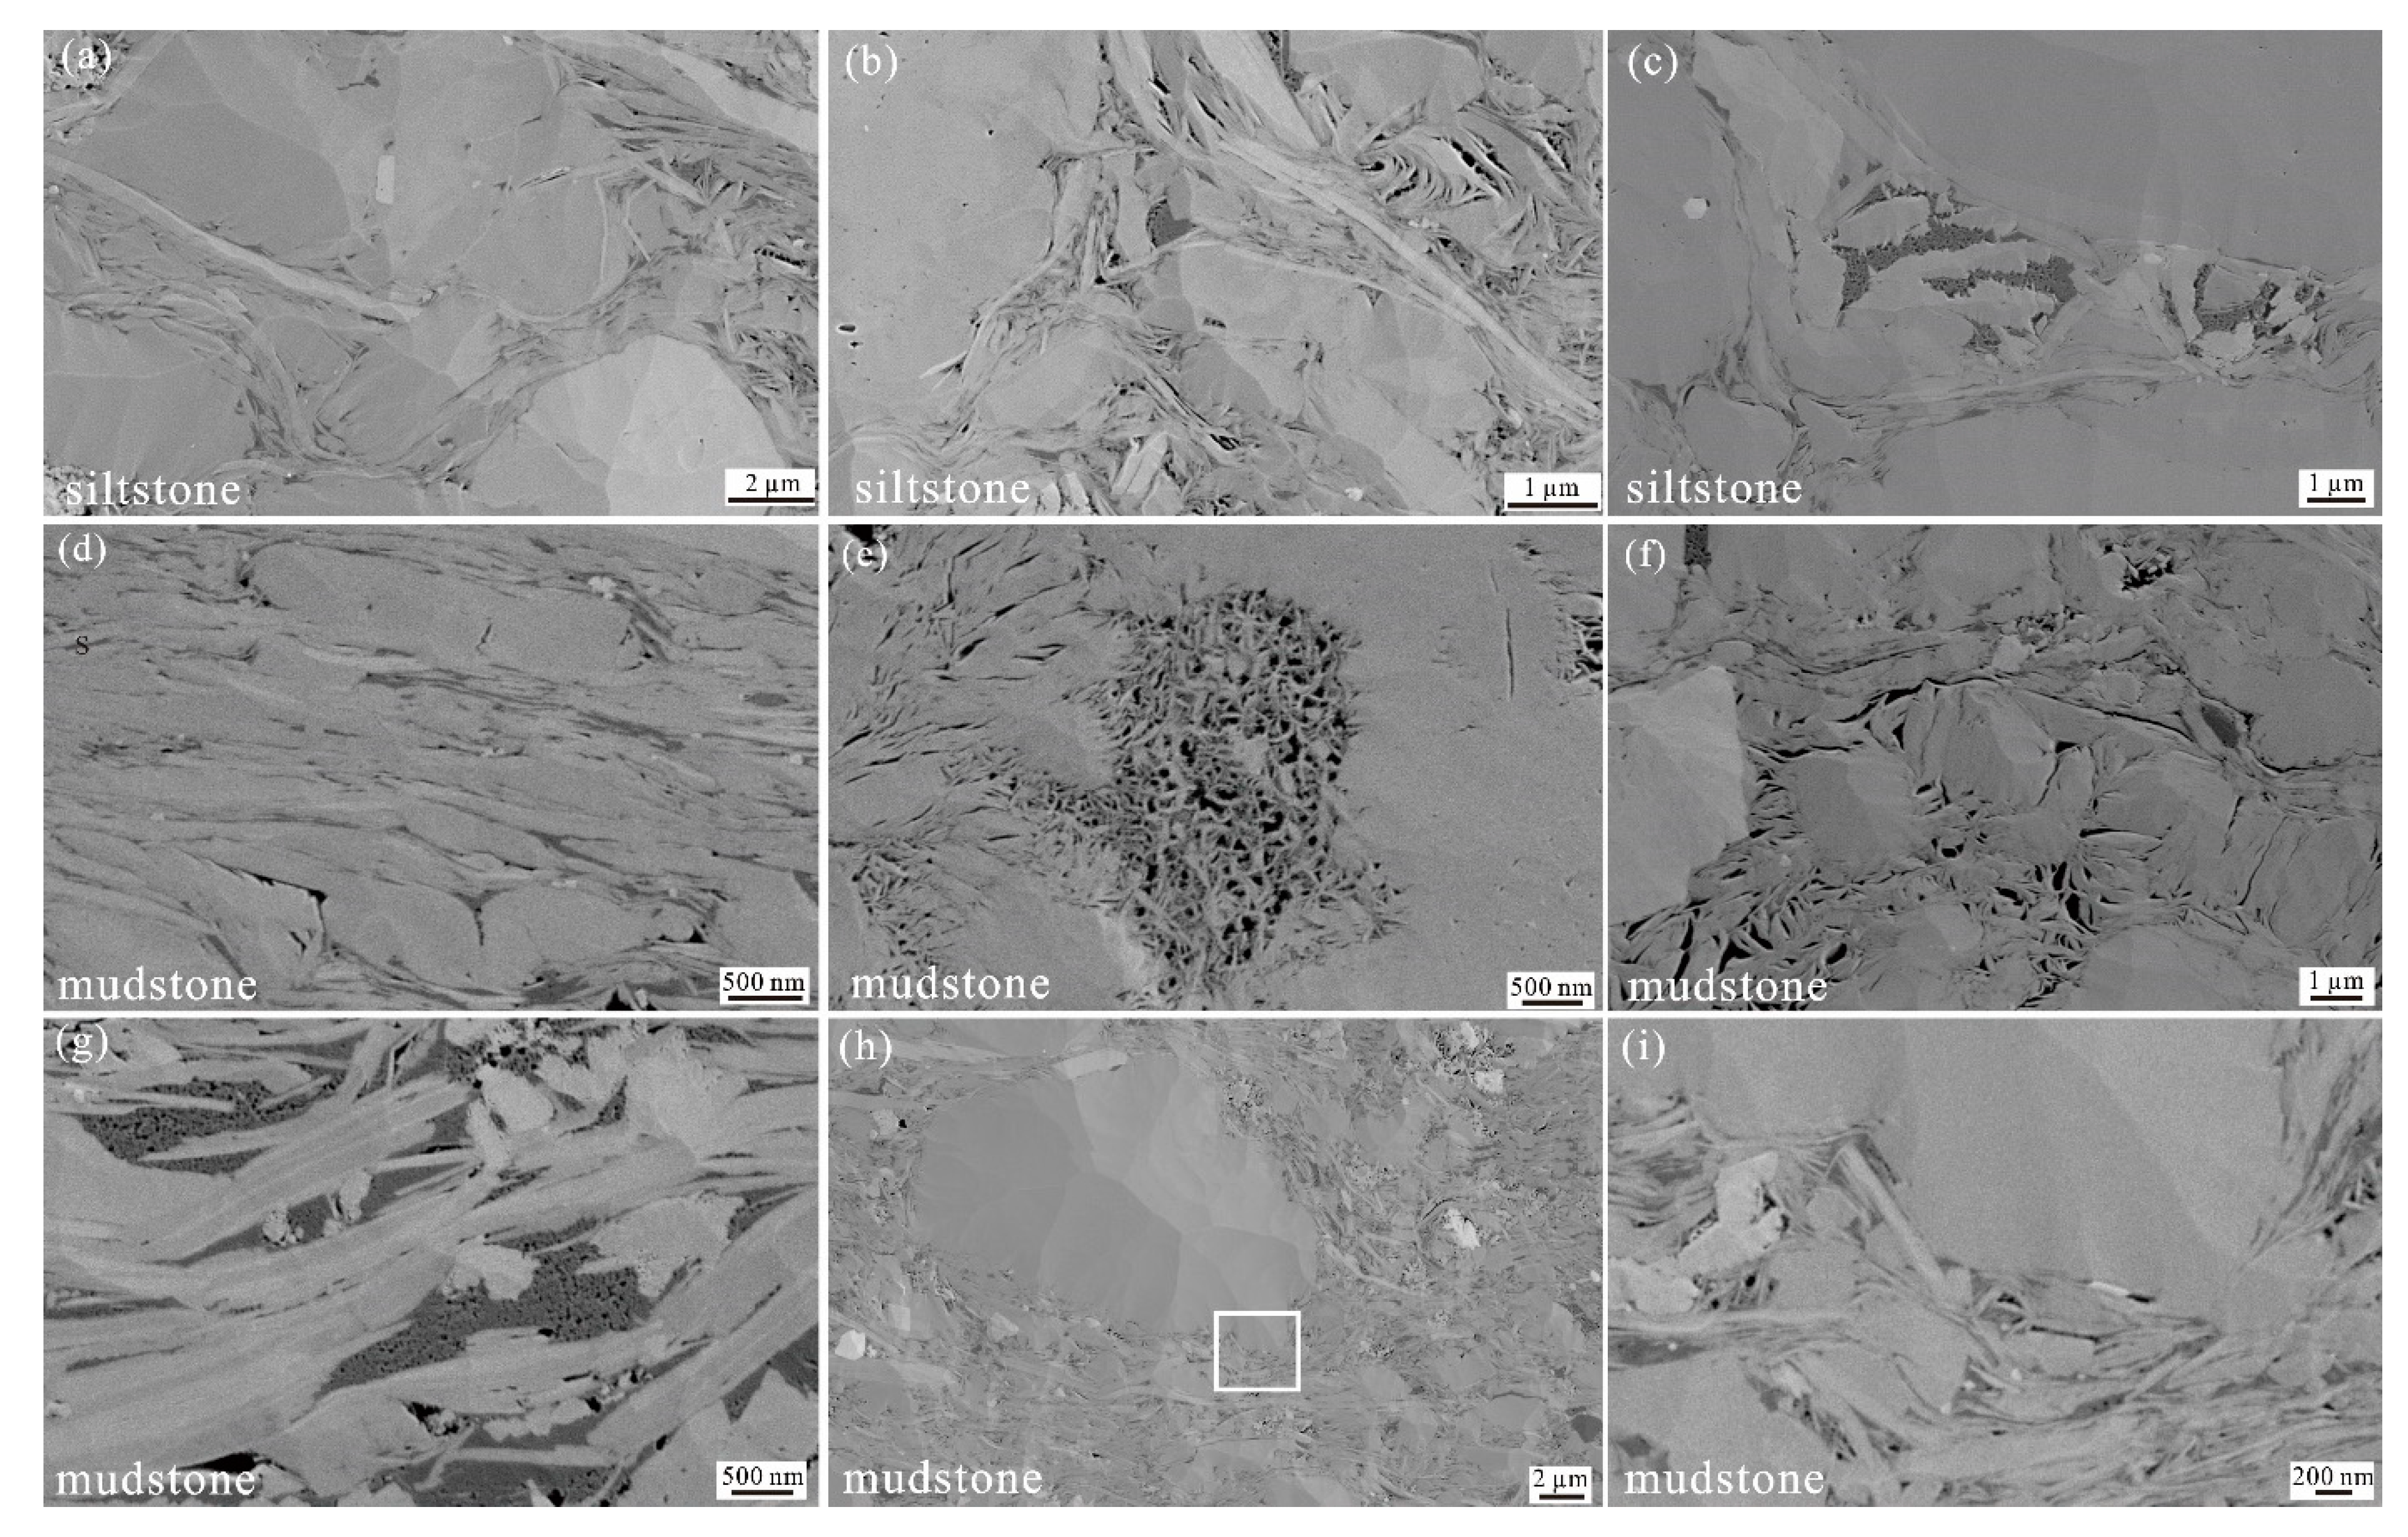
The clay mineral contents of the siltstone interlayers have negative correlations with PV (>50 nm) and total porosity but have very weak or no correlations with the other parameters of PV and SSA (Figure 12a–h). These results indicate that more clay minerals may have reduced the volume of pores with sizes greater than 50 nm and the total porosity in siltstone interlayers. It appears that the clay mineral content had no significant effect on the PV (<10 nm), PV (10–50 nm), and SSA. The possible explanations are that (1) the grain sizes of clay minerals in siltstone interlayers were relatively smaller and generally filled the space between rigid grains or preexisting pores, which reduced porosity (Figure 4j, Figure 6e, and Figure 13a,b); (2) some of the ductile clay minerals, which lacked compaction-resistant pressure shadows, had few or no pores due to compaction (Figure 13a); and (3) the pore sizes of a large number of pores in clay platelets or aggregates are generally less than 50 nm and some of these pores are scattered and isolated (Figure 13a,b).
The sum of feldspar, quartz, and pyrite contents (QFPy) of the siltstone interlayers are positively correlated with PV (>50) and total porosity, while they have no correlations with the other parameters of PV and SSA (Figure 12i–o). These results mean that PV (>50) and porosity increased with increasing amounts of PFPy in siltstone interlayers. In fact, quartz, feldspar, and pyrite are rigid grains with larger grain sizes and commonly formed sheltering compaction-resistant pressure shadows to preserve inorganic pores and the OPs of OMs fill these pores (Figure 4a–e,j,k, Figure 6 and Figure 11g,h). Feldspars are soluble and usually contain many dissolution pores with sizes greater than 50 nm (Figure 4g–i, Figure 6d–f, and Figure 11g,h) and there are many intercrystalline pores in secondary quartz, pyrite aggregates, or OPs in OMs filling those dissolution pores (Figure 4e,k, Figure 6d,f, and Figure 11g,h).
The clay mineral content of mudstones has no or very weak correlations with PV, SSA, and porosity (Figure 12), which indicates that the clay mineral content of mudstones may have had no significant effect on PVs and SSA. PVs were reduced by filling clay minerals in the pore spaces between rigid grains and destroyed the pores in clay platelets due to compaction (Figure 13d–f). On the other hand, some pores were preserved in the clay platelets and clay aggregates adjacent to rigid grains (Figure 13e,f). Furthermore, clay minerals and OMs usually formed complexes, and abundant OPs were observed in those OMs (Figure 13g). The abovementioned factors complicate the relationship between clay minerals and PVs in mudstones. The QFPy content of mudstones also exhibits very weak or no correlations with PV, SSA, and porosity (Figure 12), which means that the QFPy content may not be the main controlling factor that affects PVs and SSA in mudstones. A large number of rigid grains are of relatively smaller grain size, and some of them are scattered in mudstones (Figure 13h). Therefore, the abundance of preserved pores due to sheltering by rigid grains is lower than that in siltstones (Figure 13i). This is because sheltering by rigid grains to preserve pores is related to the abundance of rigid grains and also depends on the grain size, grain sorting, alignment, and distribution, which will be described later.

7.4. The Effect of Diagenesis on Pore Size and PSD

Compared to sandstones, diagenesis (including cementation and dissolution) in organic-rich shales and siltstone interlayers is relatively weaker. However, because soluble particles such as feldspar were abundant in the Yanchang Shale, dissolution of feldspar, calcite, and siderite was common (Figure 4f–i, Figure 6d–f, Figure 7c, and Figure 14), and dissolution pores developed, which increased the porosity. Moreover, secondary minerals such as quartz, clay minerals, siderite, pyrite, and calcite are observed both in mudstone and siltstone interlayers (Figure 4e,f,j,k, and Figure 14). These secondary minerals filled the preexisting pores and reduced porosity. In particular, if large amounts of secondary carbonate filled the pores, the PV and porosity were significantly lower. For example, Y7-1 is a siltstone sample that was separated from mudstones with siltstone interlayers. In this sample, large amounts of calcite, dolomite, and siderite filled the pores (Figure 14e–i). As a result, the BJH PV, BET SSA, and porosity were very low at 0.092 cm3/g, 1.78 m2/g, and 0.99%, respectively. However, cementation also formed some intercrystalline pores in the secondary minerals or interP pores between crystals and grains (Figure 4e,j,k, and Figure 14i). Some cements grew along the pore edges and formed a rim of cement overgrowth to resist compaction or inhibited further cementation to preserve these pores (Figure 14a,c). Some of the secondary minerals can create compaction-resistant pressure shadows to help preserve pores (Figure 14b) or develop new pore space (Figure 4e,j,k, and Figure 14i). Furthermore, some of the secondary minerals such as pyrite and clay aggregates may be related to the catalysis of hydrocarbon generation and degradation, which was helpful for forming OPs [4].
The secondary solid organic matters are “special cements” that filled preexisting pores and decreased porosity (Figure 7c,d, Figure 9, and Figure 15g,h). On the other hand, abundant OPs developed and were preserved in the porous OMs filling those pores (Figure 7c,d, Figure 9, and Figure 15g,h), which increased the PV of OPs and the SSA.

7.5. Controls of Texture, Fabric, and Siltstone Interlayers on PV and PSD

When mudstones were deposited, primary porosity decreased significantly due to the destruction of primary pores by mechanical compaction and cementation. Therefore, preservation of the primary pores, secondary inorganic pores, and OPs during burial and compaction was crucial to the PV and porosity of shale reservoirs. This preservation depended on the texture and fabric including the abundance, grain size, and grain sorting of rigid detrital particles and on the abundance distribution of siltstone interlayers. It was also related to the occurrence of OMs in shale reservoirs.
The rigid grains with relatively larger grain sizes usually formed compaction-resistant pressure shadows during compaction and many residual pores were preserved (Figure 13a,b). The abundance of rigid grains with relatively greater sizes affected pore diameters and the abundance of residual pores. When greater numbers of rigid grains with greater sizes were present in reservoirs, the more rigid grains provided mutual support to resist compaction, and more interP pores, intraP pores, and OPs with greater diameters were preserved (Figure 15c,d). Where there were more ductile particles but a lack of compaction-resistant grains, only a few pores with smaller sizes developed or had no SEM-visible pores due to strong compaction (Figure 13a,b,d).
Grain sorting also affected the preservation and abundance of inorganic pores and OPs. Greater numbers of residual pores with relatively greater diameters are observed in samples with better grain sorting of rigid particles, even for those samples with relatively smaller grain sizes but with better grain sorting (Figure 15e); this result is because few or no detrital particles with smaller sizes filled the spaces between compaction-resistant grains. The abundance of residual pores is lower in samples with poor grain sorting, even in samples with larger grain sizes. Since the voids between rigid particles were partially filled by detrital particles with smaller sizes, the residual pore sizes were smaller (Figure 15f,g).
The alignment of detrital particles is also related to the abundance, morphology, and pore size of the preserved residual pores. When ductile detritus (e.g., clays and biotite) were oblique to the bedding at angles greater than ~45 degrees, some pores with elongate, triangular, ellipsoidal, and polygonal shapes with relatively greater diameters developed due to splitting between phyllosilicate sheets or cleavages by vertical compression (Figure 15h,i). However, when the ductile detritus was roughly aligned parallel to the bedding and was deformed, it had few linear pores or no pores at all due to compaction (Figure 13d,i and Figure 15i). As illustrated in Figure 15i, many primary pores developed in the clay minerals that were nearly vertically oriented to the bedding (white box), while there were few pores in the clay minerals that bent around the rigid grains at lower angles; most of the primary pores in these clay minerals were destroyed by compaction.
The occurrence of porous OMs also affected the preservation of OPs. Large numbers of OPs were flattened or destroyed by mechanical compaction during burial when there was a lack of compaction-resistant sheltering. As shown in Figure 15j,k, there were many detrital particles in the large fragments of OMs. The ductile clay minerals included in the OMs were deformed and aligned roughly parallel to the bedding or were bent around rigid grains and the OMs were squeezed into the spaces between rigid particles or around the rigid grains, which indicated that the OMs underwent strong compaction and most of the OPs may have been destroyed. The portion of OM that was squeezed into space between rigid grains (Figure 15j,k, white arrows) or in dissolution pores or pores between rigid grains had some OPs preserved because of the sheltering effect of rigid grains (Figure 14a–c and Figure 5c,l).
The siltstone and sandstone interlayers usually have more well-sorted rigid grains with relatively larger sizes, and therefore, more interP and interP pores and the OPs were preserved during burial owing to the greater sheltering by compaction-resistant grains compared to mudstones (Figure 4g,h, Figure 6d–f, and Figure 15c,d,l). Therefore, the siltstone and sandstone interlayers usually had greater total PV and porosity compared to the adjacent mudstones. In addition, the rigid grains with greater sizes in the parts neighboring siltstone and sandstone interlayers of mudstones were more abundant than the other parts (Figure 2e). Therefore, the total PV and porosity of shale reservoirs may have increased with the increasing abundance of siltstone and sandstone interlayers.

8. Discussions

Organic-rich mudstones generally have higher TOC, clay minerals, PV (<10 nm), PV (10–50 nm), and SSA than siltstones. The pore volume of pores with sizes less than 50 nm accounts for ~83% of the total pore volume. Additionally, approximately 60.4% of the OPs have pore sizes, as measured by SEM imaging, of less than 50 nm, and 83.9% are less than 100 nm (Figure 7). Furthermore, PV, SSA, and porosity of mudstones have good positive correlations with TOC (Figure 10), while they have very slight or no correlation with mineral content (Figure 12). Combined with the observations of SEM images, it can be concluded that organic pores were the dominant pore type in organic-rich mudstones and TOC was the most important factor affecting PSD, PV, SSA, and porosity. Sources and types of OM (second order), thermal maturity (third order), and the abundance of rigid grains with greater sizes and grain sorting also affected the development of OPs in mudstones.
Siltstone and sandstone interlayers have more rigid particles with greater sizes and relatively better grain sorting and lower TOC, S2, clay minerals, PV (<10 nm), and SSA, and higher PV (>50 nm) and porosity, compared to mudstones. PV (<10 nm) and PV (<50 nm) account for ~23% and 43% of the total PV, respectively (Table 3). Approximately 25.4% of the inorganic pores have pore sizes, as measured by SEM imaging, less than 50 nm and 54% less than 100 nm (Figure 7). Additionally, OPs with sizes less than 50 nm and less than 100 nm in siltstones account for 57.5% and 79.5% of the total, respectively. PV and porosity are slightly positively correlated with TOC and QFPy and are negatively correlated with clay minerals (Figure 10 and Figure 12). Abundant organic and inorganic pores were observed in SEM images (Figure 4, Figure 5 and Figure 6). More inorganic pores and OPs were found in samples having more abundant rigid grains with relatively coarser grain sizes and better grain sorting. Most of the porous OMs filled the preexisting inorganic pores adjacent to rigid grains or in dissolution pores. However, when there were large amounts of carbonate cements such as calcite and dolomite in the siltstone or sandstone interlayers, few pores developed and PV and SSA were very poor (e.g., sample 7-1). Therefore, it can be inferred that both organic and inorganic pores were abundant in the siltstone interlayers. The PSD, PV, and porosity were related to the abundance of rigid grains, grain sorting, grain size, and carbonate cement contents in siltstone interlayers.
Generally, the mineral composition, geochemistry, dominant pore type, PSD, SSD, and PV of siltstone interlayers are different from those of mudstones. The controlling factors of PSD, PV, SSA, and porosity of mudstones are different from those of sandstones. The contradictory conclusions regarding the dominant pore type and controlling factors on the pore structure of the Yanchang Shale in previous studies may be because the research did not consider these differences between organic-rich mudstones and siltstone interlayers.
However, the conclusions in this study need to be viewed with some degree of caution. At first glance, both mudstones and siltstone interlayers are heterogeneous in their petrology and geochemistry. The TOC, mineral composition, percentage of rigid grains with coarser grain size, grain sorting, and abundance of siltstone interlayers in shale reservoirs vary significantly and these variations are probably due to the variations of rise and fall of lake levels, sedimentary facies, and terrigenous source inputs. The dominant pore type, PSD, PV, and SSA, and controlling factors of reservoirs may be different in samples deposited under different sedimentary settings and with lithofacies and terrigenous source inputs; the representativeness of the selected samples from the unevenly distributed 15 wells used in this study is questionable. Second, OPs were developed in OMs with VRo ~0.5% and 0.85%, and the size and abundance of OPs were less than for those samples with VRo values higher than 0.9%. Additionally, the pore size, morphology, and abundance of OPs in OMs with VRo ~1.0% show no significant differences from those of OMs with VRo levels higher than 1.0%. There are only two samples with VRo below 0.9% and two samples have values higher than 1.1%; more samples are needed for further study to confirm the conclusions. Last, the siltstone and sandstone interlayers generally have relatively more pores with larger diameters (Figure 4a,c,g,h and Figure 7), and the increasing abundance of these interlayers improved reservoir quality. If the pores in siltstone and sandstone interlayers were mostly filled by large amounts of secondary carbonate minerals (e.g., Y7-1, Figure 14e–l), this decreased reservoir quality. Why were some siltstone and sandstone interlayers cemented by large amounts of carbonate minerals and others were not? How can the proportion of those interlayers cemented by secondary carbonate minerals be estimated? The answers to these questions are important for understanding the dominant pore type, PSD and controlling factors, and reservoir evaluation.

9. Conclusions

The mineral composition, pore type, pore structure, and controlling factors of the lacustrine Yanchang Shale were studied using samples from 15 wells. Some preliminary conclusions are as follows:
The Yanchang Shale is heterogeneous in its petrology, mineral composition, and geochemistry. Siltstone and sandstone interlayers usually have coarser grain sizes, higher quartz, and feldspar contents, and lower clay mineral contents, TOC, S1, and S2 values when compared to organic-rich mudstones.
Abundant inorganic interP pores, intraP pores, and organic matter pores were observed and connected to form effective pore networks in the Yanchang Shale with maturities in the oil window. The pore sizes measured by SEM images and the proportion of pores with sizes greater than 100 nm of inorganic pores in siltstone interlayers are greater than those in mudstones and are also greater than that of OPs. Most OPs in siltstone interlayers and mudstones are less than 100 nm and account for 79.5% and 83.9% of the total, respectively.
The dominant pore type, PSD, SSA, and PV of the siltstone interlayers are different from those of the mudstones. Organic-rich mudstones usually have higher PV (<10 nm), PV (10–50 nm), BET SSA, and total PV compared to siltstone interlayers. Organic pores are the dominant pore type in organic-rich mudstones. The pore structure, SSA, and PV are related to TOC (first order), sources and types of OM (second order), and thermal maturity (third order), and abundance of rigid grains with greater size and grain sorting. Both inorganic and organic pores are abundant in the siltstone interlayers. The PSD, PV, and porosity of the siltstone interlayers were mainly controlled by the abundance of rigid grains (first order), grain sorting (second order), grain size (third order), and carbonate cement content. Therefore, the total PV and porosity of shale reservoirs may increase with the increasing abundance of siltstone and sandstone interlayers. How to locate and quantitively characterize the siltstone and sandstone interlayers in the shale formations is the key issue to make the microscopic findings practical for shale gas exploration and production. Owing to the heterogeneity and because the samples came from 15 wells with uneven distribution, our conclusions need to be viewed with some degree of caution when extrapolating the results across the basin.

Author Contributions

Conceptualization, Y.L. and X.L.; methodology, M.C.; formal analysis, Y.L.; investigation, M.C.; resources, X.W., L.Z. (Lixia Zhang), C.J. and J.Y.; data curation, M.C.; writing—original draft preparation, Y.L.; writing—review and editing, M.C.; supervision, L.Z. (Likuan Zhang) and X.L.; funding acquisition, M.C. and Y.L. All authors have read and agreed to the published version of the manuscript.

Funding

This research was funded by the Chinese National Major Fundamental Research Developing Project, grant No. 2017ZX05008-004); Opening Foundation of Shaanxi Key Laboratory of Lacustrine Shale Gas Accumulation and Exploitation; the Strategic Priority Research Program of the Chinese Academy of Sciences, grant No. XDA14010202; the Chinese National Natural Science Foundation, grant No. 41902136 and the Science and Technology Planning Project of Shaanxi Yanchang Petroleum (Group) Corp., LTD., grant No. ycsy2017-ky-A-20.

Institutional Review Board Statement

Not applicable.

Informed Consent Statement

Not applicable.

Data Availability Statement

Not applicable.

Acknowledgments

This study was supported partly by the Chinese National Major Fundamental Research Developing Project (Grant No. 2017ZX05008-004), Opening Foundation of Shaanxi Key Laboratory of Lacustrine Shale Gas Accumulation and Exploitation, the Strategic Priority Research Program of the Chinese Academy of Sciences (Grant No. XDA14010202), the Chinese National Natural Science Foundation (41902136) and the Science and Technology Planning Project of Shaanxi Yanchang Petroleum (Group) Corp., LTD. (Grant No. ycsy2017-ky-A-20). The study would not have been possible without the support from Shaanxi Yanchang Petroleum (Group) Corp., LTD., Xi’an, China. We thank Shaanxi Yanchang Petroleum (Group) Corp., LTD for permission to publish this work.

Conflicts of Interest

The authors declare no conflict of interest.

References

  1. Barrett, E.P.; Joyner, L.G.; Halenda, P.P. The determination of pore volume and area distributions in porous substances. I. computations from nitrogen isotherms. J. Am. Chem. Soc. 1951, 73, 373–380. [Google Scholar] [CrossRef]
  2. Bennett, R.H.; Hulbert, M.H.; Curry, K.J.; Curry, A.; Douglas, J. Organic matter sequestered in potential energy fields predicted by 3-D clay microstructure model: Direct observations of organo-clay micro-and nanofabric. Mar. Geol. 2012, 315, 108–114. [Google Scholar] [CrossRef]
  3. Bohacs, K.M.; Passey, Q.R.; Rudnicki, M.; Esch, W.L.; Lazar, O.R. The Spectrum of Fine-Grained reservoirs from “Shale Gas” to “Shale Oil”/ Tight Liquids: Essential Attributes, Key Controls, Practical Characterization. In Proceedings of the IPTC 2013 International Petroleum Technology Conference, Beijing, China, 26-28 March 2013; pp. 1–16. [Google Scholar]
  4. Brunauer, S.; Emmett, P.H.; Teller, E. Adsorption of Gases in Multimolecular Layers. J. Am. Chem. Soc 1938, 60, 309–319. [Google Scholar] [CrossRef]
  5. Cai, Z.J.; Lei, Y.H.; Luo, X.R.; Wang, X.Z.; Cheng, M.; Zhang, L.X.; Jiang, C.F.; Zhao, Q.P.; Yin, J.T.; Zhang, L.K. Characteristics and Controlling factors of organic pores in 7th member Yanchang Formation shale in the Southeastern Ordos Basin. Oil Gas Geol. 2019, 40, 1093–1105. (In Chinese) [Google Scholar]
  6. Cardott, B.J.; Landis, C.R.; Curtis, M.E. Post-oil solid bitumen network in the Woodford Shale, USA—a potential primary migration pathway. Int. J. Coal Geol. 2015, 139, 106–113. [Google Scholar] [CrossRef]
  7. Chen, Y.F.; Jiang, C.B.; Leung, J.Y.; Wojtanowicz, A.K.; Zhang, D.M. Multiscale characterization of shale pore-fracture system: Geological controls on gas transport and pore size classification in shale reservoirs. J. Petroleum Sci. Eng. 2021, in press. [Google Scholar] [CrossRef]
  8. Cheng, M.; Luo, X.R.; Lei, Y.H.; Wang, X.Z.; Yu, Y.X.; Zhang, L.X.; Jiang, C.F.; Sun, B.H.; Zhang, L.K. The distribution, fractal characteristics and thickness estimation fo silty laminae and bed in the Zhangjiatan Shale, Ordos Basin. Nat. Gas Geosci. 2015, 26, 845–854. (In Chinese) [Google Scholar]
  9. Collell, J.; Galliero, G.; Vermorel, R.; Ungerer, P.; Yiannourakou, M.; Montel, F.; Pujol, M. Transport of multicomponent hydrocarbon mixtures in shale organic matter by molecular simulations. J. Phys. Chem. 2015, 119, 22587–22595. [Google Scholar] [CrossRef] [Green Version]
  10. Curtis, M.E.; Ambrose, R.J.; Sondergeld, C.H. Structural characterization of gas shales on the micro- and nano-scales. In Proceedings of the Canadian Unconventional Resources and International Petroleum Conference, Calgary, AB, Canada, 19-21 October 2010. SPE 137693. [Google Scholar]
  11. Bernard, S.; Wirth, R.; Schreiber, A.; Schulz, H.M.; Horsefield, B. Formation of nanoporous pyrobitumen residues during maturation of the Barnett Shale (Fort Worth Basin). Int. J. Coal Geol. 2012, 103, 3–11. [Google Scholar] [CrossRef]
  12. Desbois, G.; Urai, J.L.; Kukla, P.A. Morphology of the pore space in claystones: Evidence from BIB/FIB ion beam sectioning and cryyo-SEM observations. E Earth 2009, 4, 15–22. [Google Scholar]
  13. Guo, H.J.; He, R.; Jia, W.L.; Peng, P.A.; Lei, Y.H.; Luo, X.R.; Wang, X.Z.; Zhang, L.X.; Jiang, C.F. Pore characteristics of lacustrine shale within the oil window in the Upper Triassic Yanchang Formation, southeastern Ordos Basin, China. Mar. Petroleum Geol. 2018, 91, 279–296. [Google Scholar] [CrossRef]
  14. Guo, H.J.; Jia, W.L.; Peng, P.A.; Lei, Y.H.; Luo, X.R.; Cheng, M. The organic geochemistry, mineralogy and methane sorption of lacustrine shales from the Upper Triassic Yanchang Formation, Ordos Basin, China. Mar. Petroleum Geol. 2014, 57, 509–520. [Google Scholar] [CrossRef]
  15. Han, H.; Pang, P.; Li, Z.L.; Shi, P.T.; Guo, C.; Liu, Y.; Chen, S.J.; Lu, J.G.; Gao, Y. Controls of organic and inorganic compositions on pore structure of lacustrine shales of Chang 7 member from Triassic Yanchang Formation in the Ordos Basin, China. Mar. Petroleum Geol. 2019, 100, 270–284. [Google Scholar] [CrossRef]
  16. Jiang, F.J.; Chen, D.; Wang, Z.F.; Xu, Z.Y.; Chen, J.; Liu, L.; Huyan, Y.Y.; Liu, Y. Pore characteristic analysis of a lacustrine shale: A case study in the Ordos Basin, NW China. Mar. Petroleum Geol. 2016, 73, 554–571. [Google Scholar] [CrossRef]
  17. Ko, L.T.; Loucks, R.G.; Milliken, K.L. Controls on pore types and pore-size distribution in the Upper Triassic Yanchang Formation, Ordos Basin, China: Implications for pore-evolution models of lacustrine mudrocks. Interpretation 2017, 5, SF127–SF147. [Google Scholar] [CrossRef]
  18. Kuila, U.; Mccarty, D.K.; Derkowski, A.; Fischer, T.B.; Topor, T.; Prasad, M. Nano-scale texture and porosity of organic matter and clay minerals in organic-rich mudrocks. Fuel 2014, 135, 359–373. [Google Scholar] [CrossRef] [Green Version]
  19. Kuila, U.; Prasad, M. Specific surface area and pore-size distribution in clays and shales. Geophys. Prospect. 2013, 61, 341–362. [Google Scholar] [CrossRef]
  20. Lei, Y.H.; Luo, X.R.; Wang, X.Z.; Zhang, L.X.; Jiang, C.F.; Yang, W.; Yu, Y.X.; Cheng, M.; Zhang, L.K. Characteristics of silty laminae in Zhangjiatan Shale of southeastern Ordos Basin, China: Implications for shale gas formation. AAPG Bull. 2015, 99, 661–687. [Google Scholar] [CrossRef]
  21. Liu, B.; Schiebera, J.; Mastalerzb, M. Combined SEM and reflected light petrography of organic matter in the New Albany Shale (Devonian-Mississippian) in the Illinois Basin: A perspective on organic pore development with thermal maturation. Int. J. Coal Geol. 2017, 184, 57–72. [Google Scholar] [CrossRef]
  22. Löhr, S.C.; Baruch, E.T.; Hall, P.A.; Kennedy, M.J. Is organic pore development in gas shales influenced by the primary porosity and structure of thermally immature organic matter? Org. Geochem. 2015, 87, 119–132. [Google Scholar] [CrossRef] [Green Version]
  23. Loucks, R.G.; Reed, R.M.; Ruppel, S.C.; Hammes, U. Spectrum of pore types and networks in mudrocks and a descriptive classification for matrix-related mudrock pores. AAPG Bull. 2012, 96, 1071–1098. [Google Scholar] [CrossRef] [Green Version]
  24. Loucks, R.G.; Reed, R.M. Scanning-electron-microscope petrographic evidence for distinguishing organic-matter pores associated with depositional organic matter versus migrated organic matter in mudrocks. Gulf Coast Assoc. Geol. Soc. J. 2014, 3, 51–60. [Google Scholar]
  25. Loucks, R.G.; Ruppel, S.C.; Wang, X.Z. Pore types, pore-network analysis, and pore quantification of the lacustrine shale-hydrocarbon system in the Late Triassic Yanchang Formation in the southeastern Ordos Basin, China. Interpretation 2017, 5, SF63–SF79. [Google Scholar] [CrossRef]
  26. Milliken, K.L.; Rudnicki, M.; Awwiller, D.N.; Zhang, T.W. Organic matter–hosted pore system, Marcellus formation (Devonian), Pennsylvania. AAPG Bull. 2013, 97, 177–200. [Google Scholar] [CrossRef]
  27. Reed, R.M.; Loucks, R.G.; Ruppel, S. Comment on “Formation of nano porous pyrobitumen residues during maturation of the Barnett Shale Fort Worth Basin” by Bernard et al. (2012). Int. J. Coal Geol. 2014, 127, 111–113. [Google Scholar] [CrossRef]
  28. Ross, D.J.K.; Bustin, R.M. The importance of shale composition and pore structure upon gas storage potential of shale gas reservoirs. Mar. Petroleum Geol. 2009, 26, 916–927. [Google Scholar] [CrossRef]
  29. Schneider, J.; Flemings, P.B.; Day-Stirrat, R.J.; Germaine, J.T. Insights into pore-scale controls on mudstone permeability through resedimentation experiments. Geology 2010, 39, 1011–1014. [Google Scholar] [CrossRef]
  30. Seewald, J.S. Organic–inorganic interactions in petroleum-producing sedimentary basins. Nature 2003, 426, 327–333. [Google Scholar] [CrossRef] [PubMed]
  31. Wang, X.Z.; Gao, S.L.; Cao, G. Geological features of Mesozoic continental shale gas in south of Ordos Basin, NW China. Petruleum Explor. Dev. 2014, 41, 294–304. [Google Scholar]
  32. Wang, X.Z.; Zhang, L.X.; Lei, Y.H.; Yu, Y.X.; Jiang, C.F.; Luo, X.R.; Gao, C.; Yin, J.T.; Cheng, M. Characteristics of migrated solid organic matters and organic pores in low maturity lacustrine shale: A case study of the shale in Chang 7 oil-bearing formation of Yanchang Formation, southeastern Ordos Basin (in Chinese). Acta Petrolei Sin. 2018, 39, 141–151. [Google Scholar]
  33. Wang, Y.; Liu, L.F.; Cheng, H.F. Pore structure of Triassic Yanchang mudstone, Ordos Basin: Insights into the impact of solvent extraction on porosity in lacustrine mudstone within the oil window. J. Petroleum Sci. Eng. 2020, 195, 107944. [Google Scholar] [CrossRef]
  34. Yang, H.; Zhang, W.Z. Leading effect of the Seventh Member high-quality source rock of Yanchang Formation in Ordos Basin during the enrichment of low-penetrating oil-gas accumulation. Geochimica 2005, 34, 147–154. (In Chinese) [Google Scholar]
  35. Yu, Y.X.; Luo, X.R.; Cheng, M. Study on the distribution of extractable organic matter in pores of lacustrine shale: An example of Zhangjiatan Shale from the Upper Triassic Yanchang Formation, Ordos Basin, China. Interpretation 2017, 5, SF109–SF126. [Google Scholar] [CrossRef]
  36. Yu, Y.X.; Luo, X.R.; Lei, Y.H.; Wang, X.Z.; Zhang, L.X.; Jiang, C.F.; Yang, W.; Cheng, M. Characterization of lacustrine shale pore structure: The Upper-Triassic Yanchang Formation, Ordos Basin, China. J. Nat. Gas Geosci. 2016, 1, 299–308. [Google Scholar] [CrossRef] [Green Version]
  37. Zhang, W.Z. Controls on organic matter accumulation in the Triassic Chang 7 lacustrine shale of the Ordos Basin, central China. Int. J. Coal Geol. 2017, 183, 38–51. [Google Scholar] [CrossRef]
  38. Zhang, W.Z.; Yang, H.; Yang, W.W.; Wu, K.; Liu, F. Assessment of geological characteristics of lacustrine shale oil reservoir in Chang7 Member of Yanchang Formation, Ordos Basin. Geochimica 2015, 44, 505–515. (In Chinese) [Google Scholar]
  39. Zhao, J.; Mountney, N.P.; Liu, C.; Qu, H.; Lin, J. Outcrop architecture of a fluvio-lacustrine succession: Upper Triassic Yanchang Formation, Ordos Basin, China. Mar. Petroleum Geol. 2015, 68, 394–413. [Google Scholar] [CrossRef]
  40. Zou, C.; Zhang, X.; Luo, P.; Wang, L.; Luo, Z.; Liu, L. Shallow-lacustrine sand-rich deltaic depositional cycles and sequence stratigraphy of the Upper Triassic Yanchang Formation, Ordos Basin, China. Basin Res. 2010, 22, 108–125. [Google Scholar]
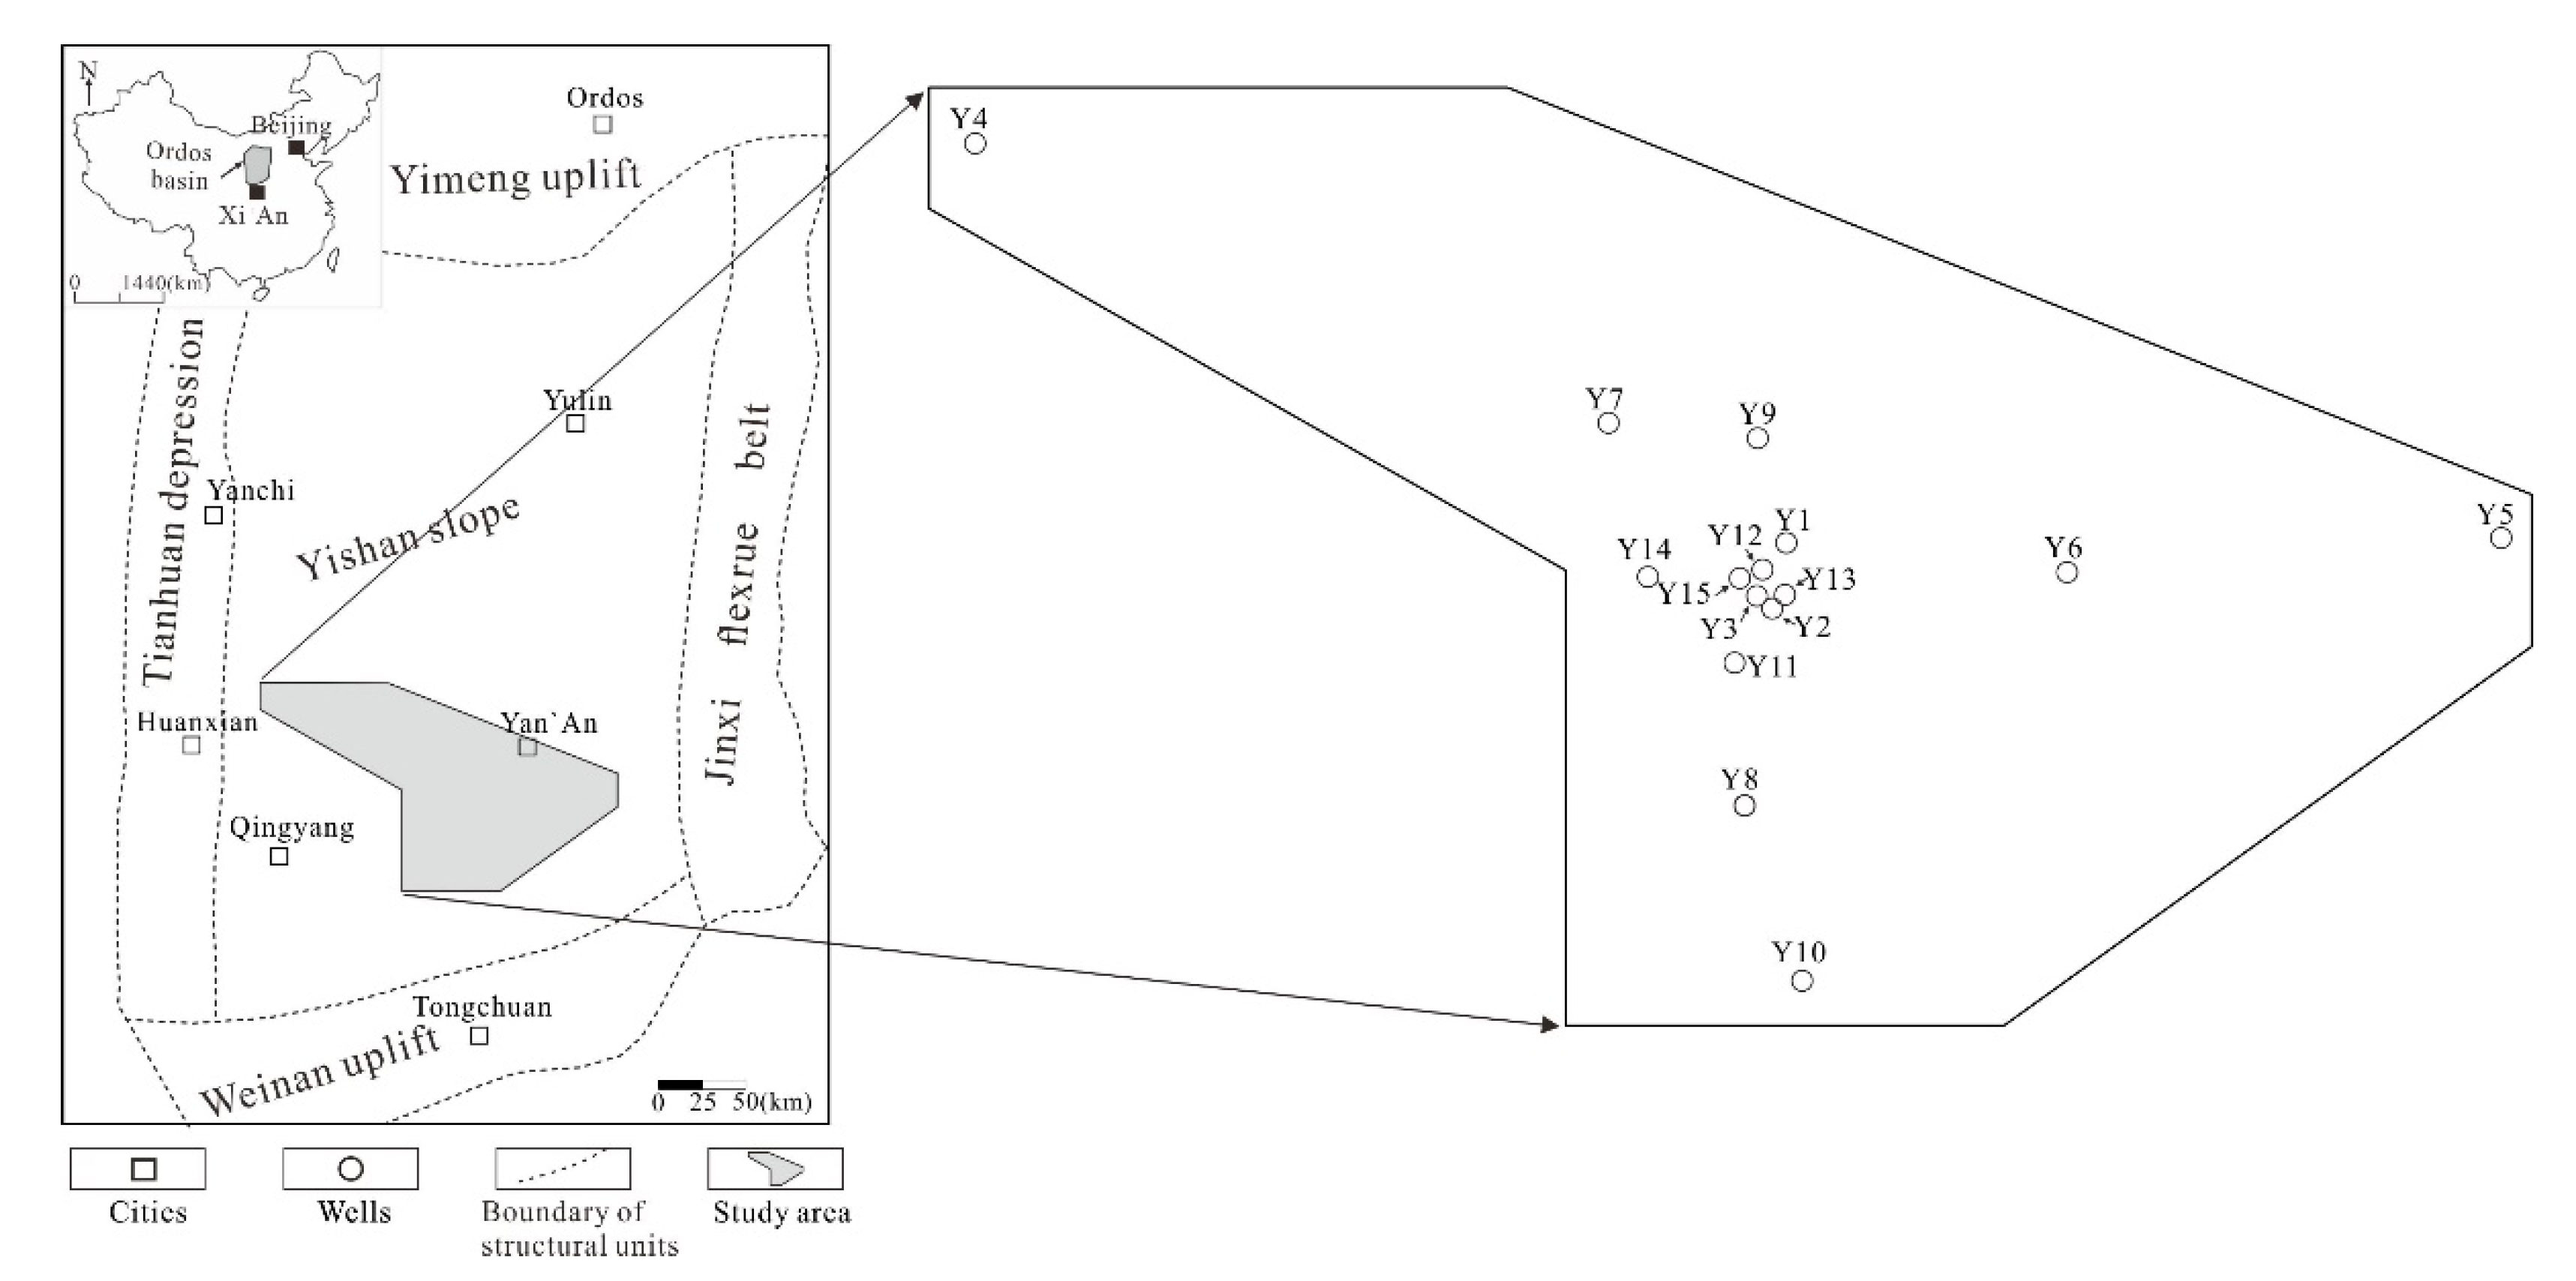
Figure 1. Location of the sample wells of the later Triassic Yanchang Formation in the study area.
Energies 14 03053 g001
Figure 2. Photomicrographs showing mudstone with siltstone interlayers, Y4-1: (a) several siltstone and sandstone interlayers developed in mudstone; (b,c) quartz, feldspar, and lithic in sandstone interlayer; location is shown in (a); (d) interP and dissolution pores in siltstones; location is shown in (a); (e) organic-rich laminae with smaller grain size; location is shown in (a). F—feldspar, Q—quartz, C—calcite, L—lithic.
Energies 14 03053 g002
Figure 3. Box plots of the minerals (A) and TOC, S1, S2 (B) in mudstones, mudstones with siltstone interlayers, and siltstones.
Energies 14 03053 g003
Figure 4. Photographs showing intraP pores: (a) interP pores between rigid grains, Y3-3; (b) interP pores preserved in the compaction-protected shadow adjacent to rigid grains, Y3-4; (c) interP pores among clay minerals, Y3-5; (d) residual interP pores among clay platelets adjacent to rigid grains, Y2-3; (e) pores among secondary quartz crystals, Y3-5; (f) interparticle dissolution pores; (g) dissolution pores in feldspar, Y4-1; (h) interconnected dissolution intraP pores with embayed boundaries in feldspar w, Y5-1; (i) dissolution intraP pores along feldspar cleavage, Y3-3; (j) intraP pores within clay aggregate, Y5-1; (k) intraP pores within framboid pyrite aggregates, Y7-1; (l) fossil chamber pores, Y3-4. F—feldspar, Q—quartz, Py—pyrite, S—siderite, and C—calcite.
Energies 14 03053 g004
Figure 5. Photomicrograph images showing OPs in the Yanchang Shale: (a) bubble OPs, Y6-1; (b) bubble OPs and spongy OPs, Y3-2; (c) spongy OPs and cracks with pore sizes ranging from 25 nm to 300 nm, Y4-1; (d) spongy OPs and cracks in OM filling in interP pores with pore sizes ranging from 20 nm to 200 nm with an Ra of 13%, Y4-1; (e) spongy OPs with size varying from 20 nm to 100 nm, Y3-3; (f) OPs interconnected to form complex pores, Y1-2; (g) spongy OPs interconnected to form a complex pore network, Y3-3; (h) spongy OPs merged to form larger complex pores, Y3-1; (i) OPs developed along the directions of clay minerals and interconnected to form slit pores, Y4-1.
Energies 14 03053 g005
Figure 6. SEM photomicrograph images of pore networks: (a) overview of the image area, Y3-2; (b) pore network formed by OPs (dashed white arrows) and inorganic pores (white arrows); (c) pore network formed by dominant inorganic pores; (d) dissolution and interP pores, Y4-1; (e,f) interconnected dissolution pores and interP pores filled with porous OMs, pyrite and clay minerals. Pore network formed by dominant OPs in OM filling inorganic pores. F—feldspar, Q—quartz, Py—pyrite, S—siderite, and C—calcite.
Energies 14 03053 g006
Figure 7. Chart of pore sizes of different pore types as measured from SEM images.
Energies 14 03053 g007
Figure 8. PSD from low-pressure nitrogen adsorption analyses calculated by the BJH model. The PSD values from low-pressure adsorption of samples Y1-1, Y1-3, Y2-2, Y10-1 have been reported by Gou et al. [8].
Energies 14 03053 g008
Figure 9. PV, BET SSA, and porosities of mudstones and siltstones separated from the same sample.
Energies 14 03053 g009
Figure 10. The correlation between TOC and PV, SSA, and porosity. (a) The correlation between TOC and PV (<10 nm); (b) The correlation between TOC and PV (10-50 nm); (c) The correlation between TOC and PV (>50 nm); (d) The correlation between TOC and porosity; (e) The correlation between TOC and BET SSA (<10 nm); (f) The correlation between TOC and BET SSA (10–50 nm); (g) The correlation between TOC and BET SSA (>50 nm); (h) The correlation between TOC and BET SSA.
Energies 14 03053 g010
Figure 11. SEM photomicrographs showing OMs and Ops: (a) no SEM-visible pores are observed in bedding-parallel OM (white arrows), while OPs are abundant in the OMs filling inorganic pores (black arrow), Y3-3; (b) isolated OM with no OP (white arrows) but are abundant in OMs filling interP pores (black arrow), Y7-1; (c,d) a large number of small OPs that developed in OM with sizes ranging from several nm to 118 nm with an Ra of ~4.5%, pores adjacent to pyrites with larger diameters, Y5-1; (e) OPs interconnected to form complex pores, Y6-1; (f) OPs interconnected to form larger pores, Y3-2; (g) OPs in OMs filling dissolution pores in feldspar with pore sizes ranging from 30 nm to 680 nm and an Ra of ~32%, Y7-1; (h) OPs in OMs filling dissolution pores with pore sizes varying from 40 to 580 nm, Y4-1.
Energies 14 03053 g011
Figure 12. The correlation between mineral content and PV, SSA, and porosity. (a) The correlation between clay content and PV (<10 nm); (b) The correlation between clay content and PV (10–50 nm); (c) The correlation between clay content and PV (>50 nm); (d) The correlation between clay content and porosity; (e) The correlation between clay content and BET SSA (<10 nm); (f) The correlation between clay content and BET SSA (10–50 nm); (g) The correlation between clay content and BET SSA (>50 nm); (h) The correlation between clay content and BET SSA; (i) The correlation between QFPy content and PV (<10 nm); (j) The correlation between QFPy content and PV (10–50 nm); (k) The correlation between QFPy content and PV (>50 nm); (l) The correlation between QFPy content and porosity; (m) The correlation between QFPy content and BET SSA (<10 nm); (n) The correlation between QFPy content and BET SSA (10–50 nm); (o) The correlation between QFPy content and BET SSA; QFPy—The sum of feldspar, quartz, and pyrite contents.
Energies 14 03053 g012
Figure 13. SEM images shown pores preserved in mudstones and siltstones: (a) clay minerals squeezed into the spaces between rigid grains and reduced the PV, Y1-2; (b) a few isolated pores were preserved in clay platelets and filled voids between rigid grains, Y1-2; (c) pores of large sizes among rigid grains with large grain sizes, Y3-1; (d) no pores in the clay platelets that underwent strong compaction, Y3-2; (e) many pores in clay aggregates adjacent to rigid grains, Y3-3; (f) many pores were preserved in clay platelets due to compaction-resistant pressure shadows, Y3-2; (g) abundant OPs in OMs filling clay platelets, Y3-3; (h) a fragment of a rigid grain with a large grain size scattered in mudstone, Y2-1; (i) close-up of the white box shown in (h), which shows a few isolated pores that developed.
Energies 14 03053 g013
Figure 14. SEM photomicrographs showing secondary minerals in the Yanchang Shale: (a) porous OM coeval with zoned minerals that inhibited compaction, Y3-1; (b) siderite filling preexisting pores and dissolved along the edge and porous OM filling pores among siderites, Y3-3; (c) a thin rim of calcite overgrowth lined the preexisting pores and porous OM filled the remaining portion, Y3-1; (d) clay minerals filled preexisting pores and interP and intraP pores were produced, Y3-1; (e) thin section photograph showing much calcite in a siltstone interlayer, Y7-1; (fi) siderite, pyrite, calcite, and porous OMs filled inorganic pores, Y7-1.
Energies 14 03053 g014
Figure 15. Photomicrographs showing preserved pores with different fabrics that underwent differential compaction: (a) interP and intraP pores between clay platelets due to sheltering by large feldspar, Y1-2; (b) inorganic pores and OPs were preserved due to sheltering by large feldspar, Y3-4; (c) abundant OPs developed in the OMs filling the dissolution pores around the compaction-resistant grains, Y4-1; (d) pores with large diameters were preserved among the rigid particles with large grain sizes, Y3-4; (e) many interP pores were preserved between rigid grains with good grain sorting and some of them were filled with OMs, Y3-4; (f) pores were preserved adjacent to rigid grains with poor grain sorting, Y3-3; (g) close-up of the white box shown in (g); (h) inorganic pores within vertically oriented clay platelets were produced by compaction, Y1-2; (i) the differences of size and abundance of pores preserved in clay minerals with different occurrences, Y3-4; (j) few SEM-visible OPs in OM underwent strong compaction, while many OPs in the OM in compaction shadow, Y3-3; (k) few OPs in OM parallel to the bedding, while many OPs in the OM filled the spaces between rigid grains, Y3-3; (l) OPs in OM filled the dissolution pores of feldspar, Y7-1.
Energies 14 03053 g015
Table 1. Mineralogical composition of selected shale samples (wt.%).
WellSampleDepth (m)LithologyQuartzFeldsparCalciteDolomiteSideritePyriteClay
Y1Y1-11308.11mudstone with interlayers448 444
Y1-21139.982930 1139
Y1-31149.7439291 2128
Y2Y2-11519.98mudstone25280.50.51 41
Y2-21522.88mudstone with interlayers3020215240
Y2-31530.05mudstone2630 1142
Y3Y3-11340.23mudstone with interlayers2420 5546
Y3-21348.83mudstones2829 340
Y3-31349.642420 1444
Y3-41313.14mudstone with interlayers2225113 48
Y3-51356.452931 1138
Y4Y4-12297.31sandstone45300.5 23.519
Y5Y5-1648.55siltstone43.929.25.811 19.1
Y6Y6-1975.6mudstone with interlayers36.225.50.5 1.536.2
Y7Y7-11502.22siltstone37.543 15
Y8Y8-11184.54siltstone21.837.8 34
Y9Y9-11505.93mudstone with interlayers3332 32
Y10Y10-11211.193932 28
Y11Y11-11515.213233 1133
Y11-21419.11mudstone28170.5 2.553
siltstone3840 22
Y11-31527.65mudstone4016 1 43
siltstone3123 145
Y12Y12-11396.76mudstone3225 1142
Y12-21400.63siltstone2851 0.50.520
mudstone3423 0.50.542
Y13Y13-11470.21mudstone29180.5 1.5 51
siltstone3444 1 21
Y14Y14-11727.25mudstone37270.5 0.5432
siltstone3828 1132
Y14-21718.41mudstone3732 1 30
siltstone38341 3 24
Y15Y15-11630.4mudstone30300.5 1.5138
siltstone3533 429
Mineral composition of samples Y1-1, Y1-3, Y2-2, Y10-1 has been reported by Gou et al. [16], and Y11-2, Y11-3, Y12-1, Y12-2, Y13-1, Y14-1, Y14-2, Y15-1 has been reported by Lei et al. [12].
Table 2. TOCs and Rock–Eval pyrolysis results for investigated Yanchang Shale samples.
SampleLithologyTOC (wt.%)Tmax (°C)S1 (mg/g)S2 (mg/g)HI (mg/gTOC)VR (%)
Y1-1mudstone with interlayers4.654493.128.19158
Y1-24.124453.598.09196
Y1-34.254344.7711.632300.94
Y2-1mudstone4.354482.729.2212
Y2-2mudstone with interlayers3.584253.136.421671.09
Y2-3mudstone5.76
Y3-25.674576.4810.121741.05
Y3-35.464538.5611.92192
Y3-4mudstone with interlayers3.894563.56.83182
Y3-53.554495.266.98206
Y4-1sandstone1.95 1.25
Y5-1siltstone2.17 0.5
Y6-1mudstone with interlayers3.234531.648.242550.85
Y7-1siltstone1.364143.534.283141.1
Y8-1siltstone2.244453.225.46243
Y9-1mudstone with interlayers2.814482.025.45194
Y10-12.284371.075.01234
Y11-15.274434.5112.12210
Y11-2mudstone4.724534.398.24189
siltstone2.854522.925.26190
Y11-3mudstone4.36
siltstone1.814480.392.16213
Y12-1siltstone1.5
Y12-2mudstone4.62 169
Y13-1mudstone4.054502.844.67183
Y15-1mudstone4.75
siltstone2.34532.824.22115
Geochemistry of samples Y1-3, Y2-2, Y10-1 has been reported by Gou et al. [16], and the VRo of samples Y4-1, Y5-1, Y6-1, Y7-1 has been reported by Cai et al. [21].
Table 3. Results of PV (cm3/g), SSA (m2/g), and porosity (%) of mudstones, siltstones and mudstones with interlayers.
SamplelithologyPV (<10 nm)PV (10–50 nm)PV (>50 nm)Total PVPorositySSA (<10 nm)SSA (10–50 nm)BET SSA
Y1-1mudstone with interlayers0.4561.1450.9372.5386.673.3572.4445.121
Y1-20.2011.0530.4161.6704.292.2451.5853.494
Y1-30.2900.7190.8151.8233.572.4061.3053.673
y2-1mudstone0.3840.4800.5781.4433.653.2960.9324.122
y2-2mudstone with interlayers0.2340.9010.5671.7024.372.1621.3103.271
y2-3mudstone1.6880.4710.0312.1903.5612.9000.88013.837
Y3-20.9360.6010.7902.3264.9610.3101.51613.867
Y3-30.8320.8470.3492.0294.698.8881.53710.155
Y3-4mudstone with interlayers0.4000.5500.2531.2032.133.2121.7935.273
Y3-50.4630.4970.2331.1934.624.8160.8545.402
Y4-1sandstone 6.72
Y7-1siltstone0.1860.1380.1310.4550.990.7470.2490.926
Y8-10.1450.4730.3050.9234.021.5310.6721.777
Y9-1mudstone with interlayers0.2910.7460.3701.4075.271.9492.0333.386
Y10-10.1880.6220.6141.4243.671.5101.1792.838
Y11-10.5670.7960.7092.0725.265.9201.0207.591
Y11-2mudstone0.8570.3320.1401.3293.547.1400.4677.620
siltstone0.4810.4181.5562.4556.166.3400.9057.305
Y11-3mudstone0.5640.3690.2181.1513.367.1000.6397.792
siltstone0.3600.2370.9651.5624.224.8400.4305.310
Y12-1mudstone1.3640.5150.0721.951 9.6901.21010.939
siltstone0.7040.3491.2122.2656.755.9500.7646.768
Y12-2mudstone0.7870.2870.1871.261 4.2800.6574.810
Y13-1mudstone0.6250.2800.1681.0732.584.7400.5305.287
siltstone0.2040.2441.4391.8864.682.9800.4363.550
Y14-1mudstone1.0670.7510.3792.1975.1411.9001.48013.401
siltstone0.4420.3061.3682.1175.944.6700.6135.316
Y14-2mudstone0.4970.3300.1821.0092.927.3700.5037.900
siltstone0.1940.1430.8841.2223.522.6500.2462.911
Y15-1mudstone0.9210.5190.2371.6764.4810.2000.73310.996
siltstone0.8160.4881.5432.8477.888.9400.8259.815
PV (<10 nm)—total pore volume in pores with size less than 10 nm, PV (10–50 nm)—total pore volume of pores with size between 10 and 50 nm, PV (>50 nm)—total pore volume of pores with size greater than 50 nm, SSA (<10 nm)—total specific surface area of pores with size less than 10 nm, SSA (10–50 nm)—total specific surface area of pores with size between 10 and 50 nm, SSA (>50 nm)—total specific surface area of pores with size greater than 50 nm.
Publisher’s Note: MDPI stays neutral with regard to jurisdictional claims in published maps and institutional affiliations.