Article

Hydraulic Interactions between Injection Events Using Multiple Injection Strategies and a Solenoid Diesel Injector

by
Simón Martínez-Martínez
*,
Oscar A. de la Garza
,
Miguel García-Yera
,
Ricardo Martínez-Carrillo
and
Fausto A. Sánchez-Cruz
Laboratory for Research and Innovation in Energy Technology (LIITE), Facultad de Ingeniería Mecánica y Eléctrica (FIME), Universidad Autónoma de Nuevo León, Ciudad Universitaria, San Nicolás de los Garza, Nuevo León 66455, Mexico
*
Author to whom correspondence should be addressed.
Energies 2021, 14(11), 3087; https://doi.org/10.3390/en14113087
Submission received: 6 April 2021 / Revised: 22 April 2021 / Accepted: 4 May 2021 / Published: 26 May 2021

Abstract

:
An experimental study was performed to explore the influence of dwell time on the hydraulic interactions between injection events using pilot injection strategy, split injection strategy, post injection strategy and a solenoid diesel injector. To do so, a sweep of dwell time from 0.55 up to 2 ms using all multiple injection strategies and levels of rail pressure, of 80, 100 and 120 MPa, and single level of back pressure, of 5 MPa, was performed. The hydraulic interactions between injection events were characterized through the second injection hydraulic delay and second injection mass in an injection discharge curve indicator equipped with all the components required for its operation and control. In order to define the operating conditions of the multiple injection strategies, to ensure the same injected fuel mass in all cases, the characteristic curves of injection rate for the solenoid diesel injector studied were obtained. The second injection hydraulic delay increases with dwell time values in the range of 0.55–0.9 ms for all multiple injection strategies and levels of rail pressure tested. Conversely, the second injection hydraulic delay decreases with dwell time values higher than 0.9 ms. Moreover, the second hydraulic delay depends mainly on the dwell time and not on the injected fuel mass during the first injection event. The second injection mass increases with dwell values less than 0.6 ms. By contrast, the second injection mass is not significantly affected by that of the first injection at a dwell time higher than 0.6 ms.

1. Introduction

NOx and soot emissions are the main pollutants from diesel engine, which are regulated by emissions standards [1,2,3]. There are several ways to fulfil these regulations, such as the use of alternative fuels [4,5,6], changes in the piston bowl geometry [7,8], increase in injection pressure [9,10], and the use of multiple injection strategies such as pilot injection strategy, post-injection strategy and split injection strategy, which consist of dividing the injection into two pulses [11]. The duration between the two pulses is called dwell time (DT) [12]. For instance, Ambrosio et al. [13], studied different injection strategies on the performance and emissions of a low compression ratio Euro 5 diesel engine operated with high EGR rates. They found that the experiment design of optimized triple and quadruple injection strategies led to improved soot-NOx trade-offs, with respect to the pilot and main injection strategy calibration. Chacko et al. [14], analysed the effect of injection pressure and multiple-injection strategy on the performance, combustion, and emission characteristics of a diesel- and biodiesel–diesel-blend-fueled CRDI engine and they also observed that multiple injections reduce nitric oxide (NO) and soot emissions simultaneously. Similarity, How et al. [15] investigated the effects of biodiesel blends, fuel injection timing and split injection schemes on the engine performance, emissions and combustion characteristics of a medium-duty diesel engine, and concluded that multiple split injections is a practical strategy to simultaneously decrease the NOx and smoke emission when the start of injection timing is fine-tuned and is an ideal alternative to operate with biodiesel fuel. Mie et al. [16], investigated the influence of two pilot injections on combustion and emissions using a single-cylinder turbocharged diesel engine. They observed that by adjusting the fuel quantity in both pilot injections, it is possible to reduce the NOx and soot emissions. Liang et al. [17], analysed the mixing process and its influence on the combustion and emission characteristics under the pilot injection strategy and utilizing a low-speed two-stroke diesel engine, and they also found that, adjusting the pilot injection’s time, it is possible to reduce part of the NOx emissions.
The potential of multiple-injection strategies to reduce emissions is the main reason why several works have focused first on analyzing the injection process under multiple injection strategies. For example, Payri et al. [18], evaluated the hydraulic interactions between close-coupled injection events using a one-dimensional model of a solenoid fuel injector under pilot injection strategy employing DT values from 0.4 to 2.5 ms. They observed that the mass of the second injection is significantly affected by the first injection conditions at mid-to-low DT conditions, with deviations in the second injection mass up to 16% compared to a single injection strategy. They also observed that, when running the injector at the critical dwell time, the opening slope of the needle lift profile is generally faster for the second injection event. Busch S. and Miles P.C. [19], analysed the injection rates under pilot-main injection strategy using three DT values: 1.2, 0.4, and 0.1 ms and a solenoid diesel injector, and have also concluded that, with a pilot and main injection strategy, changing the dwell time has a dramatic effect on the shape of the main injection event, including the maximum rate of injection. Similarity, Ferrari A. and Zhang T. [20], investigated the effect of dwell time on the injection rate utilizing a hydraulic rig in solenoid diesel injectors and pilot injection strategy and post-injection strategy and DT values from 0.125 ms to 0.8 ms. They found that the injected quantity is barely influenced by DT, in which the cycle-to-cycle dispersion in the overall value of injected mass is low. Aljohani et al. [21], analysed the effective start and end of injection timings, injection rate shape, dwell time, and total fuel quantity utilizing various single- and split-injection strategies, a solenoid diesel injector and DT values from 0.4 up to 2 ms. They found that decreasing the dwell time by a factor of 10 usually leads to an increase in the amount of fuel injected in the second short by a factor of 2 for the tested injector. Furthermore, they found that the injector hydraulic delay becomes shorter as the dwell interval is reduced.
As most studies reported in the literature analysed the effect of dwell time on the hydraulic interactions between injection events under pilot injection strategy and post injection strategy and employing DT values from 0.4 ms to 2.5 ms. In addition, not many studies have focused on analyzing the effect of dwell time on the interactions of first- and second-injection hydraulic delays under pilot injection strategy, split injection strategy and post-injection strategy. The present work aims to address the influence of dwell time on the hydraulic interactions between injection events using multiple-injection strategies and a solenoid diesel injector.

2. Methodology

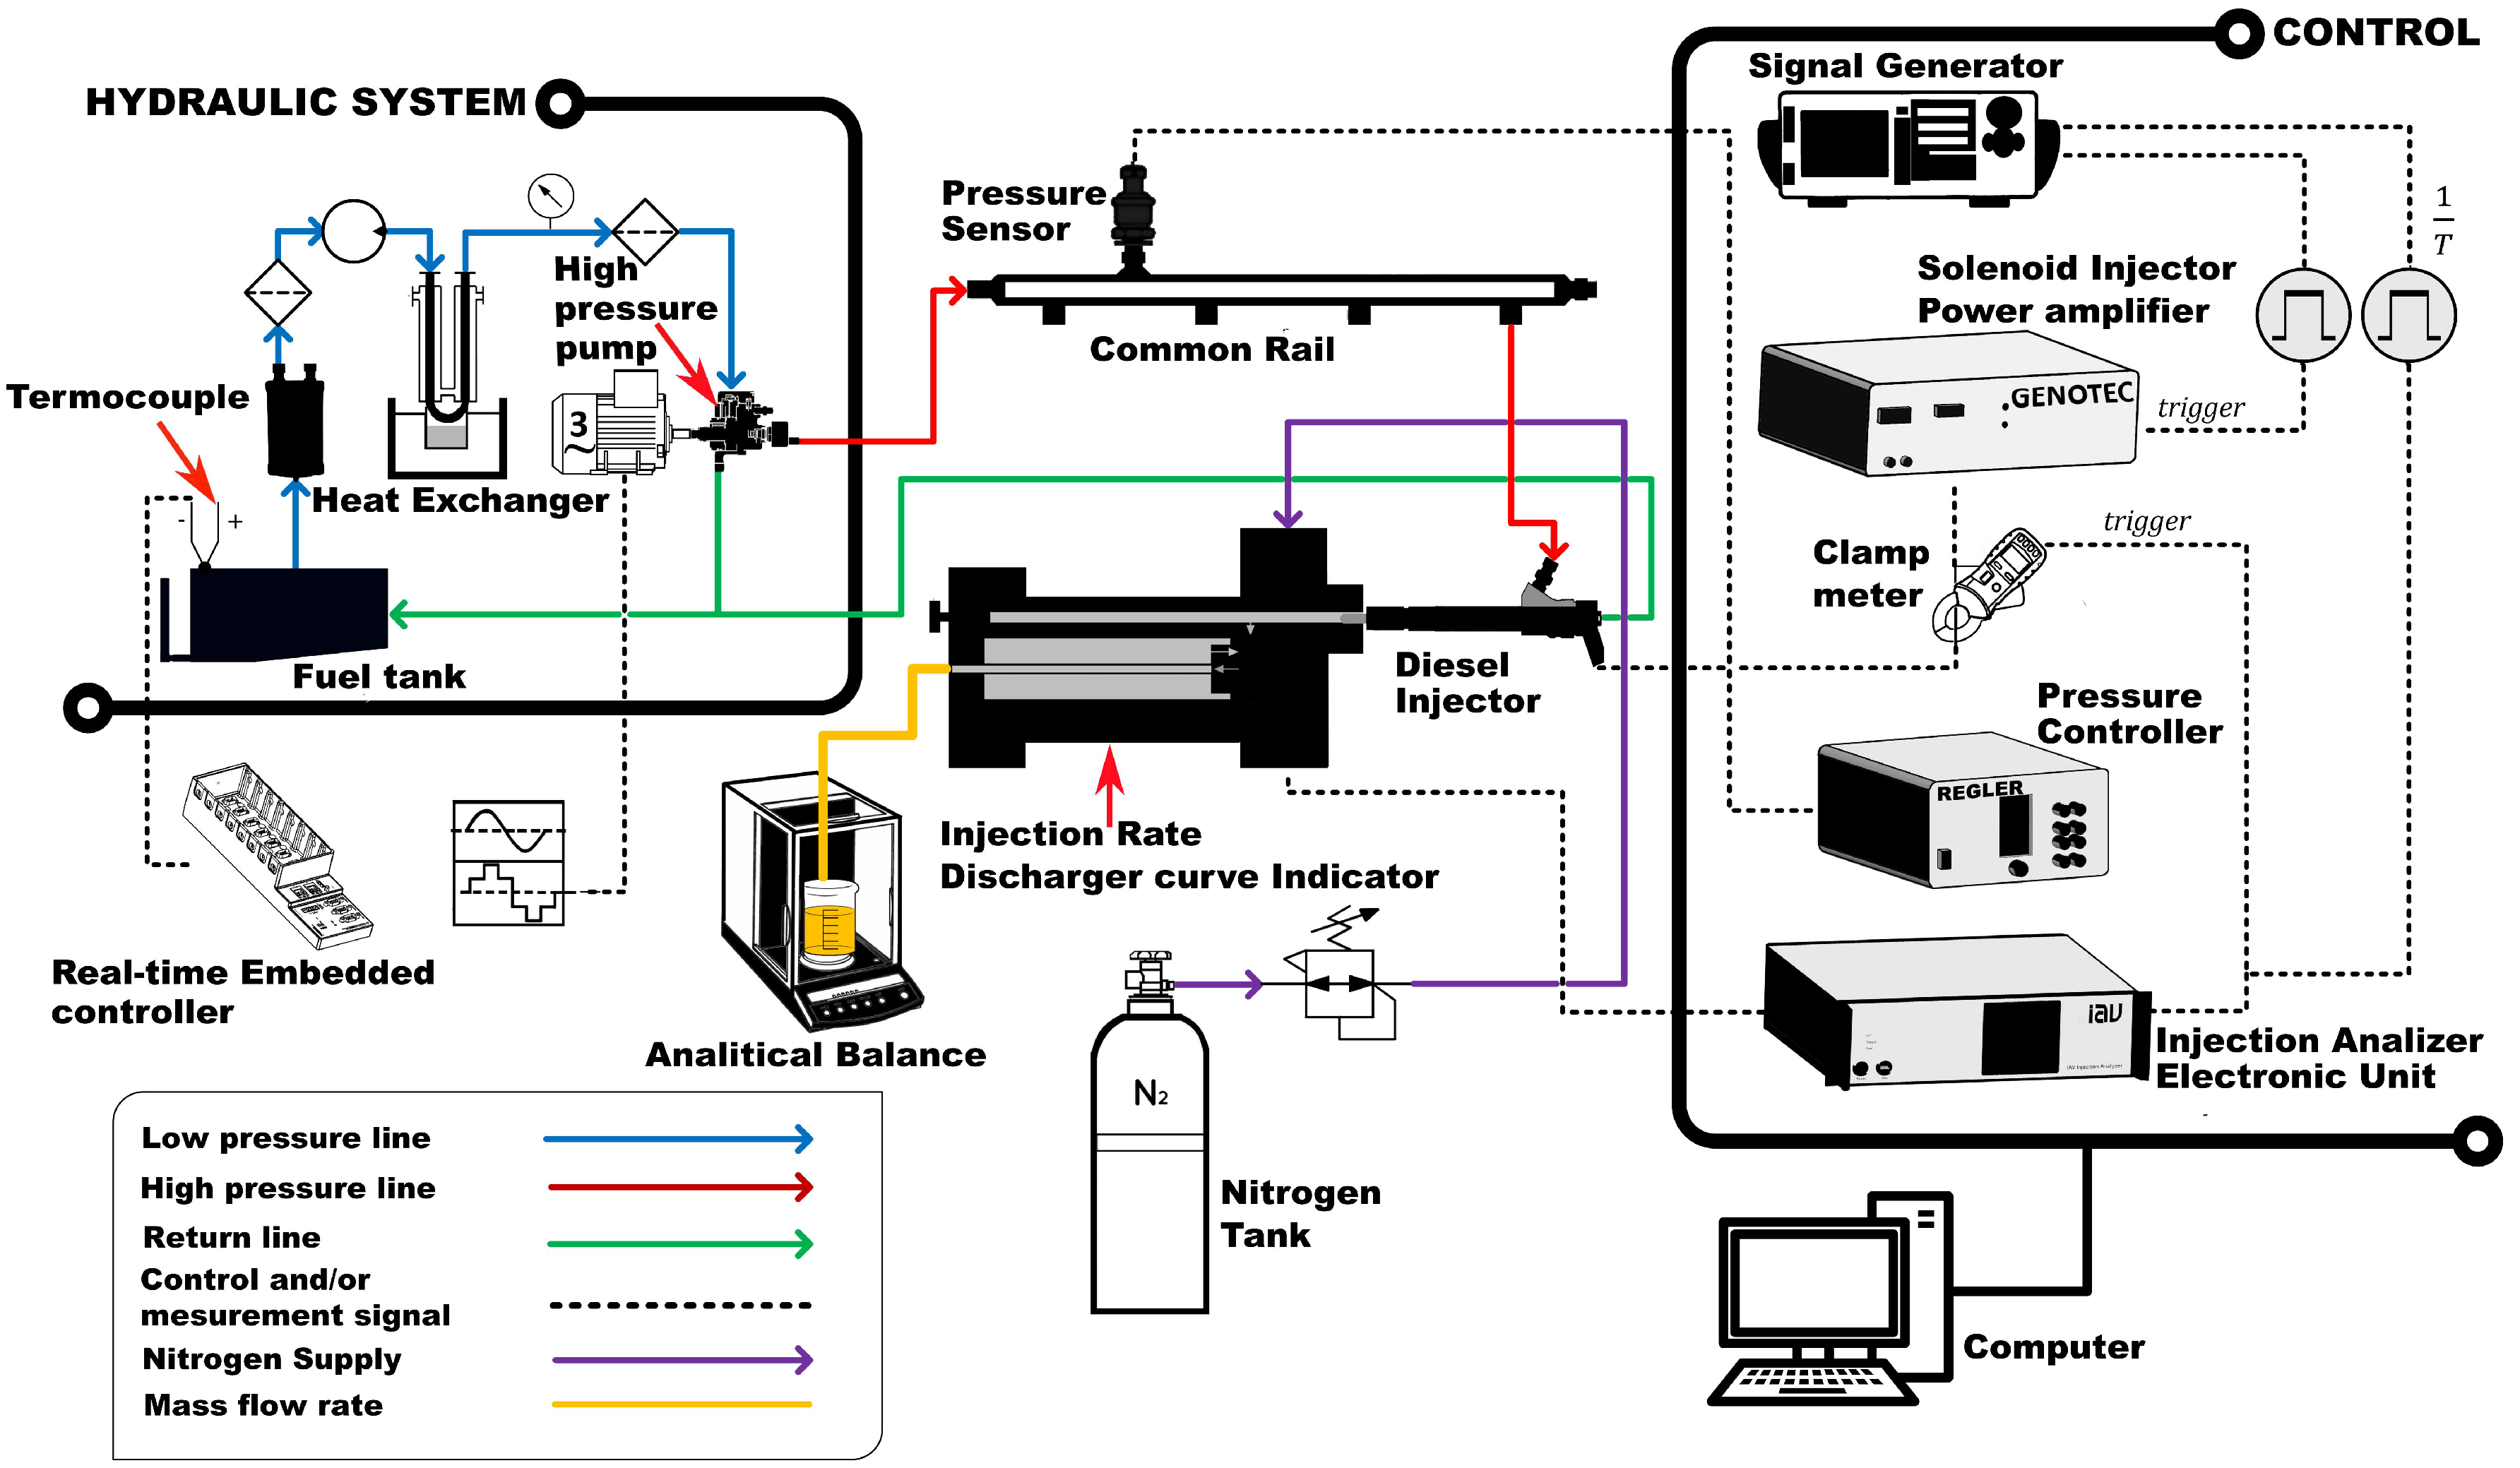
2.1. Experimental Equipment
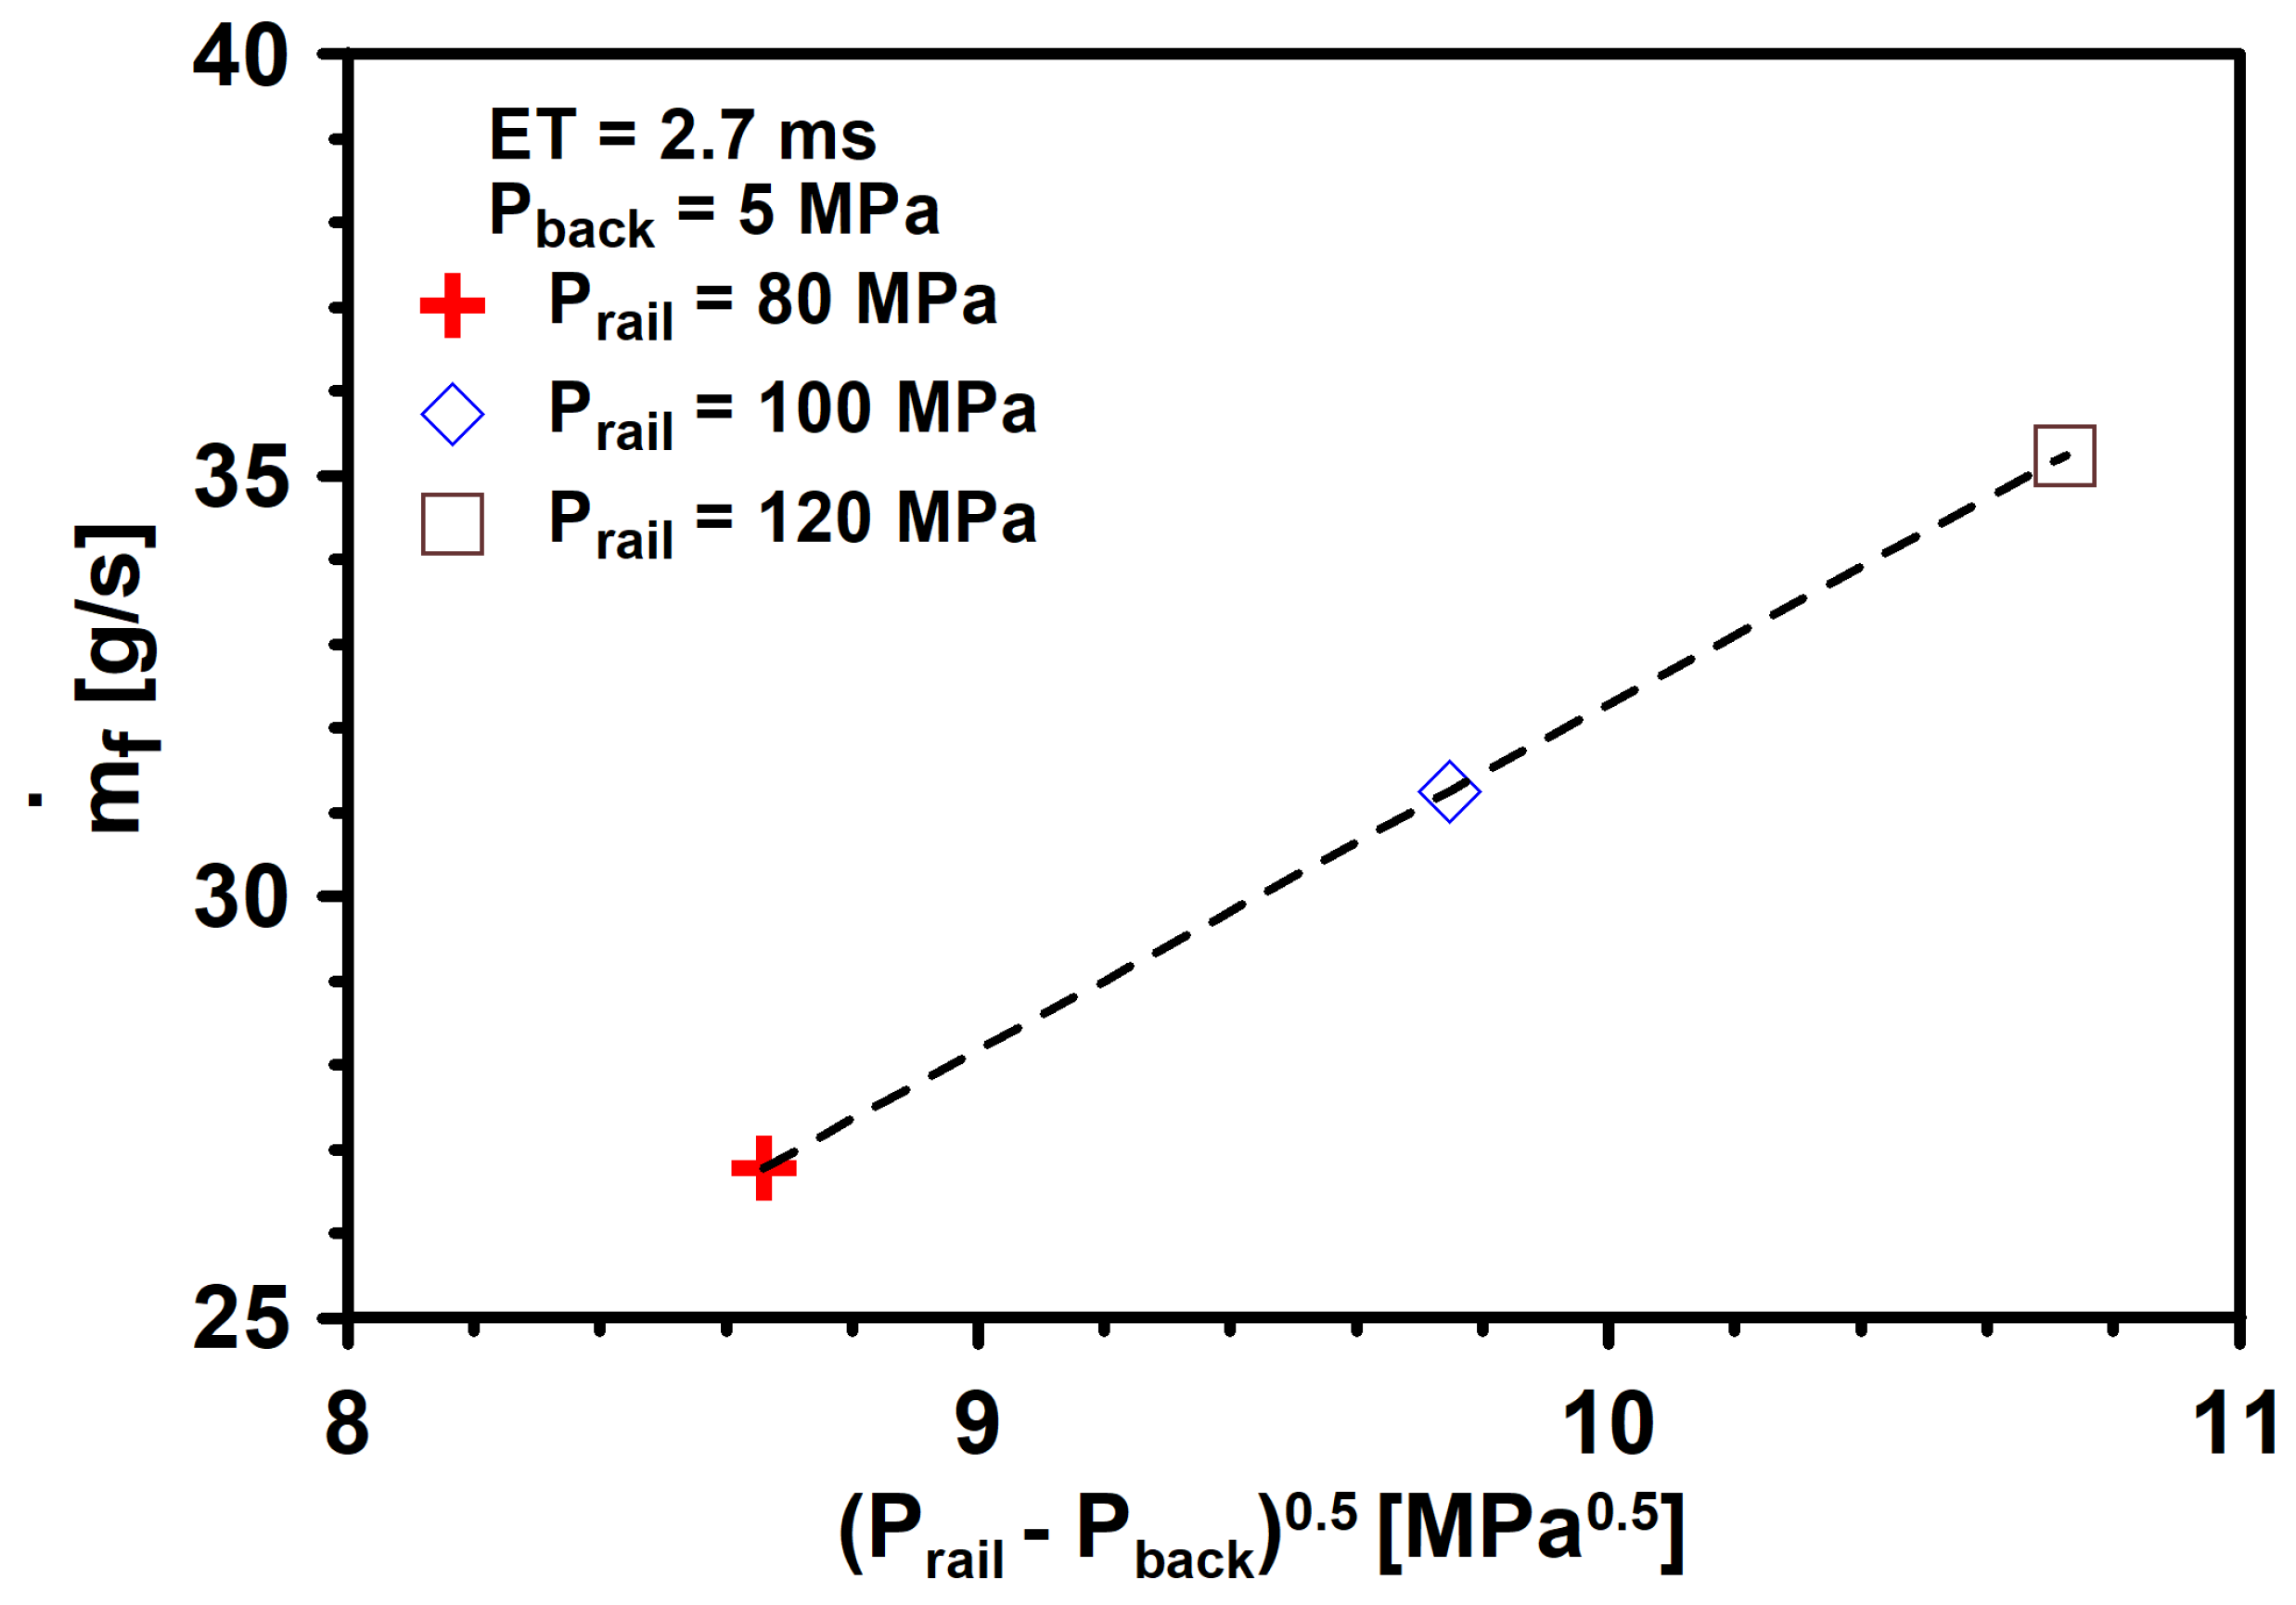
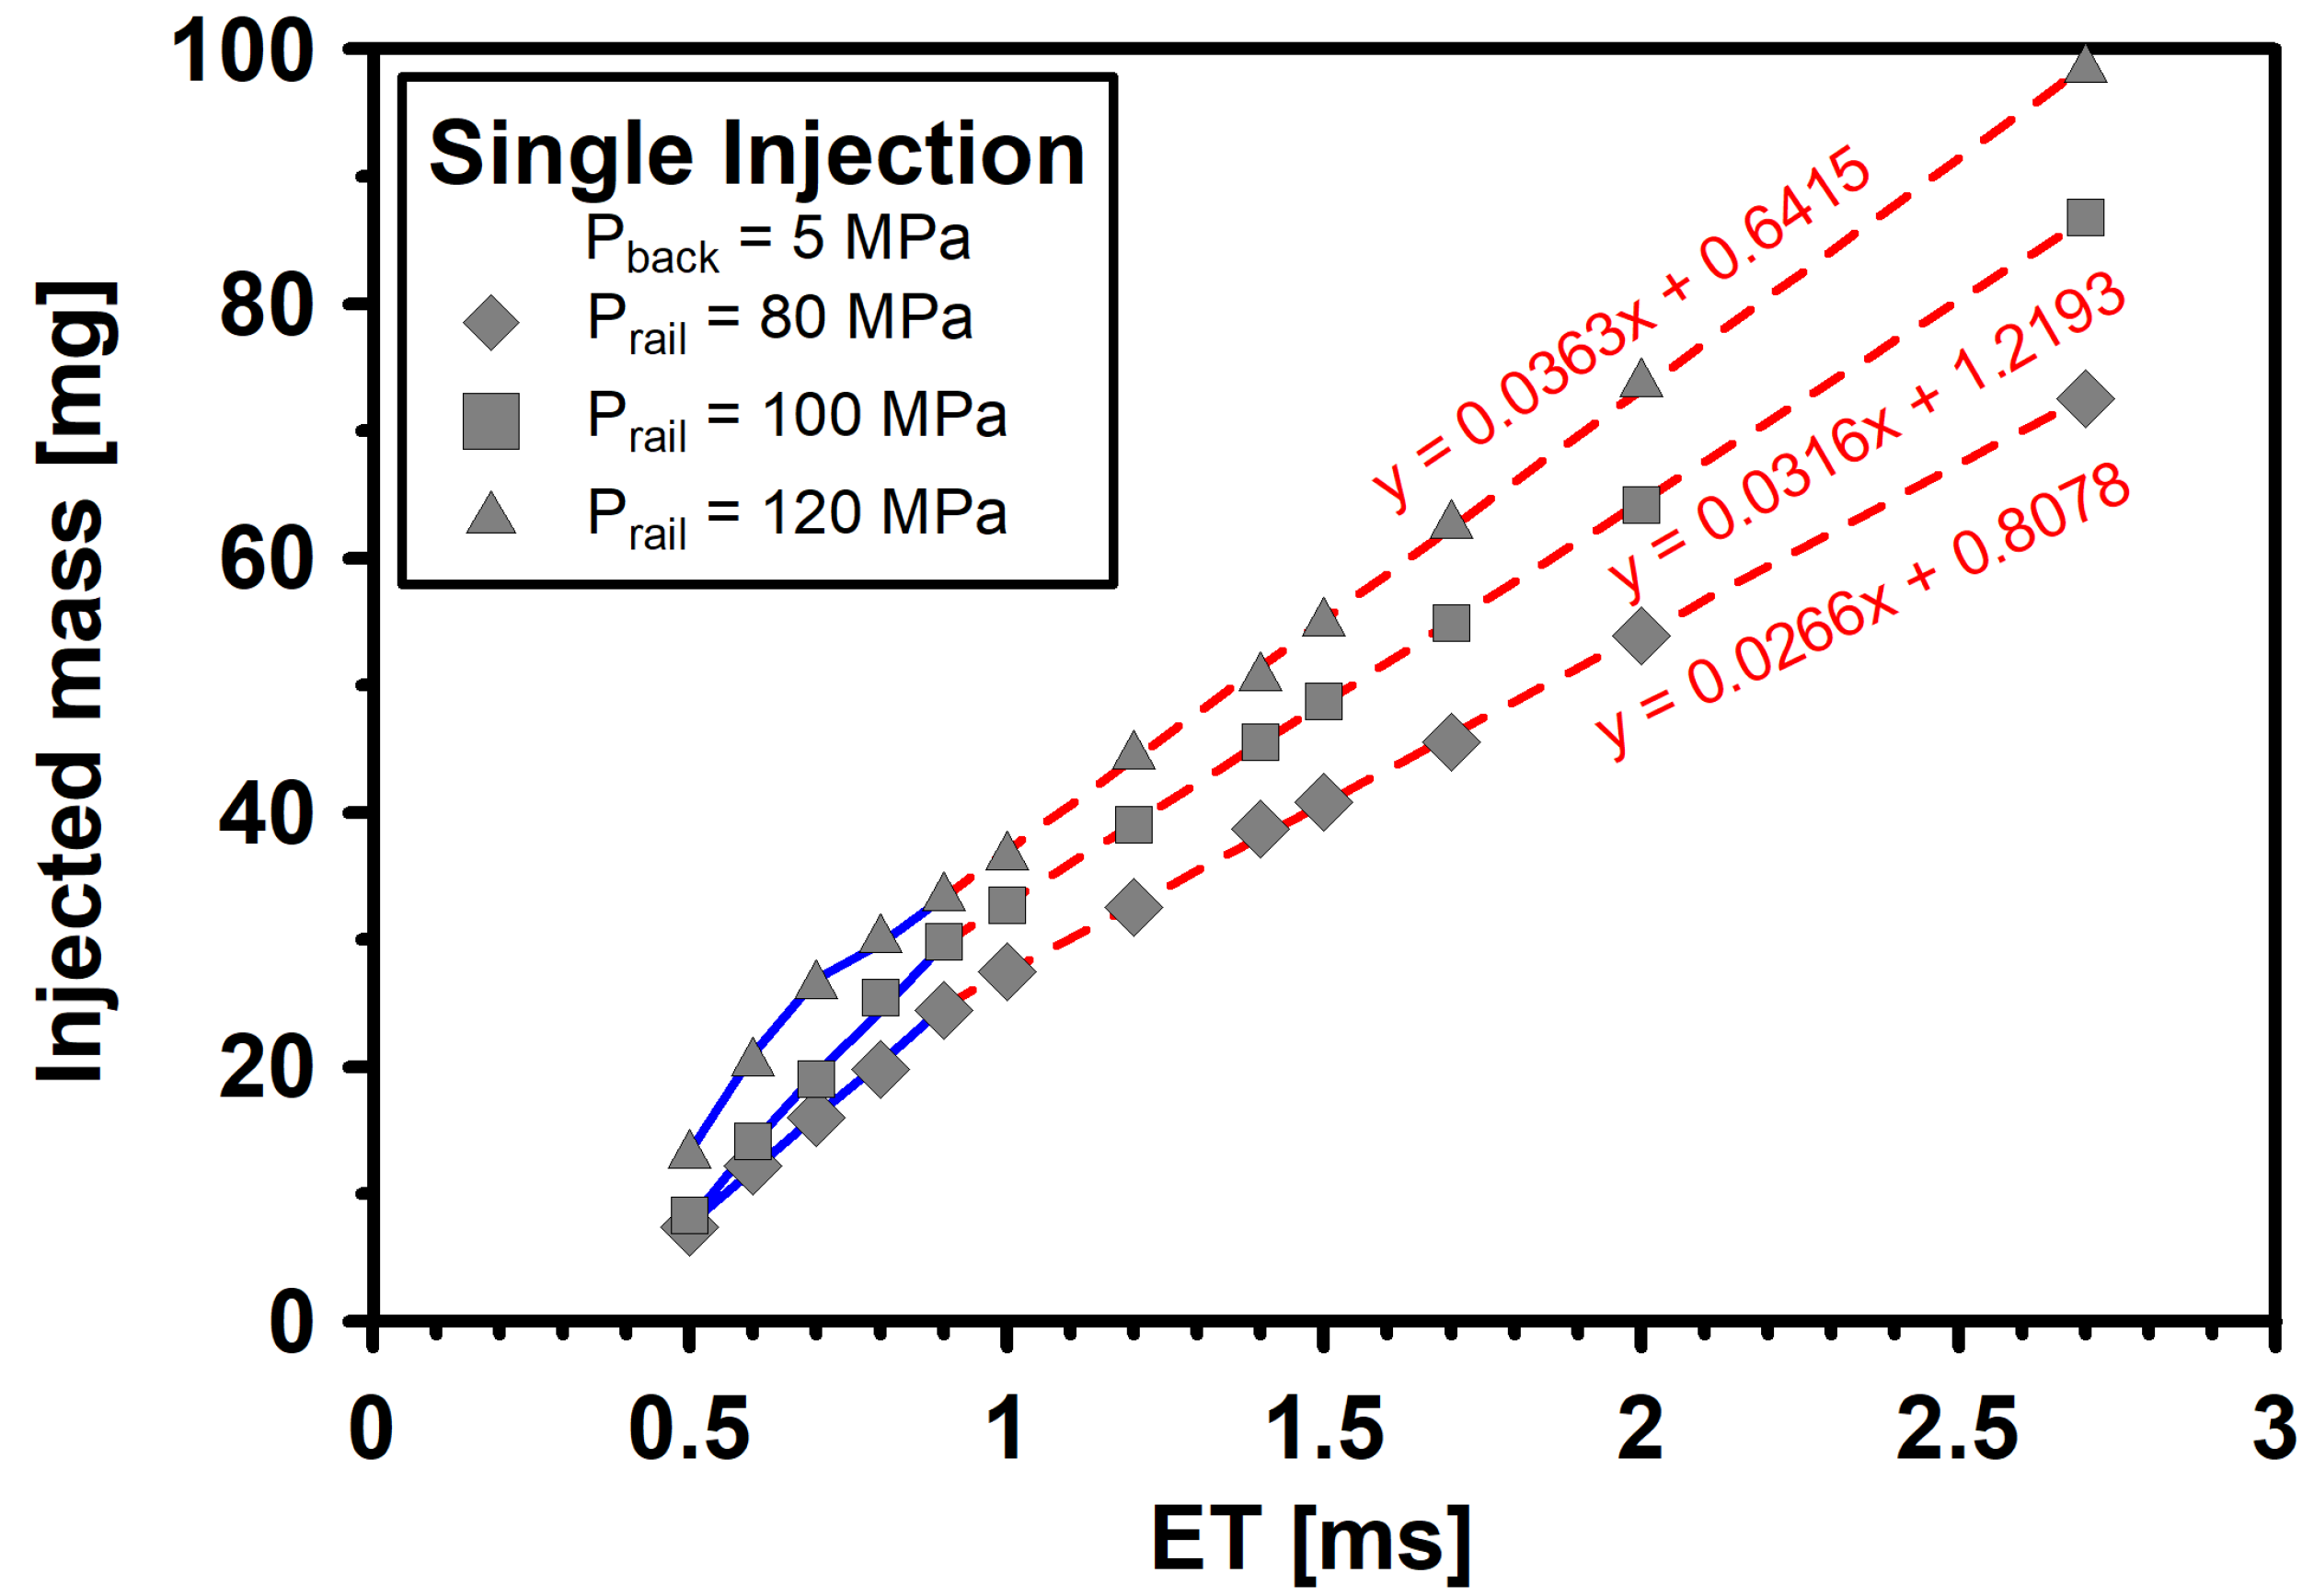
Mass flow rate measurements were performed with an injection rate discharge curve indicator (IRDCI), which is based on the Bosch or long tube method [22]. Figure 1 shows the schematic of injection rate discharge curve indicator, with all the components required for its operation and control. The experimental facility is mainly composed of an IAV model IA-N-050-050 injection discharge curve indicator, IAV model A-00036-03-00 injection analyzer electronic unit, diesel common-rail injection system with a seven-orifice solenoid injector, Genotec model 00499 pressure controller, Genotec model 01497 solenoid injector power amplifier. The mass flow rate measurements are acquired and processed by means of an IAV injection analyzer software.

2.2. Experiments

As was mentioned in the introduction section, the present work aims to explore the influence of dwell time on the hydraulic interactions between injection events using multiple injection strategies and a solenoid diesel injector.To do so, the energizing times (ET) required in each one of the multiple injection strategies are defined, and the levels of rail pressure ( p r a i l of 80, 100 and 120 MPa), and single level of back pressure ( p b a c k of 5 MPa), to ensure the same injected fuel mass (110 mg) in all cases. In order to do this, a sweep of energizing time from 0.5 up to 2.7 ms using a single injection and p r a i l levels of 80, 100, and 120 MPa, and p b a c k level of 5 MPa was performed. From each tested operating conditions, 100 repetitions of the mass flow rate measurement were acquired and processed by means of IAV injection analyzer software, as previously described. Figure 2 shows the temporal evolutions of average value mass flow rate obtained from 100 repetitions. Moreover, a region marked with two discontinuous vertical lines is also shown in the figure, indicating the stationary stage of mass flow rate measurement when using an energizing time of 2.7 ms.
Figure 3 shows the evolution of the average value of mass flow rate obtained from stationary stage marked in Figure 2, versus the square root of the pressure drop, when utilizing p r a i l levels of 80, 100, and 120 MPa and an energizing time of 2.7 ms.
From Figure 3, it can be observed that the mass flow rate linearly increases with the square root of the pressure drop. Therefore, the absense of cavitation phenomenon under the tested operating conditions can be concluded. This behaviour was also observed by other authors [18,23] when they analysed the influence of cavitation in common-rail diesel nozzle on the mass flow rate. After that, the injected fuel mass corresponding to each one of the tested operating conditions was determined, from integration of the area under the temporal evolution of mass flow rate measurement shown in Figure 2. Figure 4 shows the evolution of the injected fuel mass versus energizing time, for p r a i l levels of 80, 100, and 120 MPa and single p b a c k level of 5 MPa. It can be seen, in Figure 4, that in all p r a i l levels, there is a non-linear behaviour of injected fuel mass in the range of energizing time of 0.5–0.9 ms. On the other hand, there is a lineal behaviour of injected fuel mass in an energizing time range of 0.9–2.7 ms. This behaviour can be attributed to the needle lift, more specifically, at ET ≤ 0.9 ms, the needle does not reach full lift; in this condition, the injected fuel mass mainly depends on the needle dynamics. While, at ET > 0.9 ms, the needle does full lift, in this condition, the injected fuel mass mainly depends on the energizing time. This behaviour was also observed by Ferrari et al. [24], when they performed a hydraulic characterization of a solenoid diesel injector. In addition, fitting curves for injected fuel mass values are also shown in Figure 4. These fittings were performed in the operation zone, where the injected fuel mass depends on the energizing time. This purpose of these fits is to define the operating conditions of the multiple injection strategies, to ensure the same injected fuel mass in all cases. In Table 1, the defined operating conditions are described.
Figure 5 shows an example of mass flow rate measurement, along with an injection pulse obtained under multiple injection strategies using a p r a i l level of 100 MPa, a p b a c k level of 5 MPa, and dwell time of 1 ms. Moreover, the hydraulic delay of first and second injections is also shown in Figure 5a.
Once defined schematically, the first and second injection hydraulic delays shown in Figure 5, in Figure 6 demonstrate the evolution of the first injection hydraulic delay versus injection pressure when utilizing all tested multiple-injection strategies and injection pressure levels.
From Figure 6, it can be observed that the first injection hydraulic delay decreases with the injection pressure and approximately in the same magnitude order as the pilot injection strategy, split injection strategy and post-injection strategy. This behaviour was also observed by Aljohani et al. [21], previously cited in the “Introduction” section. The second injection hydraulic delay will be analysed in the forthcoming section.

3. Results and Discussion

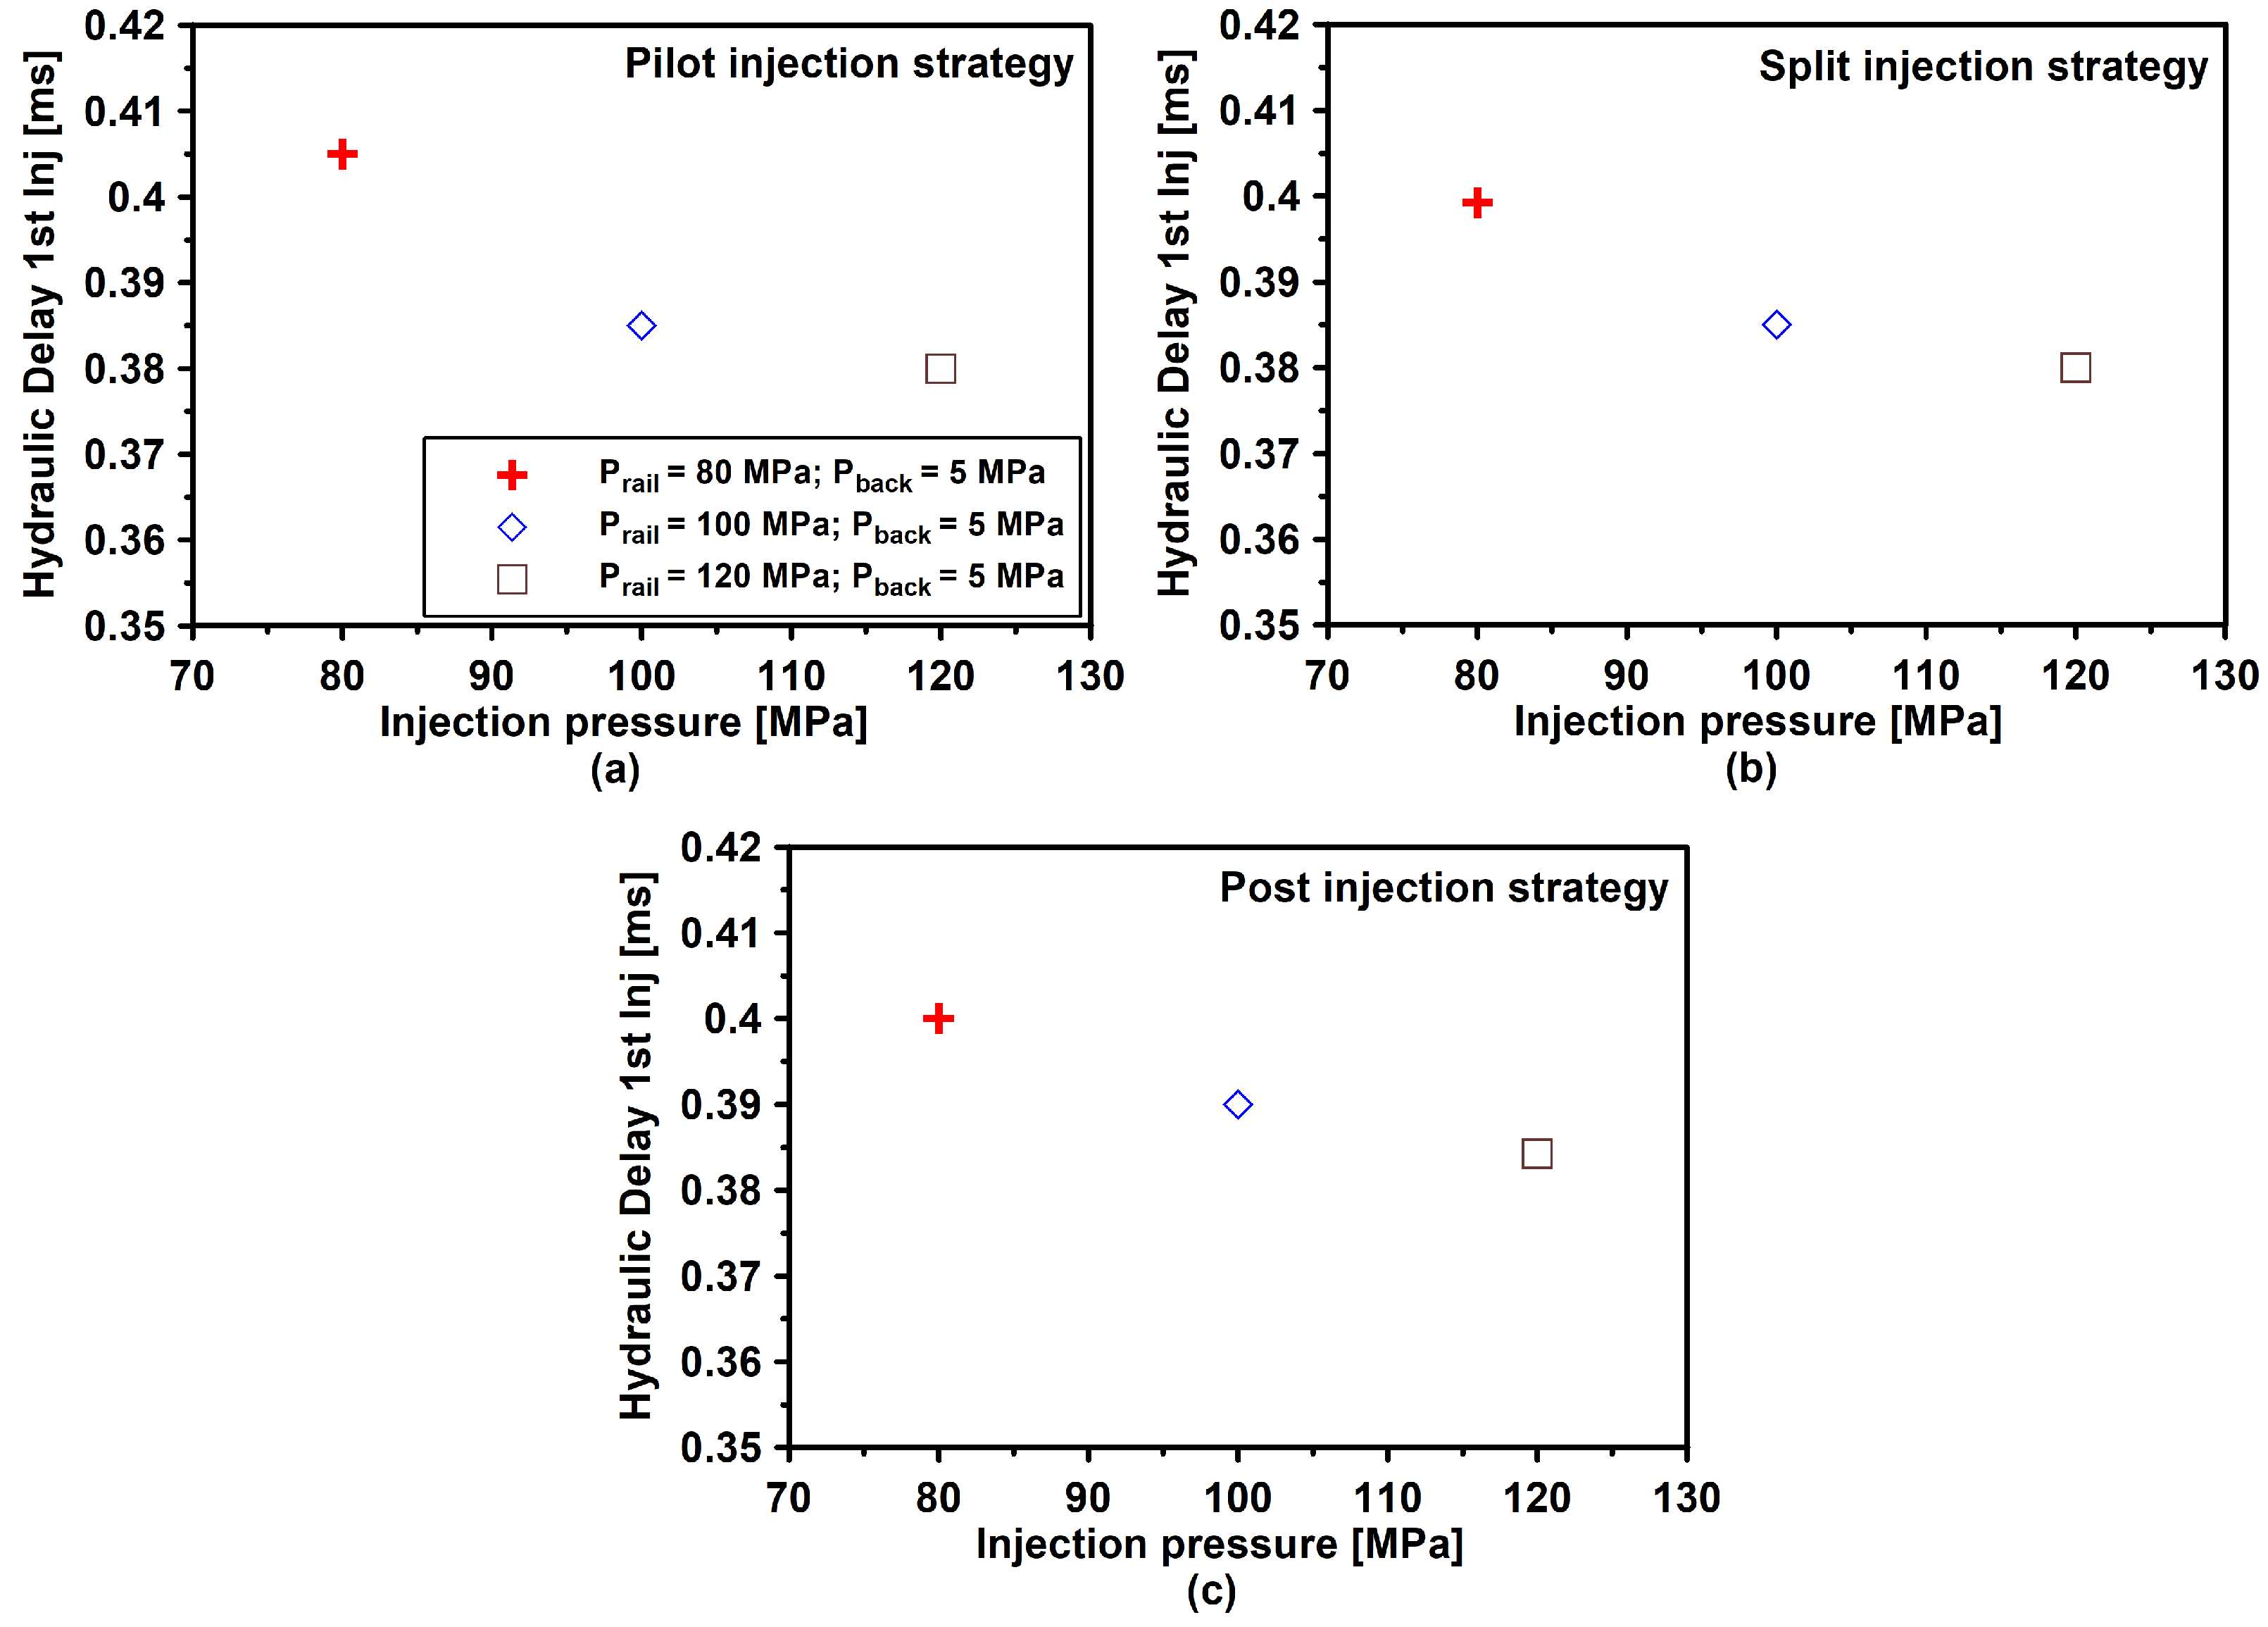
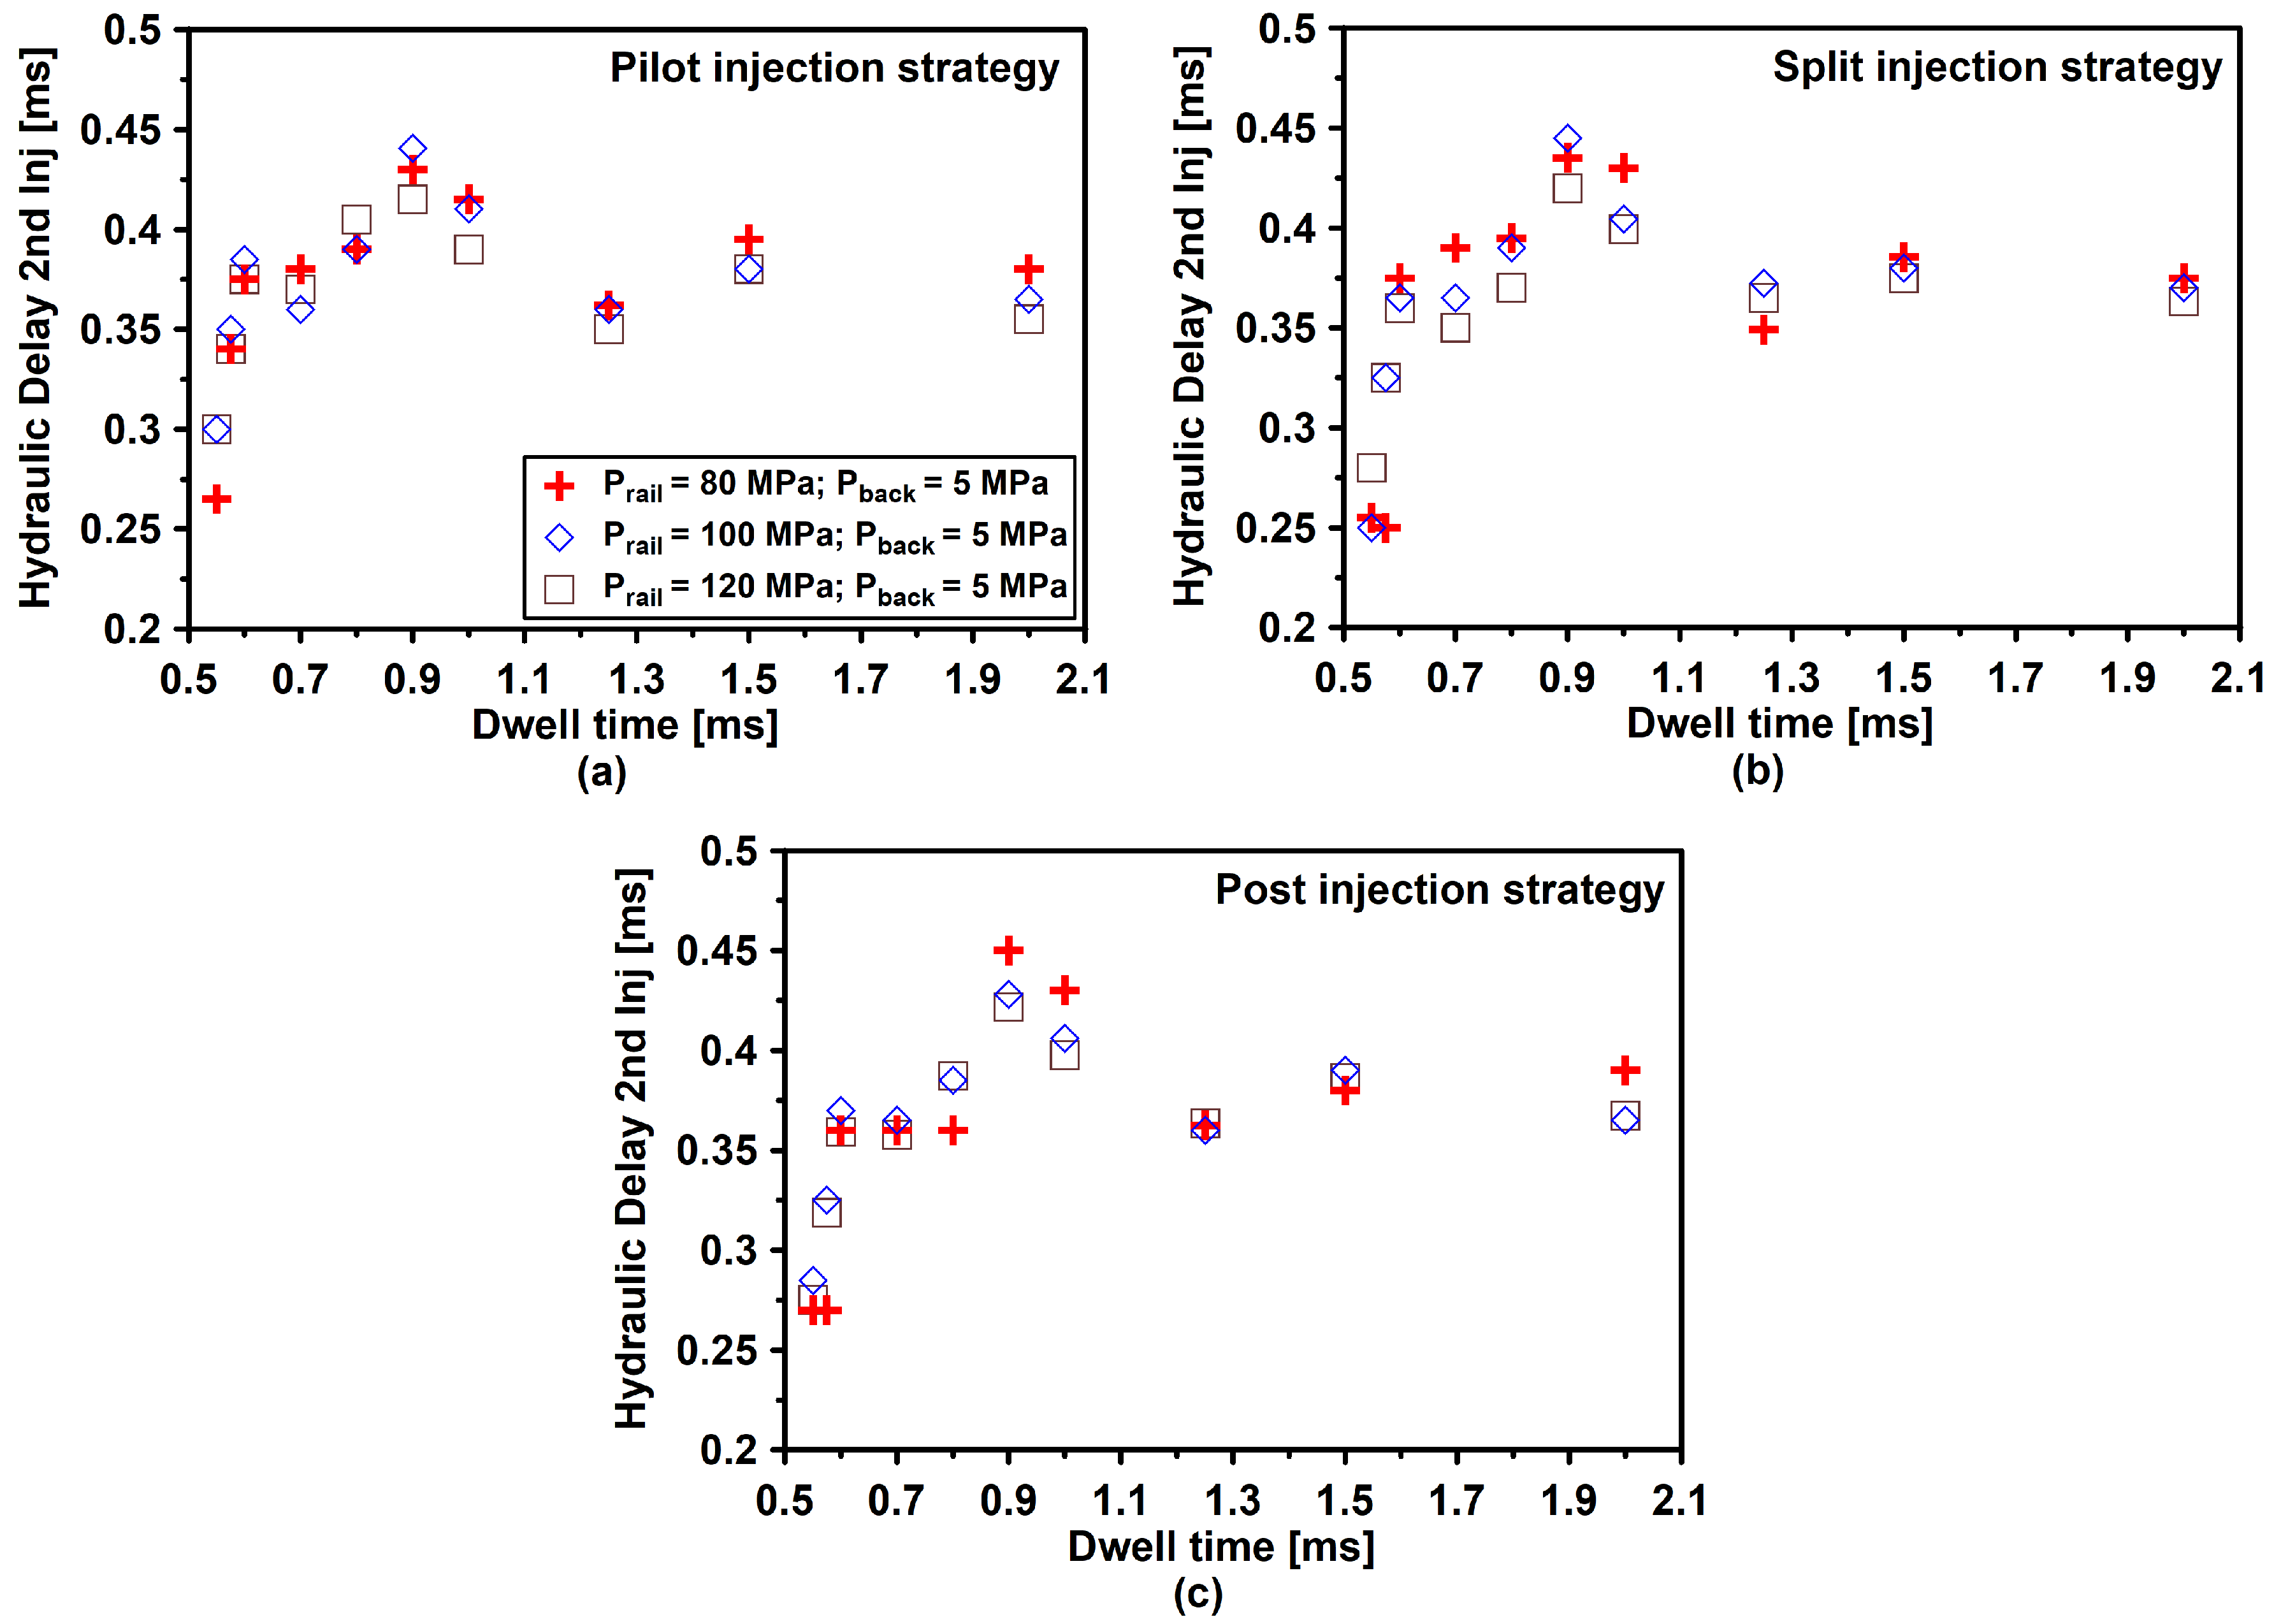
3.1. Effect of Dwell Time on the Second Injection Hydraulic Delay

Figure 7 shows the second injection hydraulic delay versus dwell time for different dwell times when utilizing the multiple injection strategies and p r a i l level of 80, 100, and 120 MPa and single p b a c k level of 5 MPa.
From Figure 7, it can be observed that the second injection hydraulic delay values display a growing trend in the range of 0.55 ≤ DT ≤ 0.9 ms for all multiple-injection strategies and p r a i l levels tested. More specifically, if the attention is focused on the p r a i l level of 80 MPa, the second injection hydraulic delay values are 0.26 ms and 0.43 ms for dwell time of 0.55 ms and 0.9 ms, respectively, when utilizing the pilot injection strategy. The second injection hydraulic delay values are 0.25 ms and 0.43 ms for dwell time of 0.55 ms and 0.9 ms, respectively, when using the split injection strategy. Finally, the second injection hydraulic delay values are 0.27 ms and 0.45 ms for dwell time of 0.55 ms and 0.9 ms, respectively, when utilizing the post-injection strategy. Therefore, it can be concluded that the second hydraulic delay depends mainly on the dwell time and not on the injected fuel mass during the first injection event. On the other hand, the second injection hydraulic delay values show a decreasing trend at DT values higher than 0.9 ms. This behaviour is observed in all multiple injection strategies and p r a i l levels tested. The second injection hydraulic delay is minimum at DT = 0.55 ms for all multiple injection strategies and p r a i l levels, as it is influenced by pressure waves propagation generated within the injector sac and control volume [18,25] during the first injection event. As the DT values increase in the range of 0.55–0.9 ms, the pressure waves propagation decrease as the needle dynamic effect is reduced, leading to an increase in the second injection hydraulic delay. Finally, the second injection hydraulic delay decreases with DT values higher than 0.9 ms due to the influence of pressure waves reflected downstream of the diesel nozzle.

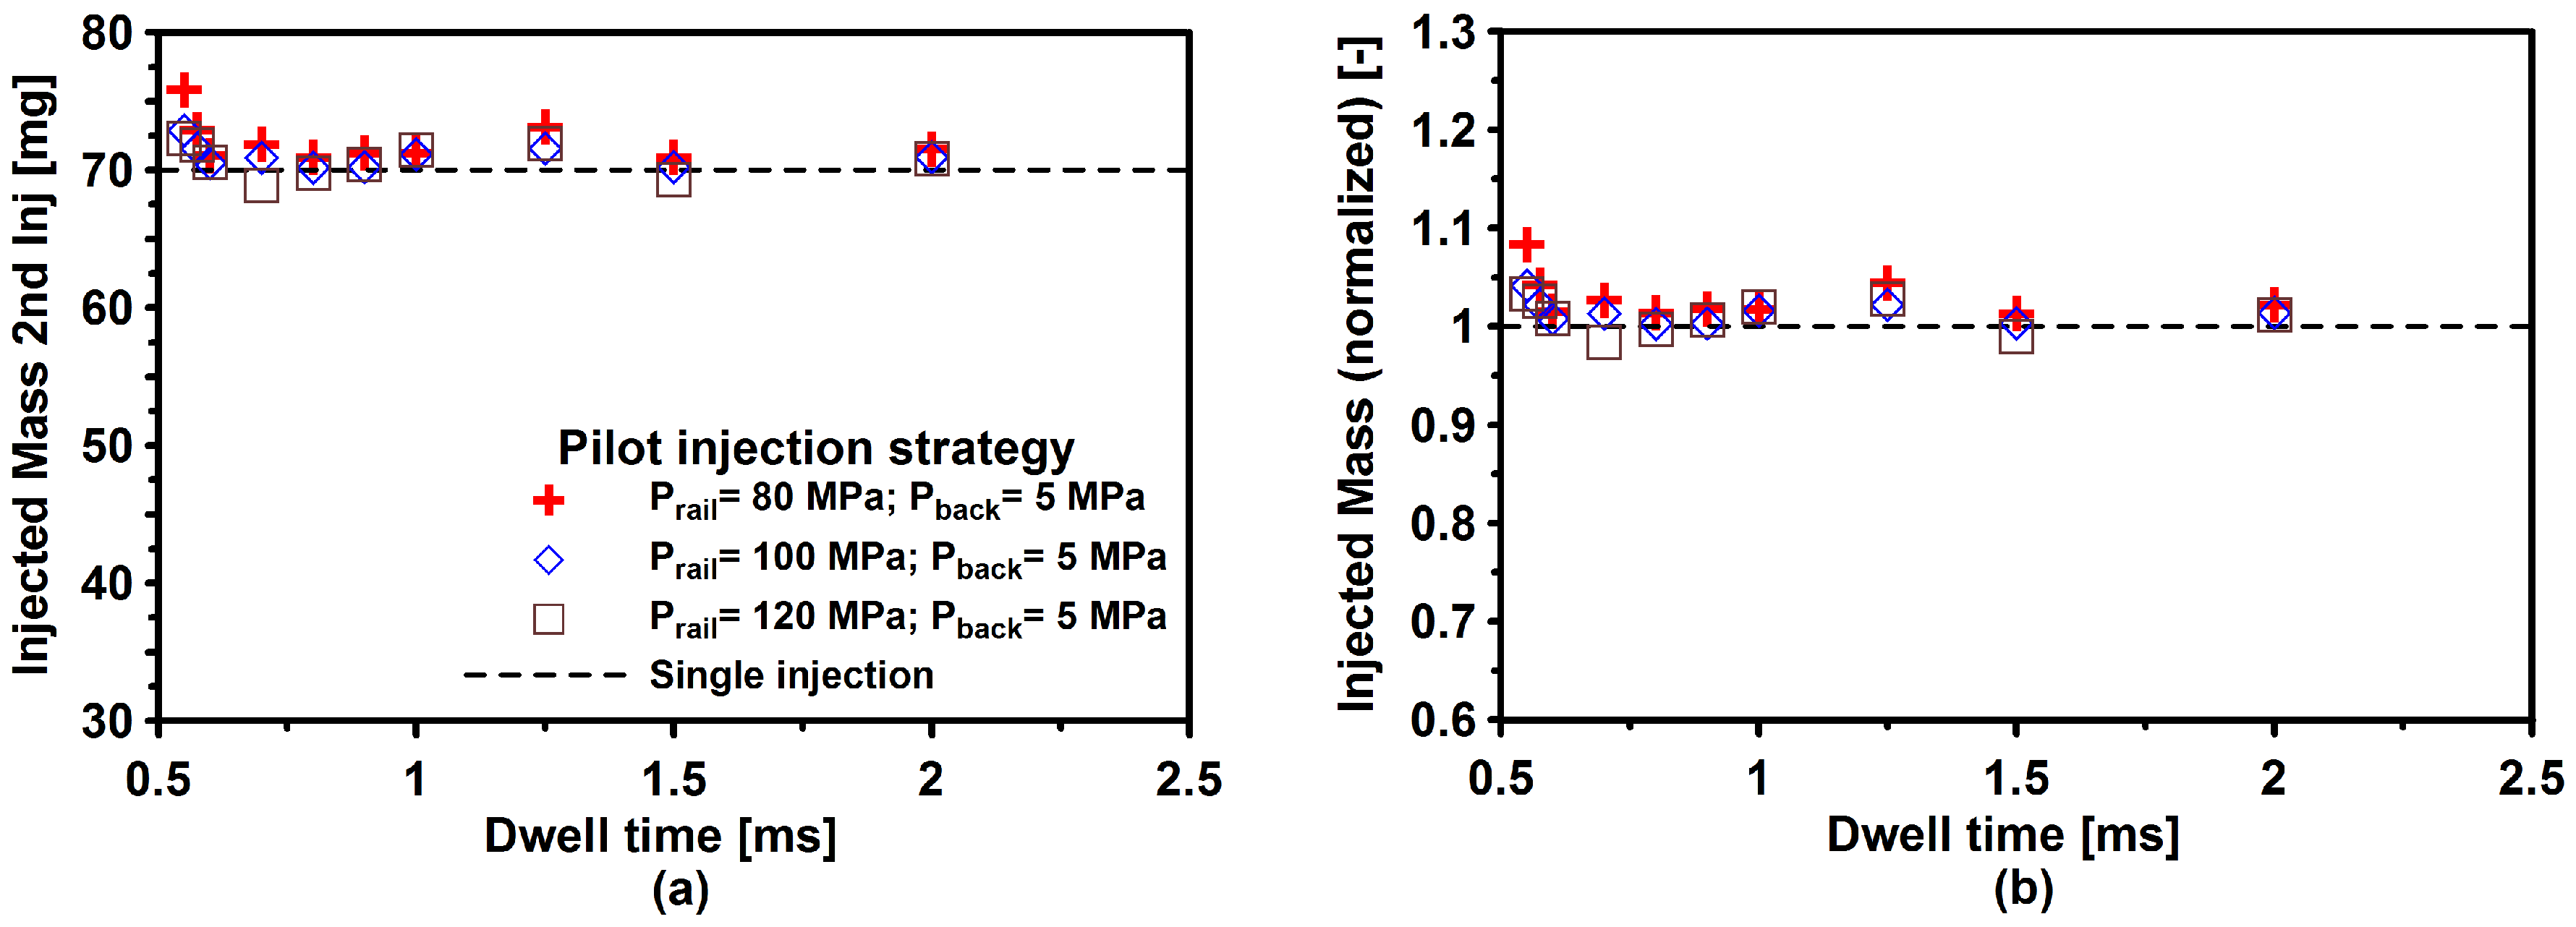
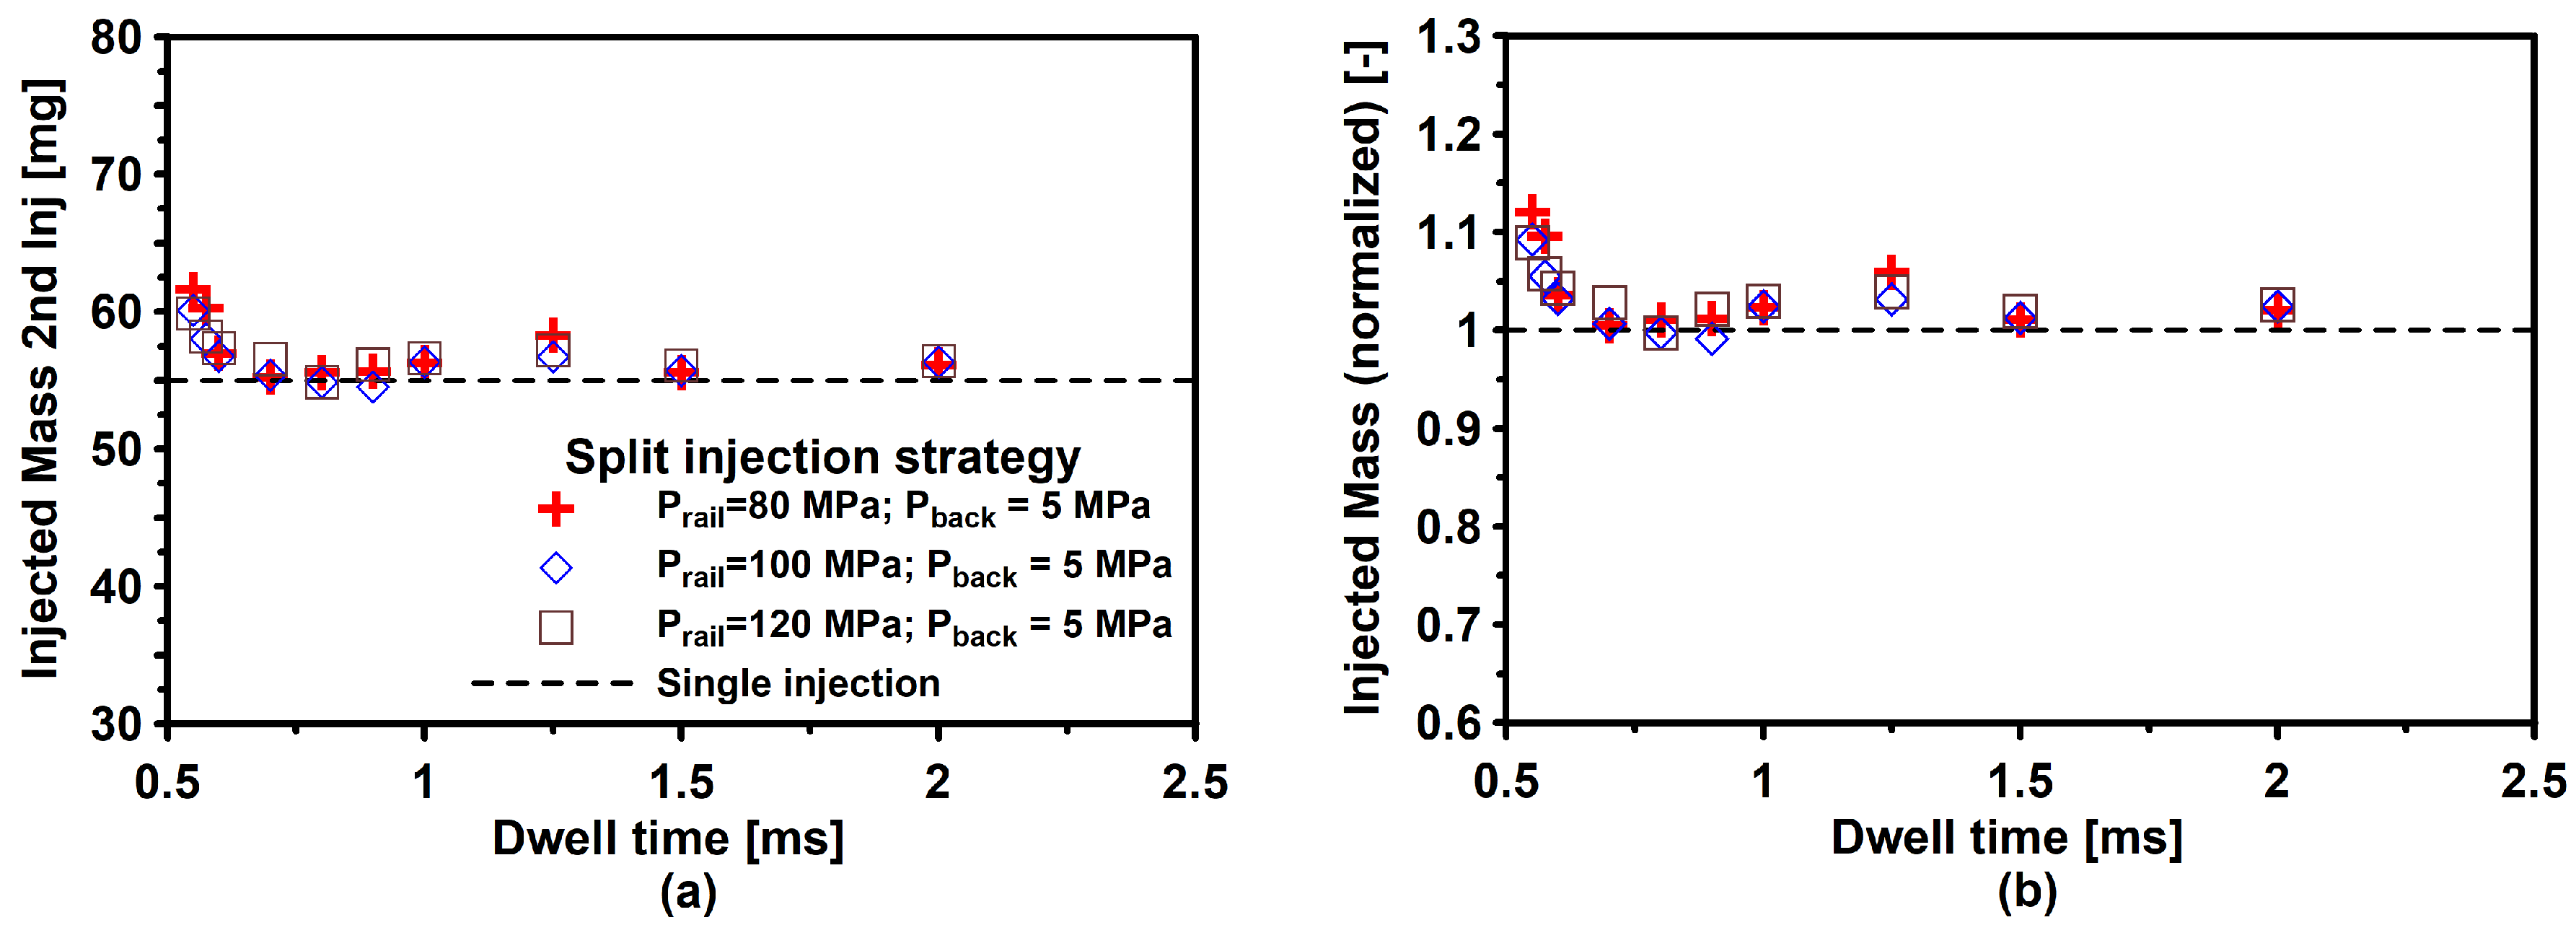
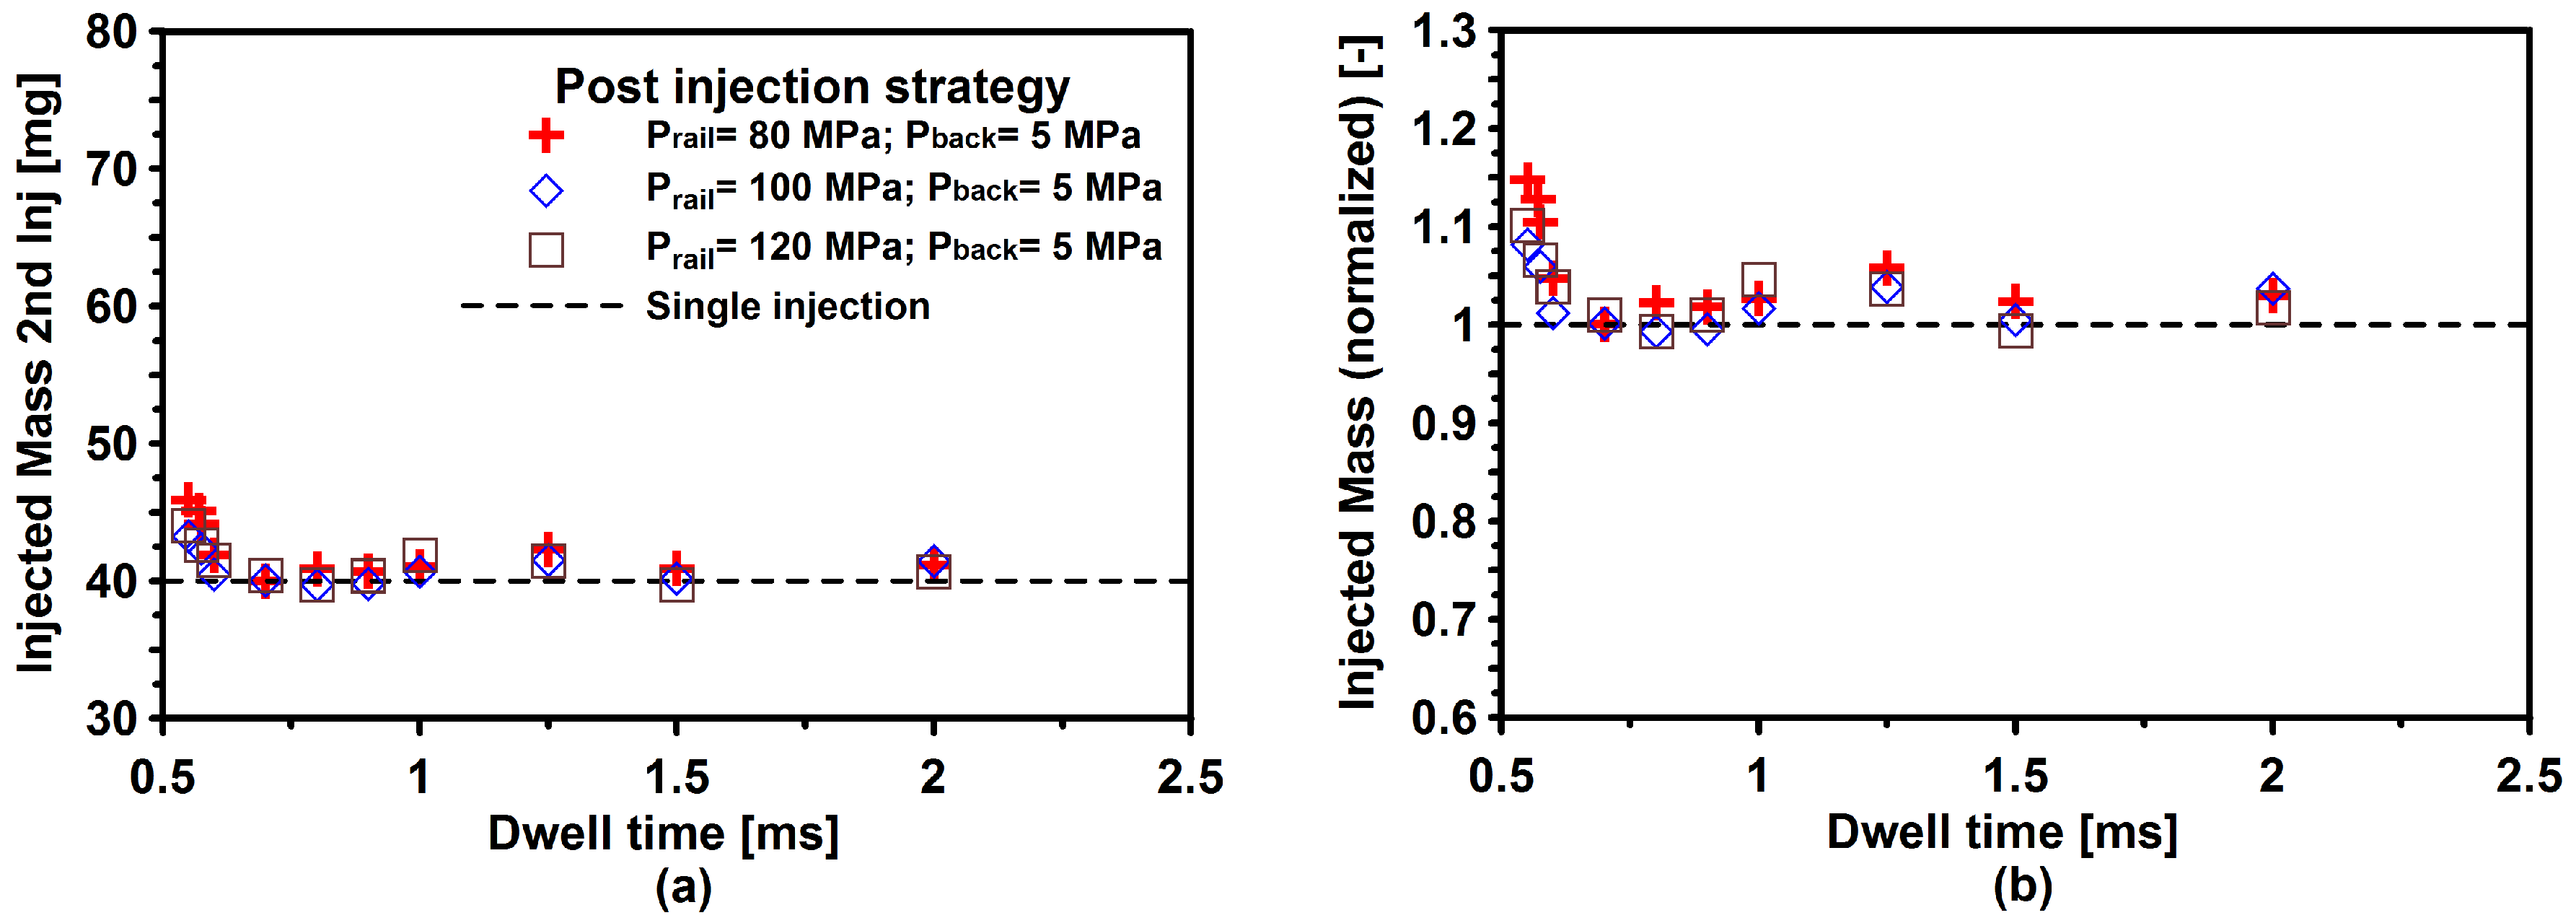
3.2. Effect of Dwell Time on the Second Injection Mass

Figure 8a shows the evolution of the second injected fuel mass versus dwell time, for different dwell times when using the pilot injection strategy and p r a i l levels and p b a c k level tested. In Figure 8b, the same information is presented, but now the values of second injected fuel mass have been normalized by the corresponding value of injected fuel mass in the single injection.
From Figure 8a, it can be observed that the second injected fuel mass increases with DT values less than 0.6 ms, while, at DT = 0.55 ms, the values of second injected fuel mass are higher than that of the injected fuel mass in the single injection, and the increasing percentages of second injected fuel mass are about 8.3%, 4.1%, and 3.3% for p r a i l levels of 80 MPa, 100 MPa, and 120 MPa, respectively. The second injected fuel mass is not significantly affected by a first injection at DT values higher than 0.6 ms. Payri et al. [18] suggested that this behaviour can be explained by the pressure dynamics inside the injector, mostly on the needle seat region.
Figure 9a shows the evolution of the second injected fuel mass versus dwell time for different dwell times when using the split injection strategy and p r a i l level of 80, 100, and 120 MPa and single p b a c k level of 5 MPa. In Figure 9b, as in the previous case, the values of the second injected fuel mass have been normalized by the corresponding value of injected fuel mass in the single injection.
From Figure 9b, as in the previous case, it can be observed that the second injected fuel mass increases with DT values less than 0.6 ms, while, at DT= 0.55 ms, the values of the second injected fuel mass are higher than that of the injected fuel mass in the single injection, and the increasing percentages of second injected fuel mass are about 12%, 9.2%, and 8.9% for p r a i l levels of 80 MPa, 100 MPa, and 120 MPa, respectively. The second injected fuel mass is not significantly affected by that of the first injection at DT values higher than 0.6 ms.
Figure 10a shows the evolution of the second injected fuel mass versus dwell time, for different dwell times when utilizing the post injection strategy and p r a i l levels and p b a c k level tested. Whilst, in Figure 10b, as in the previous cases, the values of second injected fuel mass have been normalized by the corresponding value of injected fuel mass in the single injection.
From Figure 10b, as in the previous cases, it can be observed that the second injected fuel mass increases with DT values less than 0.6 ms, where at DT = 0.55 ms, the values of second injected fuel mass are higher than that of the injected fuel mass in the single injection, and the increasing percentages of second injected fuel mass are about 14.8%, 8.2%, and 10% for p r a i l levels of 80 MPa, 100 MPa, and 120 MPa, respectively. The second injected fuel mass is not significantly affected by a first injection at DT values higher than 0.6 ms. Moreover, from Figure 8, Figure 9 and Figure 10, it can be observed that the second injected fuel mass has an oscillatory behaviour in the range of DT of 0.6–2 ms, where, at DT = 1.25 ms, the value of the second injected fuel mass is maximal. This behaviour can be attributed to the influence of pressure waves reflected downstream of the diesel nozzle.

4. Conclusions

The effect of dwell time on the second injection hydraulic delay and second injected fuel mass was analyzed. To do so, the pilot injection strategy, split injection strategy, post-injection strategy and a solenoid diesel injector were employed. Moreover, in all multiple injection strategies and operating conditions studied, the same fuel mass was injected. More specifically, in the pilot injection strategy: 40 mg + 70 mg, split injection strategy: 55 mg + 55 mg, and post-injection strategy: 70 mg + 40 mg. The main conclusions of the study will be summarized as follows.
The second injection hydraulic delay increases with DT values in the range of 0.55–0.9 ms for all multiple injection strategies and p r a i l levels tested. Conversely, the second injection hydraulic delay decreases with DT values higher than 0.9 ms. Moreover, the second hydraulic delay depends mainly on the dwell time and not on the injected fuel mass during the first injection event.
As an additional conclusion, it can be highlighted that, in all multiple injection strategies and p r a i l levels tested, the second injected fuel mass increases with DT values less than 0.6 ms. By contrast, the second injected fuel mass is not significantly affected by that of the first injection at DT values higher than 0.6 ms. In addition, the increasing percentages of second injected fuel mass for the post-injection strategy are higher than those of the split injection strategy and pilot injection strategy. This behaviour can be explained by the quantity injected fuel mass during the first injection event.

Author Contributions

Conceptualization, O.A.d.l.G., S.M.-M., and M.G.-Y.; Methodology, O.A.d.l.G., M.G.-Y. and S.M.-M.; Software, O.A.d.l.G., M.G.-Y. and R.M.-C.; Validation, O.A.d.l.G., M.G.-Y., F.A.S.-C. and R.M.-C.; Formal analysis, O.A.d.l.G., M.G.-Y., R.M.-C. and F.A.S.-C.; Investigation, O.A.d.l.G., M.G.-Y. and R.M.-C.; Resources, O.A.d.l.G., S.M.-M. and F.A.S.-C.; Writing—original draft preparation, O.A.d.l.G., M.G.-Y. and S.M.-M.; Writing—review and editing, O.A.d.l.G., S.M.-M. and M.G.-Y.; Visualization, O.A.d.l.G., M.G.-Y., F.A.S.-C., and R.M.-C.; Supervision, O.A.d.l.G. and S.M.-M.; Project administration, O.A.d.l.G. and S.M.-M.; Funding acquisition, O.A.d.l.G. and S.M.-M. All authors have read and agreed to the published version of the manuscript.

Funding

This research was funded by UANL-PAICYT (grant numbers: IT412-20 and IT1423-20), and the DENSO North America Foundation (project: Influence of multiple-injection strategies on the injection process using direct-acting piezoelectric and solenoid diesel injector).

Institutional Review Board Statement

Not applicable.

Informed Consent Statement

Not applicable.

Data Availability Statement

Data sharing not applicable.

Acknowledgments

The authors would like to thank María del Socorro Ángel García, for the support in the data processing.

Conflicts of Interest

The authors declare no conflict of interest.

Abbreviations

The following abbreviations are used in this manuscript:
DTDwell time
ETEnergizing time
m ˙ Mass flow rate
pPressure
SOPStart of pulse
SOIStart of Injection
Subscripts
backVolume where the fuel is injected
fFuel
railCommon-rail

References

  1. Stoumpos, S.; Theotokatos, G. Multiobjective optimisation of a marine dual fuel engine equipped with exhaust gas recirculation and air bypass systems. Energies 2020, 13, 5021. [Google Scholar] [CrossRef]
  2. Reksowardojo, I.K.; Setiapraja, H.; Fajar, R.; Wibowo, E.; Kusdiana, D. An Investigation of Laboratory and Road Test of Common Rail Injection Vehicles Fueled with B20 Biodiesel. Energies 2020, 13, 6118. [Google Scholar] [CrossRef]
  3. Soto, F.; Marques, G.; Soto-Izquierdo, L.; Torres-Jiménez, E.; Quaglia, S.; Guerrero-Villar, F.; Dorado-Vicente, R.; Abdalla, J. Performance and regulated emissions of a medium-duty diesel engine fueled with biofuels from sugarcane over the European steady cycle (ESC). Fuel 2021, 292, 120326. [Google Scholar] [CrossRef]
  4. Di Blasio, G.; Belgiorno, G. Effects on performances, emissions and particle size distributions of a dual fuel (methane-diesel) light-duty engine varying the compression ratio. Appl. Energy 2017, 204, 726–740. [Google Scholar] [CrossRef]
  5. Belgiorno, G.; Di Blasio, G.; Shamun, S.; Beatrice, C.; Tunestål, P.; Tunér, M. Performance and emissions of diesel-gasoline-ethanol blends in a light duty compression ignition engine. Fuel 2018, 217, 78–90. [Google Scholar] [CrossRef]
  6. de la Garza, O.A.; Martínez-Martínez, S.; Avulapati, M.M.; Pos, R.; Megaritis, T.; Ganippa, L. Biofuels and its spray interactions under pilot-main injection strategy. Energy 2021, 219, 119464. [Google Scholar] [CrossRef]
  7. Karthickeyan, V. Effect of combustion chamber bowl geometry modification on engine performance, combustion and emission characteristics of biodiesel fuelled diesel engine with its energy and exergy analysis. Energy 2019, 176, 830–852. [Google Scholar] [CrossRef]
  8. Pastor, J.V.; García, A.; Micó, C.; Lewiski, F. Soot reduction for cleaner Compression Ignition Engines through innovative bowl templates. Int. J. Engine Res. 2020, 1–15. [Google Scholar] [CrossRef]
  9. Monsalve-Serrano, J.; Belgiorno, G.; Di Blasio, G.; Guzmán-Mendoza, M. 1D Simulation and Experimental Analysis on the Effects of the Injection Parameters in Methane–Diesel Dual-Fuel Combustion. Energies 2020, 13, 3734. [Google Scholar] [CrossRef]
  10. Wang, Q.; Huang, R.; Ni, J.; Chen, Q. Potential Improvement in PM-NOX Trade-Off in a Compression Ignition Engine by n-Octanol Addition and Injection Pressure. Processes 2021, 9, 310. [Google Scholar] [CrossRef]
  11. Nair, J. Mitigation of Emissions through Injection Strategies for C I Engine. IntechOpen 2021. [Google Scholar] [CrossRef]
  12. Payri, R.; García-Oliver, J.M.; Mendoza, V.; Viera, A. Analysis of the influence of diesel spray injection on the ignition and soot formation in multiple injection strategy. Energies 2020, 13, 1651. [Google Scholar] [CrossRef]
  13. D’Ambrosio, S.; Ferrari, A.; Mancarella, A.; Mittica, A. Effects of Rate-Shaped and Multiple Injection Strategies on Pollutant Emissions, Combustion Noise and Fuel Consumption in a Low Compression Ratio Diesel Engine. Int. J. Automot. Technol. 2020, 21, 197–214. [Google Scholar] [CrossRef]
  14. Chacko, N.; Rajkumar, S.; Thangaraja, J. Experimental and modeling analysis of multiple-injection strategies with B20 operation in a CRDI engine. Fuel 2021, 293, 120433. [Google Scholar] [CrossRef]
  15. How, H.G.; Masjuki, H.H.; Kalam, M.A.; Teoh, Y.H. Influence of injection timing and split injection strategies on performance, emissions, and combustion characteristics of diesel engine fueled with biodiesel blended fuels. Fuel 2018, 213, 106–114. [Google Scholar] [CrossRef]
  16. Mei, D.; Yu, Q.; Zhang, Z.; Yue, S.; Tu, L. Effects of Two Pilot Injection on Combustion and Emissions in a PCCI Diesel Engine. Energies 2021, 14, 1651. [Google Scholar] [CrossRef]
  17. Liang, X.; Liu, Z.; Wang, K.; Wang, X.; Zhu, Z.; Xu, C.; Liu, B. Impact of Pilot Injection on Combustion and Emission Characteristics of a Low-Speed Two-Stroke Marine Diesel Engine. Energies 2021, 14, 417. [Google Scholar] [CrossRef]
  18. Payri, R.; De la Morena, J.; Pagano, V.; Hussain, A.; Sammut, G.; Smith, L. One-dimensional modeling of the interaction between close-coupled injection events for a ballistic solenoid injector. Int. J. Engine Res. 2019, 20, 452–469. [Google Scholar] [CrossRef]
  19. Busch, S.; Miles, P.C. Parametric Study of Injection Rates With Solenoid Injectors in an Injection Quantity and Rate Measuring Device. J. Eng. Gas Turbines Power 2015, 137, 1–35. [Google Scholar] [CrossRef]
  20. Ferrari, A.; Zhang, T. Influence of the injector setup on digital and continuous injection rate-shaping performance in diesel engine passenger cars. Energy Convers. Manag. 2020, 205, 112259. [Google Scholar] [CrossRef]
  21. Aljohani, B.S.; Ben Houidi, M.; Babayev, R.; Aljohani, K.; Johansson, B. In Situ Injection Rate Measurement to Study Single and Split Injections in a Heavy-Duty Diesel Engine. SAE Tech. Pap. 2019. [Google Scholar] [CrossRef]
  22. Bosch, W. The fuel rate indicator: A new measuring instrument for display of the characteristics of individual injection. SAE Tech. Pap. 1966. [Google Scholar] [CrossRef]
  23. López, J.J.; Salvador, F.J.; de la Garza, O.A.; Arrègle, J. A comprehensive study on the effect of cavitation on injection velocity in diesel nozzles. Energy Convers. Manag. 2012, 64, 415–423. [Google Scholar] [CrossRef]
  24. Ferrari, A.; Mittica, A.; Paolicelli, F.; Pizzo, P. Hydraulic Characterization of Solenoid-actuated Injectors for Diesel Engine Common Rail Systems. Energy Procedia 2016, 101, 878–885. [Google Scholar] [CrossRef]
  25. Payri, R.; Gimeno, J.; Martí-Aldaraví, P.; Viera, A. Measurements of the mass allocation for multiple injection strategies using the rate of injection and momentum flux signals. Int. J. Engine Res. 2020. [Google Scholar] [CrossRef]
Figure 1. Schematic setup of the experimental equipment.
Energies 14 03087 g001
Figure 2. Temporal evolution of mass flow rate measurement, for different energizing times using a single injection and p r a i l levels of (a) 80 MPa, (b) 100 MPa and (c) 120 MPa, and a single level of p b a c k of 5 MPa.
Energies 14 03087 g002
Figure 3. Mass flow rate versus the square root of the pressure drop.
Energies 14 03087 g003
Figure 4. Evolution of the injected fuel mass versus energizing time, for p r a i l levels and p b a c k level tested.
Energies 14 03087 g004
Figure 5. Examples of measurements of mass flow rate along with injection pulse obtained under multiple injection strategies: (a) pilot injection strategy, (b) split injection strategy, and (c) post injection strategy.
Energies 14 03087 g005
Figure 6. Evolution of the first injection hydraulic delay versus injection pressure, when utilizing the multiple injection strategies: (a) pilot injection strategy, (b) split injection strategy, and (c) post injection strategy.
Energies 14 03087 g006
Figure 7. Second injection hydraulic delay versus dwell time, for different dwell times when using the multiple injection strategies: (a) pilot injection strategy, (b) split injection strategy, and (c) post-injection strategy.
Energies 14 03087 g007
Figure 8. (a) Evolution of the second injected fuel mass versus dwell time when utilizing the pilot injection strategy. (b) The value of second injected fuel mass have been normalized by the corresponding value of injected fuel mass in the single injection.
Energies 14 03087 g008
Figure 9. (a) Evolution of the second injected fuel mass versus dwell time when using the split injection strategy. (b) The value of second injected fuel mass were normalized by the corresponding value of injected fuel mass in the single injection.
Energies 14 03087 g009
Figure 10. (a) Evolution of the second injected fuel mass versus dwell time when using the post-injection strategy. (b) The value of second injected fuel mass were normalized by the corresponding value of injected fuel mass in the single injection.
Energies 14 03087 g010
Table 1. Operating conditions used in the experiments.
ParameterValue
p r a i l 80 , 100 , 120 [MPa]
p b a c k 5 [MPa]
Pilot injection strategyPilot injection: p r a i l = 80 MPa: 1.473 ms; p r a i l = 100 MPa: 1.227 ms; p r a i l = 120 MPa: 1.084 ms.
Dwell time: From 0.55 up to 2.0 ms.
Main injection: p r a i l = 80 MPa: 2.601 ms; p r a i l = 100 MPa: 2.177 ms; p r a i l = 120 MPa: 1.911 ms.
Injected fuel mass: 40 mg + 70 mg .
Split injection strategyFirst injection: p r a i l = 80 MPa: 2.037 ms; p r a i l = 100 MPa: 1.702 ms; p r a i l = 120 MPa: 1.497 ms.
Dwell time: From 0.55 up to 2.0 ms.
Second injection: p r a i l = 80 MPa: 2.037 ms; p r a i l = 100 MPa: 1.702 ms; P r a i l = 120 MPa: 1.497 ms.
Injected fuel mass: 55 mg + 55 mg .
Post injection strategyMain injection: p r a i l = 80 MPa: 2.601 ms; p r a i l = 100 MPa: 2.177 ms; p r a i l = 120 MPa: 1.911 ms.
Dwell time: From 0.55 up to 2.0 ms
Post injection: p r a i l = 80 MPa: 1.473 ms; p r a i l = 100 MPa: 1.227 ms; p r a i l = 120 MPa: 1.084 ms.
Injected fuel mass: 70 mg + 40 mg .
Publisher’s Note: MDPI stays neutral with regard to jurisdictional claims in published maps and institutional affiliations.

