Abstract
Air conditioning systems have become essential equipment in many buildings. However, fire safety design and management in buildings rarely consider whether to turn the system off or keep it on in a fire. This study ignites a stack of wood in a room center or corner to explore the influence of air inlet actions of a fan coil unit (FCU) with the door opened or closed. Simulation results using Fire Dynamics Simulator (FDS) demonstrate that the heat release rate (HRR) and room temperature obviously decrease when the room doorway is closed, regardless of whether the air conditioner is turned on. The air supply for combustion is poor. When the door of the room is opened, turning off the air conditioner can effectively reduce the HRR and the room temperature in the early stages of fire growth. However, along with the fire growth, turning on air conditioning can help decrease the heat radiation feedback and the consequent HRR. Therefore, the conclusion that air conditioning always enhances a fire because it provides oxygen may not always be correct.
Keywords:
fan coil unit (FCU); air conditioning; ventilation; FDS; flashover; ceiling jet; compartment fire; fire growth 1. Introduction
Air conditioning systems have become essential equipment in many buildings. Many previous works have explored the effects of indoor vents on thermal comfort, such as their types and locations [1,2,3], their size [4,5] and distribution (temperature, wind speed) [2,3,6,7,8,9,10] of airflow. Minimizing energy consumption is also an important issue [2,11,12]. However, good ventilation strategies for air conditioning systems may result in faster fire growth rate in a fire [13]. Research on fire safety design and management in buildings rarely addresses the influence of air conditioning systems on fire growth. Therefore, it is necessary for a good air conditioning system to consider fire safety.
Ventilation definitely affects air and smoke movement in a fire compartment. This work consequently examines the impact of ventilation in a fire room, i.e., turning the system on or off and opening or closing the door.
2. Literature Review
2.1. The Air Conditioning Design
A central air conditioning system in buildings exchanges heat among air, water, and refrigerants. The chilled water is carried to the terminal device via the water supply system, which includes the fan coil unit (FCU) and air handling unit (AHU). This study focuses on the FCU system, the commonly installed systems in small and medium-sized rooms of buildings in Taiwan. The FCU system simply circulates indoor air, and usually comprises a return air outlet and an air inlet. The return air outlet uses natural ventilation and the air inlet utilizes mechanical ventilation [14]. To make best use of the indoor air circulation, the cool air inlet and hot air outlet are normally installed on the ceiling in a central air conditioning system. Additionally, to avoid the short-circuit phenomenon of chilled air, air conditioning designers always ensure that the distance between the air inlets and the return air outlets exceeds 2 m.
The Standards for Classification of Nursing Organizations [15] in Taiwan specifies that power switch interlocking devices with fire detectors should be installed on building air conditioning equipment to automatically cut off the air conditioning function when fire is detected. This change of regulation resulted from a fire at a nursing home institution in Bei-Men Hospital in Taiwan on 23 October 2012, which caused 13 deaths and 59 injuries [16]. However, the regulation only applies to nursing organizations, and not ordinary buildings. Nevertheless, whether to shut down an air conditioning system needs further exploration.
2.2. The Influence of Ventilation Changes on Fire Growth
Fire engineers evaluate the life safety risk to occupants with respect to the fire conditions that could develop within a room based on the performance design of buildings. Many factors, including ventilation changes, affect fire growth in confined spaces. Ventilation changes play two conflicting roles on fire growth [17]: raising the air entrainment, and increasing the amount of smoke exiting the fire compartment. The former enhances the combustion efficiency, while the latter lowers the heat feedback to the fuel and consequent mass loss rate. Whether the fire growth is enhanced or suppressed depends on which factor plays the main role. To further understand fire growth in confined spaces affected by ventilation, many previous studies have investigated the heat release rate (HRR) of fire sources [18,19,20,21,22,23,24,25], the fuel mass loss rate [19,26,27,28], the burning rate [13,17,29], the temperature [13,18,22,23,25,28,29,30,31,32] and visibility [30,32] of the confined space, the thickness of the hot smoke layer [19,25,27,31], the heat fluxes on the floor [28] and the time to flashover (tfo) [18,32]. A complete description of these studies can be found in Wang and Tsai [32].
Researchers classify ventilation in confined spaces as natural ventilation or mechanical ventilation. Few studies have examined both types in combination. Table 1 shows studies on natural or mechanical ventilation related to the influence of ventilation changes on fire growth. However, natural ventilation (such as doors or windows) and mechanical ventilation (such as air conditioning) often coexist in modern building rooms. The effects of both natural and mechanical ventilation on fire growth must be addressed.

Table 1.
Studies related to the effect of natural or mechanical ventilation changes on fire growth.
Su et al. [31] utilized the Fire Dynamics Simulator (FDS) to analyze the position of air inlet and air exhaust in small vestibules of high-rise buildings. In their fire simulation scenario, the front door and rear door of the confined space were open, and the smoke exhaust and air supply rates were both 4.0 m3/s in the confined space. Their experimental results indicated that smoke exhaust vents and the air inlet positions could cause smoke and heat to move from the vestibule into the stairway. The design concept should aim to exhaust smoke and provide fresh air in the opposite direction of evacuation to avoid smoke moving into the stairway. Additionally, Wu [33] and Hu et al. [34] investigated the effects of an air curtain at the entrance of a platform staircase in the metro and in a corridor, respectively. Wu [31] noticed that the smoke was blocked at the entrance of the platform staircase in the metro due to the air curtain. Hu et al. [34] realized that a dilution effect was significant in the downstream when a downward-blown air curtain was applied in a corridor. The local temperature was additionally reduced. Nonetheless, smoke did gather in the upstream area.
Wang and Tsai [32] explored the effect of a change of ventilation position on fire growth under three rooms. The fire simulation scenario was that the door of the confined space was open, and the air supply rate was set as 0.5 m/s in the confined space. Their analysis indicated that the air inlet and outlet positions affect the smoke movement, doorway temperature and time to flashover. The air inlet is best installed near the door opening because the downward cold air can cool the hot smoke moving out from the door. The air outlet, when positioned far from the door, efficiently enables the smoke to exit from the outlets, while when positioned near the doorway, it exhausts some fresh air. Moreover, the air outlet position affected the time to flashover more significantly than the air inlet position. The air outlet immediately exhausts the smoke; however, the air inlet takes some time to push the accumulated smoke to the air outlet and subsequently reduced the smoke layer thickness. Wang and Tsai [32] only considered the effect of air inlet/outlet positions on smoky air movement in a confined space with an opened door. Furthermore, the HRR was fixed in their scenario. The effect of inlet/outlet positions can consequently be particularly evaluated without considering the influence of heat feedback and air entrainment on fuel mass loss rate. This study follows from their work of exploring the impact of ventilation on fire growth by investigating whether to turn off the air conditioning (fan coil unit, FCU) or leave it turned on when a fire alarm alerts. Moreover, to explore the effect of heat feedback and air entrainment on the fuel burning rate, the HRR is variable in this work.
3. Numerical Investigation
Because previous studies have measured the impact of ventilation changes on fire growth (Section 2), this study examines the effect of the air inlet actions of a FCU with the door opened or closed on the HRR, room temperature and time to flashover. Conducting full-scale fire experiments on an FCU system is time-consuming and expensive. Thus, this study applied a Computational Fluid Dynamics (CFD) software application, Fire Dynamics Simulator, which can simulate the hydrodynamics and turbulence, species & combustion, HVAC and radiation [35].
3.1. Setting of Grid Parameters
The FDS grid design must address both the accuracy and efficiency of the simulation. The grid size at the highest HRR was calculated based on a fire source characteristic diameter. According to Baum’s Equation (1), the accuracy of the grid was controlled for less than 12.6 cm. The fire-state simulation was consequently run with a grid size of 10 cm [36].
3.2. Description of Fire Scenario
Two rooms with identical area (14.4 m2) and height (2.4 m), but with different floor shapes (square and oblong) were adopted to understand the fire risk in a commonly seen room with a ventilation system. The dimensions of the rooms were 3.8 m (L) × 3.8 m (W) and 4.8 m (L) × 3.0 m (W). The dimensions of the door were 0.9 m (W) × 2.0 m (H), and the walls of the rooms were made of concrete with a thickness of 0.1 m. Figure 1 displays the fire room dimension and domain models for the simulation. The room domain included two parts: the fire compartments and another space for evaluating the outside air impact. The distance from the door to domain boundary was 2.0–2.2 m.
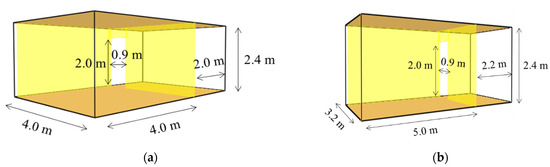
Figure 1.
The dimensions of fire compartments and domain models: (a) square room; (b) oblong room.
The typical sizes of both the air inlets and return air outlets were 0.6 m (W) × 0.6 m (L). The distance from each air inlet/outlet to nearby wall was 0.6 m. Figure 2 shows the location of the air inlets and return air outlets on the ceiling. The arrangement of the inlet and outlet followed Wang and Tsai [32], who revealed that the best arrangement for fire safety is to install the air inlet near the door and the return air outlet far from the door on the ceiling.
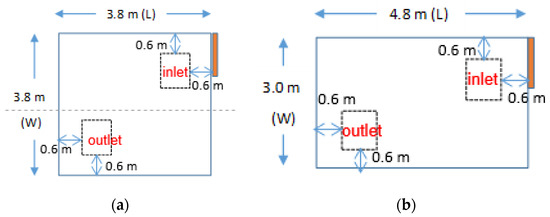
Figure 2.
The location of air inlets and return air outlets on the ceiling. (a) square room, (b) rectangular room.
The two actions of the air inlet were set as “turn on an FCU”, and “turn off an FCU”. Thus, this work explored 16 different cases of corresponding air inlet actions of an FCU with the door opened or closed and with a fire in the center or corner of the room. The other set-up conditions for all simulations followed Wang and Tsai [32], and were as follows:
- The initial room temperature and the inlet air temperature of an FCU system were 25 °C;
- According to the Air Conditioning System Management and Energy Saving Manual [14], the unit air volume of the FCU system for the room dimension was 400 CFM (cubic feet per minute), equivalent to 680 CMH (cubic meters per hour). The air supply was set as 0.5 m/s;
- The actions of the air inlet were set as “turn on an FCU” and “turn off an FCU”, the status of the door was set as opened or closed;
- Morgan [37] recommends an HRR per unit area of 225 kW/m2 for offices with air conditioning systems. This investigation had a room floor area of approximately 14.4 m2 and thus set a free-burning wood to reach about 2 MW in open space. The size of the initial ignition was 0.1 m (L) × 0.1 m (W). Figure 3 presents the arrangement of the wood pile. The wood sticks were divided into 0.9 m (L) × 0.1 m (W) × 0.1 m (H) and 0.7 m (L) × 0.1 m (W) × 0.1 m (H) and overlap each other. The HRR per unit area of wood was 4500 kW/m2. Related material information of wood was from Drysdale [38], and related combustion reaction data were from Tewarson [39]. The fire source was set in the center (most common fire scenario) or corner (worst fire scenario) of the room;
 Figure 3. The arrangement of the wood pile and the location of initial ignition.
 - A stack of wood fire occurred within 900 s of simulation time (s);
- The version of FDS used in this study was FDS 6.0.1.
The main parameters addressed in this investigation are (i) the HRR and the room temperature and (ii) the onset of flashover in the room. The HRR and the initial temperature can help analyze the environment for evacuees to escape from the fire compartment. The parameter in (ii) is an indicator for evaluating the fire severity, because flashover causes serious casualties. The occurrence of flashover consequently needs to be prevented. Quantitative indicators of flashover are a floor heat flux of 20 kW/m2 and a ceiling temperature of 600 °C [40]. Because the rooms were small in this work, the fire source strongly affected the floor heat flux. The flashover criterion used in this study was ceiling temperature. Figure 4 illustrates the measured positions.
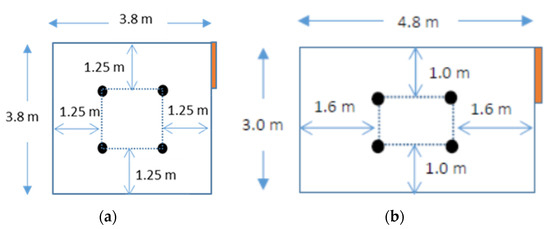
Figure 4.
The measured positions of temperature at 0.1 m height from the ceiling. (a) square room, (b) rectangular room.
4. Results and Discussion
After a fire occurs, smoke is generated, lifts due to buoyancy, reaches the ceiling, spreads horizontally, reaches the wall and accumulates under the ceiling. This study investigated whether changes in FCU action can affect fire growth with the air inlet and the door on or off. The dimensions of the door and the air inlet were 0.9 m (W) × 2.0 m (H) and 0.6 m (W) × 0.6 m (L), respectively. Therefore, the door provided the main air supply for combustion in this study.
4.1. Influence of Air Inlet Actions of an FCU with an Opened Door
The actions of the air inlet were set as turning on or turning off an FCU, namely the “FCU on”, and “FCU off” modes, respectively. The velocity of the air inlet was fixed as 0.5 m/s in this investigation.
4.1.1. Fire Source in the Room Center
Figure 5 presents the HRR in enclosures with an opened door and with different actions of the air inlet when the fire was in the “square” room center. The trend of the HRR history in the oblong room was similar (not shown). The “FCU off” mode generally had a higher HRR than the “FCU on” mode, although the HRR of the “FCU on” mode was higher in the initial period (within 150 s). Figure 6a–c displays the air flow from the air inlet at 10 s, 30 s and 120 s for the “FCU on” mode, respectively, while Figure 6d–f display the same for the “FCU off” mode. For the “FCU on” mode, the air inlet released downward air from the ceiling to the fire source. Clearly, the air and smoke movement were more complicated when the FCU was on. Figure 7 illustrates the average temperature (four readings in Figure 4) below the ceiling with the center fire. The temperature below the ceiling before 150 s was higher when the FCU was on than when the FCU was off. This temperature increase when the FCU was on was consistent with Hu et al. [34] when a downstream-blown air flow was applied.
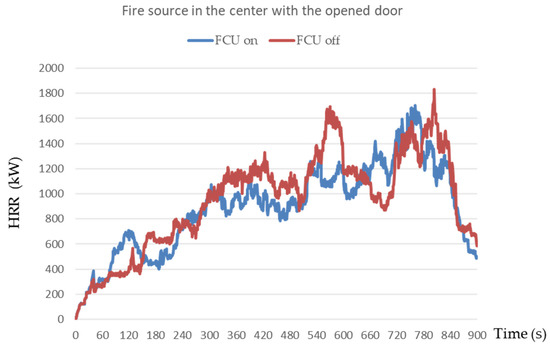
Figure 5.
The HRR for different actions of the air inlet with the fire in the center of the square room.
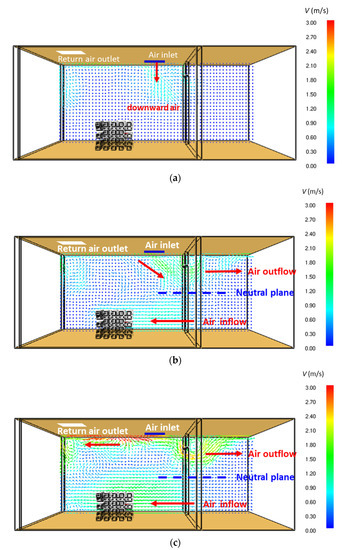
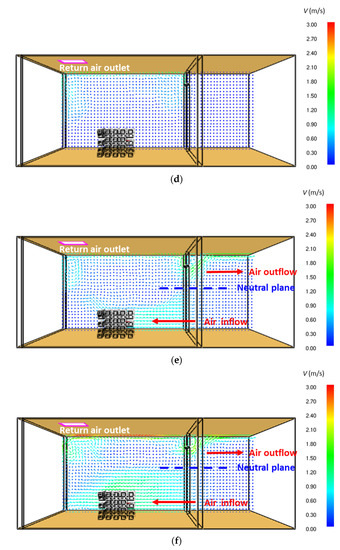
Figure 6.
Airflow vector slice for two modes in the square room: (a) at 10 s for the “FCU on” mode; (b) at 30 s for the “FCU on” mode; (c) at 120 s for the “FCU on” mode; (d) at 10 s for the “FCU off” mode; (e) at 30 s for the “FCU off” mode, (f) at 120 s for the “FCU off” mode.
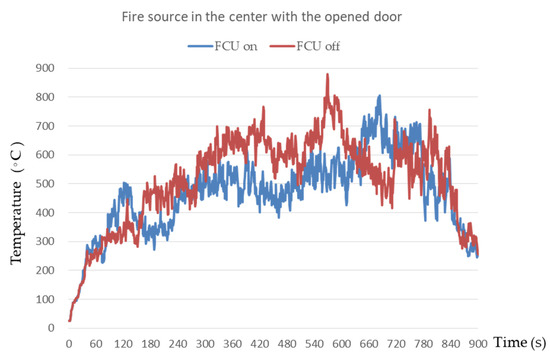
Figure 7.
The average temperature for different actions of the air inlet with the fire in the center of the square room.
The smoke level was low in the early stage. The smoke movement under the ceiling was driven mainly by ceiling jets. As the fire continued growing, more smoke was generated by the fire and accumulated on the ceiling of the confined space. The ceiling jet velocity of a fire source rose with the HRR of a fire, which can be derived according to Alpert’s correlation [41]. The ceiling jet velocity reached 0.95 m/s at the inlet position for a 230 kW fire at 30 s; the velocity of the air inlet was fixed at 0.5 m/s in this study. The downward mechanical ventilation air flow helped provide air to the fire compartment, cool the hot smoke, push the hot smoke flow out of the doorway, and push the smoke inwards to the return air outlet. Outside air was entrained below the neutral plane of the doorway for combustion when the smoke quickly flowed out above it, as shown in Figure 6a–c. The downward ventilation flow consequently resulted in six contradictory effects on the fire: (i) providing extra air to the fire; (ii) cooling the smoke layer; (iii) pushing smoke away from the doorway; (iv) pushing smoke to the inner fire compartment; (v) pushing smoke to exit through the return air outlet, and (vi) entraining air into the compartment. Effects (i), (iv) and (vi) enhanced combustion, while (ii), (iii) and (v) generally suppressed the fire. Moreover, the pushing of smoke away from the doorway (effect (iii)) resulted in the air entrainment into the compartment (effect (vi)). Clearly, Figure 6a–f demonstrates that the downward ventilation flow can still be sufficiently strong to push some smoke to stay inside the fire compartment. This observation is consistent with Wu [33], who noticed a smoke blockage effect. Additionally, Figure 6c–f reveals the air entrainment from the outside was strong with the “FCU on” mode. Although the smoke movement exiting from the doorway was also strong, the smoke volume did not change much because the smoke layer thickness was determined by the lintel height. Therefore, the air entrainment effect directly from the downward air and from the outside air was stronger than the cooling and smoke removal effects during the early stage, due to the small volume of smoke. The remaining smoke radiated the fuel, and the entrained air enhanced combustion, increasing the fuel mass loss rate and consequent HRR.
The two fires in Figure 5 grew gradually, with increasing smoke generation, and both achieved flashover. Figure 8 depicts the temperature distribution of the two modes at 180 s, 240 s and 300 s, respectively. Clearly, the temperature of the smoke accumulated on the ceiling was higher in the “FCU off” mode than in the “FCU on” mode. The mechanical ventilation air cooled the smoke, and the temperature difference exceeded 100 °C for most of the burning period after 150 s. The ventilation air also diluted the smoky layer and consequently decreased the sootiness of the smoke layer. Hu et al. [34] noticed similar dilution and temperature reduction effects. Figure 9 illustrates the outward smoke flow velocity at 0.2 m below the door lintel. Much smoke exited via the doorway when the FCU was on before 300 s. According to Equation (2), the smoke layer volume depended on the quantities of smoke generated by the fire, smoke exiting from the doorway, smoke exiting from the return air outlet and the ventilation flow from the air inlet. (The ventilation flow existed only when the FCU was on.) The volume of the smoke layer can be simplified as the multiplication of room area and lintel height, and thus does not change much. The velocity of the returned outlet was analyzed and did not change much whether in “FCU on” or “FCU off” modes (not shown). Therefore, much more smoke was generated when the FCU was off than in the “FCU on” mode. Conclusively, the mechanical ventilation flow cooled and diluted the smoke layer, decreasing the temperature and the sootiness. The “FCU on” mode consequently radiated less heat [32] to the fuel and achieved lower HRR and longer time to flashover (644 s), while the time to flashover in the “FCU off” mode was 520 s.
where
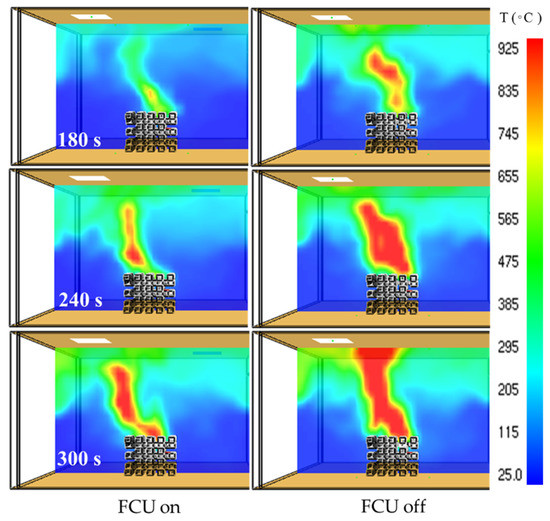
Figure 8.
Temperature distribution slices of smoke layer at 180 s, 240 s and 300 s for the two modes in the square room.
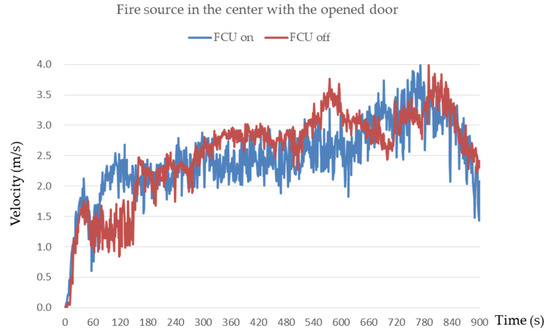
Figure 9.
The outward smoke flow velocity at 0.2 m below the door lintel.
- VSL denotes the volume of smoke layer,
- VS is the volume of smoke generated,
- VD is the volume of smoke exiting from the doorway,
- VO is the volume of smoke exiting from the return air outlet, and
- VI represents the volume of air inlet from the mechanical ventilation.
4.1.2. Fire Source in the Room Corner
Figure 10 presents the HRR in enclosures with different air inlet modes and an opened doorway when the fire was in the room corner. The HRR history in the oblong room was similar (not shown). Comparing the HRR in Figure 5 and Figure 10, the “corner” fires generated less heat than the “center” fires before 300 s. The fire source in the room corner was far from the main air supply of the doorway and the FCU. Poor air supply resulted in less efficient combustion. Additionally, the “corner” fires generated less radiative feedback than the “center” fires, because the fuel of the corner case was below the corner of the smoky soot layer, while the fuel of the center case was below the center of the smoke layer. The configuration factor to determine the radiation was higher with the “center” case than that with the “corner” case [36]. Furthermore, the corner fire HRR with the “FCU on” mode was slightly higher than that with the “FCU off” mode before approximately 310 s. The corner scenario followed the same trend as the center scenario, but had a weaker ventilation effect (FCU). Additionally, Figure 11 demonstrates that the smoke was easily exhausted through the return air outlet because the outlet was close to the fire. Air supply from the air inlet and doorway consequently had a slight influence on the “corner” fires, whether the FCU was on or off. This statement was consistent with Wang and Tsai [32], demonstrating that the air outlet position has a larger effect on flashover than the air inlet position in corner fire cases. The air outlet immediately exhausts the smoke. However, the order of the HRR of the fires differed after 310 s. The generated smoke was exhausted by the returned outlet, and the smoke volume on the ceiling decreased. Moreover, the smoke layer was definitely cooled and diluted by the mechanical ventilation with the “FCU on” mode with the center fire case. However, cooling and dilution effects on the decrease of temperature and sootiness were not significant for calculating the radiative heat flux, because the fuel was in the corner and the configuration factor was small, as shown in Figure 12. Consequently, the HRR was slightly higher in the “FCU off” mode than in the “FCU on” mode.
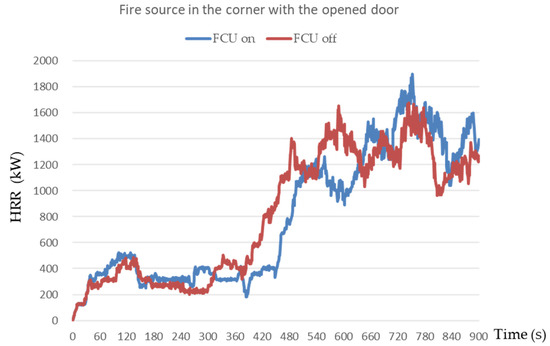
Figure 10.
The HRR for different actions of the air inlet with the fire in the corner of the square room.
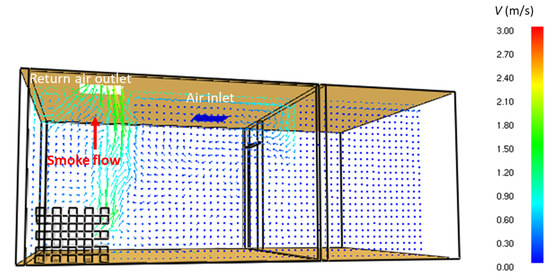
Figure 11.
Airflow vector slice at 30 s for the “FCU on” mode in the square room.
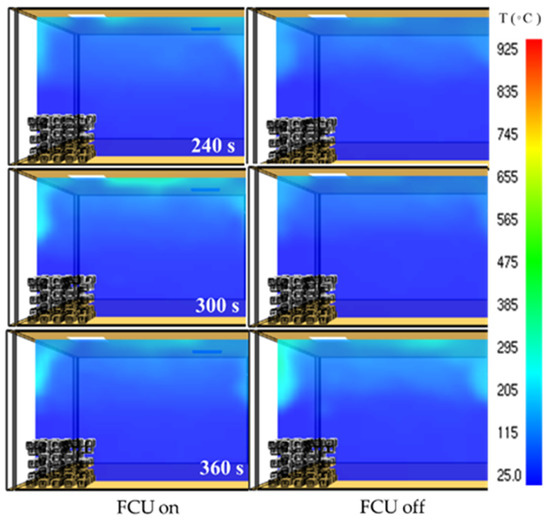
Figure 12.
Temperature distribution slices of smoke layer at 240 s, 300 s and 360 s for the two modes in the square room.
4.2. Influence of Air Inlet Actions of an FCU with a Closed Door
When the door of the room was closed, the air supply for combustion mainly came from the mechanical ventilation in the room. Figure 13 illustrates the HRR of the two modes when the fire was in the square room center. The HRR of the two modes obviously decreased when the door was closed. The fire only survived for approximately 200 s with the “FCU off” mode, but lasted longer in the “FCU on” mode because the FCU provided oxygen. Further, the HRR histories of the two modes when the fire was in the room corner were similar (not shown). Moreover, the findings in the oblong room were almost the same as those in the square room.

Figure 13.
The HRR for different actions of the air inlet with the fire in the center of the square room.
Therefore, closing the door of a burning room is very effective in suppressing a fire, even when the ventilation (FCU) is still switched on (see Figure 14). However, backdraft needs to be prevented in this fuel-rich condition.
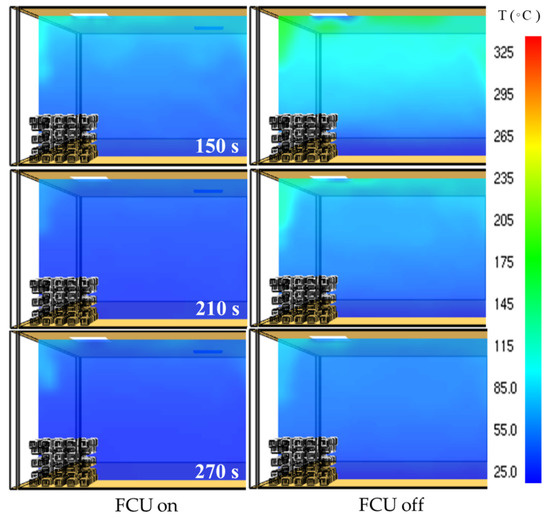
Figure 14.
Temperature distribution slices of smoke layer at 150 s, 210 s and 270 s for the two modes in the square room.
4.3. To Turn on or Turn off the FCU in a Fire
As discussed in Section 4.1, the downward ventilation flow with the “FCU on” mode can cause six contradictory effects on fire. Whether the fire growth is enhanced or suppressed depends on which effect plays the primary role. This investigation demonstrates two stages of FCU influence. In the early stage of fire, little volume of smoke is generated. The “FCU on” mode enhances the fire in the early stage of fire but later suppresses the fire because of the cooling and the smoke layer dilution [34]. Therefore, the conclusion that the air conditioning can always enhance a fire because it provides oxygen may not be correct.
5. Conclusions
This study evaluates whether to turn off or leave on air conditioning with the door opened or closed on fire growth. The following conclusions are drawn from the simulation results:
- The downward ventilation flow with the “FCU on” mode can cause six contradictory effects on fire: (i) providing extra air to the fire; (ii) cooling the smoke layer; (iii) pushing smoke away from the doorway; (iv) pushing smoke to the inner fire compartment; (v) pushing smoke to exit from the return air outlet, and (vi) entraining air into the compartment. The first, fourth and sixth effects enhanced combustion, while the second, third and fifth ones generally suppressed the fire. Whether the fire growth is enhanced or suppressed depends on which effect plays the primary role;
- Little volume of smoke is generated in the early stages of fire in a room with an open doorway. The downward ventilation flow near the doorway with the “FCU on” mode is sufficiently strong to push some smoke to stay inside the fire compartment. The air entrainment effect directly from the downward air and from the outside air is also stronger than the cooling and smoke removal effects during the early stages. The remaining smoke radiates the fuel and the entrained air enhances combustion, thus raising the fuel mass loss rate and consequent HRR;
- Along with the fire growth, the influence of cooling and diluting the smoke layer by the mechanical ventilation air becomes strong, consequently lowering the temperature and the sootiness of the smoke layer. Therefore, the radiative feedback to the fuel is reduced, decreasing the HRR;
- The effects of confining smoke/entraining air in the early stage of a fire and cooling/diluting smoke in a fully developed fire exist even for a fire in the room corner, but are weaker than for the center fire;
- The HRR is obviously lower when the door is closed than when it is open. The air supply for combustion mainly comes from the indoor air in the confined space, and comes from mechanical ventilation when the doorway of a room is closed. The fire with “FCU on” can survive, but is extinguished in the “FCU off” mode. Therefore, closing the doorway is an effective way to suppress a fire whether the FCU is on or off.
Author Contributions
Conceptualization, methodology, validation, formal analysis, investigation, project administration, T.-Y.W. and K.-C.T.; software, writing—original draft preparation, T.-Y.W.; writing-review & editing, T.-Y.W. and K.-C.T.; supervision, K.-C.T. All authors have read and agreed to the published version of the manuscript.
Funding
This research received no external funding.
Institutional Review Board Statement
Not applicable.
Informed Consent Statement
Not applicable.
Data Availability Statement
Not applicable.
Conflicts of Interest
The authors declare no conflict of interest.
References
- Lian, Z.; Wang, H. Experimental Study of Factors That Affect Thermal Comfort in an Upward-Displacement Air-Conditioned Room. HVAC R Res. 2002, 8, 191–200. [Google Scholar] [CrossRef]
- SeppȨnen, O. Ventilation strategies for good indoor air quality and energy efficiency. Int. J. Vent. 2008, 6, 297–306. [Google Scholar]
- Gao, C.; Lee, W. Optimized design of floor-based air-conditioners for residential use. Build. Environ. 2009, 44, 2080–2088. [Google Scholar] [CrossRef]
- Noh, K.-C.; Jang, J.-S.; Oh, M.-D. Thermal comfort and indoor air quality in the lecture room with 4-way cassette air-conditioner and mixing ventilation system. Build. Environ. 2007, 42, 689–698. [Google Scholar] [CrossRef]
- Noh, K.-C.; Han, C.-W.; Oh, M.-D. Effect of the airflow rate of a ceiling type air-conditioner on ventilation effectiveness in a lecture room. Int. J. Refrig. 2008, 31, 180–188. [Google Scholar] [CrossRef]
- Chow, W.K.; Fung, W. Numerical studies on the indoor air flow in the occupied zone of ventilated and air-conditioned space. Build. Environ. 1996, 31, 319–344. [Google Scholar] [CrossRef]
- Chow, W.K. Numerical studies of airflows induced by mechanical ventilation and air-conditioning (MVAC) systems. Appl. Energy 2001, 68, 135–159. [Google Scholar] [CrossRef]
- Yongson, O.; Badruddin, I.A.; Zainal, Z.; Narayana, P.A. Airflow analysis in an air conditioning room. Build. Environ. 2007, 42, 1531–1537. [Google Scholar] [CrossRef]
- Kavgic, M.; Mumovic, D.; Stevanovic, Z.; Young, A. Analysis of thermal comfort and indoor air quality in a mechanically ventilated theatre. Energy Build. 2008, 40, 1334–1343. [Google Scholar] [CrossRef]
- De Dear, R. The Theory of Thermal Comfort in Naturally Ventilated Indoor Environments—“The Pleasure Principle”. Int. J. Vent. 2009, 8, 243–250. [Google Scholar] [CrossRef]
- Mathews, E.; Botha, C.; Arndt, D.; Malan, A. HVAC control strategies to enhance comfort and minimise energy usage. Energy Build. 2001, 33, 853–863. [Google Scholar] [CrossRef]
- Lin, C.-M.; Liu, H.-Y.; Tseng, K.-Y.; Lin, S.-F. Heating, Ventilation, and Air Conditioning System Optimization Control Strategy Involving Fan Coil Unit Temperature Control. Appl. Sci. 2019, 9, 2391. [Google Scholar] [CrossRef]
- Pretrel, H.; Such, J. Effect of ventilation procedures on the behaviour of a fire compartment scenario. Nucl. Eng. Des. 2005, 235, 2155–2169. [Google Scholar] [CrossRef]
- Taiwan Green Productivity Foundation. Air Conditioning System Management and Energy Saving Manual; Taiwan Green Productivity Foundation: New Taipei City, Taiwan, 2008. [Google Scholar]
- Ministry of Health and Welfare. Standards for Classification of Nursing Organizations; Ministry of Health and Welfare: Taipei City, Taiwan, 2013.
- Wang, T.-Y.; Tsai, K.-C. Investigation Report of Bei-Men Hospital Fire in Taiwan on 23 October 2012. In Proceedings of the 11th Asia-Oceania Symposium on Fire Science and Technology 2019; Springer: Berlin/Heidelberg, Germany, 2019; pp. 857–865. [Google Scholar]
- Feng, R.; Huo, R.; Yu, H.C. Experimental study on the character of oil-pool-fire burning in enclosed space. Fire Sci. Technol. 2005, 24, 288–291. [Google Scholar]
- Song, H.; Yang, L.; Fan, W. Numerical simulation of effect of ventilation on flashover. Fire Saf. Sci. 2001, 10, 167–170. [Google Scholar]
- Parkes, A.; Fleischmann, C. The Impact of Location and Ventilation on Pool Fire in A Compartment. Fire Saf. Sci. 2005, 8, 1289–1300. [Google Scholar] [CrossRef][Green Version]
- Saber, H.H.; Kashef, A. CFD simulations for different fire ventilation scenarios in a room. In Proceedings of the 5th NRC Symposium on Computational Fluid Dynamics and Multi-Scale Modelling, Ottawa, ON, Canada, 21 January 2008. [Google Scholar]
- Saber, H.H.; Kashef, A. CFD Simulations for Fully-Developed Fires in a Room under Different Ventilation Conditions. In Proceedings of the 16th Annual Conference of the CFD Society of Canada, Saskatoon, SK, Canada, 9–11 June 2008. [Google Scholar]
- Merci, B.; Vandevelde, P. Experimental study of natural roof ventilation in full-scale enclosure fire tests in a small compartment. Fire Saf. J. 2007, 42, 523–535. [Google Scholar] [CrossRef]
- Merci, B.; Van Maele, K. Numerical simulations of full-scale enclosure fires in a small compartment with natural roof ventilation. Fire Saf. J. 2008, 43, 495–511. [Google Scholar] [CrossRef]
- Lassus, J.; Courty, L.; Garo, J.; Studer, E.; Jourda, P.; Aine, P. Ventilation effects in confined and mechanically ventilated fires. Int. J. Therm. Sci. 2014, 75, 87–94. [Google Scholar] [CrossRef]
- Gomez, R.S.; Porto, T.R.N.; Magalhães, H.L.F.; Santos, A.C.Q.; Viana, V.H.V.; Gomes, K.C.; Lima, A.G.B. Thermo-Fluid Dynamics Analysis of Fire Smoke Dispersion and Control Strategy in Buildings. Energies 2020, 13, 6000. [Google Scholar] [CrossRef]
- Thomas, I.R.; Bennetts, I. Fires in enclosures with single ventilation openings—Comparison of Long and Wide Enclosures. Fire Saf. Sci. 2000, 6, 941–952. [Google Scholar] [CrossRef]
- Pierce, J.; Moss, J. Smoke production, radiation heat transfer and fire growth in a liquid-fuelled compartment fire. Fire Saf. J. 2007, 42, 310–320. [Google Scholar] [CrossRef]
- Tofilo, P.; Delichatsios, M.; Silcock, G. Effect of Fuel Sootiness on the Heat Fluxes to the Walls in Enclosure Fires. Fire Saf. Sci. 2005, 8, 987–998. [Google Scholar] [CrossRef]
- Kumar∗, R.; Naveen, M. An experimental fire in compartment with dual vent on opposite walls. Combust. Sci. Technol. 2007, 179, 1527–1547. [Google Scholar] [CrossRef]
- Huang, H.S.; Su, C.H.; Li, C.B.; Lin, C.Y.; Lin, C.C. Enhancement of Fire Safety of an Existing Green Building due to Natural Ventilation. Energies 2016, 9, 192. [Google Scholar] [CrossRef]
- Su, C.-H.; Tsai, K.-C.; Xu, M.-Y. Computational analysis on the performance of smoke exhaust systems in small vestibules of high-rise buildings. J. Build. Perform. Simul. 2015, 8, 239–252. [Google Scholar] [CrossRef]
- Wang, T.-Y.; Tsai, K.-C. Effects of air inlet or outlet position of a fan coil unit ventilation system on smoke movement and fire severity. Int. J. Vent. 2021, 20, 103–117. [Google Scholar] [CrossRef]
- Wu, Z.K. Research on Fire Prevention and Smoke Prevention Separation Technology of air Curtain of Open Stairs in Subway Station. Ph.D. Thesis, University of Science and Technology of China, Hefei, China, 2015. [Google Scholar]
- Hu, L.; Zhou, J.; Huo, R.; Peng, W.; Wang, H. Confinement of fire-induced smoke and carbon monoxide transportation by air curtain in channels. J. Hazard. Mater. 2008, 156, 327–334. [Google Scholar] [CrossRef]
- McGrattan, K.; Hostikka, S.; McDermott, R.; Floyd, J.; Weinschenk, C.; Overholt, K. Fire Dynamics Simulator, User’s Guide; NIST Special Publication 1019; National Institute of Standards and Technology, US Department of Commerce: Gaithersburg, MD, USA, 2013.
- Baum, H.; McCaffrey, B. Fire Induced Flow Field—Theory and Experiment. Fire Saf. Sci. 1989, 2, 129–148. [Google Scholar] [CrossRef]
- Morgan, H.P. Smoke Control Methods in Enclosed Shopping Complexes of One or More Storeys: A Design Summary; Building Research Establishment Report; HMSO: London, UK, 1979. [Google Scholar]
- Drysdale, D. An Introduction to Fire Dynamics, 2nd ed.; Wiley: Chichester, UK, 2011. [Google Scholar]
- Tewarson, A. Generation of heat and gaseous, liquid, and solid products in fires, In SFPE Handbook of Fire Protection Engineering, 4th ed.; Di Nenno, P.J., Ed.; National Fire Protection Association: Quincy, MA, USA, 2008; pp. 109–194. [Google Scholar]
- Thomas, P.H. Testing products and materials for their contribution to flashover in rooms. Fire Mater. 1981, 5, 103–111. [Google Scholar] [CrossRef]
- Evans, D.D. Ceiling Jet Flows. SFPE Handbook of Fire Protection Engineering; Society of Fire Protection Engineers: Boston, MA, USA, 1995; pp. 2–32. [Google Scholar]


Publisher’s Note: MDPI stays neutral with regard to jurisdictional claims in published maps and institutional affiliations. |
© 2021 by the authors. Licensee MDPI, Basel, Switzerland. This article is an open access article distributed under the terms and conditions of the Creative Commons Attribution (CC BY) license (https://creativecommons.org/licenses/by/4.0/).