Article

Application of Technological Processes to Create a Unitary Model for Energy Recovery from Municipal Waste

Faculty of Civil Engineering, Environmental and Geodetic Sciences, Koszalin University of Technology Poland, Śniadeckich St. 2, 75-453 Koszalin, Poland
Energies 2021, 14(11), 3118; https://doi.org/10.3390/en14113118
Submission received: 26 April 2021 / Revised: 17 May 2021 / Accepted: 25 May 2021 / Published: 26 May 2021
(This article belongs to the Special Issue Renewable and Sustainable Energy: Current State and Prospects)

Abstract

:
The subject matter of this paper is the functioning of a highly effective waste management system. Assumptions of the Energy Recovery Waste Processing (ERWP) model, being a universal solution for towns and regions irrespective of their population, are presented here. The result of simulations illustrating the energetic potential of municipal waste stored and processed in biological and physicochemical processes are also presented. Calculations were performed for the municipality of Koszalin (Poland), with a population of 106,000. Mixed household and commercial waste, organic waste, waste from selective collection and sewage sludge from a municipal wastewater treatment plant were considered in the waste mass balance. Empirical equations and unit coefficients describing the energetic efficiency of particular processes originating from the author’s own research work as well as from the results available from the scientific literature were used in the calculations. The developed ERWP model is based on the functioning of four objects constituting a comprehensive technical infrastructure, i.e., biological stabilisation in air condition (BSAC), mechanical treatment plant (MTP), cogeneration system plant (CSP) and gas production plant (GPP) where two independent modules operate, namely, dry/wet methane fermentation (DMF and WMF). Each day, this system generates highly energetic refuse-derived fuel (RDF) for combustion in amounts of 82.2 t for CSP and 127.3 t for GPP, generating 5519 m3 of gas/d. The value of the energy contained in such generated gas and in waste making up an alternative fuel is 1027.4 GJ, which is equivalent to 285.4 MWh. It should be noted that the creation of a waste management system based on the ERWP model assumptions fulfills the criteria of energetic recycling and allows for recovery of energy in the form of gas and heat equivalent to 79,917.6 MWh/a, i.e., 754 kWh/inhabitant/a.

Graphical Abstract

1. Introduction

This paper pertains to municipal waste that may have a negative impact on the natural environment and human health [1,2,3]. Waste management is a global problem originating from economic development [4,5,6,7]. Globalisation processes have contributed, through the systematic increase in the interlinkage between various markets and in numerous aspects of economic and social life, to the establishment of a new institutional order, new institutions and legal and economic solutions [8,9]. Such processes also promote increases in outlays on investment projects [10,11], boosting the level of innovation and competitiveness of economies [12,13,14,15,16]. The fact that in the last thirty years an economic convergence has occurred for the majority of countries is indicated in the literature [17,18]. The economic convergence processes contributed to permanent changes in consumers’ attitudes and awareness, particularly in terms of sustainable consumption when considering concerns about energy consumption and the natural environment [19,20,21,22,23]. Energetic transformation embraces the majority of economies, including agriculture, in which use of biocomponents produced from organic waste plays a significant role [24,25]. This means that waste management is equally important for big metropolitan areas and small rural communities [26,27]. An observed trend of the use of waste as a source of valuable raw materials requires development of a functioning waste management model, taking into consideration the possibilities and needs of a given region [28].
In the article, practical and theoretical aspects of the municipal waste elimination for the city of Koszalin based on an effective functioning waste management system will be considered. The main objective of this paper is the presentation of the ERWP model to be used as a complementary waste management system. The effectiveness of a system based on the ERWP model has been discussed in relation to Koszalin city (Poland).
It should be underlined that the volume of waste generated worldwide increases systematically, yet a significant part of it is not covered by the system, thus causing quantifiable losses in the economy and natural environment [29,30]. In 2018 in the European Union, 2538 million t of municipal waste was generated, and 55% was recycled [31]. The remainder was put in landfills, causing their degradation to a variable degree [32]. The absence of proper industrial infrastructure for waste processing, mainly in the eastern EU countries, is still the main reason why 40 ÷ 45% of waste does not go to local waste treatment systems, resulting in wasting of valuable sources of recyclable and energetic materials [33,34]. This results in an increase in costs of economic system functioning that is different depending on the solutions adopted [35]. In Poland, almost 42% of generated municipal waste is directly put into landfills [36].
The ERWP model takes into account a number of conditions, among which the most important ones are: waste type, physicochemical properties, morphological composition and volume. Irrespective of the values of the above parameters, such systems are always based on the application of well-known unit processes, such as: screening, separation, biological treatment, dehydration, thermal transformation and storage. The proper compilation of processes that make up a complementary system depends on the adopted objective that is contingent upon financial and technical possibilities. Such an objective can be, for example, the recovery of valuable waste components within the material or organic or energetic recycling framework [37]. Ultimately, the objective can also be rendering such waste harmless through its storage in controlled conditions. However, taking into account waste composition and its physicochemical properties, this method is economically ineffective and, importantly, has a negative impact on the natural environment [38,39].

2. Potential of Municipal Waste to Energy Production—Review

The introduction indicates the need for the construction of a waste management system for any local government unit. The main task of such a system is to use waste as a source of raw materials including raw materials for energy production. The volume of energy generated from waste depends, first and foremost, on the methods of processing, allowing for the recovery of energy in variable forms, generally in the form of heat generated in the combustion process [40,41]. Waste can be, as a source of energy, a significant element of the local energetic balance [42]. A good example here is the municipality of Copenhagen, which adopted in 2011 a strategy for development until 2025, which will eliminate the use of coal as the energetic raw material [43]. The share of energy generated from municipal waste in Copenhagen’s energetic mix will finally be approximately 40%.
In 2018, 12.5 million t of mixed municipal waste was stored in Poland. Most of the waste, i.e., 9971.2 thousand t, was generated in households, which made up 83% of total generated waste. The remaining part of the waste, i.e., 1997.5 thousand t of household and commercial types, collected from the servicing of municipal infrastructure and entrepreneurs, amounted to 17%. Analysis of the morphological composition of waste delivered to plants using methane-biological processing technology (MBT), based on results of research work performed in 20 plants located in Poland, shows a great potential for broadly understood recovery [44]. Classification of particular waste components in terms of their use leads to distinguishing the following groups: Group No I—recyclable materials (glass, metals, synthetic materials qualified for recycling), Group No II—waste having high energetic value (paper, cardboard, textiles, composites and synthetic materials not qualified for recycling, as well as wood), Group No III—biodegradable waste (BIO1, BIO2, BIO3) and Group No IV—waste classified as useless or dangerous. Percentage shares of particular waste components in mixed waste as well as in fractions separated with an 80–90 mm mesh screen, as average values obtained from research work performed in various plants in Poland, are shown in Table 1.
Waste possessing values of recyclable materials (Group No I) recovered for mixed waste during the manual separation process can be obtained, as a rule, exclusively from the oversize fraction separated in, e.g., rotary drum sifters featuring mesh not less than 8 cm; the total content is 37.2%. A method of using Group No II, defined as RDF, considering its high calorific value of 18–24 MJ/kg, is combustion [44]. The application of screening and mechanical separation of mixed waste resulting in energetic raw material in RDF form allows, in the extreme case, for an increase in the calorific value from 8.4 to 25.0 MJ/kg [45]. A calorific value exceeding 11 MJ/kg guarantees, in principle, energetic efficiency of combustion or gasification exceeding 65%, which allows for classification of the process as energy recovery [46]. According to the International Energy Agency, the calorific value of waste to be used in combustion processes should not be, for process profitability, below 7942 kJ/kg [47]. In Germany, one of the biggest EU economies, the volume of RDF separated in MTP installations increased from 31% in 2006 [48] to 34.2% in 2017 [49]. A significant criterion for the application of the available techniques of thermal transformation of mixed municipal waste is relatively high humidity, which reduces their calorific value. The use of more advanced techniques such as, for example, pyrolysis or gasification, requires higher calorific value of waste; this is associated with a necessity to apply proper methods of batch preparation [50,51]. Unfortunately, pyrolytic installations of an industrial scale used for waste processing are unreliable, which has been proved by plants closing shortly after being put into operation. For example, THERMOSEL 2002 (opened)/2006 (closed), DBA 2001/2010, EDDITH 2002/2009 and Schwel-Brenn 1997/2000 [52,53].
Group No III comprises biodegradable waste, i.e., waste that can be subjected to biological gasification in the methane fermentation process. During decomposition of organic matter under controlled anaerobic conditions, biogas is generated, which contains flammable components, including methane. The share of biogas production in European Union countries makes up 136.6 million tons of oil equivalent [54]. The content of methane, depending on the raw material, is 50–75% and the calorific value is, on average, 22 MJ/m3 [55,56]. In the case of the organic fraction separated from municipal waste, the yield of biogas volume in the plants that use the methane fermentation process in low hydration conditions (DFI) reaches 339 m3 CH4/Mg organic matter [57]. A possibility to generate biogas, resulting in a reduction in waste processing costs will be, in future, the primary factor deciding the selection of this biological waste processing method. Waste that is also suitable for the methane transformation process is sewage sludge (SS), originating from municipal wastewater treatment plants. In 2018 in Poland, 640,000 t of dry matter from sewage sludge was generated. This is equivalent to approx. 25 million tons of mechanically dehydrated sludge to 80% humidity on average [36]. The volume of methane generated during the fermentation process carried out in separate chambers in high-hydration conditions is 0.19–0.24 m3/kg organic matter [58]. The application of the thermal method for the disposal of sewage sludge requires a reduction in its humidity to at least 10%. This means that the consumption of energy for mechanical dehydration, then water evaporation from sludge with an initial humidity of 98%, is very high. Other sorts of waste, which due to their properties may constitute a raw material for energy generating processes in various forms, are generated in populated areas; they comprise, among other things, waste from selective collection, including biowaste, organic waste from green area cultivation and biodegradable waste from production and foodstuff processing as well as flammable packaging waste with low value as recyclable material.
The diversity of municipal waste means that optimisation of the system of energy generation from waste should take into account not just waste fuel properties but also its morphological features. This also means there is a necessity to apply various methods for the preparation of the raw material earmarked for the generation of energy in the form of heat, electricity and gas. Using (i) available techniques and (ii) applying the principle of cooperation between the waste generating and processing entities [59], an ERWP model was developed; it allows for assessment of the volume of energy generated from the processing of amassed waste independently of its volume, type and specific features. Empirical equations describing the impact of selected variables on the volume of generated energy and values of empirical indicators describing energetic efficiency of particular processes, achieved both in industrial plants as well as used in scientific research, were used for setting the energy balance. ERWP reflects the circular economy idea, which promotes the maximum usage of available raw materials in line with a rule that waste becomes a raw material for the next production cycle [60,61].
Waste-to-energy (WtE) plants are an integral part of the circular economy strategy in the treatment of non-recyclable waste. Waste with a high potential for thermal gasification or biogas production is converted into heat and electric energy. The ERWP model takes into account two of the six defined trends of the WtE strategy, i.e., more gasification plants offering commercial-scale operations and a push to use organic waste to replace natural gas [62].

3. Materials and Methods

Organisational and urban structures that are suitable for the creation of comprehensive energy generation systems using various sources, including municipal waste, are big cities and communal special purpose associations. The benefits originating from implementation of waste processing procedures contained in the ERWP model were analysed based on municipal waste produced in the municipality of Koszalin located in the northern part of Poland in the Pomerania region. The simulation was performed for mixed waste, biodegradable waste, waste from selective collection and mechanically dehydrated sewage sludge from the municipal wastewater treatment plant. Based on the structural research results, using the ERWP model assumptions, volumes of waste flowing between particular plants were determined; on these grounds, the volumes of waste for making energetic raw material were fixed. This model allows for comprehensive assessment of the waste economy system’s efficiency, including definition of the waste volume being directed to raw materials recycling or materials recycling. The aspect associated only with the energetic potential of waste processed in the plants that use the combustion and methane fermentation techniques is presented herein.

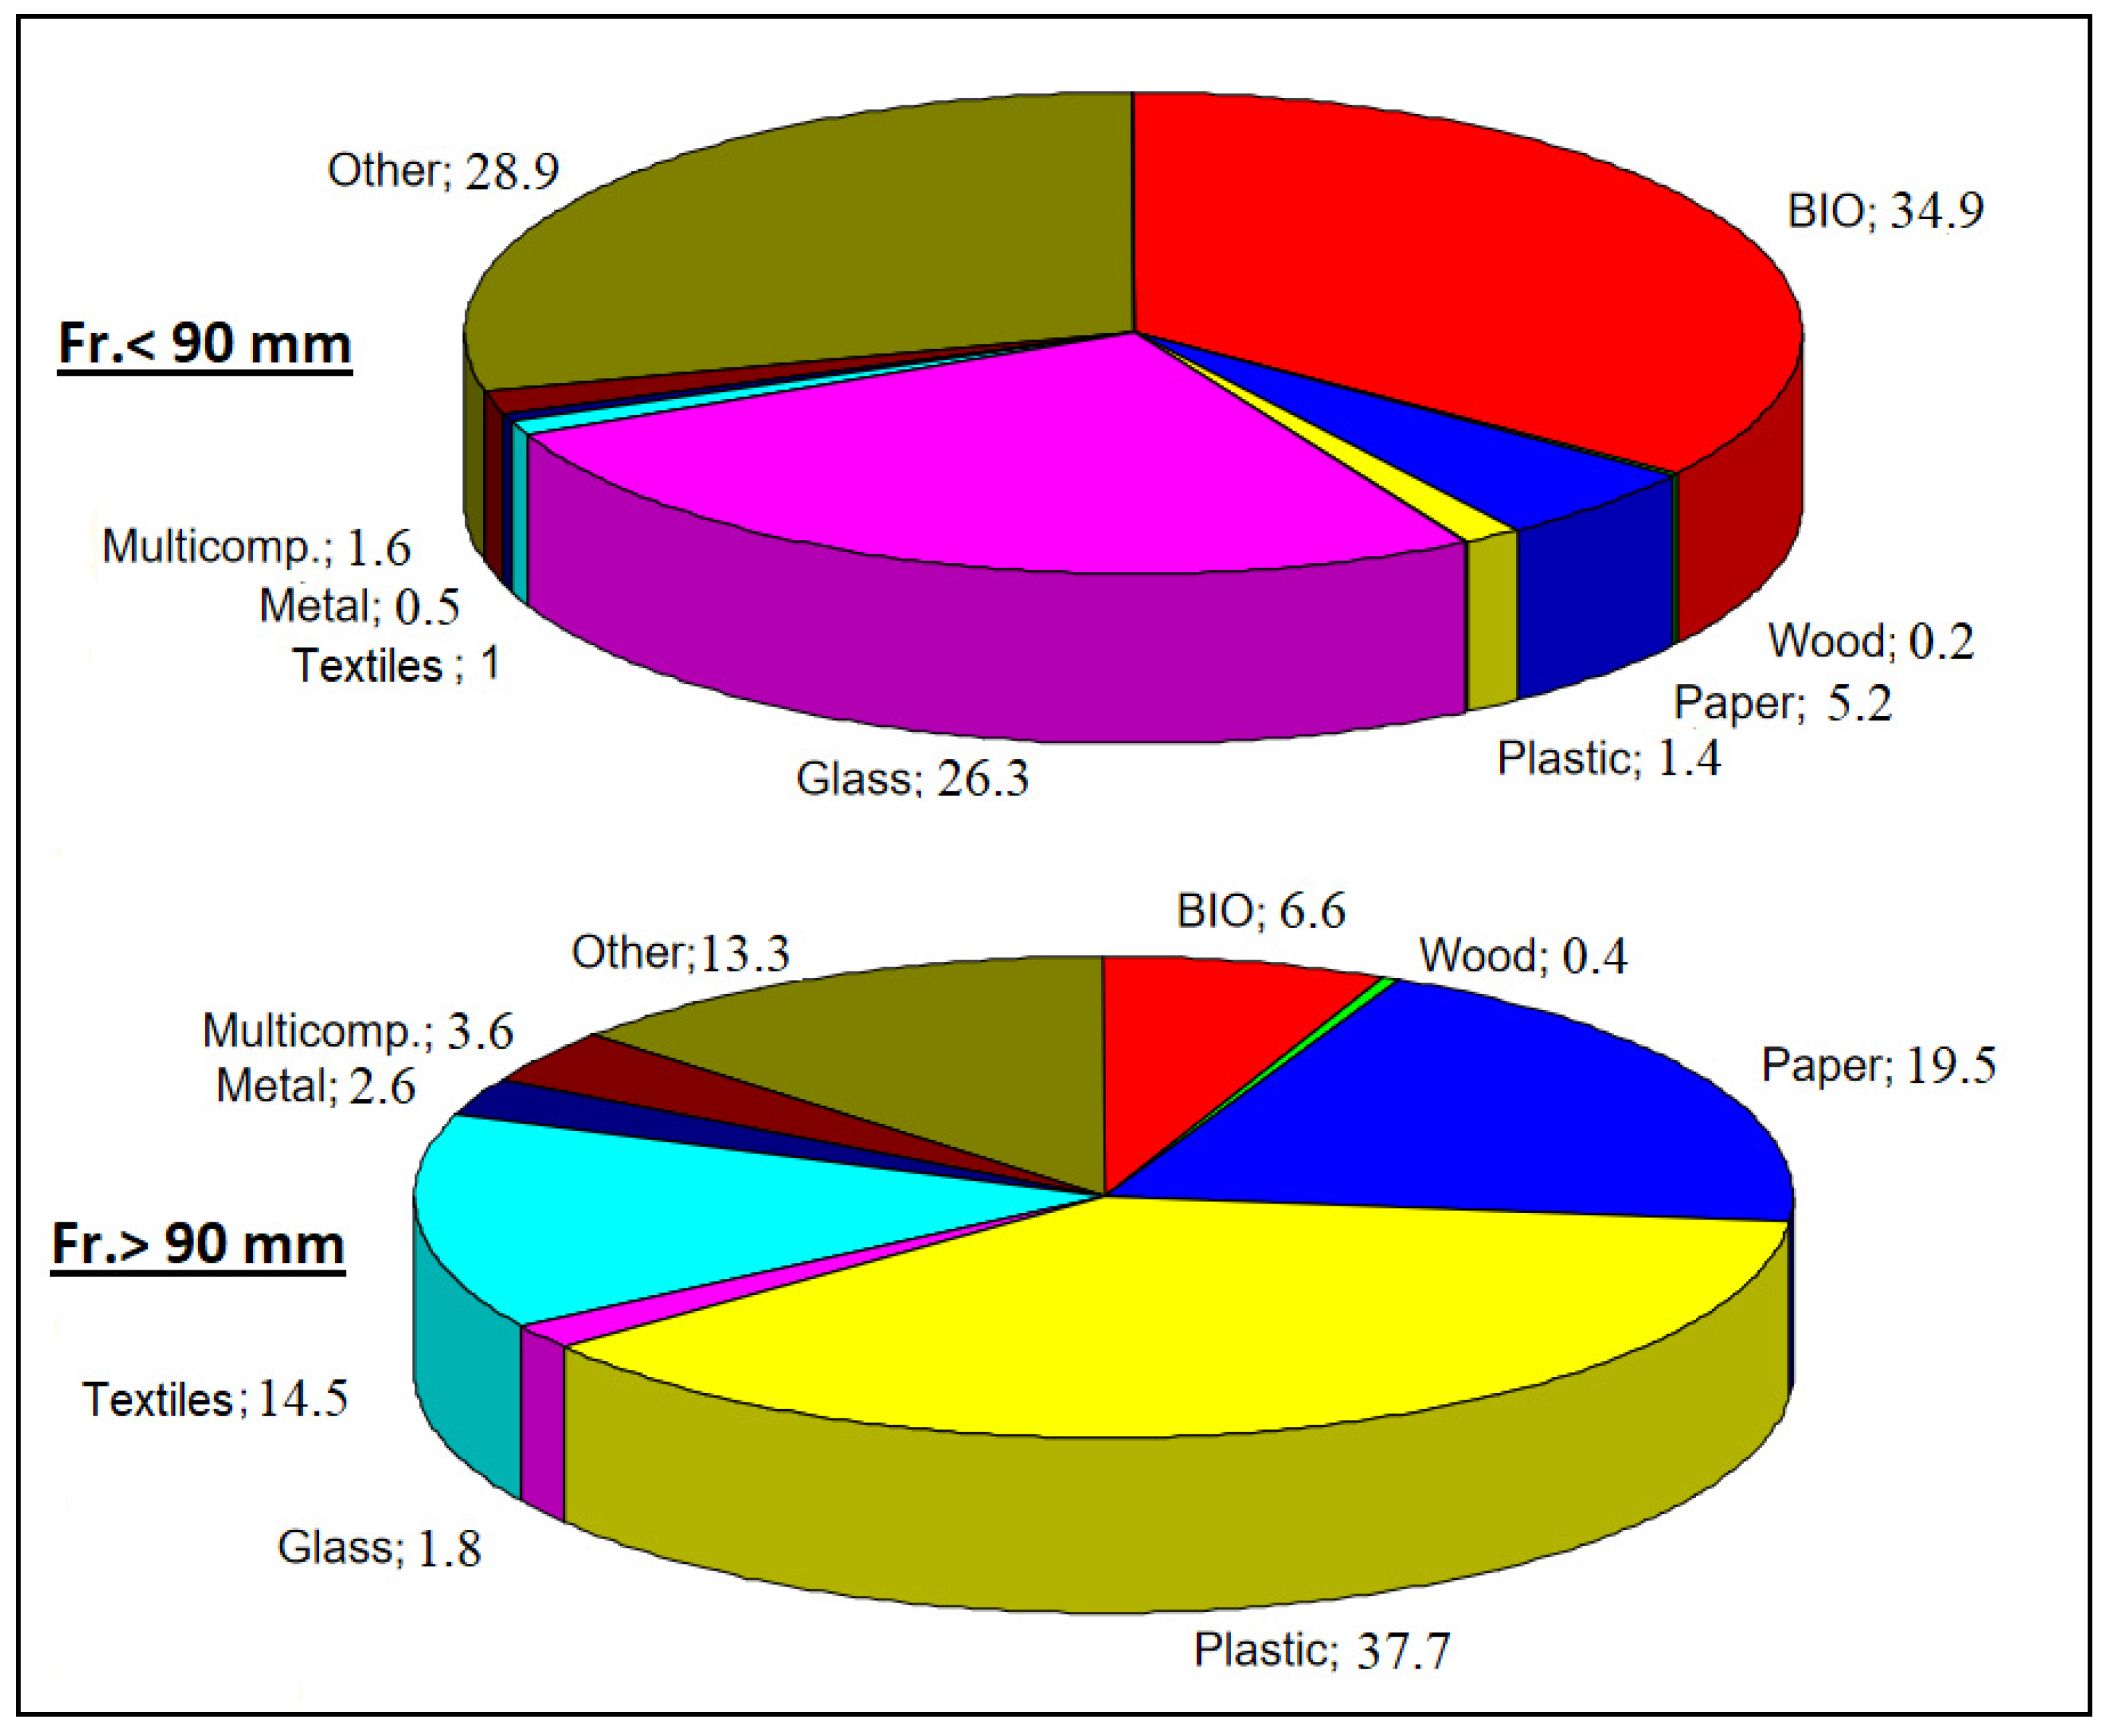
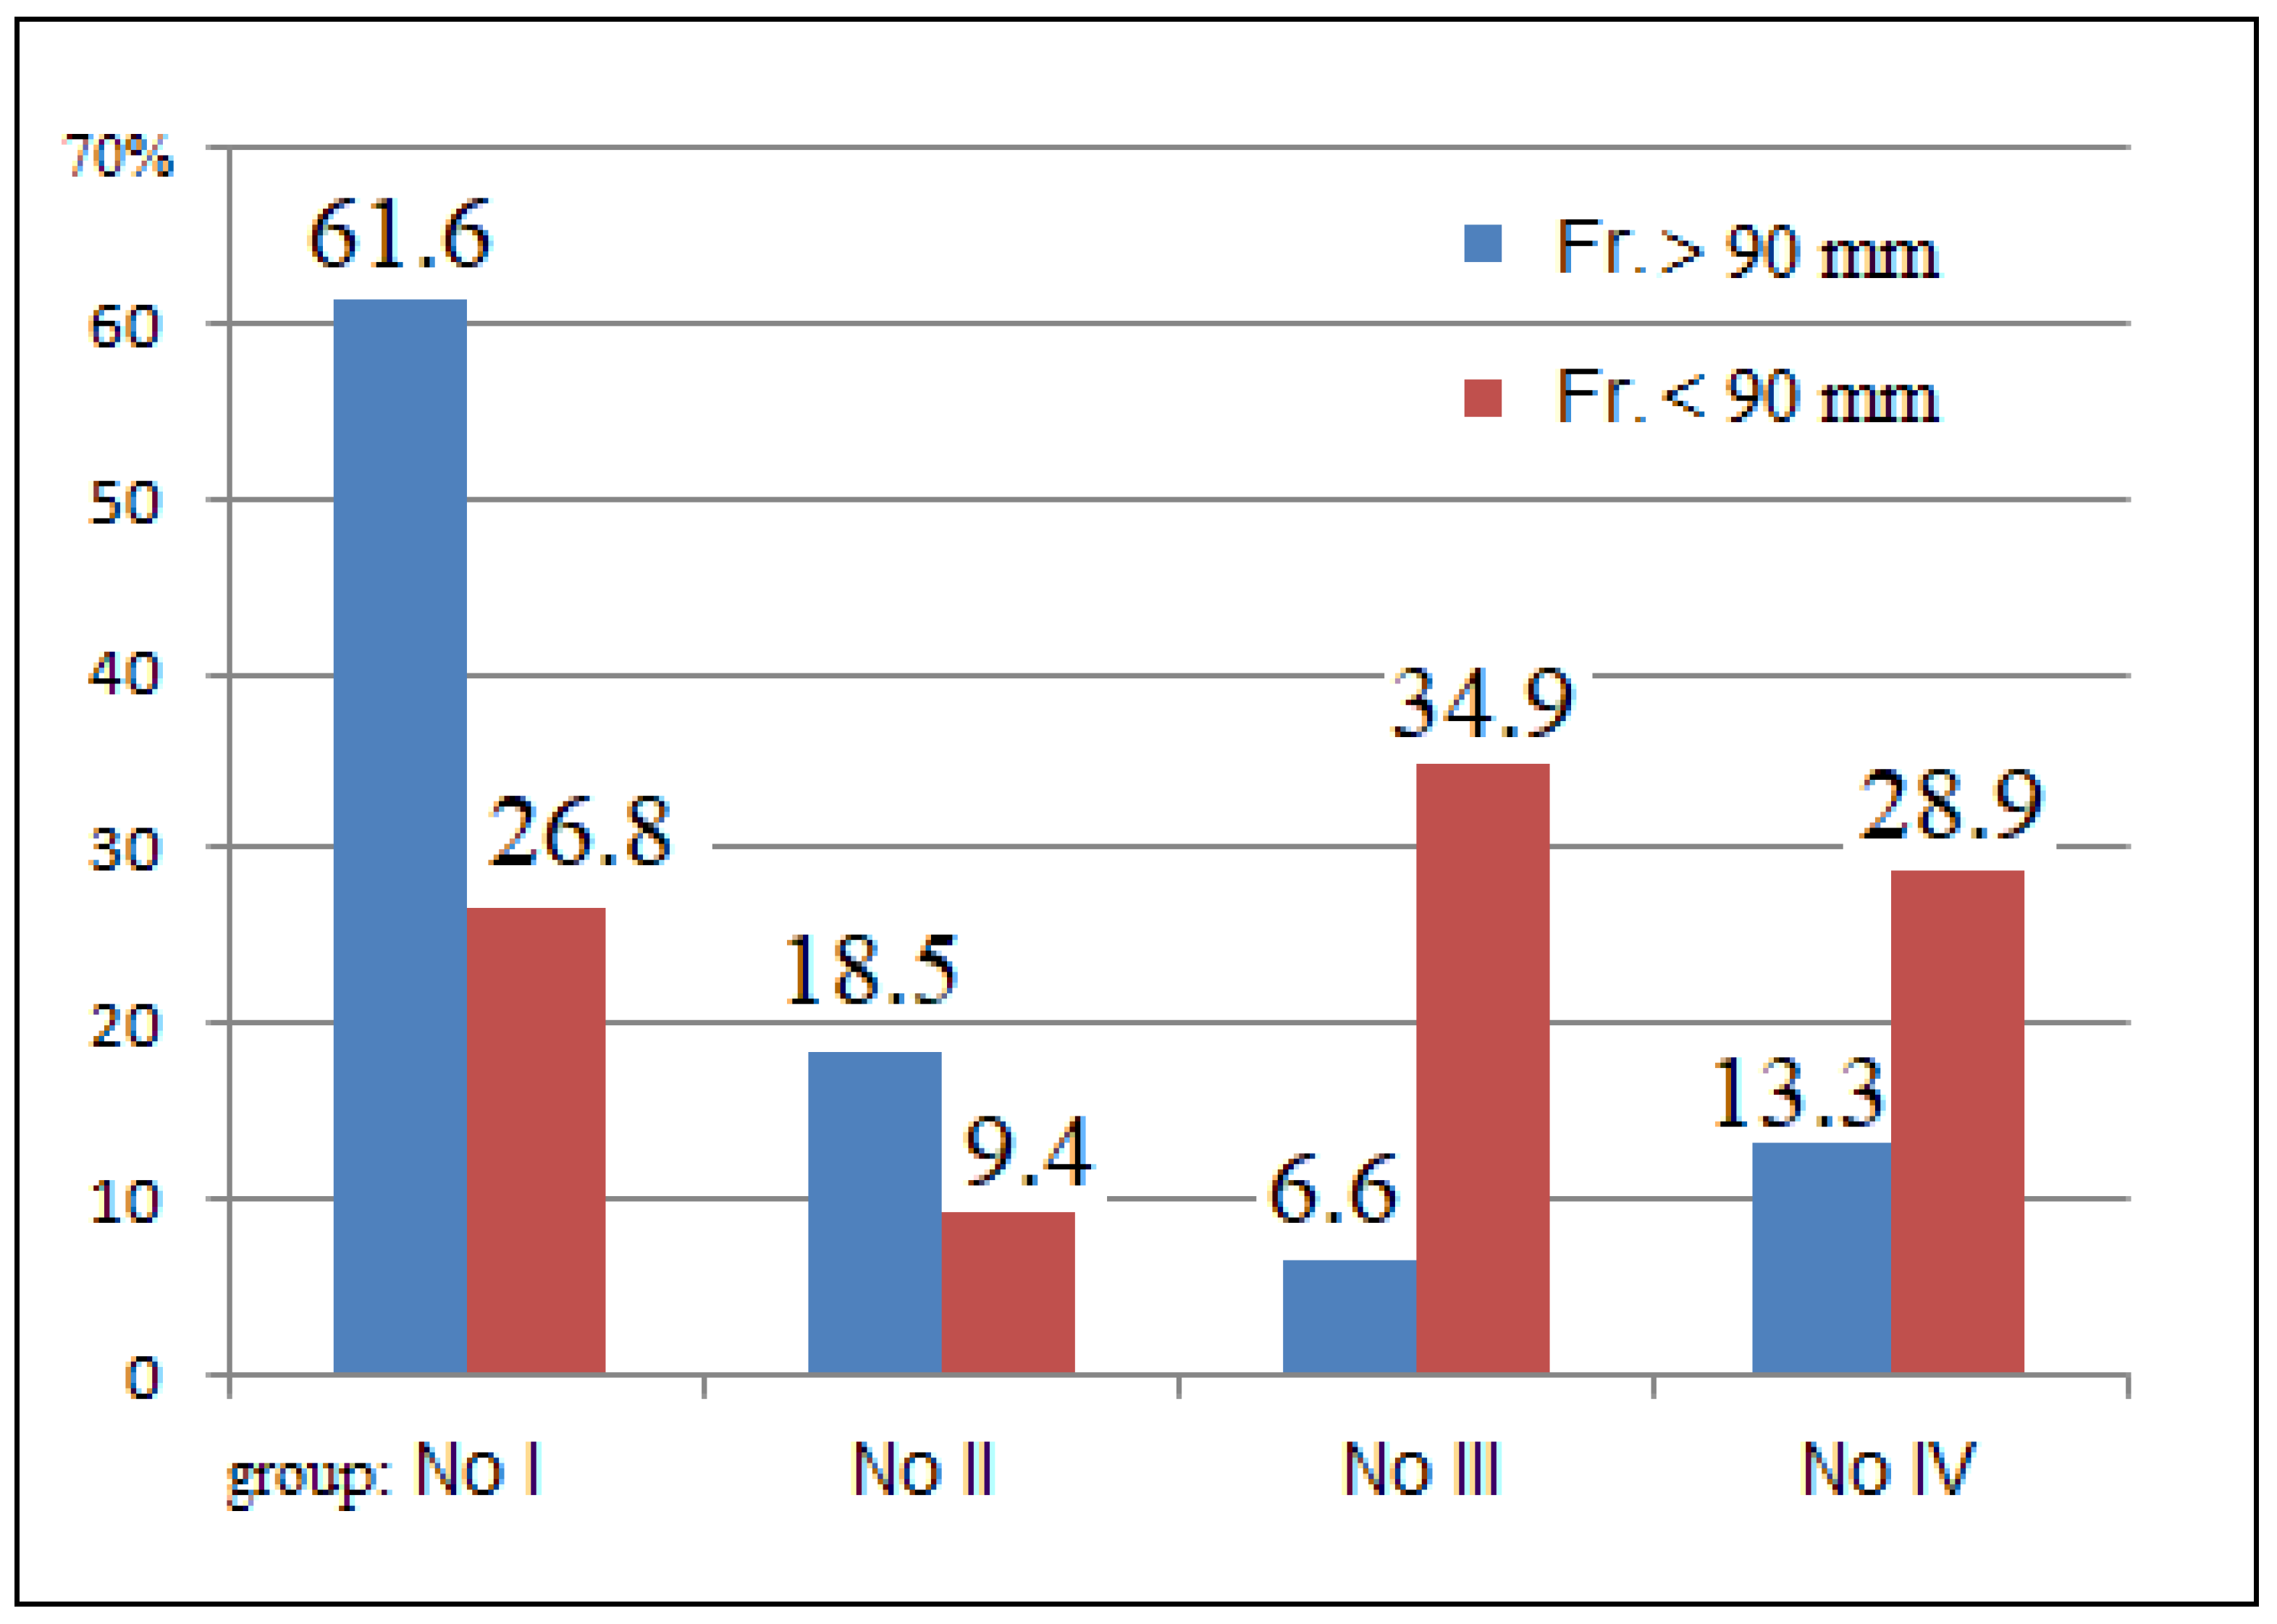
3.1. Composition of Municipal Waste

Structural research work on mixed waste was performed at the Regional Waste Management Plant in Sianów, which has a mechano-biological waste processing installation. The research work comprised the performance of a morphological analysis of two fractions that were mechanically separated in a rotary drum sifter with 90 mm screen mesh. Samples of waste from both fractions amounting to approximately 100 kg were taken for morphological examination. Tests were performed three times. From fractions defined as oversized (fr. > 90 mm) and subscreen (fr. < 90 mm), nine waste components were separated, i.e., biodegradable waste, plastics, paper and cardboard, glass, metals, textiles, wood, composite materials and other. Percentage shares of particular components were determined by their weight and comparison of the partial results to the entire mass of the sample. The shares, which were calculated in that way, indicated percentage by weight (%(w/w)). The percentage shares of the oversized and subscreen fractions in the mixed waste stream separated in the rotary drum sifter were determined from the mass balance of MBTP’s mechanical part [44]. The components separated in both fractions were combined, based on the classification criterion for a given group, thus creating Group No II and Group No III. From both groups, samples were taken for physicochemical tests.

3.2. Physicochemical Analyses

Apart from the samples taken from Groups No II and No III, which were composed of the components separated at the structural examination stage, samples of mechanically dehydrated sewage sludge taken from the municipal wastewater treatment plant in Koszalin were also subjected to physicochemical tests. The research included recording dry mass (dm) according to PN-EN 14346 and organic matter (om) according to PN-EN 15169: 2011. The analysis of C and N content was accomplished by Elementar, VarioMax CN. About 10 mg of dried powdered homogenous sample was used to determine the percentage of carbon and nitrogen. The measurement uncertainty of both analytes was the same, i.e., ±0.5%.

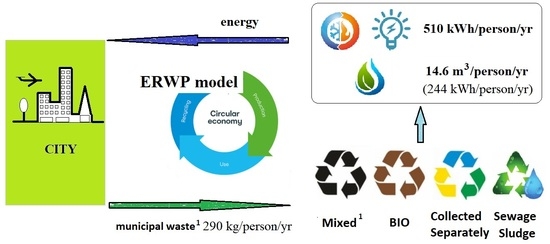
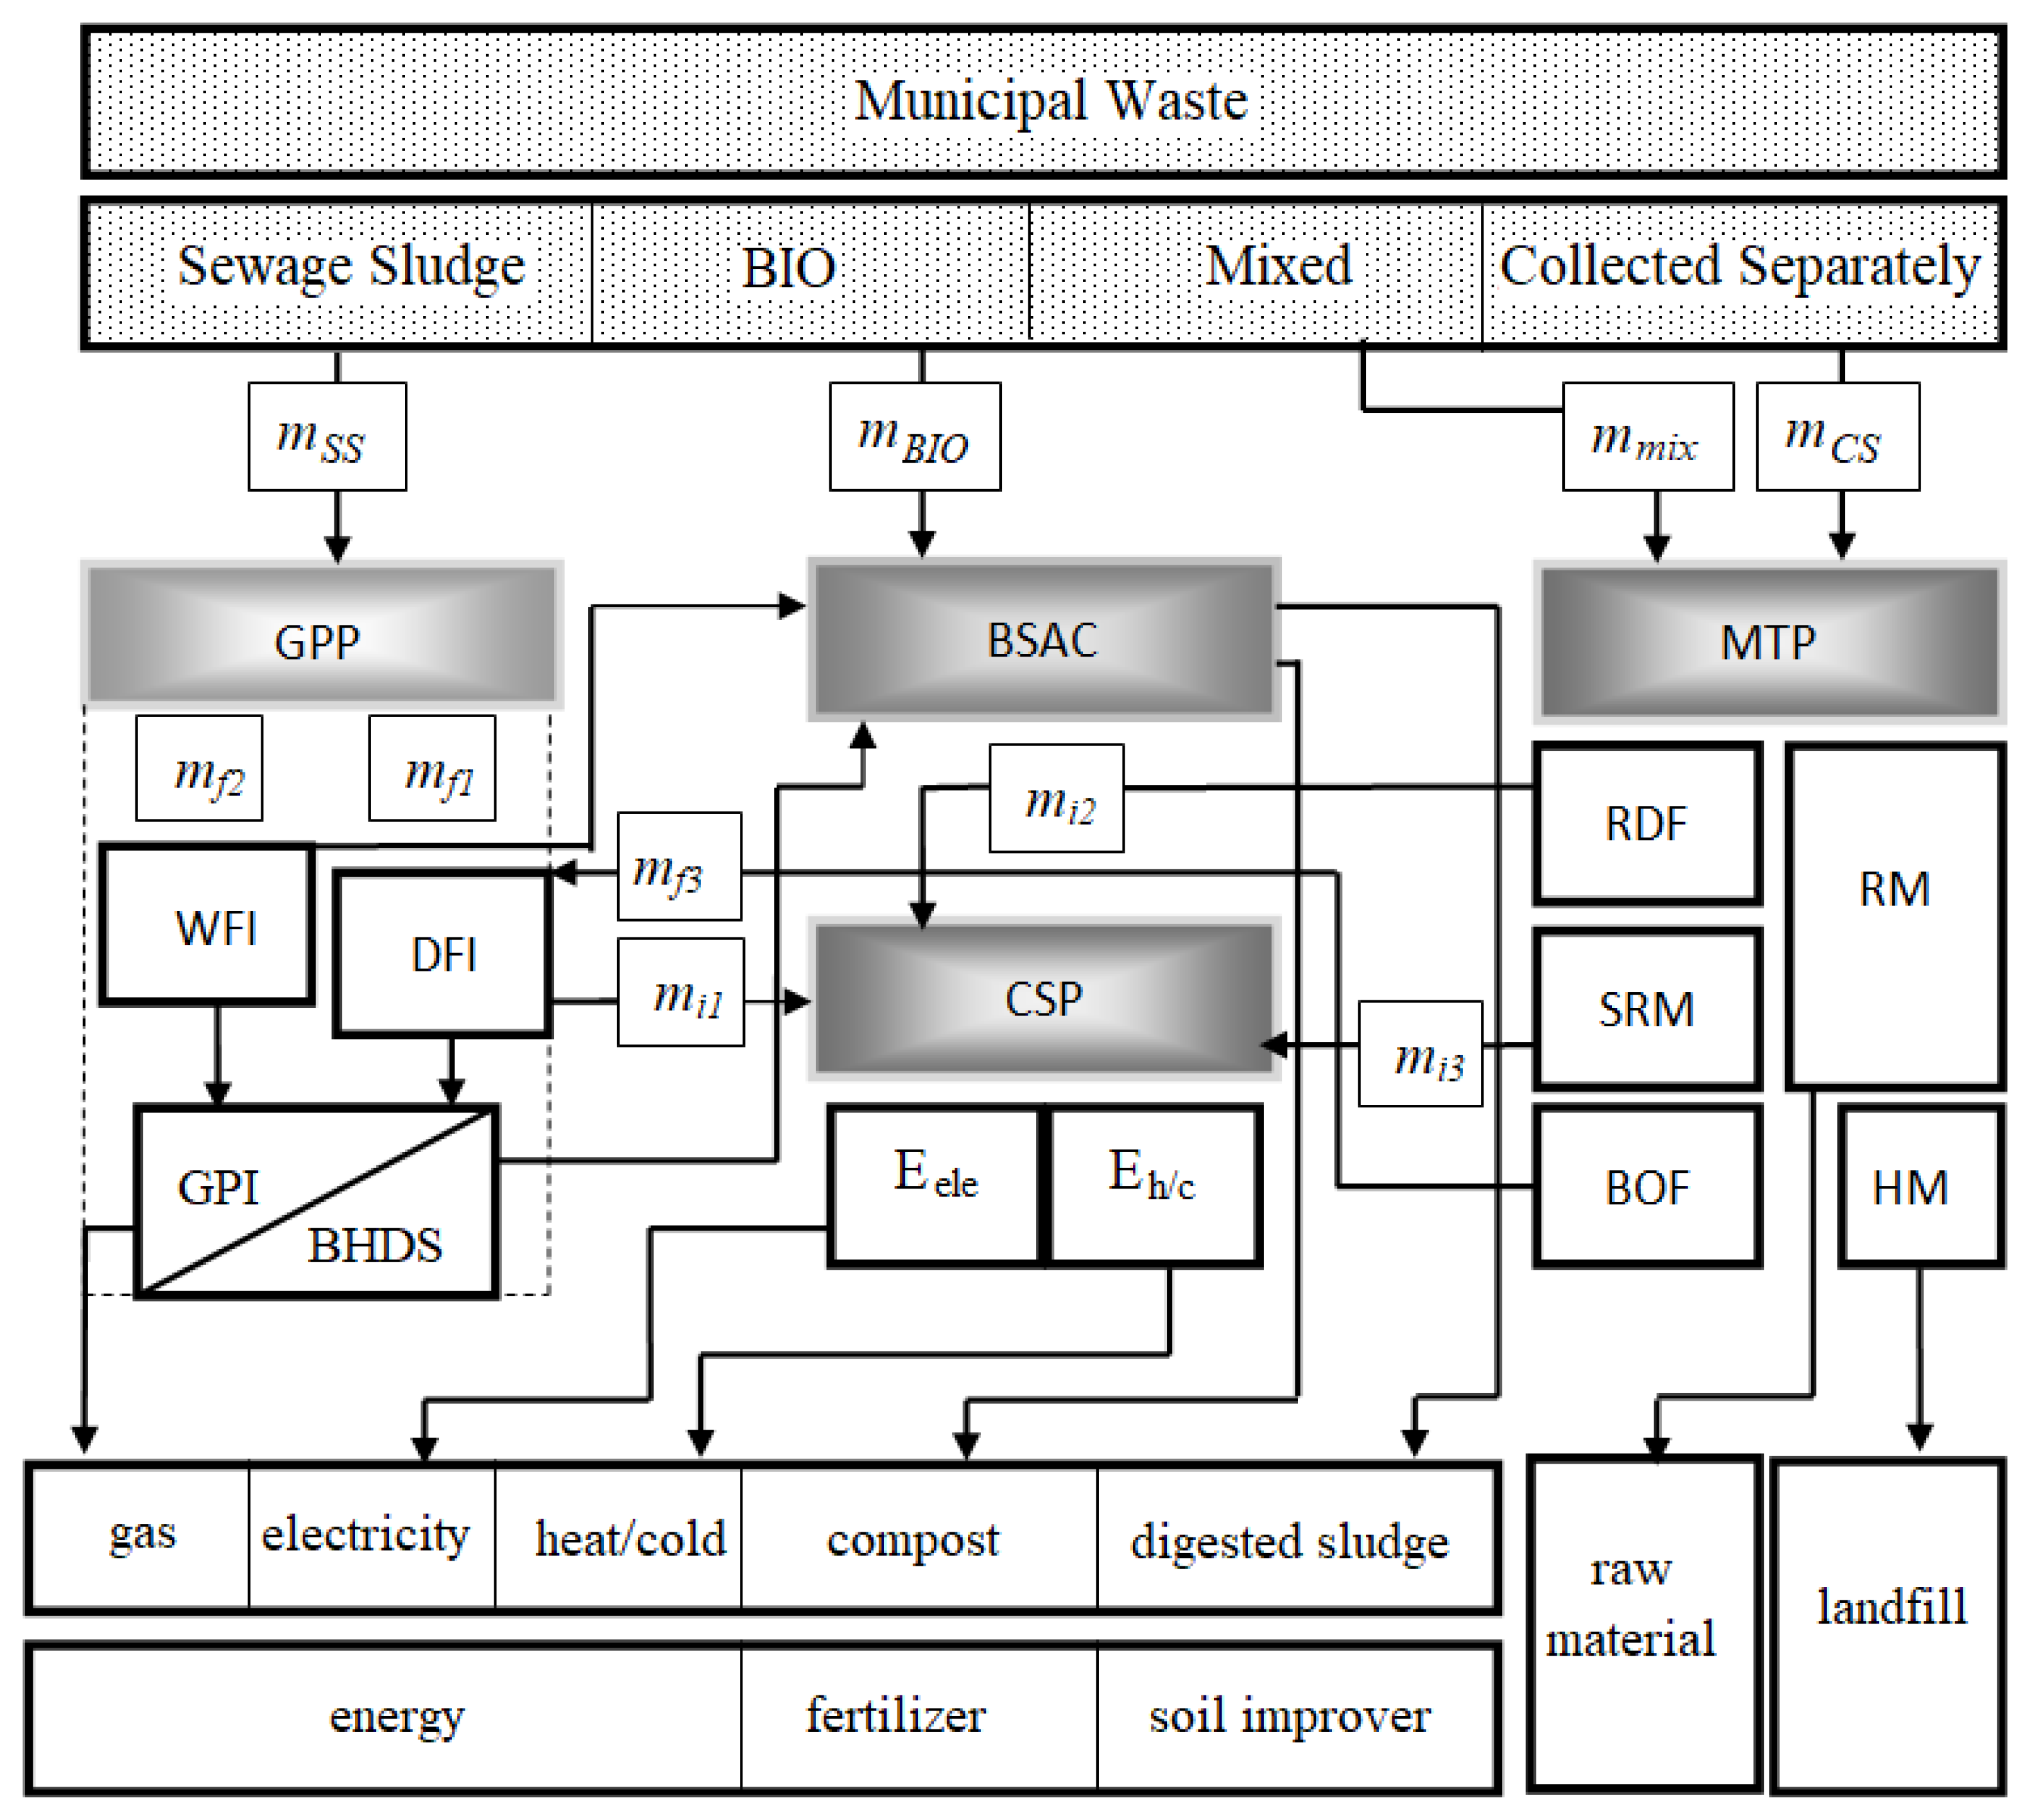
3.3. Model for Energy Waste Management

Taking into account the method of waste storage, four primary sorts of municipal waste generated in populated areas can be distinguished, i.e., mixed waste, waste from selective collection, biowaste and sewage sludge originating from a municipal wastewater treatment plant. The ERWP model is based on the cooperation of four industrial objects responsible for performing various tasks connected with processing of the above defined sorts of waste (Figure 1). The abbreviations used are presented in Table 2.
The first object is the mechanical treatment plant (MTP), to which mixed waste is directed. The MTP technique is based mainly on the screening as well as manual/mechanical separation processes. The second plant is the cogeneration system plant (CSP). In this object, thermal transformation of waste using a highly efficient combustion process will be carried out. The third plant is the gas production plant (GPP) processing biodegradable waste using two types of methane fermentation performed in high (WMF module) and in low water content conditions in the so-called dry fermentation process (DMF module). The fourth plant is the biological stabilisation in air condition (BSAC), i.e., the use of an intensive biological material aeration process under controlled conditions (composting). The key issue qualifying determination of the entire system’s energetic potential is the mass balance of waste flowing between particular plants and the balance of energy generated in unit processes provided in the ERWP model.

3.4. Mass Balance and Energy Balance

In setting the mass balance for raw materials used in energy generation, the volume of waste streams resulting from the splitting of waste mass originating from MTP and GPP technology—mf1, mf2, mf3, mi1, mi2, mi3—must be calculated (Figure 1). In order to do this, it is necessary to determine volumes of waste supplied to the system—mSS, mBIO, mmix, mCS—and know the results of the examination of waste morphological composition. The method of assessment of particular waste stream masses is shown in Table 3.
Two energy-generating processes have been provided in the system based on the ERWP model. These are methane fermentation in high- and low-hydration conditions and thermal waste transformation through combustion. The result of the oxidation of organic compounds in the municipal waste combustion process in the presence of oxygen is the liberation of thermal energy amounting to 10 MJ/kg (LHV) [63]. To calculate the parameters allowing for assessment of the energy potential, equations describing the relationship between the higher heating value (HHV) and lower heating value (LHV) as variables dependent on the contents of selected elements: HHV, LHV = f ( C , H , N , O , S ) , can be used [64]. The elements are determined by application of elemental analysis and their contents are indicated as percentages of dry mass. Mutual relationships described in the literature are expressed by multiple regression equations having the general form of Y = a + b 1 X 1 + + b n · X n . The equations obtained are then approximated by application of the least squares method and in the majority of cases they have a high coefficient of determination (R2), which shows a good match of the estimated function (Table 4).
Usage of the equations contained in Table 3 is associated with a necessity to analyse contents of the elements making up the independent variables. Arriving at a reliable result requires (i) application of the same methodology of preparation of the analytical sample and (ii) use of raw material procured in the same way as that used for the development of the given equation. Condition (ii) originates from the limitation of the impact of the so-called discreet variables that are not taken into account in the equations in Table 3. Finally, to estimate HHV, an equation was used which takes into account, as independent variables, contents of various materials in the waste mix making up the energetic material [68], in the following form:
HHV = 0.0535(F + 32.6⋯CP) + 0.3722 ∙ PLR, MJ/kg
Particular values in Formula (7) indicate contents of: F—bio fraction, CP—cardboard and paper, PLR—plastic, leather and rubber in the dry waste mixture expressed in %(w/w).
Approximation of the results based on determination of the HHV value, being a dependent variable for sewage sludge samples after the methane fermentation process with variable organic substance contents, allowed for the development of a model for which coefficient R2 was 0.87 [69]:
HHV = 0.2132⋯Zom, MJ/kg
Zom in Formula (8) indicates contents of organic matter in % dm.
The higher heat value of wood waste was assessed from the following equation [70]:
HHV= 0.4373C − 1.6701, MJ//kg
Gas yield from methane fermentation is described, in practice, by two indicators. The first one is the rate of biogas production (GPR), counted as a quotient of the daily volume of generated gas and reactor volumetric capacity expressed in m3gas/m3reactor/d. This indicator is used directly to fix the calculated flow rate in the installation and to select proper biogas-processing devices. The second indicator is the unit gas production (GP), calculated by division of the daily generated gas volume by the daily load of organic matter, which shows the volume of biogas generated from raw material mass, i.e., m3gas/Mg om. GP is used, first and foremost, for assessment of energetic potential associated with economic analysis. Fermentation of the organic fraction, depending on the participation of other co-materials, gives the value of GP = 222 ÷ 350 dm3 CH4/kg om. [71]. Table 5 shows GP values obtained from examination of the fermentation process using various raw materials both in low- and high-hydration conditions.

4. Results

Determination of the energetic potential based on the ERWP model was performed for the municipality of Koszalin with statistical data pertaining to the volume of municipal waste amassed in 2018 using the results of research describing waste composition and selected physicochemical parameters. The volume of household and commercial waste that was generated at that time was 30,760 t. The mechanical part of the plant to which the waste is directed comprises recovery of the fraction (Fr. > 200 mm) set for manual separation. The fraction below 200 mm makes up 89.2% and is directed in full to a rotary drum sifter with 90 mm mesh [44]. The average share of the oversized (Fr. > 90 mm) and subscreen (Fr. < 90 mm) fractions was 46.1% and 53.9%, respectively. The percentage shares of separated waste elements in both fractions are shown in Figure 2. Classifying all separated waste elements into four groups, shares in both fractions (Figure 3) were fixed and on this basis average shares of Groups No I–IV in mixed waste were calculated; they were: 44.2, 14.0, 20.7 and 21.1%, respectively.
The mass balance was set assuming 280 working days per year, which allowed for fixing the daily volume of mixed waste (Md) directed to MTP as approx. 110 t. Using Equations (3) and (5), the mass of the waste attributed to Group No II—mi2—directed to CSP and mass of the waste attributed to Group No III—mf3—directed to DFI were calculated. These masses amounted to 13.7 and 20.3 t/d, respectively. The results of physicochemical tests of samples of both waste groups and sewage sludge before and after mechanical dehydrations are shown in Table 6. The content of organic matter found in sewage sludge was in the range of 65–75% dm, defined as characteristic [78].

5. Discussion

In total, 3.044 t of biodegradable (BIO) waste was stored. In accordance with the earlier description, this waste originated from selective collection performed in individual households, collection from the gastronomic sector and green area cultivation. The quality of BIO waste justifies its delivery to BSAC provided that any wood waste that was not used for the production of wood chips as structure-forming material in any composting process was directed to the CSP [79]. As there is no accurate data to that effect, this stream of waste was omitted by putting 0 in Equation (6). In waste from selective collection, amounting to 100 tons/year, waste window and door woodwork as well as worn furniture make up 25%, which makes stream mass mi3 equal to 25 t/a.
In the Koszalin-Jamno wastewater treatment plant featuring throughput of 36,000 m3/d, approximately 71 tons of mechanically dehydrated sewage sludge (mSS) with 21% dm is produced during a day. The predisposed fermentation technique BOF, due to the high concentration of dry matter, is dry fermentation, which proceeds in low-hydration conditions below 85% [80]. This allows for a considerable reduction in reactor volumetric capacity compared to wet fermentation that is performed at a hydration level exceeding 94% [81]. Considering the composition and structure of BOF, this waste, being a coarse-grained raw material, requires preliminary preparation, i.e., comminution. The optimum degree of comminution of the organic fraction for the dry fermentation process should take into account the maximum share of granules with dimensions falling into the 20 to 40 mm interval [82]. The impact of comminution on the increase in fermentation gas yield is not clear-cut. The majority of the available sources of information indicate that the increase in the active surface of organic particles through material comminution facilitates access of microorganisms to nutritive substrates, thus improving the process conditions [83]. The ERWP model is based on the assumption that BOF arrives in its entirety to the DFI module of the GPP. The required content of water for the dry fermentation process, due to the low humidity of BOF at 28%, is secured by supplementation of mechanically dehydrated sewage sludge with 79% water content. To determine the mass of sewage sludge mf1 and mf2 directed to the methane fermentation process, Equations (1) and (2) were used, respectively. Based on these equations, it was found that 79 t of sewage sludge containing 95% water is directed to the wet fermentation process, whereas 28 tons of sewage sludge containing 81% water mixed with 20.3 tons of the organic fraction separated from mixed waste makes up a mass of daily charge into the dry fermentation process. The decrement of the dry mass of sewage sludge in the methane fermentation process is 31–35%, which causes a decrease in the heat of combustion on average by 22% [69]. The mass of post-fermenter mi1 amounting to 43.1 t was calculated using Equation (4).
The volume of gas generated in the GPP in both VFI and DFI modules was calculated using the unit indicators presented in Table 5. In the case of wet fermentation performed in the VFI module, an indicator of 60.6 dm3/kg dm was used as an average value of two empirical indicators given by [72,73]. In both cases, the fermentation process proceeded in mesophilic conditions and a similar period of charge was used in the HRT reactor. The generation of gas in the DFI dry co-fermentation process using a mixture of sewage sludge and organic fraction separated from municipal waste (Group No III) was estimated using an indicator value of GPP = 265.0 dm3/kg dm [76]. The adopted indicator corresponds to the value attained on an industrial scale in a methane fermentation plant based on the LARAN technique employed in the municipality of Tychy (Poland), where the average daily production of gas in mesophilic conditions at HRT = 20 days is 266.3 dm3/kg dm [44]. A slightly lower gas yield obtained from a dry fermentation process amounting to 215.0 dm3/kg dm has been observed in laboratory conditions [73]. For the indicators assumed, the volume of gas generated in WFI and DFI modules is 239.37 and 5280.06 m3/d, respectively. The energy equivalent to the volume of gas generated in both modules of methane fermentation was calculated by assuming that the combustion heat was 22.5 MJ/m3 [42] (Table 7).
To CSP generating thermal energy and electricity directed the remains from the dry fermentation process (mi1), Group No II (mi2) and door/window woodwork as well as waste furniture, jointly making a high-calorie raw material SRM (mi3). The content of organic matter in the waste stream mi1, determined as a weighted average in sewage sludge and BOF (Group No II) after the fermentation process, causing partial oxidation of so, was 60.56%. To calculate HHV for mi1 and mi2, Equations (7) and (8) were used, respectively. Contents of carbon and nitrogen in Group No II determined in the elementary analysis method are similar to the results of research published in numerous papers. For example, the share of carbon determined in the elementary analysis of C, N, O, H, P was 47.81% [48] and 44.72% [63]. HHV values calculated from regression equations or determined in the heat analysis indicated in the papers cited above were 23.19 and 19.50 MJ/kg dm, respectively whereas the HHV value found in my own research work, calculated from Equation (7), was 24.5 MJ/kg dm. The balance of raw materials mass and energy from their processing using the ERWP model’s energy generation processes is presented in Table 7.

6. Conclusions and Recommendation

The ERWP model presented here serves for the planning of a waste management system based on the all known forms of recycling, including recycling of energy. The disposal of municipal waste based on the presented model is, in fact, an implementation of the circular economy strategy, in which waste becomes a raw material. The model, taking into account specific features of the given waste, provides for proper preparation of the raw material constituting a charge to the energy generating process. This pertains mainly to separation, through mechanical separation of mixed waste, of highly energetic RDF having an HHV value close to 24.5 MJ/kg versus 16 MJ/kg of mixed waste directed to combustion in its entirety. The separated organic fraction together with dehydrated sewage sludge is then subjected to methane co-fermentation in low water content conditions featuring a high unit gas yield of 265 dm3/kg dm. The remaining part of the sewage sludge is directed to the wet fermentation process. The application of three energy-generating processes in the model described above provides a source of alternative energy, reducing consumption of fossil fuels such as crude oil, natural gas and coal. In a year, the energetic value of generated biogas and raw materials originating from selective collection as well as separated from the mixed waste stream for a municipality, with a population of almost 106,000, is 79,917.6 MWh, which substitutes approximately 10,000 t of coal.
The described ERWP model can be used in planning and implementation of an effective waste management system of any scale. The effectiveness of the model has been demonstrated on the grounds of a medium-sized city having approximately 110,000 inhabitants. As a rule, bigger cities generate larger volumes of waste, which increases the profitability of the implementation of a system based on the ERWP model. The fundamental advantage of the model is the use of practical processes that make up the system, where products from one site become a raw material for other sites. Thus, potential stakeholders generating or gathering municipal waste are united by one goal—effective waste processing. The unit value of energy generated in the system based on the ERWP model amounting to 754 kWh/inhabitant/a cannot cover all of the energetic demand of the local population. However, the example of Copenhagen shows that the share of energy generated from municipal waste processing may constitute up to 40% of the entire energy demand. Use of the alternative source of energy, which is the municipal waste through the creation of a system based on known processes, is the fundamental advantage of the ERWP model that justifies its application.

Funding

This research received no external funding.

Institutional Review Board Statement

Not applicable.

Informed Consent Statement

Not applicable.

Conflicts of Interest

The author declare no conflict of interest.

References

  1. Guar, V.K.; Sharma, P.; Awasthi, M.K.; Dussap, C.G.; Pandey, A. Assessing the impact of industrial waste on environment and mitigation strategies: A comprehensive review. J. Hazard. Mater. 2020, 398, 123019. [Google Scholar] [CrossRef]
  2. Janowska, B.; Szymański, K.; Sidełko, R.; Walendzik, B.; Siebielska, I. Assessment of mobility and bioavailability of mercury compounds in sewage sludge and composts. Environ. Res. 2017, 156, 394–403. [Google Scholar] [CrossRef]
  3. Golwala, H.; Zhang, X.; Mdlskander, S.; Smith, A.L. Solid waste: An overlooked source of microplastics to the environment. Sci. Total Environ. 2021, 769, 144581. [Google Scholar] [CrossRef]
  4. Qugaard, M. Political Globalization: State, Power, and Social Forces; Palgrave Macmillan: New York, NY, USA, 2004. [Google Scholar]
  5. Vogli, R.; Kouvonen, A.; Elovainio, M.; Marmot, M.G. Economic globalization, inequality and body mass index: A cross-national analysis of 127 countries. Crit. Public Health 2014, 24, 7–21. [Google Scholar] [CrossRef]
  6. Schmukler, S.L.; Abraham, F. Financial Globalization; World Bank: Washington, DC, USA, 2017. [Google Scholar]
  7. Sánchez-López, C.; Aceytuno, M.T.; De Paz-Bañez, M.A. Inequality and globalisation: Analysis of European countries. Econ. Sociol. 2019, 12, 84–100. [Google Scholar] [CrossRef]
  8. Shkolnyk, I.; Kozmenko, S.; Kozmenko, O.; Mershchii, B. The impact of economy financialization on the level of economic development of the associate EU member states. Econ. Sociol. 2019, 12, 43–58. [Google Scholar] [CrossRef] [PubMed]
  9. Balcerzak, A.P. Quality of institutions in the European Union countries. Application of TOPSIS based on entropy measure for objective weighting. Acta Polytech. Hung. 2020, 17, 101–122. [Google Scholar] [CrossRef]
  10. Halaskova, M.; Gavurova, B.; Korony, S. Change of EU28 countries research and development indicators between 2010 and 2015. Econ. Sociol. 2020, 13, 230–248. [Google Scholar] [CrossRef] [PubMed]
  11. Škare, M.; Franc-Dąbrowska, J.; Cvek, D. Cointegration analysis and VECM of FDI, employment, export and GDP in Croatia (2002/2017) with particular reference to the global crisis and poor macroeconomic governance. Equilib. Q. J. Econ. Econ. Policy 2020, 15, 761–783. [Google Scholar] [CrossRef]
  12. Gavurova, B.; Soltes, M.; Kovac, V. Application of cluster analysis in process of competitiveness modelling of Slovak Republic regions. Transform. Bus. Econ. 2017, 16, 129–147. [Google Scholar]
  13. Simionescu, M.; Balcerzak, A.P.; Bilan, Y.; Kotásková, A. The impact of money on output in Czech Republic and Romania. J. Bus. Econ. Manag. 2018, 19, 20–41. [Google Scholar] [CrossRef] [Green Version]
  14. Szopik-Depczyńska, K.; Kędzierska-Szczepaniak, A.; Szczepaniak, K.; Cheba, K.; Gajda, W.; Ioppolo, G. Innovation in sustainable development: An investigation of the EU context using 2030 agenda indicators. Land Use Policy 2018, 79, 251–262. [Google Scholar] [CrossRef]
  15. Kiseľáková, D.; Šofranková, B.; Onuferová, E.; Čabinová, V. The evaluation of competitive position of EU-28 economies with using global multi-criteria indices. Equilibrium. Q. J. Econ. Econ. Policy 2019, 14, 441–462. [Google Scholar] [CrossRef]
  16. Androniceanu, A.M.; Kinnunen, J.; Georgescu, I.; Androniceanu, A.A. Multidimensional Approach to Competitiveness, Innovation and Well-Being in the EU Using Canonical Correlation Analysis. J. Compet. 2020, 12, 5–21. [Google Scholar] [CrossRef]
  17. Kuc, M. Is the regional divergence a price for the international convergence? The case of Visegrad group. J. Compet. 2017, 9, 50–65. [Google Scholar] [CrossRef] [Green Version]
  18. Kijek, A.; Matras-Bolibok, A. Technological convergence across European regions. Equilibrium. Q. J. Econ. Econ. Policy 2020, 15, 295–313. [Google Scholar] [CrossRef]
  19. Kónya, I.; Ohashi, H. International Consumption Patterns among High income Countries: Evidence from the OECD Data. Rev. Int. Econ. 2007, 15, 744–757. [Google Scholar] [CrossRef]
  20. Horáková, M. Consumer behavior of college students in the Czech Republic. J. Compet. 2015, 7, 68–85. [Google Scholar]
  21. Grybaitė, V.; Stankevičienė, J. An empirical analysis of factors affecting sharing economy growth. Oeconomia Copernic. 2018, 9, 635–654. [Google Scholar] [CrossRef]
  22. Jankiewicz, M.; Pietrzak, M.B. Assessment of trends in the share of expenditure on services and food in the visegrad group member states. Intern. J. Bus. Soc. 2020, 21, 977–996. [Google Scholar] [CrossRef]
  23. Walczak, D.; Dziawgo, L.; Dziawgo, D.; Buszko, M.; Pawłowski, J.; Żołądkiewicz-Kuzioła, A.; Krupa, D. Attitudes and Behaviors Regarding Environmental Protection in the Financial Decisions of Individual Consumers. Energies 2021, 14, 1934. [Google Scholar] [CrossRef]
  24. Pietrzak, M.B.; Walczak, D. The Analysis of the Agrarian Structure in Poland with the Special Consideration of the Years 1921 and 2002. Bulg. J. Agric. Sci. 2014, 20, 1018–1039. [Google Scholar]
  25. Rokicki, T.; Perkowska, A.; Klepacki, B.; Bórawski, P.; Bełdycka-Bórawska, A.; Michalski, K. Changes in Energy Consumption in Agriculture in the EU Countries. Energies 2021, 14, 1570. [Google Scholar] [CrossRef]
  26. Lee, Y.; Kim, B.; Hwang, H. Which Institutional Conditions Lead to a Successful Local Energy Transition? Applying Fuzzy-Set Qualitative Comparative Analysis to Solar PV Cases in South Korea. Energies 2020, 13, 3696. [Google Scholar] [CrossRef]
  27. Lin, M.-X.; Liou, H.M.; Chou, K.T. National Energy Transition Framework toward SDG7 with Legal Reforms and Policy Bundles: The Case of Taiwan and Its Comparison with Japan. Energies 2020, 13, 1387. [Google Scholar] [CrossRef] [Green Version]
  28. Pietrzak, M.B.; Igliński, B.; Kujawski, W.; Iwański, P. Energy Transition in Poland–Assessment of the Renewable Energy Sector. Energies 2021, 14, 2046. [Google Scholar] [CrossRef]
  29. Singh, J.; Laurenti, R.; Sinha, R.; Frostell, B. Progress and challenges to the global waste management system. Waste Manag. Res. 2014, 32, 800–812. [Google Scholar] [CrossRef] [PubMed] [Green Version]
  30. Jouhara, H.; Czajczyńska, D.; Ghazal, H.; Krzyżyńska, R.; Anguilano, L.; Reynolds, A.J.; Spencer, A. Municipal waste management systems for domestic use. Energy 2017, 139, 485–506. [Google Scholar] [CrossRef]
  31. Eurostat Statistics. 2020. Available online: https://ec.europa.eu/eurostat/statisticsexplained (accessed on 1 April 2021).
  32. Szymański, K.; Sidełko, R.; Janowska, B.; Siebielska, I. Monitoring of waste landfills. Zesz. Nauk. Wbiiś Politech. Koszalińskiej 2007, 23, 75–136. [Google Scholar]
  33. Zaman, A.U. A comprehensive study of the environmental and economic benefits of resource recovery from global waste management systems. J Clean. Prod. 2016, 124, 41–50. [Google Scholar] [CrossRef]
  34. Kaza, S.; Yao, L.; Bhada-Tata, P.; Woerden, F. What a Waste 2.0. A Global Snapshot of Solid Waste Management to 2050; Urban Development Series; World Bank: Washington, DC, USA, 2018. [Google Scholar]
  35. Alzamora, B.R.; Baros, R.T. Review of municipal waste management charging methods in different countries. Waste Manag. 2020, 115, 47–55. [Google Scholar] [CrossRef]
  36. Statistical Yearbook of the Republic of Poland. 2018. Available online: https://stat.gov.pl (accessed on 1 April 2021).
  37. Sadeleer, I.; Brattebø, H.; Callewaert, P. Waste prevention, energy recovery or recycling—Directions for household food waste management in light of circular economy policy. Resour. Conserv. Recycl. 2020, 160, 104908. [Google Scholar] [CrossRef]
  38. Szymanski, K.; Sidelko, R.; Janowska, B.; Siebielska, I. Monitoring of waste landfills. Book Ser. Sci. Noteb. Wbiis 2007, 23, 75–133. [Google Scholar]
  39. Senetra, A.; Krzywnicka, I.; Tuyet, M.D.T. The Analysis and the Evaluation of Municipal Waste Management in Voivodship Cities in Poland. Rocz. Ochr. Środowiska 2019, 21, 1076–1098. [Google Scholar]
  40. Nanda, S.; Berruti, F. A technical review of bioenergy and resource recovery from municipal solid waste. J. Hazard. Mater. 2021, 403, 123970. [Google Scholar] [CrossRef]
  41. Leckner, B. Process aspects in combustion and gasification Waste-to-Energy (WtE) units. Waste Manag. 2015, 37, 13–25. [Google Scholar] [CrossRef] [PubMed]
  42. Hossein, R.; Izadbakhsh, H.; Shakouri, H. A planning model for using municipal solid waste management technologies- considering Energy, Economic, and Environmental Impacts in Tehran-Iran. Sustain. Cities Soc. 2021, 65, 102566. [Google Scholar]
  43. CPH 2025 Climate Plan. Available online: http://kk.sites.itera.dk/apps/kk_pub2/pdf/983_jkP0ekKMyD.pdf (accessed on 1 April 2021).
  44. Jędrczak, A.; den Boer, E. Final Report of the Third Stage of Expertise Aimed at Conducting Waste Tests in 20 Mechanical-Biological Installations Waste Processing. Zielona Góra 2015. Available online: https://sdr.gdos.gov.pl/Documents/GO/Ekspertyzy/Ekspertyza%20MBP_III%20etap_%2022-06-2015%20+%20za%C5%82aczniki.pdf (accessed on 26 May 2021).
  45. Azam, M.; Jahromy, S.S.; Raza, W.; Raza, N.; Lee, S.S.; Kim, K.H.; Winter, F. Status, characterization, and potential utilization of municipal solid waste as renewable energy source: Lahore case study in Pakistan. Environ. Int. 2020, 134, 105291. [Google Scholar] [CrossRef] [PubMed]
  46. Directive 2008/98/EC of the European Parliament and of the Council of 19 November 2008. Off. J. EU. 2008. no. l 312/3. Available online: https://eur-lex.europa.eu/LexUriServ/LexUriServ.do?uri=OJ:L:2008:312:0003:0030:EN:PDF (accessed on 26 May 2021).
  47. Melikoglu, M. Vision 2023: Assessing the feasibility of electricity and biogas production from municipal solid waste in Turkey. Renew. Sustain. Energy Rev. 2013, 19, 52–63. [Google Scholar] [CrossRef]
  48. Shumal, M.; Reza, A.; Jahromi, T.; Ferdowsi, A.; Mohammad, S.; Dehkordi, M.N.; Moloudian, A.; Dehnavi, A. Comprehensive analysis of municipal solid waste rejected fractions as a source of Refused Derived Fuel in developing countries (case study of Isfahan-Iran): Environmental impact and sustainable development. Renew. Energy 2020, 146, 404–413. [Google Scholar] [CrossRef]
  49. Jedelhauser, M. The Future of Waste Incineration in a Modern Circular Economy; Info: Waste Incineration; Naturschutzbund Deutschland (NABU): Berlin, Germany, 2020. [Google Scholar]
  50. Agar, D.A.; Kwapinska, M.; Leahy, J.J. Pyrolysis of waste water sludge and composed organic fines from municipal solid waste: Laboratory reactor characterisation and product distribution. Environ. Sci. Pollut. Res. 2018, 25, 35874–35882. [Google Scholar] [CrossRef]
  51. Werle, S. Influence of the Gasification Agent Type on Syngas Parameters. Rocz. Ochr. Środowiska 2014, 16, 440–452. [Google Scholar]
  52. Thome-Kozmiensky, K.J. Thermische Abfall Behandlung; EF-Verlag für Energie und Umwelt technik: Berlin, Germany, 1994. [Google Scholar]
  53. Juniper Consultancy Services. Advanced Conversion Technologies; Juniper Consultancy Services: London, UK, 2007. [Google Scholar]
  54. Kalinichenko, A.; Havrysh, V. Feasibility study of biogas project development: Technology maturity, feedstock, and utilization pathway. Arch. Environ. Prot. 2019, 45, 68–83. [Google Scholar]
  55. Nguyen, V.K.; Chaudhary, D.K.; Ram, R.H.; Dahal, H.; Trinth, N.H.; Kim, J.; Chang, W.; Hong, Y.; La, D.D.; Nguyen, X.C.; et al. Review on pretreatment techniques to improve anaerobic digestion of sewage sludge. Fuel 2021, 285, 119105. [Google Scholar] [CrossRef]
  56. Sosnowski, P.; Wieczorek, A.; Ledakowicz, S. Anaerobic co-digestion of sewage sludge and organic fraction of municipal solid wastes. Adv. Environ. Res. 2003, 7, 609–616. [Google Scholar] [CrossRef]
  57. Campuzano, R.; Gonzalez-Martinez, S. Start-up of dry semi-continuous OFMSW fermentation for methane production. Biomass Bioenergy 2020, 136, 105544. [Google Scholar] [CrossRef]
  58. Bachmann, N. Sustainable Biogas Production in Municipal Waste Water Treatment Plants; Technical Report; IEA Bioenergy: Paris, France, 2015. [Google Scholar]
  59. Sarra, A.; Mazzocchitti, M.; Nissi, E. A methodological proposal to determine the optimal levels of inter-municipal cooperation in the organization of solid waste management systems. Waste Manag. 2020, 115, 56–64. [Google Scholar] [CrossRef] [PubMed]
  60. Jaworski, T.J.; Grochowska, G. Circular Economy-the criteria for achieving and the prospect of implementation in Poland. Arch. Waste Manag. Environ. Prot. 2017, 19, 13–22. [Google Scholar]
  61. Foggia, G.; Beccarello, M. Designing waste management systems to meet circular economy goals: The Italian case. Sustain. Prod. Consum. 2021, 26, 1074–1083. [Google Scholar] [CrossRef]
  62. Matthews, K. 6 Waste-To-Energy Trends in 2020 That Are Worth Watching. Available online: https://blueandgreentomorrow.com/environment/ (accessed on 1 April 2021).
  63. Leckner, B.; Lind, F. Combustion of municipal solid waste in fluidized bed or on grate—A comparison. Waste Manag. 2020, 109, 94–108. [Google Scholar] [CrossRef] [PubMed]
  64. Ibikunle, R.A.; Titiladunayo, I.F.; Lukman, A.F.; Dahunsi, S.O.; Akeju, E.A. Municipal solid waste sampling, quantification and seasonal characterization for power evaluation: Energy potential and statistical modeling. Fuel 2020, 277, 118122. [Google Scholar] [CrossRef]
  65. Kuo, W.C.; Lasek, J.; Słowik, J.; Głód, K.; Jagustyn, B.; Li, Y.H.; Cygan, A. Low-temperature pre-treatment of municipal solid waste for efficient application in combustion systems. Energy Convers. Manag. 2019, 196, 525–535. [Google Scholar] [CrossRef]
  66. Niessen, W.R. Combustion and Incineration Process—Aplication in Environmental Engineering; Marcel Dekker: New York, NY, USA, 1995. [Google Scholar]
  67. Channivala, S.A.; Parikh, P.P. A unified correlation for estimating HHV of solid, liquid and gaseous fuel. Fuel 2002, 81, 1051–1063. [Google Scholar] [CrossRef]
  68. Khan, M.Z.A.; Abu-Gharah, Z.H. New approach for estimating Energy content of municipal solid waste. J. Environ. Eng. 1991, 117, 376–380. [Google Scholar] [CrossRef]
  69. Szaflik, W.; Iżewska, A.; Dominowska, M. Chemical Energy Balance of Digested Sludge in Sewage Treatment Plant Pomorzany in Szczecin. Annu. Set Environ. Prot. 2014, 16, 16–33. [Google Scholar]
  70. Tillman, D.A. Wood as an Energy Resources; Academic Press: New York, NY, USA, 1978. [Google Scholar]
  71. Khalid, A.; Arshad, M.; Anjum, M.; Mahmood, T.; Dawson, L. The anaerobic digestion of solid organic waste. Waste Manag. 2011, 31, 1737–1744. [Google Scholar] [CrossRef]
  72. Iżewska, A.; Szaflik, W. Energy processing of sludge come from the Pomorzany Water Treatment Plant in Szczecin. Ecol. Eng. 2016, 48, 88–95. [Google Scholar]
  73. Sailer, G.; Eichermüller, J.; Poetsch, J.; Paczkowski, S.; Pelz, S.; Oechsner, H.; Müller, J. Datasets on chemical composition and anaerobic digestion of organic fraction of municipal solid waste (OFMSW), digested sewage sludge (inoculum) and ashes from incineratio norgasification. Data Brief 2020, 31, 105797. [Google Scholar] [CrossRef]
  74. Duan, N.; Dong, B.; Wu, B.; Dai, X. High-solid anaerobic digestion of sewage sludge under mesophilic conditions: Feasibility study. Bioresour. Technol. 2012, 104, 150–156. [Google Scholar] [CrossRef]
  75. Li, H.; Si, D.; Liu, C.; Feng, K.; Liu, C. Performance of directan aerobic digestion of dewatered sludge in long-term operation. Bioresour Technol. 2018, 250, 335–364. [Google Scholar] [CrossRef] [PubMed]
  76. Pavi, S.; Kramer, L.E.; Gomes, L.P.; Miranda, L.A.S. Biogas production from co-digestion of organic fraction of municipal solid waste and fruit and vegetable waste. Bioresour. Technol. 2017, 228, 362–367. [Google Scholar] [CrossRef] [PubMed]
  77. Giordano, A.; Di Capua, F.; Esposito, G.; Pirozzi, F. Long-term biogas desulfurization under different microaerobic conditions in full-scale thermophilic digesters co-digesting high-solid sewage sludge. Int. Biodeterior. Biodegrad. 2019, 142, 131–136. [Google Scholar] [CrossRef]
  78. Zawieja, I.E. The course of the methane fermentation process of dry ice modifi ed excess sludge. Arch. Environ. Prot. 2019, 45, 50–58. [Google Scholar]
  79. Sidełko, R.; Janowska, B.; Walendzik, B.; Siebielska, I. Two composting phases running in different process conditions timing relationship. Bioresour. Technol. 2010, 101, 6692–6698. [Google Scholar] [CrossRef] [PubMed]
  80. Chiumenti, A.; da Borso, F.; Limina, S. Dry anaerobic digestion of cow manure and agricultural products in a full-scale plant: Efficiency and comparison with wet fermentation. Waste Manag. 2018, 71, 704–710. [Google Scholar] [CrossRef]
  81. Appels, L.; Baeyens, J.; Degreve, J.; Dewil, R. Principles and potential of the anaerobic digestion of waste-activated sludge. Prog Energy Combust Sci. 2008, 34, 755–781. [Google Scholar] [CrossRef]
  82. Waweru, M.; Herrygers, V.; Van Langenhove, H.; Verstraete, W. Process engineering of biological waste gas purification. In Biotechnology Set, 2nd ed.; Wiley: Hoboken, NJ, USA, 2008. [Google Scholar]
  83. Zhang, Y.; Banks, C.J. Impact of different particle size distribution on anaerobic digestion of the organic fraction of municipal solid waste. Waste Manag. 2013, 33, 297–307. [Google Scholar] [CrossRef] [Green Version]
Figure 1. Block diagram of the ERWP model.
Energies 14 03118 g001
Figure 2. Percentage of waste components in two particle size fractions.
Energies 14 03118 g002
Figure 3. Percentage of four groups (I–IV) in two particle size fractions.
Energies 14 03118 g003
Table 1. Percentage shares of waste components and classification into four different groups.
No.ComponentsMixed (1)>80–90 mm (1)<80–90 mm (1)
%(w/w)%(w/w)Group, No%(w/w)Group, No
1Kitchen (BIO1)25.10.9III12.7III
2Park, garden (BIO2) 0.30.6III0.3III
3Organic (BIO3)0.65.9III34.7III
4Wood0.61.3II0.6II
5Paper14.622.4I9.8II
6Plastic14.132.6I5.7II
7Glass8.61.4I11.1I
8Textiles3912.7II0.6II
9Metals21.4I1.3I
10Multicomponent3.66.5II1.5II
11Other9.514.2IV21.7IV
<20 mm17.7----
(1) Own study.
Table 2. List of abbreviations.
BOFBiodegradable Organic FractionBHDSBiological Half-Digested Sludge
BSACBiological Stabilisation in Air ConditionCSPCogeneration System Plant
DMF/WMFDry/Wet Methane FermentationGPPGas Production Plant
GPIGas Pretreatment InstallationHHV/LHVHigher/Lower Heating Value
HMHarmful MaterialsMBTPMechanical Biological Treatment Plant
MTPMechanical Treatment PlantRDFRefuse-Derived Fuel
RMRecyclable Materials SRM Separated Row Materials
SS Sewage Sludge
Table 3. Mass balance equations.
MassEquation (1)Eq. No.Assumption (1)
mf1mf3(WBOF − WDF)/(WDF − WSS)(1)mDF ∙WDF = ∑(miWi)
mf2mSS − mf1(2)part of SS to WMF process
mf3mmix(%fr>90 mm ∙% No III +%fr<90 mm∙%No III)0.01(3)Group No III of both fractions
mi1∆m (mf3+ mf1)(4)m, as a result of om reduction
mi2mmix(%fr>90 mm ∙%No II + %fr<90 mm∙%No II)0.01(5)Group No II of both fractions
mi3mCS⋯0.4 + mBIO⋯0(6)worn out furniture, doors, …: Cs, wood and branches: BIO
(1) Own study.
Table 4. Equations used to determine HHV and LHV in MJ/kg depending on the chemical composition.
MaterialsEquationR2References
Over sieve fraction of MSWHHV = 0.3491C + 1.1783H + 0.1005S − (0.1034O + 0.0151N + 0.0211A)0.85[65]
Sewage SludgeHHV = 0.2322C + 0.7655H − 0.072O + 0.0419N+ 0.0698S +
0.0262Cl + 0.18814P
-[66]
Biomass materialsHHV = 0.328C + 1.4306H + 0.0929S − 0.0237N − (1 − A/100)∙
(40.11H/C) + 0.3466
-[67]
CR- sifted ballast after composting of MSW and MTR- rejected after manual separationLHVd = HHV − (212.2H + 0.8(O + N))
LHVw = HHVd − ((1 − 0.01M) − 24.43M)
-[48]
Table 5. The indicators used to determine WFI and DRI yield of gas production.
Raw MaterialsT °CM %GP dm3/kg dmCH4 %(vol)HRT dReferences
SS3695.556.5-28[72]
SS3598.464.772.327[73]
SS3590171-4 ÷ 59[74]
SS5582.5164 ÷ 233-30[75]
OFMSW + SS3597.77664.627[73]
OFMSW + SS358021576.5-[76]
OFMSW + SS3589.3265 ÷ 311-44 ÷ 71[77]
OFMSW + FVW + SS3580433.980.8-[76]
FVW: fruit and vegetable waste, HRT: hydraulic retention time, GP: gas production, M: moisture.
Table 6. Physicochemical test results.
Raw MaterialsDry Mass (dm), %Org. Matter, % dmCorg, % dmN, % dm
Group No II78.025.051.220.48
Group No II72.065.034.561.11
Sewage Sludge (SS)5.174.055.04.11
Dewatered SS21.072.051.124.04
Table 7. Mass and energy production using ERWP model.
ProcessRaw MaterialsDaily
MgGJMWh
WFImf2795.391.49
DFImf1+ mf348.3118.833
CSPmi143.5555.89154.37
CSPmi213.7335.5893.19
CSPmi30.111.783.26
Publisher’s Note: MDPI stays neutral with regard to jurisdictional claims in published maps and institutional affiliations.

