Abstract
The COVID-19 pandemic obliged the Romanian government to take drastic measures to contain the virus. More than this, they imposed the heaviest restrictions in the EU. For more than a month, during the lockdown period, everything stopped: schools and universities had only online classes, national and international flights and gatherings were forbidden, and many restrictions for travel were imposed. This paper analyzes the changes that occurred in electricity consumption linked with economic growth, during the pandemic, in Romania. For a better understanding of the correlations between gross domestic product (GDP) and electricity consumption (EC) in different economic contexts, the period 2008–2020 was divided into three series: the 2008–2012 financial crisis and the post-crisis recovery period, the 2013–2019 period of economic growth, and the Q1–Q3 2020 pandemic period. Using correlation coefficients and regression analysis, the authors found that the GDP decoupled from EC in the first period. The increase in GDP led to an increase in the consumption of electricity and the electricity produced from RESs in the second period. In Q3 2020, the real GDP is different from the calculated GDP, due to the pandemic. In Romania, the electricity consumption decreased within the first nine months of the pandemic due to the economic contraction. The electricity that comes from coal and hydropower plants suffered the biggest decrease. If the electricity that comes from NRESs can be adapted to the economic demands, the quantity of electricity that comes from RESs will be influenced by the climate conditions.
1. Introduction
If 2018 was the year with the fastest economic growth in the past ten years, 2019 brought a negative perspective among businesses due to the trade conflict between China and the United States [1], Brexit [2], South Africa’s economic [3] decline (falling 0.9% quarter on quarter), and China’s economic slowdown [4]. The end of 2019 brought more than economic contraction worldwide. In December, the first signs of a new disease, COVID-19, appeared, and almost all countries took measures to keep the spread under control. Some of them were drastic and made a big difference in terms of new cases and deaths (see China for example [5]), while other countries had a more relaxed view on the COVID-19 impact on health (the United States and Brazil).
In Europe, in the first two months of the pandemic (15 March–15 May), people worked from home and did not travel, and the energy consumption in households grew. In May and June, the restrictions were relaxed. The specialists expected the second wave in autumn, and economists hoped for a better containment policy, so the global economy will not be severely affected. Even now, more than a year after, with vaccines approved or waiting to be approved, the measures taken to contain the virus are kept by most governments. Due to this context, the energy consumption in households increased. As a result, an economic contraction in 2021 is also expected.
As the world entered a new difficult era when, due to the pandemic, everything we knew changed, electricity consumption patterns changed as well. The present study examines the changes that occurred in the Romanian electricity consumption linked with economic growth, during the pandemic. For a better understanding of the correlations between GDP and electricity consumption, in different economic contexts, the period 2008–2020 was divided into three series, each of them being analyzed individually.
The relation between GDP and electricity consumption is often described in the literature, so by analyzing the known data, the authors and readers can have an early indicator of the impact of the COVID-19 pandemic on all the economic activity in Romania. Energy consumption incorporates electricity and energy that comes from fuels used in the transport sector and heating [6].
The research aims to find answers to the following questions: (i) In which of the three studied periods is GDP correlated with electricity consumption and why? (ii) What are the electricity sources most and least correlated with the GDP? (iii) What happened with the GDP and electricity consumption in Romania during the COVID-19 pandemic?
2. Literature Review
2.1. GDP, Energy, and Electricity Consumption before COVID-19 Pandemic
GDP is the indicator that measures the economic strength of a country [7], and energy contributes to the stimulation of growth and economic development. The link between GDP and energy consumption is a subject often discussed in the literature. Depending on the country, the statistical model used, or the period taken into consideration, authors found a one-way causality, a bidirectional causality, or no causality between the two indicators (Table 1). The reasons for unalignment are linked with the economic development of the studied country, offered incentives, taxes, degree of urbanization, the price of electricity [8,9,10], and education [9]. In developed countries, energy consumption is decoupling from GDP, while in less developed countries, the correlation between them is still strong [11,12,13]. At the global level, the reasons that stay behind the decoupling of energy consumption from GDP are linked with the shift from industrial to service sector [11], the increase in energy efficiency, and the use of renewables. According to Stjepanovi (2018), energy consumption has a significant influence on the GDP in Bulgaria, Croatia, Estonia, Latvia, Lithuania, Slovakia, and Slovenia [14] and has no influence on the GDP in the Netherlands, Portugal, and Spain [12].

Table 1.
Literature review on the relationship between economic, social, demographic factors and electricity consumption.
In EU countries, the increase in energy that comes from RESs is correlated with an increase in real GDP, while an increase in energy produced from conventional sources decreases the real GDP [11,12,15]. Global, regional (EU), and national policies and technological and social conditions also have a big impact on RESs [16,17,18].
A study conducted in 69 countries shows that in the long run, there is a two-way relationship between GDP and energy that comes from RESs, highlighting that causality is running from renewable energy to exports [19]. Moreover, energy that comes from RESs supports economic growth for numerous countries [20]. More than that, a study conducted in the EU shows a higher correlation between GDP and RESs in more developed countries, while countries with lower economic growth are more reliant on NRESs [21].
The link between electricity consumption and GDP in Romania is not often described in the literature. Only a few studies show that electricity consumption is usually linked with the economic context (Table 1). Zaharia et al. [22] demonstrate that besides the GDP, population and labor growth also have a positive correlation with primary and final energy consumption. In the same context, they found that the increase in female population and healthcare expenditures lower the energy consumption.
2.2. GDP, Energy, and Electricity Consumption during COVID-19 Pandemic
Due to the measures taken all over the EU to contain the virus, the most affected industries are manufacturing, travel and transportation, retail, energy, and resources. Less affected sectors are the public sector, banking, universities, and colleges [31]. The measures were different from country to country. Previous studies show that the decrease in electricity consumption in the EU is linked to the number of confirmed COVID-19 cases and the lockdown measures [32].
In the EU (Table 2), the governments of some countries (Romania, Italy, France, Spain) adopted strict measures, while those of other countries (Sweden, Malta, and Finland) gave more recommendations than strict laws. It is important to highlight that the collected data show only the governments’ decisions and not how much the citizens respected the rules.
Table 2.
Government measures to contain the virus in EU countries (source [33,34,35,36,37]).
Even though all industries are connected, energy is the element that influenced other activity sectors the most [37]. The economic changes due to the pandemic brought about the biggest decline in energy demand in the last 70 years [38]. Furthermore, an IEA study shows that global coal demand fell by 8%, oil demand fell by 5%, gas demand fell by 2%, and electricity demand, in some countries, fell by more than 20%, but the demand for energy that comes from renewables grew [39].
Papandreou [40] shows that during the financial crisis in 2007–2009, the investments in RESs decreased, being affected by the economic slowdown. Studies show that government policies and financial help are positively correlated with investments in renewable energy [16,17,18].
During the last two centuries (Figure 1), decreases in energy demand due to different crises can be observed: 1973, OPEC oil price shock; 1979, energy crisis; 2007–2009, financial crisis [41]. The energy demand increased during and after the two world wars (1916–1918, 1939–1945).
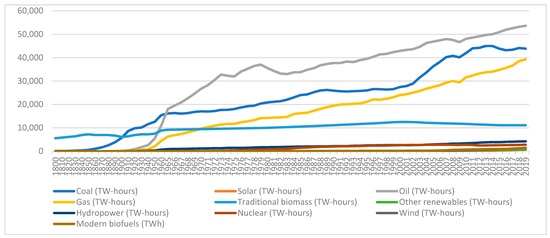
Figure 1.
Worldwide energy consumption by fuel, between 1800–2017. Own representation adapted from data [42].
Due to the novelty of the theme, only a few researchers have studied the effect of the COVID-19 pandemic on electricity consumption. Some think that the pandemic can offer a new opportunity in changing the patterns of energy production and consumption [43,44], while others show that a diversified generation mix can help in properly forecasting the electricity demand in a crisis [45].
In Turkey, the measures taken to contain the coronavirus disease (COVID-19) moved the electricity consumption from the industry sector, workplaces, and educational institutions to homes, supermarkets, and hospitals [46]. A study shows that in Italy, in the first period of the pandemic (2020), there was a 37% reduction in energy consumption compared with the same period of the previous year. The same study demonstrates that the share of electricity supplied by RESs increased [47]. In Spain, the consumption of energy dropped by 13.49% due to lockdown measures [45]. In Italy, Brazil, Japan, and the United States, the demand for electricity dropped, and coal-fired generation suffered the most. In these cases, the energy that comes from renewables increased [48].
In Romania, the first cases of COVID-19 appeared on 26 February 2020. The pandemic forced the Romanian government to take drastic measures in order to contain the virus. More than this, knowing the situation of the healthcare system, they imposed the heaviest measures in the EU (see Table 2). Only the vital subsectors remained open during the lockdown. Therefore, energy consumption decreased in industrial, commercial, and travel sectors and grew in the residential sector. Overall, in Romania, the electricity consumption was less affected by the COVID-19 pandemic when compared with more developed countries, where industry uses a higher share of electricity [49].
3. Methodology
After reviewing the literature, data about the GDP and electricity consumption in Romania were gathered from official sources. The period between 2008, the beginning of the financial crisis, and the 3rd quarter of 2020 (last known data about quarterly GDP) was selected for study to observe the evolution and relation of GDP and electricity consumption (by fuel types). INS provided us the data about quarterly growth in each economic sector from 2008 to the 3rd quarter of 2020.
On the Transelectrica (the electricity transmission and system operator in Romania) webpage there are raw data about the consumption, production, and fuel types of electric sources, calculated every 20 s [50]. After collecting all data, the quarterly consumption and production of electric energy by fuel type was calculated.
The period 2008–2020 was split into three series to answer the following research questions: (i) In which of the three studied periods is the GDP correlated with the electricity consumption? (ii) What electric sources are most and least correlated with the GDP? (iii) What happened in Romania with the GDP and electricity consumption during the pandemic?
The studied periods are described as follows:
- (a)
- Q1 2008–Q4 2012, which represents the financial crisis and the post-crisis recovery period [51].
- (b)
- Q1 2013–Q4 2019, a period of economic growth.
- (c)
- Q1 2020–Q3 2020, the pandemic period.
To find the answers to the first and second research questions, the SPSS 17 program was used to calculate the Pearson’s correlation coefficient between GDP and total electricity and the consumption of electricity that comes from coal, hydrocarbons, nuclear plants, hydro plants, wind plants, solar plants, and biomass. Linear correlation was chosen in order to find which electricity-defined variables changed at the same rate as the GDP. For the first period, Romania did not produce electricity from solar plants and biomass, so the two variables were not considered. The same correlation was used to determine whether there is a link between the GDP and electricity that comes from renewable and conventional sources. NRES represents the electricity that comes from non-renewable sources, and it was calculated in Microsoft Excel by summing the quarterly data, expressed in GW, from coal, hydrocarbons, and nuclear plants. RES, or electricity that comes from renewable sources, was calculated considering data from hydro, wind, and solar plants and biomass.
The correlation coefficient helps us determine the strength and the direction of correlations. The coefficient ranges between −1 (perfect negative correlation) and 1 (perfect positive correlation), with values from −0.9 to −0.6 indicating strong negative correlation, values from −0.59 to −0.3 indicating moderate negative correlation, values from −0.29 to −0.1 indicating weak negative correlation, values from −0.09 to 0.1 indicating no correlation, values from 0.11 to 0.3 indicating weak positive correlation, values from 0.31 to 0.6 indicating moderate positive correlation, and values from 0.61 to 0.9 indicating strong positive correlation, [52]. In this study, Pearson’s correlation coefficient (r) was used, due to the collected data. When the value of significance (2-tailed) is less than or equal to 0.05, there is a statistically significant correlation between the two variables. More specifically, the increases or decreases in one variable are significantly related to increases or decreases in the second variable.
For the third question, a descriptive analysis of the studied elements was made, compared with the same period in the years before. The Pearson correlation helped us to find the electricity sources that influenced the GDP. The data used for performing this analysis are the quarterly GDP, total electricity consumption, and the source of electricity, from Q1 2008 to Q4 2019, not considering the pandemic period (Q1–Q3, 2020). Further, the authors used regression analysis to find the difference between estimated and real GDP for Q3 2020. To predict the GDP in a certain period, aside from already described variables, it is important to consider the time variable (Q). The linear regression formula used for calculating the GDP in Q3 2020, considering the data before the pandemic, is as follows:
where a = constant; b = unstandardized coefficients for 47 quartiles; Q = Q3 2020, the quartile for which the authors want to find the GDP; c = unstandardized coefficients; X = amount of electricity that X produced in Q3 2020.
GDP = a + b ∗ Q + c ∗ X
4. Data Analysis and Discussions
Until 2008, Romanian GDP was correlated with the level of electricity consumption: the causality runs from electricity consumption to economic growth [11]. Figure 2 shows the trends in total produced electricity and in electricity that comes from RESs and NRESs, compared with the GDP. The electricity that comes from RESs increased similar to the GDP, while the electricity from NRESs decreased. When calculating the Pearson coefficient, the data demonstrate a strong positive correlation between electricity that comes from RESs and GDP (r = 0.611, sig. = 0.000) (Table 3). There is no correlation between GDP and electricity that comes from NRESs for the period Q1 2008–Q3 2020.
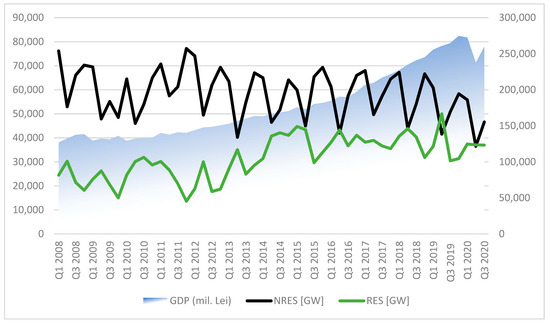
Figure 2.
Quarterly GDP and electricity from RESs and NRESs, between Q1 2008 and Q3 2020. Own representation adapted from data [50,53].
Table 3.
Pearson correlation for RES and NRES in relation to GDP, between Q1 2008 and Q3 2020.
The GDP includes the income from different sectors from agriculture, industry, construction, services, and taxes. In order to observe which economic sector influences electricity consumption, the next figure was created (Figure 3).
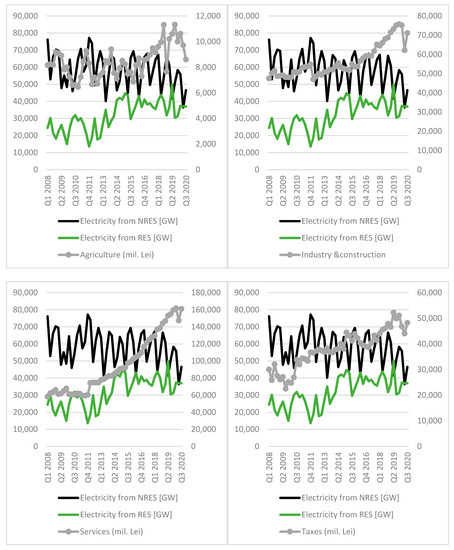
Figure 3.
Romania’s quarterly GDP (million lei) from different sources and electricity consumption, in the period Q1 2008–Q3 2020. Own representation adapted from data [50,53].
The highest correlation is between collected taxes and electricity that comes from RESs (Table 4). The reasons that stay behind the investments in RESs are linked with the taxes collected by the Romanian government, which have increased with the GDP and led to a series of incentives for green energy producers.
Table 4.
Pearson correlation of GDP components and electricity that comes from RESs and NRESs, between 1Q 2008 and Q3 2020.
The three periods of economic development, which are defined in Section 3, are highlighted in Figure 1 and show that between 2008 and 2012, energy demand decoupled from economic growth. Then, GDP grew by 20.07%, but the primary energy demand was reduced by 7.85% [30].
Studies show that the global financial crisis started in 2007, but in Romania, it had a significant impact between 2010 and 2012. For that matter, the authors chose to study the period between Q1 2008 and Q4 2012. The number of studied quarters is 20 (N = 20). Pearson’s correlation coefficient was used to determine the relationship between GDP and total electricity consumption and the consumption of electricity that comes from coal, hydrocarbons, nuclear plants, hydro plants, wind plants, solar plants, and biomass. The results show (Table 5) that GDP is not correlated with electricity consumption (r = 0.149, sig. = 0.530). As shown in the literature review, other studies that found the existence of a correlation between GDP and energy consumption in Romania were conducted prior to this period.
Table 5.
Pearson correlation between GDP and electricity produced from different types of fuels, between Q1 2008 and Q4 2012.
Global, regional (EU), and national policies and technological and social conditions also have a big impact on RESs. In Romania, studies show that the same reasons stayed behind the decrease in energy demand, combined with the increase in energy efficiency.
By analyzing Figure 3, which represents how different economic sectors contribute to the GDP and the consumption of electricity produced by RESs and NRESs, it can be observed that the share of construction and industry declined between 2008 and 2012. It is already known that the industry sector (which includes construction) uses the greatest share of energy. Data also show how the Romanian economy changed and the services share of GDP increased much more than the industry share.
Our data show that GDP is strongly and positively correlated with electricity generated by wind plants (r = 0.937, sig. = 0.000). The found correlation is in line with the studied literature, which demonstrates that with the increase in GDP, the production and usage of green energy also increase. In the same table, there is no correlation between GDP and electricity that comes from RESs. This can be explained by the fact that in this case, the electricity that comes from RESs is formed by summing the data from hydro plants and wind plants (Romania did not produce energy from solar plants and biomass in this period). However, the electricity that came from hydro plants remained the same between 2008 and 2012, because Hidroelectrica (the main producer of energy that comes from hydro plants) did not increase the number of hydro plants [54].
In the second period, Q1 2013–Q4 2019, the correlation between GDP and variables was calculated, as seen in the table below (Table 6). GDP is in moderate positive correlation with the electricity consumption (0.3 < 0.475 < 0.6, sig. = 0.011), energy produced by solar plants (0.3 < 0.476 < 0.6, sig.= 0.011), and RES (0.3 < 0.470 < 0.6, sig.= 0.012). Moreover, GDP is in moderate negative correlation with the electricity produced from coal (−0.3 > 0.420 > −0.6, sig.= 0.026). In other terms, with the increase in the GDP, the electricity consumption, electricity produced by solar plants, and electricity from RESs also increased. However, the increase in GDP led to a decrease in the use of coal to produce electricity.
Table 6.
Pearson correlation between GDP and electricity produced from different types of fuels, between Q1 2013 and Q4 2019.
5. GDP and Electricity Consumption in Romania in the COVID-19 Context
During the COVID-19 pandemic, the GDP decreased from 272,475.2 million lei in the first quarter of 2020 to 237,422.4 million lei in the second quarter of 2020 (Figure 4). It was the biggest fall in the last 20 years. The reasons behind the decrease in the GDP are linked with the imposed lockdown, along with all the measures described in Table 1.
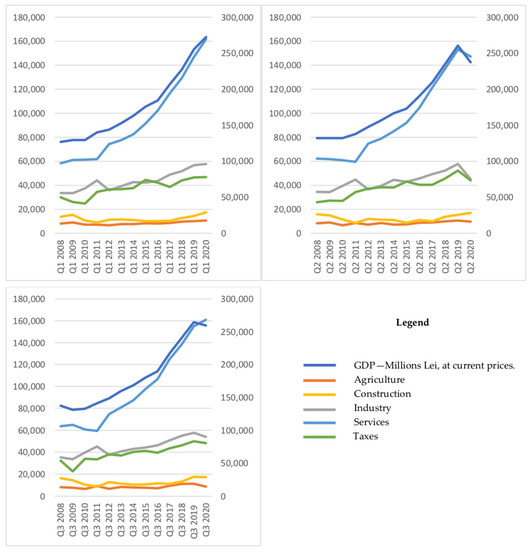
Figure 4.
Romanian GDP (million lei, at current prices) for Q1, Q2, and Q3 between 2016 and 2020 (seasonally adjusted data). Source: own representation from data [53].
Further studies will show if, in present times, electricity consumption is still linked with the GDP. As shown in the second quarter of 2020, the income from industry decreased the most, and the only sector that gained from the pandemic was the construction sector. In the third quarter of 2020, there was an increase in income in services and construction compared with the same period in the past years. Still, the share of GDP made by the industry, taxes, and agriculture is lower than that in the preceding year.
When comparing the data linked with energy consumption from 2019 to the energy consumption data from 2020, it can be observed that the greatest contraction was in the industrial sector (−14.1%), and the construction sector was the least negatively affected (+15.5%). The highest values in energy consumption were in 2018, due to the transport and industry sectors. One of the reasons for this is that 2018 was the year with the fastest economic growth in the past 10 years.
Data presented in Figure 5 shows that generated and consumed electricity decreased in the second quarter of 2020, at higher rates than in the past. Total generated electricity decreased in the lockdown period, reaching values similar to the fourth quarter of 2009 (the period of the financial crisis). If the difference between generated and consumed electricity has a positive value, Romania exports electricity. As seen from the collected data from Q1 2008 to Q3 2020, Romania is a net electricity exporter.
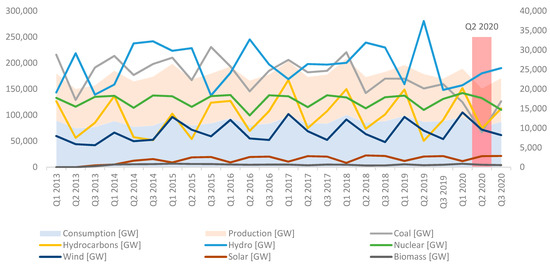
Figure 5.
Comparative analysis of generation and consumption of electricity from different fuels in Romania, from Q1, Q2, and Q3 2013–2020. Source: calculation of quarterly production of electricity, from official data [52].
Beyond the negative effects caused in agriculture, the prolonged drought of 2020 [55] also led to a decrease in the volume of electricity produced by hydropower plants (Figure 5). Romania could have easily benefited from cheap electricity in this period, but it had to be produced from other resources. Figure 5 also shows that electricity from nuclear plants decreased in the third quarter of 2020, but this happened due to a planned shutdown. The shutdowns for maintenance in 2018 and 2019 were in May, but the shutdown occurred in June in 2020.
In order to determine the level at which the GDP should have been in Q3 and what the real value was, the authors used the correlation coefficient (Table 7). For finding the answer, the authors used the data about the quarterly GDP, total electricity consumption, and the source of electricity, from Q1 2008 to Q4 2019, not considering the pandemic period (Q1–Q3, 2020).
Table 7.
Pearson correlation between GDP and electricity produced from different types of fuels, between Q1 2008 and Q4 2019.
GDP is in strong positive correlation with electricity that comes from wind plants (0.6 < 0.760 < 1, sig. = 0.000), solar plants (0.6 < 0.767 < 1, sig. = 0.000), and biomass (0.6 < 0.713 < 1, sig. = 0.000) and in moderate positive correlation with the total electricity consumption (0.3 < 0.500 < 0.6, sig. = 0.000) and electricity from hydrocarbons (0.3 < 0.349 < 0.6, sig. = 0.015). As previous studies show, there is a positive strong correlation between GDP and RES (0.6 < 0.612 < 1, sig. = 0.000). In this case, GDP is in a strong negative correlation with the electricity produced from coal (−0.6 > 0.641 > −0.1, sig. = 0.000). The results suggest that with the increase in GDP, the total consumption of electricity produced from RESs also increased. The positive side is that with the increase in GDP, the electricity used from coal (an NRES) decreases.
Furthermore, the unstandardized coefficients (Table 8) were found. The authors used linear regression analysis to find the difference between estimated and real GDP for Q3 2020. To predict the GDP in a certain period, aside from already described variables, it is important to consider the time variable (Q). In the studied period, Q = 51 (which represents the data from Q1 2008 to Q3 2020). The results indicate that the GDP can be explained only by the amount of electricity that comes from wind plants (sig. = 0.005).
Table 8.
Unstandardized coefficients for Q and wind.
The linear regression formula used for calculating the GDP in Q3 2020, considering the data before the pandemic, is as follows:
GDP = a + b ∗ Q + c ∗ Wind, where a = 101,009.410, b = 3596.464, Q = 51, c = −0.002, and wind = 8211.125. The data show the real value for the wind variable.
Applying the formula, it results that GDP for Q3 2020 is 284,412.64 million lei. The real GDP for Q3 2020 (calculated by the National Institute of Statistics) is 259,597.2 million lei. The difference (24,815.44 million lei) between the two results is due to the pandemic, which affected all economic sectors, except the construction sector.
6. Conclusions
Due to the novelty of the theme, only a few authors have studied the link between economic growth and the type of electricity source in the pandemic context. The present study covers that gap in the literature, showing that electricity consumption decouples from the evolution of GDP in different stages of economic development.
Moreover, the analyzed data demonstrate that with economic development, the share of RESs in the total produced electricity increases due to the investments in new capacities.
The results of the study show that a weak economy can lead to a decrease in investments in RESs. In the COVID-19 pandemic context, when all economies suffered losses, EU and Romanian policymakers must consider the new economic context, and they must support the investments in RESs in order to be in line with the prerogatives of the Green Deal.
The data from the period 2008–2012, which represents the global financial crisis and the recovery after the crisis, show that the GDP decoupled from electricity consumption. When analyzing the link between GDP and the production of energy from different resources, it can be observed that GDP is correlated only with the electricity that comes from wind plants. This shows that with the increase in GDP, the investment in wind plants also increases, leading to more electricity produced from this source. The reasons behind the investments in this type of RES are linked with the collected taxes by the Romanian government, which have increased with the GDP and led to a series of incentives for green energy producers. Other studies have shown that the government’s support is critical for achieving higher shares of RESs in total energy production in Poland, China, and Romania [56,57,58,59].
For the second period (2013–2019), the GDP is correlated with electricity consumption, electricity produced by solar plants, and electricity from RESs. The GDP is negatively correlated with the electricity that comes from coal.
When analyzing the data from the Q1 2008–Q4 2019 period, the results suggest that with the increase in GDP, the consumption of electricity and electricity produced from RESs also increases. The positive side is that with the increase in GDP, the use of electricity produced from coal (an NRES) decreases, but one of the drawbacks comes from the fact that the Romanian economy is not strong enough to decouple from the energy consumption. Further study is needed to determine the elements that could lead to an increase in GDP and a decrease in electricity consumption.
After months of the pandemic, all countries’ economies were affected. At the European Union level, the countries that suffered the most losses (more than 9%) were Greece, Italy, and Croatia, and the most affected industries were manufacturing, travel and transportation, retail, energy, and resources. In Romania and Italy, governments imposed strict measures to contain the virus, but Sweden’s government gave more recommendations than strict laws. Energy consumption decreased in some countries by more than 20% (IEA study). In Romania, the electricity consumption and production also decreased within 6 months of the pandemic compared with preceding years. The total generated electricity decreased in the lockdown period, reaching values similar to Q4 2009, when the effects of the financial crisis were visible.
Author Contributions
Conceptualization, I.A.I. and S.D.C.; methodology, I.A.I. and C.P.D.; resources, I.A.I., C.P.D., and S.D.C.; writing—original draft preparation, I.A.I.; writing—review and editing, C.P.D. and S.D.C. All authors have read and agreed to the published version of the manuscript.
Funding
This research received no external funding.
Institutional Review Board Statement
Not applicable.
Informed Consent Statement
Not applicable.
Conflicts of Interest
The authors declare no conflict of interest.
References
- Steinbock, D. U.S.–China trade war and its global impacts. China Q. Int. Strateg. Stud. 2018, 4, 515–542. Available online: https://www.worldscientific.com/doi/pdf/10.1142/S2377740018500318 (accessed on 1 September 2020). [CrossRef]
- Moskal, A. The impact of Brexit on the European Union’s future development in the context of European integration. Toruńskie Studia Międzynarodowe 2018, 1, 25–36. [Google Scholar] [CrossRef][Green Version]
- African Development Bank Group Homepage. Available online: https://www.afdb.org/en (accessed on 2 September 2020).
- Jakeman, M. Global Economy Watch; Pricewatershouse Coopers: London, UK, 2019; Available online: https://www.pwc.com/gx/en/issues/economy/global-economy-watch/assets/pdfs/efficient-global-economy-july-2019.pdf (accessed on 2 September 2020).
- Di Gennaro, F.; Pizzol, D.; Marotta, C.; Antunes, M.; Racalbuto, V.; Veronese, N.; Smith, L. Coronavirus diseases (COVID-19) current status and future perspectives: A narrative review. Int. J. Environ. Res. Public Health 2020, 17, 2690. [Google Scholar] [CrossRef] [PubMed]
- Our World in Data Webpage. Energy Production and Consumption. Available online: https://ourworldindata.org/energy-production-consumption (accessed on 15 January 2021).
- Soava, G.; Mehedintu, A.; Sterpu, M.; Raduteanu, M. Impact of renewable energy consumption on economic growth: Evidence from European Union countries. Technol. Econ. Dev. Econ. 2018, 24, 914–932. [Google Scholar] [CrossRef]
- Bohlmann, J.; Inglesi-Lotz, R. Examining the determinants of electricity demand by South African households per income level. Energy Policy 2021, 148, 111901. [Google Scholar] [CrossRef]
- Kwakwa, P.A. Electricity consumption in Egypt: A long-run analysis of its determinants. OPEC Energy Rev. 2017, 41, 3–22. [Google Scholar] [CrossRef]
- Xia, X.H.; Hu, Y. Determinants of electricity consumption intensity in China: Analysis of cities at subprovince and prefecture levels in 2009. Sci. World J. 2012, 2012, 1–11. [Google Scholar] [CrossRef]
- Sharma, N.; Smeets, B.; Tryggestad, C. The Decoupling of GDP and Energy Growth: A CEO Guide, 2019. McKinsey Website. Available online: https://www.mckinsey.com/industries/electric-power-and-natural-gas/our-insights/the-decoupling-of-gdp-and-energy-growth-a-ceo-guide (accessed on 5 September 2020).
- Stern, D. Energy-GDP relationship. In The New Palgrave Dictionary of Economics; Palgrave Macmillan: London, UK, 2018. [Google Scholar]
- US Energy Information Administration Homepage. Available online: https://www.eia.gov/todayinenergy/detail.php?id=33812 (accessed on 5 September 2020).
- Stjepanović, S.; Tomić, D.; Škare, M. Green GDP: An analysis for developing and developed countries. E+M Èkon. a Manag. 2019, 22, 4–17. [Google Scholar] [CrossRef]
- Alper, A.; Oguz, O. The role of renewable energy consumption in economic growth: Evidence from asymmetric causality. Renew. Sustain. Energy Rev. 2016, 60, 953–959. [Google Scholar] [CrossRef]
- Ata, N.K. The impact of government policies in the renewable energy investment: Developing a conceptual framework and qualitative analysis. Glob. Adv. Res. J. Manag. Bus. Stud. 2015, 4, 67–81. [Google Scholar]
- Azhgaliyeva, D.; Kapsaplyamova, Z.; Low, L. Implications of Fiscal and Financial Policies for Unlocking Green Finance and Green Investment (No. 861); ADBI Working Paper Series; ADB Institute: Tokyo, Japan, 2018. [Google Scholar]
- Eyraud, L.; Wane, A.; Zhang, C.; Clements, B. Who’s Going Green and Why? Trends and Determinants of Green Investment; IMF Working Paper No. WP/11/296; IMF: Washington, DC, USA, 2011; pp. 1–38. [Google Scholar]
- Jebli, M.B.; Youssef, S.B. Output, renewable and non-renewable energy consumption and international trade: Evidence from a panel of 69 countries. Renew. Energy 2015, 83, 799–808. [Google Scholar] [CrossRef]
- Al-Mulali, U.; Fereidouni, H.G.; Lee, J.Y.; Sab, C.N. Examining the bi-directional long run relationshipbetween renewable energy consumption and GDP growth. Renew. Sustain. Energy Rev. 2013, 22, 209–222. [Google Scholar] [CrossRef]
- Ntanos, S.; Skordoulis, M.; Kyriakopoulos, G.; Arabatzis, G.; Chalikias, M.; Galatsidas, S.; Batzios, A.; Katsarou, A. Renewable energy and economic growth: Evidence from European countries. Sustainability 2018, 10, 2626. [Google Scholar] [CrossRef]
- Zaharia, A.; Diaconeasa, M.C.; Brad, L.; Lădaru, G.-R.; Ioanăș, C. Factors influencing energy consumption in the context of sustainable development. Sustainability 2019, 11, 4147. [Google Scholar] [CrossRef]
- Telatar, M.E. Electricity consumption, GDP and renewables. In Energy Technology and Valuation Issues; Dorsman, A., Westerman, W., Simpson, J., Eds.; Springer: Cham, Switzerland, 2015. [Google Scholar] [CrossRef]
- Kasperowicz, R. Electricity consumption and economic growth: Evidence from Poland. J. Int. Stud. 2014, 7, 46–57. [Google Scholar] [CrossRef] [PubMed]
- Bianco, V.; Manca, O.; Nardini, S.; Minea, A.A. An analysis of the electricity sector in Romania. Energy Sources B Econ. Planning, Policy 2013, 9, 149–155. [Google Scholar] [CrossRef]
- Hamdi, H.; Sbia, R. Modeling Causality between Electricity Consumption and Economic Growth in BIICS Countries; MPRA Paper 49909; University Library of Munich: Munich, Germany, 2012. [Google Scholar]
- Magazzino, C. Electricity demand, GDP and employment: Evidence from Italy. Front. Energy 2014, 8, 31–40. [Google Scholar] [CrossRef]
- Altaee, H.H.; Adam, M. Electricity consumption-GDP nexus in Bahrain: A time series analysis. J. Econ. Sust. Dev. 2013, 4, 42–51. [Google Scholar]
- Ubani, O.J.; Umeh, L.; Ugwu, L. Analysis of the electricity consumption in the South–East geopolitical region of Nigeria. J. Energy Technol. Policy 2013, 3, 20–32. [Google Scholar]
- Kayhan, S.; Uğur, A.; Bayat, T.; Fuat, L. Causality relationship between real GDP and electricity consumption in Romania (2001–2010). J. Econ. Forecast. 2010, 169–183. [Google Scholar]
- Statista Webpage. Available online: https://www.statista.com/statistics/1106302/coronavirus-impact-index-by-industry-2020/ (accessed on 1 September 2020).
- Roidt, M.; Chini, C.M.; Stillwell, A.S.; Cominola, A. Unlocking the impacts of COVID-19 lockdowns: Changes in electricity water foot-print and virtual water trade in Europe. Environm. Sci. Technol. Lett. 2020, 7, 683–689. [Google Scholar] [CrossRef]
- Roser, M.; Ritchie, H.; Ortiz-Ospina, E.; Hasell, J. Policy responses to the coronavirus pandemic. 2020. Our World in Data Webpage. Available online: https://ourworldindata.org/policy-responses-covid (accessed on 15 September 2020).
- Hirsch, C. Europe’s coronavirus lockdown measures compared. Politico. 31 March 2020. Available online: www.politico.eu/article/europes-coronavirus-lockdown-measures-compared/ (accessed on 15 September 2020).
- Brzozowski, A. Belgium extends COVID-19 lockdown by two weeks until 19 April. Euractiv. 27 March 2020. Available online: https://www.euractiv.com/section/coronavirus/news/belgium-extends-covid-19-lockdown-by-two-weeks-until-19-april/ (accessed on 15 September 2020).
- COVID-19 Protective Measures on Public Transport. Malta Public Transport Webpage. Available online: https://www.publictransport.com.mt/en/covid-19 (accessed on 10 August 2020).
- Brandt, A.R. How Does energy resource depletion affect prosperity? Mathematics of a minimum energy return on investment (EROI). Biophys. Econ. Resour. Qual. 2017, 2, 2. [Google Scholar] [CrossRef]
- Bloom, D. 5 things to know about how coronavirus has hit global energy. World Economic Forum. 18 May 2020. Available online: https://www.weforum.org/agenda/2020/05/covid19-energy-use-drop-crisis/ (accessed on 2 September 2020).
- International Energy Agency. Global Energy Review 2020; IEA Website. Available online: https://www.iea.org/reports/global-energy-review-2020 (accessed on 2 September 2020).
- Papandreou, A. The Great Recession and the Transition to a Low-Carbon Economy; FESSUD Project; 2015; Available online: http://fessud.eu/wp-content/uploads/2015/01/The-Great-Recession-and-the-transition-to-a-low-carbon-economy-Working-paper-88.pdf (accessed on 2 July 2020).
- Hamilton, J. Historical oil shocks. In Routledge Handbook of Major Events in Economic History; Randall, E., Whaples, P., Whaples, R., Eds.; Routledge: New York, NY, USA, 2013; pp. 239–265. Available online: https://econweb.ucsd.edu/~jhamilto/oil_history.pdf (accessed on 1 February 2021).
- Ritchie, H.; Roser, M. Energy Production & Changing Energy Sources. Our World of Data Webpage. Available online: https://ourworldindata.org/energy-production-and-changing-energy-sources (accessed on 5 September 2020).
- Aktar, M.A.; Alam, M.; Al-Amin, A.Q. Global economic crisis, energy use, CO2 emissions, and policy roadmap amid COVID-19. Sustain. Prod. Consum. 2021, 26, 770–781. [Google Scholar] [CrossRef]
- Jiang, P.; Van Fan, Y.; Klemeš, J.J. Impacts of COVID-19 on energy demand and consumption: Challenges, lessons and emerging opportunities. Appl. Energy 2021, 285, 116441. [Google Scholar] [CrossRef] [PubMed]
- Santiago, I.; Moreno-Munoz, A.; Quintero-Jiménez, P.; Garcia-Torres, F.; Gonzalez-Redondo, M. Electricity demand during pandemic times: The case of the COVID-19 in Spain. Energy Policy 2021, 148, 111964. [Google Scholar] [CrossRef] [PubMed]
- Bulut, M. Analysis of The Covid-19 impact on electricity consumption and production. Sak. Univ. J. Comput. Inf. Sci. 2020, 3, 285–295. [Google Scholar] [CrossRef]
- Ghiani, E.; Galici, M.; Mureddu, M.; Pilo, F. Impact on electricity consumption and market pricing of energy and ancillary services during pandemic of COVID-19 in Italy. Energies 2020, 13, 3357. [Google Scholar] [CrossRef]
- Zhong, H.; Tan, Z.; He, Y.; Xie, L.; Kang, C. Implications of COVID-19 for the electricity industry: A comprehensive review. CSEE J. Power Energy Syst. 2020, 6, 489–495. [Google Scholar] [CrossRef]
- Soava, G.; Mehedintu, A.; Sterpu, M.; Grecu, E. The impact of the COVID-19 pandemic on electricity consumption and economic growth in Romania. Energies 2021, 14, 2394. [Google Scholar] [CrossRef]
- Transelectrica Webpage. Available online: https://www.transelectrica.ro/ro/web/tel/despre-noi (accessed on 13 January 2021).
- Pelei, E.; Simionescu, M. The Effects of the Recent Economic and Financial Crisis on the Romanian Economy. In GLOBALIZATION–Economic, Social and Moral Implications, Proceedings of The International Conference Globalization–Economic, Social and Moral Implications, Beltsville, MD, USA, 7–8 April 2017; Scientia Moralitas Research Institute: Washington, DC, USA, 2017. [Google Scholar] [CrossRef]
- Levin, J.; Fox, J.A. Elementary Statistics in Social Research, 2nd ed.; Pearson Education: London, UK, 2007; ISBN 0-205-48493-X. [Google Scholar]
- Institutul National de Statistica Webpage. Available online: www.insse.ro (accessed on 10 February 2021).
- Hidroelectrica Webpage. Available online: www.hidroelectrica.ro (accessed on 10 February 2021).
- Badea, B. 2020 va fi mai Prost Decât anii Trecuţi, Din Punct de Vedere al Producţiei. Bursa. 12 June 2020. Available online: https://www.bursa.ro/bogdan-badea-ceo-hidroelectrica-2020-va-fi-mai-prost-decat-anii-trecuti-din-punct-de-vedere-al-productiei-49308932 (accessed on 20 September 2020).
- Paska, J.; Surma, T. Electricity generation from renewable energy sources in Poland. Renew. Energy 2014, 71, 286–294. [Google Scholar] [CrossRef]
- Muhammed, G.; Tekbiyik-Ersoy, N. Development of renewable energy in China, USA, and Brazil: A comparative study on renewable energy policies. Sustainability 2020, 12, 9136. [Google Scholar] [CrossRef]
- Raybould, B.; Cheung, W.M.; Connor, C.; Butcher, R. An investigation into UK government policy and legislation to renewable energy and greenhouse gas reduction commitments. Clean Technol. Environ. Policy 2019, 22, 371–387. [Google Scholar] [CrossRef]
- Marinescu, N. Changes in renewable energy policy and their implications: The case of Romanian producers. Energies 2020, 13, 6493. [Google Scholar] [CrossRef]


Publisher’s Note: MDPI stays neutral with regard to jurisdictional claims in published maps and institutional affiliations. |
© 2021 by the authors. Licensee MDPI, Basel, Switzerland. This article is an open access article distributed under the terms and conditions of the Creative Commons Attribution (CC BY) license (https://creativecommons.org/licenses/by/4.0/).