1. Introduction
The implementation of green hydrogen within the current energy system is investigated to address societal challenges as well as climate concerns, environmental impact and limited natural resources. Hydrogen is considered a potential energy carrier that can be used in transportation, central and distributed electric power, as well as in portable applications.
Increasing worldwide industrialization and transportation sector growth make it necessary to consider the decarbonization of several sectors by deploying clean energy sources in the current energy system. The most demanding sectors are heavy industry and transportation with a total final consumption worldwide in 2017 of 32,807 and 32,658 TWh, respectively [
1]. The related electrical final consumption were 8945 and 364 TWh for industry and transport, respectively [
2]. Thereby, global CO
2 emissions by sector worldwide leveled to 32.84 Gt, with a 19% share for industry, 25% for transport and 41% for electricity and heat producers due to the use of fossil fuel-based energy sources [
3]. As a consequence, the 21st Conference of the Parties (COP) that led to the Paris Climate Agreement set out to limit the global temperature increase to 2 °C, with an optimal target of 1.5 °C [
4]. In order to achieve these goals, a pathway centered around zero-emission technologies is recommended, along with a reduction in emitting infrastructure [
4]. The major potential routes for restricting the greenhouse gas production are nuclear power, renewable sources, fossil fuels in conjunction with carbon capture and storage techniques, or a combination of these techniques [
5]. Each country develops its own energy transition program and amongst these, Germany is of interest with its initiative to withdraw from nuclear power by 2022 and from coal-based power generation by 2038, while aiming at CO
2 emissions reduction of 80%–95% by 2050 against 1990 levels by means of renewable energy sources, together with an efficiency increase in its current resource use [
6]. To achieve such drastic emissions reduction across all sectors, the energy system must utilize renewable energy and integrate it into the current supply chain for the transport and industrial sectors. In this scheme, hydrogen will play a key role as an energy carrier, especially if it is produced using renewable energy. However, the transport of hydrogen from source to sink remains challenging because of the lower volumetric energy density of hydrogen (normal pressure: 3 kWh/m
3) compared to fossil fuels (8760 kWh/m
3). In addition, there is currently no optimal approach to either hydrogen storage or transport with respect to a variety of applications, as is shown by Reuß et al. [
7] or Yang and Ogden [
8].
Electric mobility is expected to play a key role in the decarbonization of the energy system. Fuel cell electric vehicles (FCEV) and battery electric vehicles (BEV) are considered for electric vehicles. It has been shown that BEVs and FCEVs could substantially reduce environmental impacts as well as total costs of ownership. However, the range of BEV is lower than the range of the FCEV and refueling times are significantly higher. Moreover, both technologies have different stages of maturity with a fuel supply infrastructure that has an important impact in the overall life cycle [
9]. Hydrogen can play a key role to extend the driving range of an electric vehicle as well as to avoid peak demand increases and to reduce the curtailment of renewable power. De Tena et al. analyzed in the horizon of 2050 the implications of different scenarios of electric vehicles and renewable power generation on the future power system in Germany and Europe. It has been shown that within the assumptions considered 3.5 to 4.5 GW of the residual peak load in Germany can be avoided that leads to efficiency gains of 10% of the electricity demand of plug-in electric vehicles compared with uncontrolled loading [
10]. The role of hydrogen in mobility is currently assessed in different studies in terms of development costs of the infrastructure from the production to the storage and the conversion in the fuel cell. Singh et al. compiled the use of hydrogen in the transport sector [
11]. Iordache et al. indicated that hydrogen is a part of solutions in the decarbonization of the transport sector, and the roll-out’s analysis of the hydrogen refueling station network in the EU suggests the need for the development of an adequate hydrogen refueling infrastructure [
12]. For example, Germany’s national strategy estimates in mobile application an average hydrogen need of 4 and 220 TWh for 2030 and 2050, respectively [
13]. To fulfill such a demand, studies are carried out to optimize the hydrogen transportation system for mobility. Hydrogen can either be transported by pipelines [
14,
15,
16,
17] or by compressed-gas trucks [
18,
19] or via chemical carriers like liquid organic or ammonia [
20,
21]. Hurskainen et al. [
22] compared the truck-based hydrogen delivery based on the compressed gas (CGH
2, 250 and 350 bar storage pressure) or LOHC alternatives for several discrete transport distances ranging from 50 to 300 km. The authors concluded that for hydrogen demands from 3600 kg/d upwards and transportation distances of at least 100 km, LOHC-based transport is the more cost-effective option compared to CGH
2 transport. For the transport via truck in the region of North Rhine-Westphalia, Germany, Lahnaoui et al. showed that in 2050, hydrogen will be predominantly transported and stored between the storage nodes and the distribution hubs at a high-pressure level of 500 and 540 bar, whilst it will be mainly transported at 250 and 350 bar in 2030 [
18]. In addition, cost analysis indicates that the levelized cost of transporting hydrogen decreases with the transported capacity and increases with the trip distance. For the transport at 540 bar, the share increases with both distance and hydrogen demand from 15% below 100 km and 1 ton per day, to 99% above 100 km and 50 tons per day [
19]. Using life cycle assessment, the environmental impact has also been studied by Wulf et al. [
23] and it has been shown that, for distances below 100 km, the truck transport has less impact compared to the other technologies, while for higher distances, the pipeline solution has the least environmental impact. Further, performance and cost assessment studies considering the complete value chain from production to distribution shows that the pipeline network is more efficient if one takes into account large-scale power plants while tube trailers are more suitable for small-scale power plants [
24].
The literature survey reveals that, although various studies consider truck-based hydrogen transport, a detailed analysis regarding road-based distance calculations taking into account the different road classes within the region under consideration is lacking.
Therefore, in this paper, we chose an existing challenging example of a Germany-based FCEV-oriented scenario targeting the year 2050 [
25] for estimating a solely truck-based hydrogen-transport network, spanning from hydrogen production sites to fueling stations. The aim is to evaluate the bottlenecks of implementing hydrogen as an alternative energy carrier in the German road infrastructure by 2050. Indeed, a detailed geospatial analysis of road transportation in Germany is still lacking by only considering the transport of hydrogen by truck. By that, in this work, the German road network is modeled to create a spherical image of the hydrogen transportation network. Then, the shortest connection between a production site and a fueling station is estimated using several parameters, such as geographical distance, travel time and cost estimates. Ultimately, an optimization is performed regarding distance, time and cost in order to determine the most suitable connections between the production site and fueling station, always in conjunction with the demand and capacities of fueling stations and production sites, respectively. The model includes an optimization of the shortest physical distance considering the cost and time for hydrogen transport given by a previous model [
7] that took into account the full supply chain, from hydrogen produced by electrolysis to its storage and transportation to fueling stations. The developed model is used to estimate the most cost-efficient way to transport hydrogen in 2050 from hydrogen production sites to fueling stations by comparing the three transportation technologies of compressed gaseous hydrogen (CGH
2), liquefied hydrogen (LH
2) and liquid organic hydrogen carriers (LOHC). In addition, the model’s behavior is measured by a sensitivity analysis of different technical and economic parameters. The beeline approach alone is unable to provide accurate information with respect to the routing. It is therefore necessary to include a detour factor to conservatively adjust the distances. The model is optimized by taking into account the length, cost and travel time for the three transportation technologies. The routing analysis is very similar for CGH
2, LH
2 and LOHC technologies and it is shown that the selected trailer technology is of more importance in terms of the cost, length and time optimization process. Using total supply chain costs, the overall costs are estimated for CGH
2, LH
2 and LOHC. Additionally, the sensitivity analysis suggests that an increase in the capacity will result in a significant reduction in the hydrogen transport costs.
1.1. Hydrogen Production Sites and Fueling Stations
In order to assess the number of production sites and fueling stations needed by 2050, the model developed by Robinius et al. [
25] was used, wherein 75% of the German vehicle fleet is replaced by fuel cell cars. Scenarios that consider a broader range of hydrogen provision solutions for Germany can be found in Reuß et al. (2020) [
26]. In the scenario focused here, a total of 9968 fueling stations (with an average hydrogen supply of 850 kg/day) was calculated for Germany, with expected costs of 2 million EUR per station [
8,
27,
28]. It should be noted that the number of fueling stations is directly linked to hydrogen demand;
Figure 1 displays the estimated distribution of fueling stations in Germany in 2050. As a result, to produce the required hydrogen quantity of 2.94 million tons, an electrolysis capacity of 28 GW should be installed, with 54% of the energy from renewables curtailed, leading to an average and minimal number of 5300 full-load hours [
25].
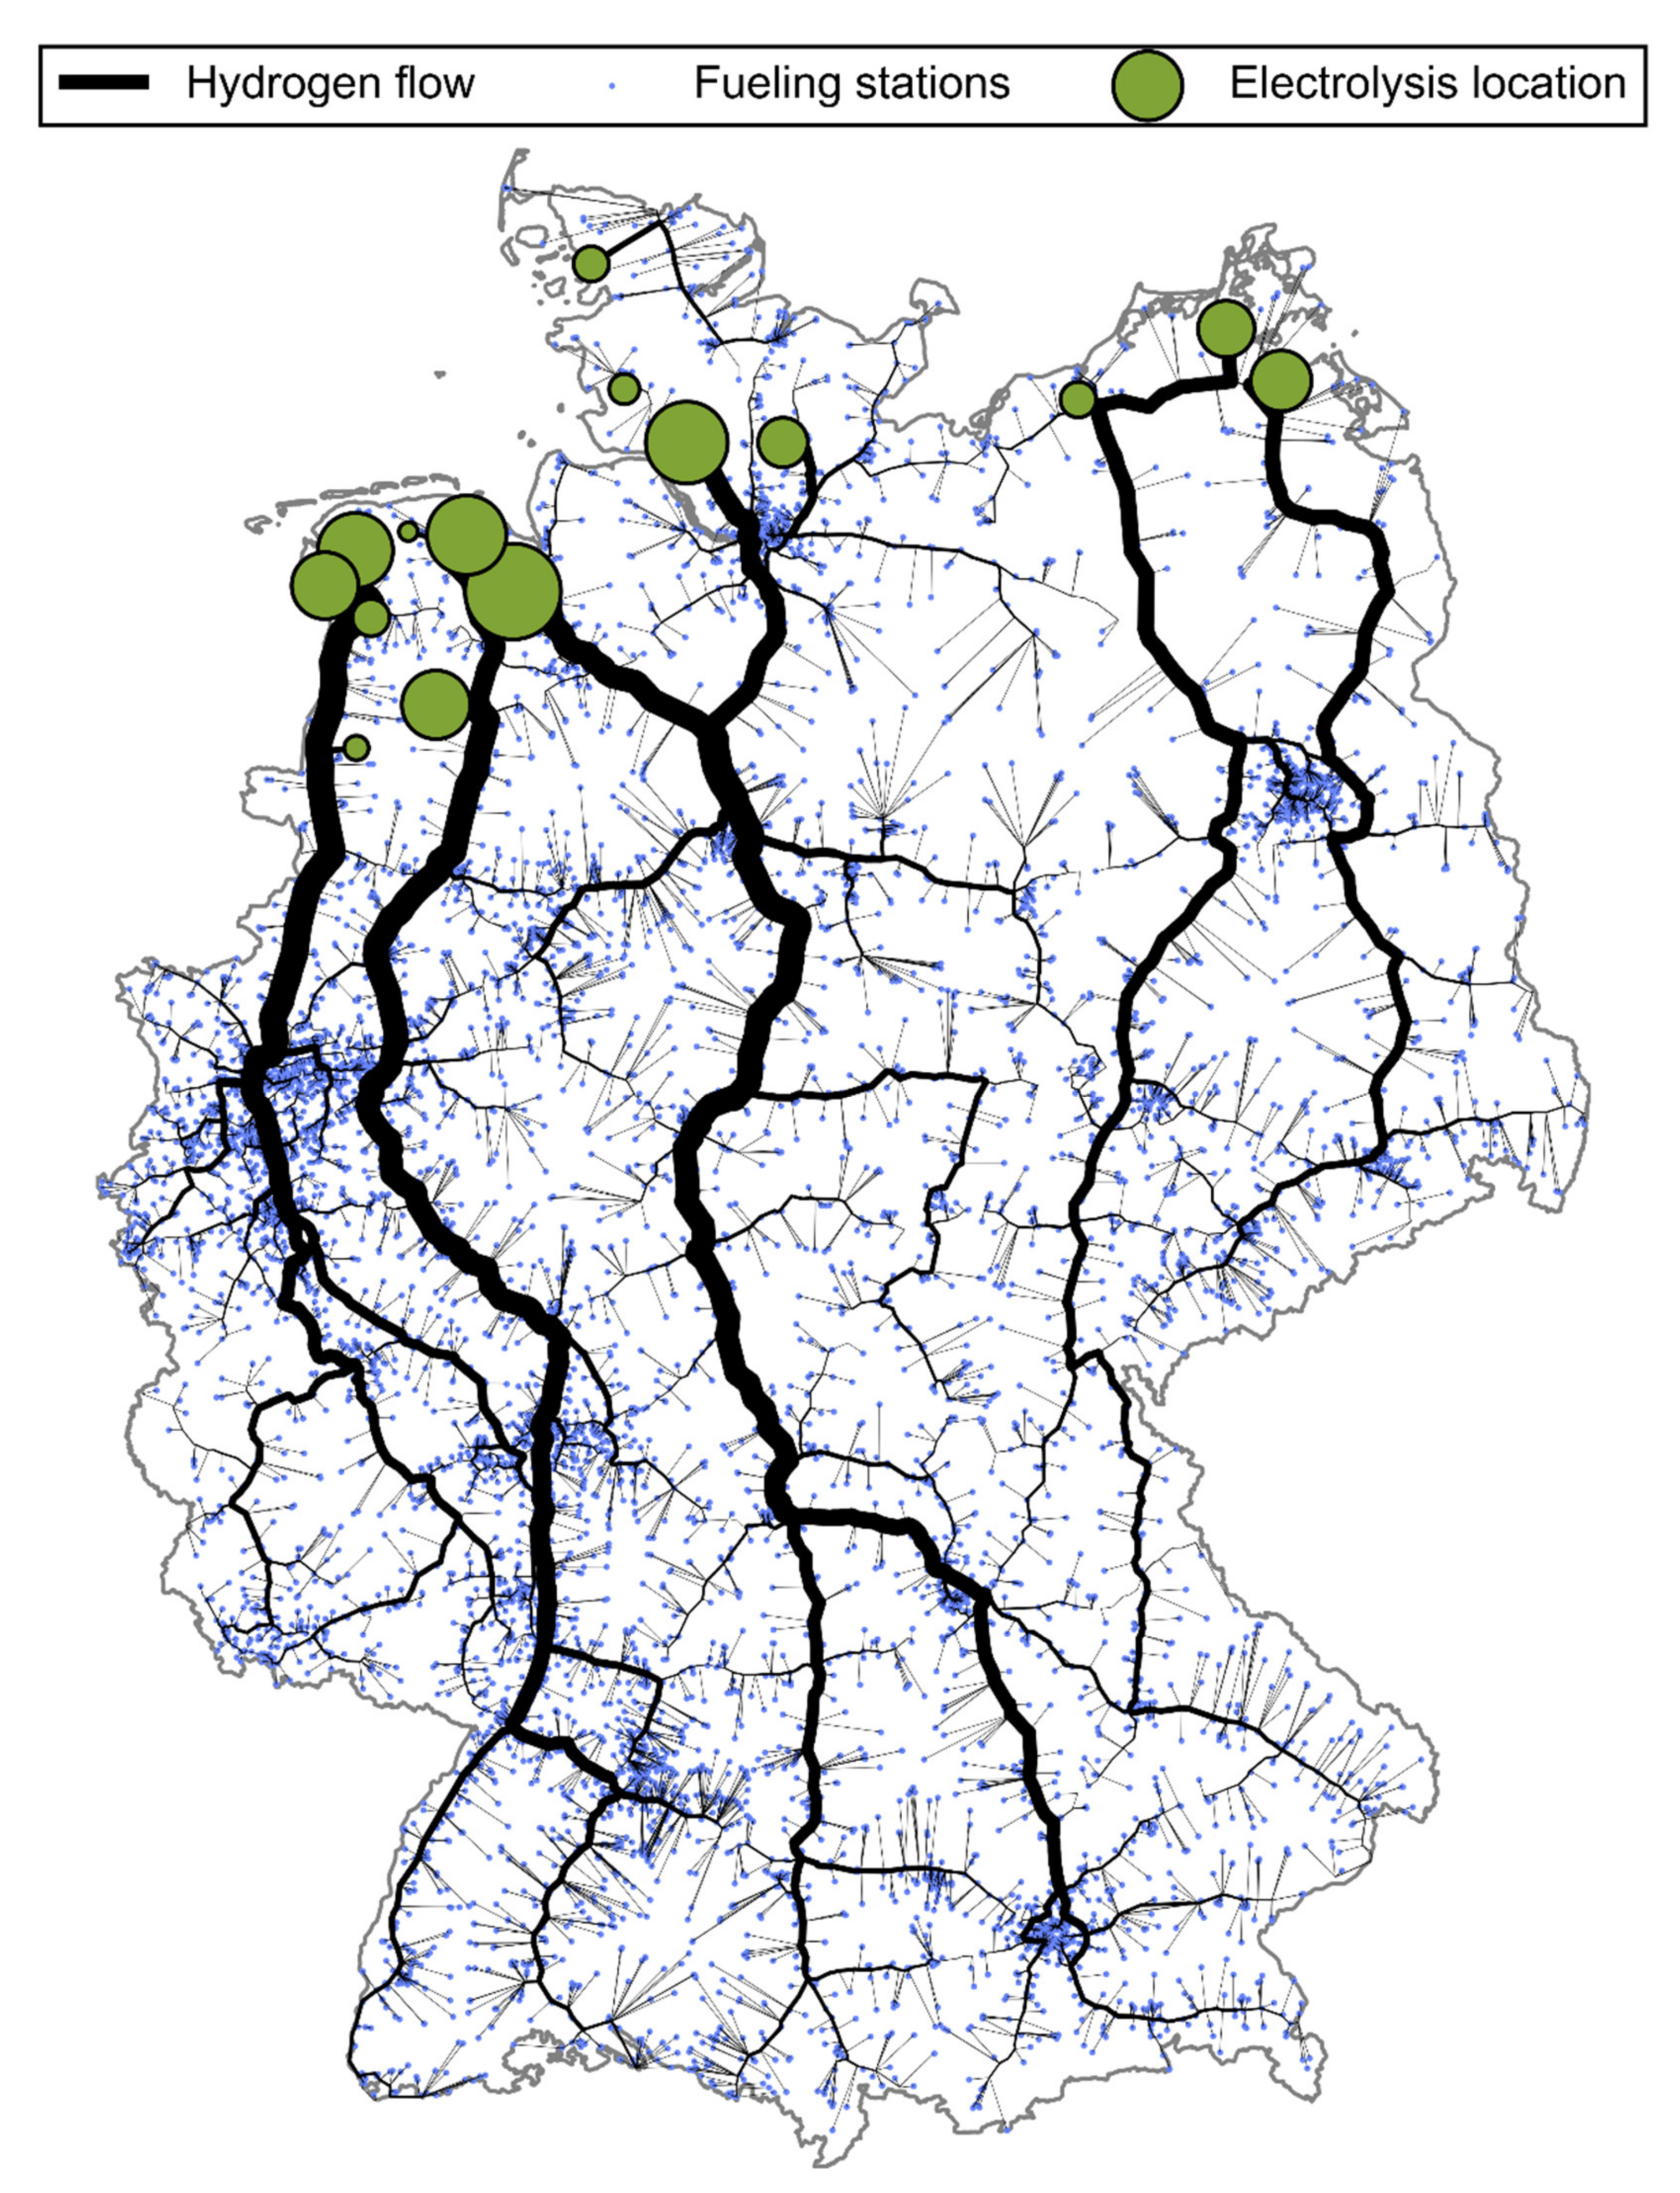
Figure 2 displays the different location sites in Northern Germany in 2050 that have the potential for an electrolysis capacity of 28 GW.
1.2. Hydrogen Storage Methods
Hydrogen storage is one the greatest technological challenges in this endeavor due to the physical and thermodynamic properties of it. Hydrogen is a highly chemically active element, but under normal conditions, it has very low volumetric density (0.09 kg/m3) compared to gasoline (0.71 kg/m3). Therefore, its state must be altered to increase its energy density by compression, liquefaction or chemical processes. Indeed, hydrogen transportation at a higher energy density leads to lower transportation costs, as it directly corresponds to transported weight and volume. Thereby, in this study we consider compressed gaseous hydrogen (CGH2), liquid hydrogen (LH2) and liquid organic hydrogen carriers (LOHCs) as hydrogen storage modes.
CGH
2 is the most common way to achieve higher densities. Today’s systems vary from 200 to 700 bar for an energy content of 3.1 to 8.8 MJ/kg, respectively [
29,
30].
LH
2 has a higher density compared to CGH
2, with 71 kg/m
3 for an energy content of up to 2.4 kWh/L. Apart from the high liquefaction energy, the major drawback is that LH
2 is transported at 20 K, which requires special cryogenic vessels with advanced insolation to keep the temperature low in order to minimize the boil-off process, as well as for safety measures. Considering the theoretical demand of electricity for the liquefaction process, the energy demand today varies from 15 to 12 kWh/kg, leading to high operating costs [
29,
30,
31,
32] compared to CGH
2. Meanwhile, new liquefaction cycles are under investigation and promising improvements are foreseen to lower the overall energy demand down to 6–7 kWh/kg, although the investment costs of these plants are higher due to additional heat recovery and precooling cycles [
7].
In LOHCs, hydrogen is not stored in pure form but within a chemical that is rich in hydrogen. In this study, dibenzyltoluene (H0-DBT)/perhydro dibenzyltoluene (H18-DBT) was considered because of its wide availability. This mainly relates to its current use as a heat transfer fluid, as well as its beneficial physical and chemical properties; the reaction enthalpy of roughly 8.9 kWh/kg of H
2 and density of 6.2 wt.% of H
2 for the total weight carrier are comparable to other hydrogen carriers [
7,
33,
34]. In addition, neither H0-DBT nor H18-DBT is classified as a flammable, toxic or hazardous good, which simplifies the hydrogen released from the LOHC by an endothermal reaction. Another advantage of DBT in comparison to other hydrogen storage methods is that it does not require any special type of transportation vessel, so the current infrastructure can be used and the storage achieved under normal conditions [
29,
35].
The energy density (and by extension the hydrogen content) and cost of the storage technology affect the decision on the most suitable hydrogen storage method for transportation. In this work, transportation is defined as transported hydrogen in kg and incorporates the comparison parameter between the three trailer technologies. Composite CGH2 trailers can reach capacities of over 1000 kg of hydrogen, while LH2 and LOHC trailers can carry over 4300 and 1800 kg of hydrogen, respectively.
1.3. Hydrogen Distribution
Considering an onshore scenario, which is also in the focus of this work, the transportation and distribution of hydrogen can be performed via trucks (special trailers for CGH2 and LH2, while conventional trailers can be used for LOHCs), pipelines, rail or ship. Each transport mode possesses specific limitations and restrictions. As mentioned above, this study only focuses on hydrogen by truck transport, with the main difference between the three trailers considered being the volume of transported hydrogen and its investment costs.
3. Results and Discussion
In order to select the proper measure, the model was optimized by considering the length, the cost and the travelling time for each of the three considered transportation technologies.
3.1. Transportation and Total Costs of Hydrogen for Different Technologies
Table 5 shows the weighted average transportation costs of hydrogen for different technologies. As could be expected from Equations (3) and (4), there was no significant difference between the length, time and cost optimization. The CGH
2 trailer in all three optimizations seemed to be the most expensive transportation technology, with around 2.7 €/kg of hydrogen. The LOHC and LH
2 trailer technologies exhibited transportation costs around 1.0 and 0.74 €/kg of H
2, respectively.
The total supply chain costs, according to
Table 4, ultimately resulted in values of 8.11 €/kg for CGH
2, 6.69 €/kg for LH
2 and 7.70 €/kg for LOHCs. The difference between the optimization paths was insignificant (the total/transportation costs are almost the same for the length, time and cost), suggesting that the selected trailer technology is of importance compared to the cost, length and time optimization process.
3.2. Routing Network for Different Technologies
Figure 3 displays the routing network (i.e., the actual representation of the trailers connected from the production sites in green to the fueling stations in blue) for the three transport options and the three routing optimization weightings. Neither the considered technology, trailer capacity or any other parameter influenced the route allocation, and the routing analysis was very similar for the CGH
2, LH
2 and LOHC technologies. Only the truck number was significantly lower for LH
2 trailer due to the higher transport capacity (4300 kg of H
2). The number of trucks necessary is defined by the thickness of the black lines in
Figure 3. The maximum truck number each day per LineString for CGH
2, LH
2 and LOHC was estimated to be 1875, 419 and 1149 trucks, respectively. Today, on certain parts of the German highway network, the number of trucks is around 1100 per day [
43], implying that the number of trucks with CGH
2 or LOHC trailers could be almost doubled by 2050. This raises concerns about traffic on specific parts of the highways, and it is anticipated that an improved infrastructure will be needed and should be planned for.
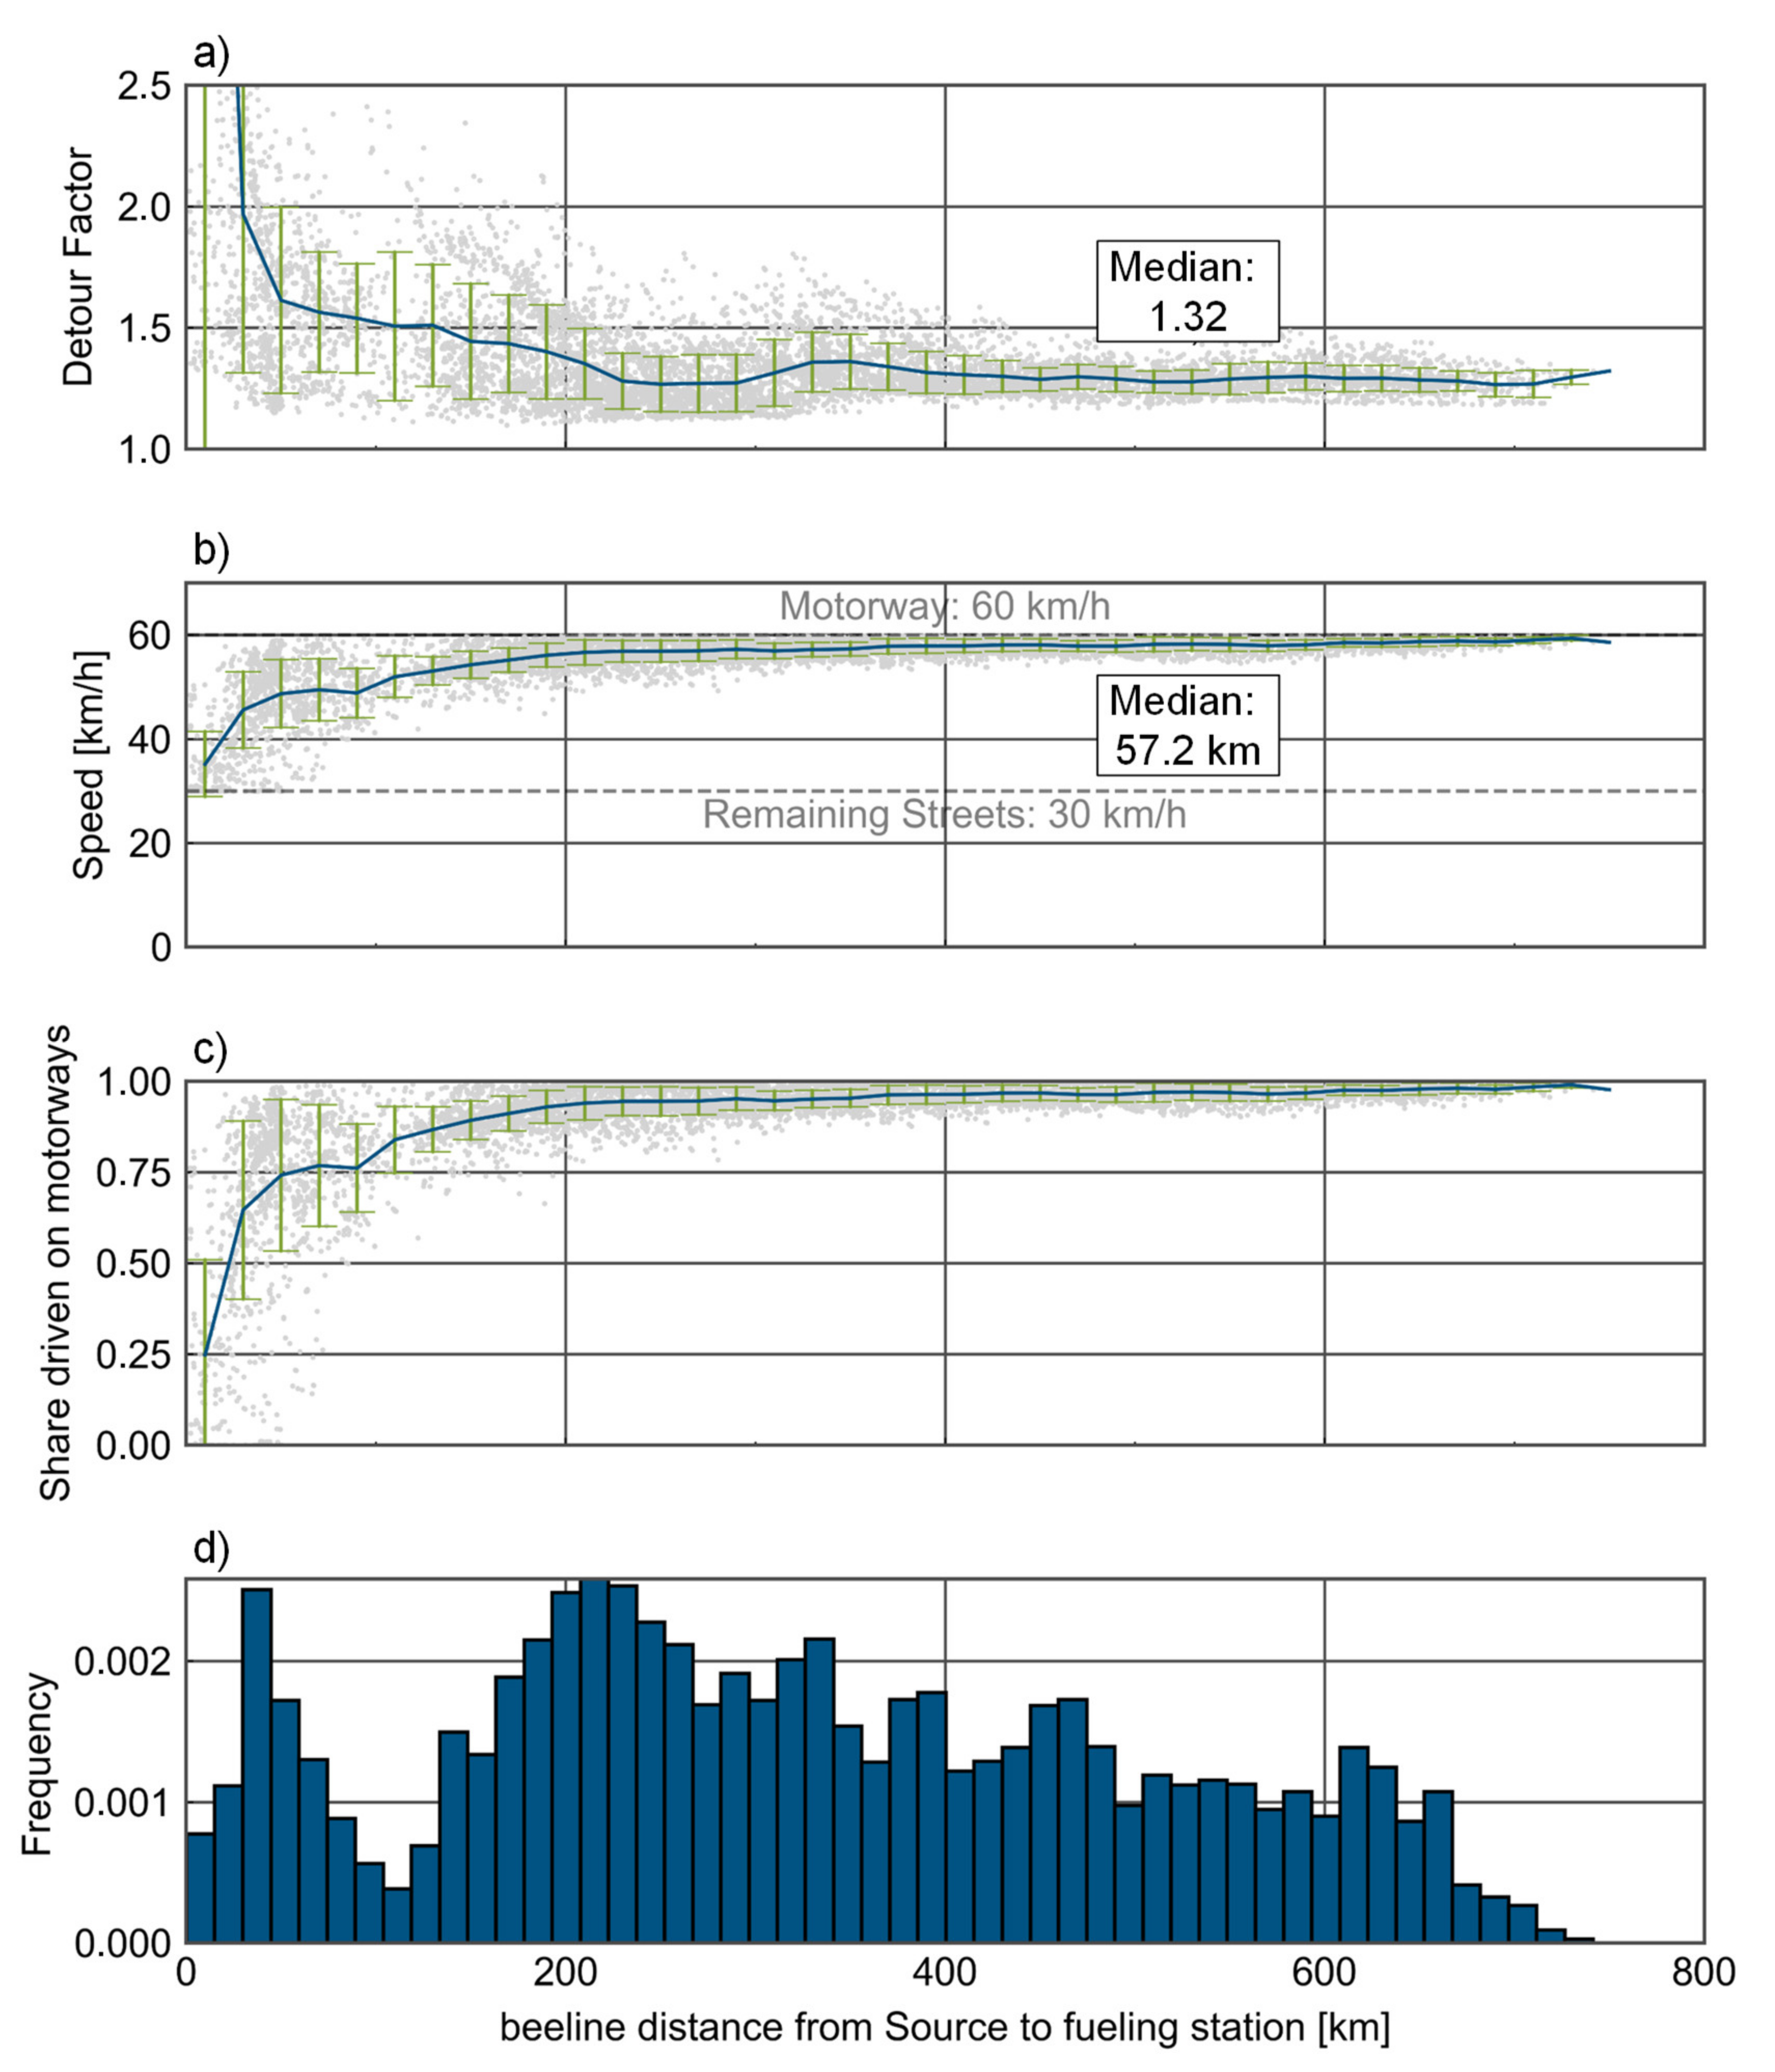
3.3. Network Results
Figure 4 displays the detailed results of each connection from source to sink for the detour factor, driven speed and share driven on highways as a function of the distance between the production site and fueling station. As can be seen, the higher the share on the highway, the higher the average speed, as the trucks mostly operate on highways rather than beelines (fueling station/production sites to highway links). In addition, the average driving speed was generally higher when the distance between the production site and fueling station was larger or when the share on the highway was greater. The mean traveling speed of trucks was 57.2 km/h, similar to other trailers and close to the 60 km/h that was taken as an assumption. According to
Figure 4, the average detour factor was 1.32, and it is clear that this factor is highly dependent on the distance. Indeed, for short distances, the detour factor was higher than the average, implying an underestimation, while for larger distances it varied between 1.2 and 1.3. By considering these network results, the single connection routing improves, and the average speed on the highway as a function of the distance is a stronger parameter than the average truck speed.
3.4. Comparison of Transportation Cost and Distance
As the routing remained the same for CGH
2, LH
2 and LOHC, the behavior of the costs was studied with regard to the distance between the production site and fueling stations.
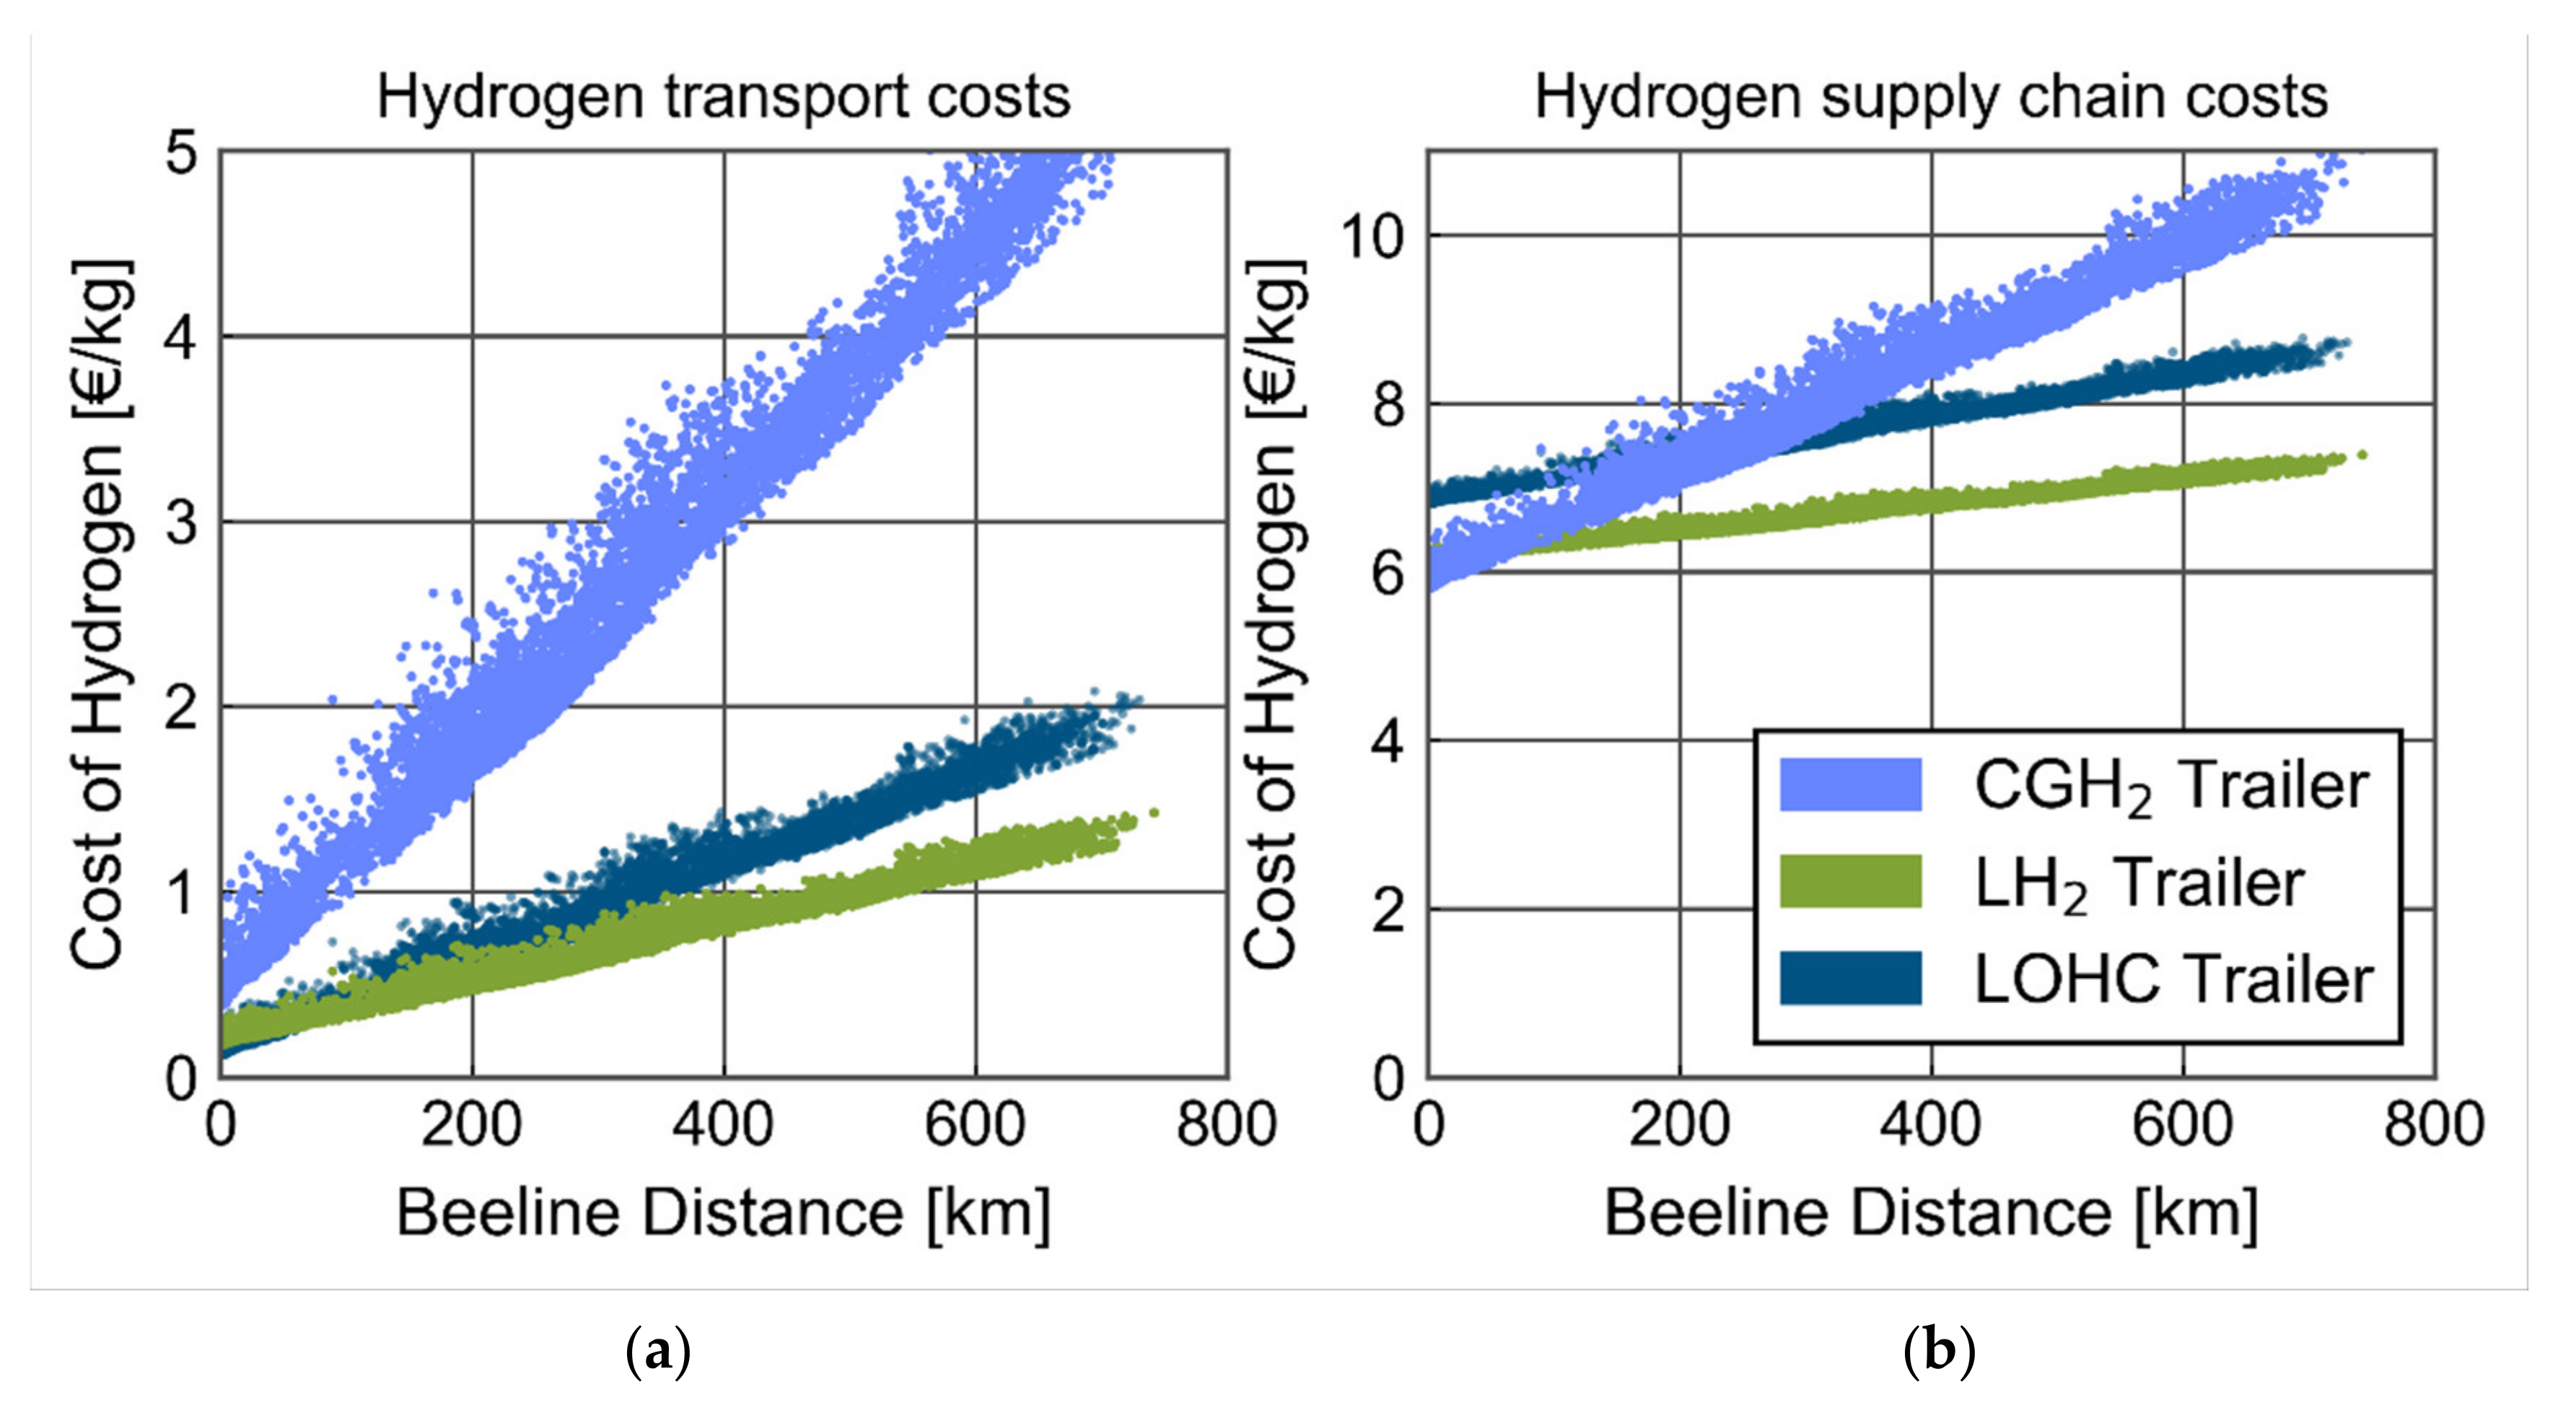
Figure 5a displays the relationship between the distance and the transportation costs for the trailers. For all of the technologies, it is clear that the distance is the most contributing parameter to the costs. The transport costs, even for low distances, are caused by the loading/unloading time. The CGH
2 had by far the most expensive transportation costs. For distances of approximately 50 km, LOHCs were competitive compared to LH
2. For longer distances, LH
2 was the most cost-effective option calculated.
Figure 5b displays the total costs of hydrogen, taking into account the supply chain costs according to
Table 4.
Table 6, in turn, presents the linear fit of the hydrogen transport costs and supply chain (total), as obtained from
Figure 5. The crossing point of the linear fits of the hydrogen supply chain costs between the CGH
2 and the LH
2 indicates the switching point between the transportation technologies. The CGH
2 technology was the most competitive for distances of up to 130 km, while for longer ones, LH
2 was superior. In contrast to the transportation costs alone, it can be pointed out that there was no crossing point between LH
2 and LOHCs with the full supply chain cost, as the entire supply chain analysis led to higher costs for the LOHC.
Each fueling station has a representative point in
Figure 5; in order to represent them accurately, linear fit lines are used. The crossing point of each line shows a different preference for the transportation technology.
The LOHC trailer was slightly more expensive than LH
2 technology for all distances. The CGH
2 costs increased, becoming sharper with length and making it the most expensive transportation technology for distances of 220 km or more.
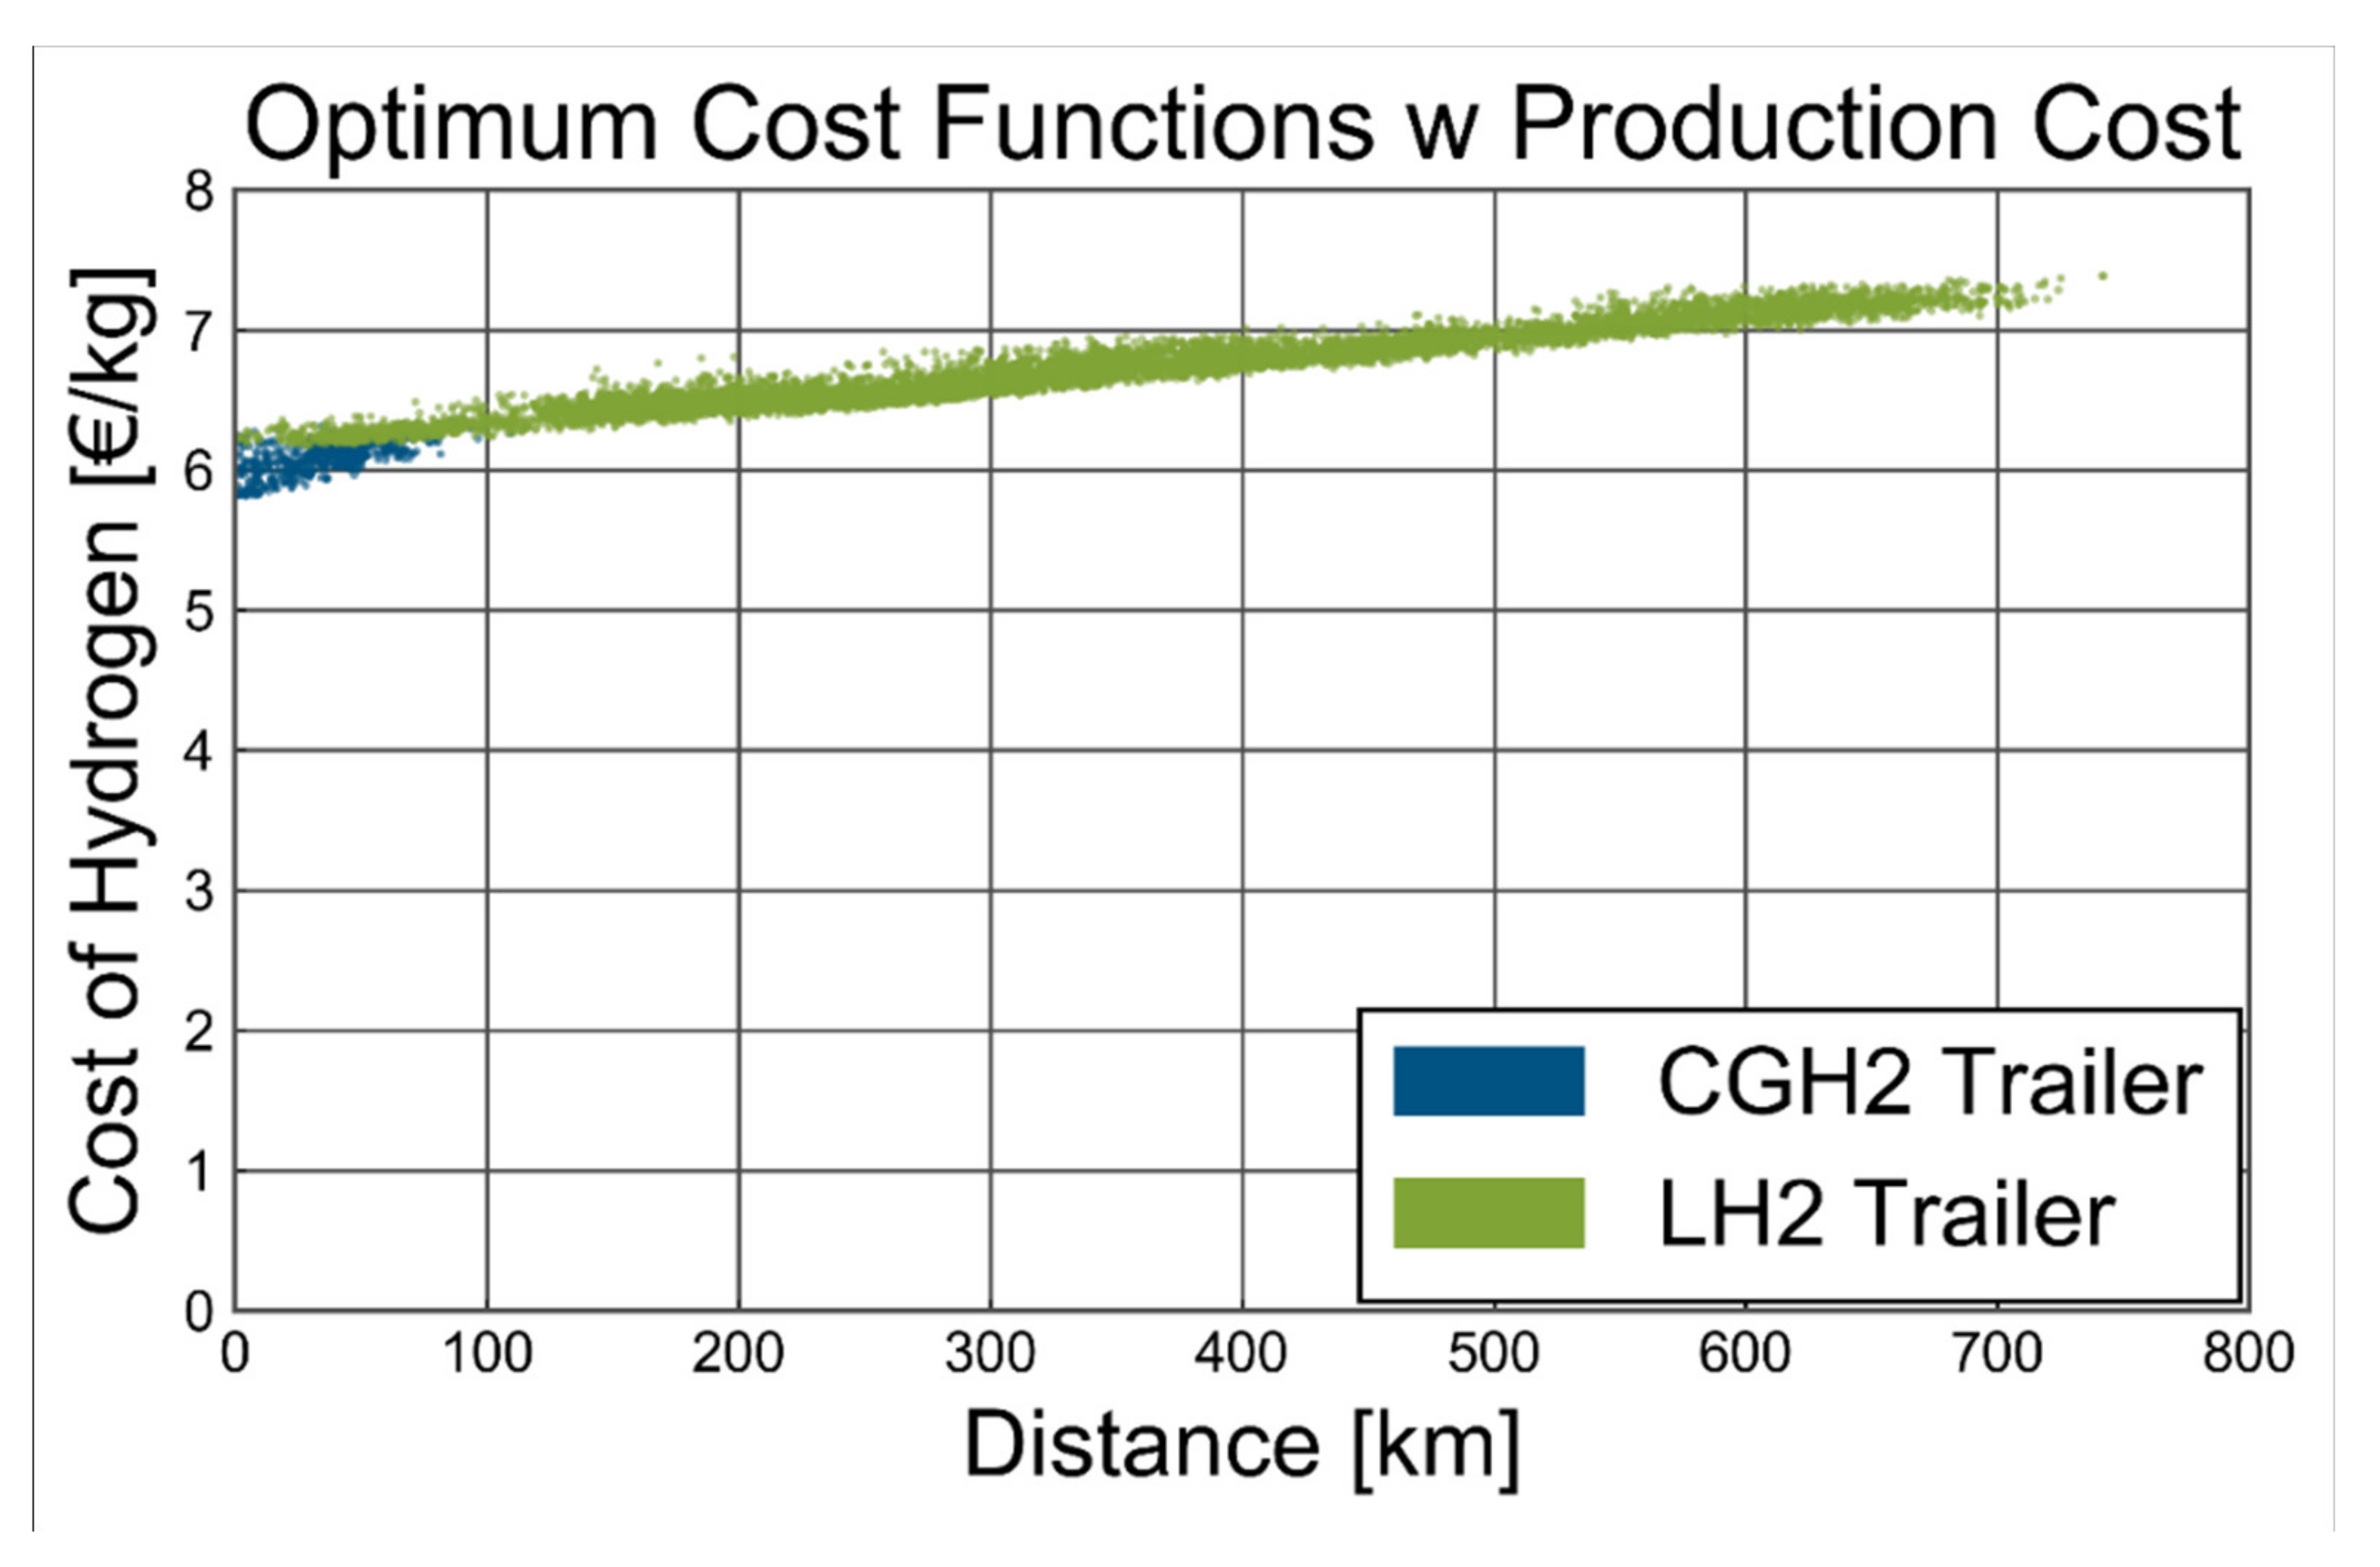
Figure 6 displays the total cost of hydrogen transported by trucks in the form of CGH
2, LH
2 and LOHC as a function of distance. Such a graph allows for the selection of an optimal solution regarding the transportation system while minimizing the costs. However, the overall cost optimization potential was fairly low, with an optimized supply chain value of 6.68 €/kg.
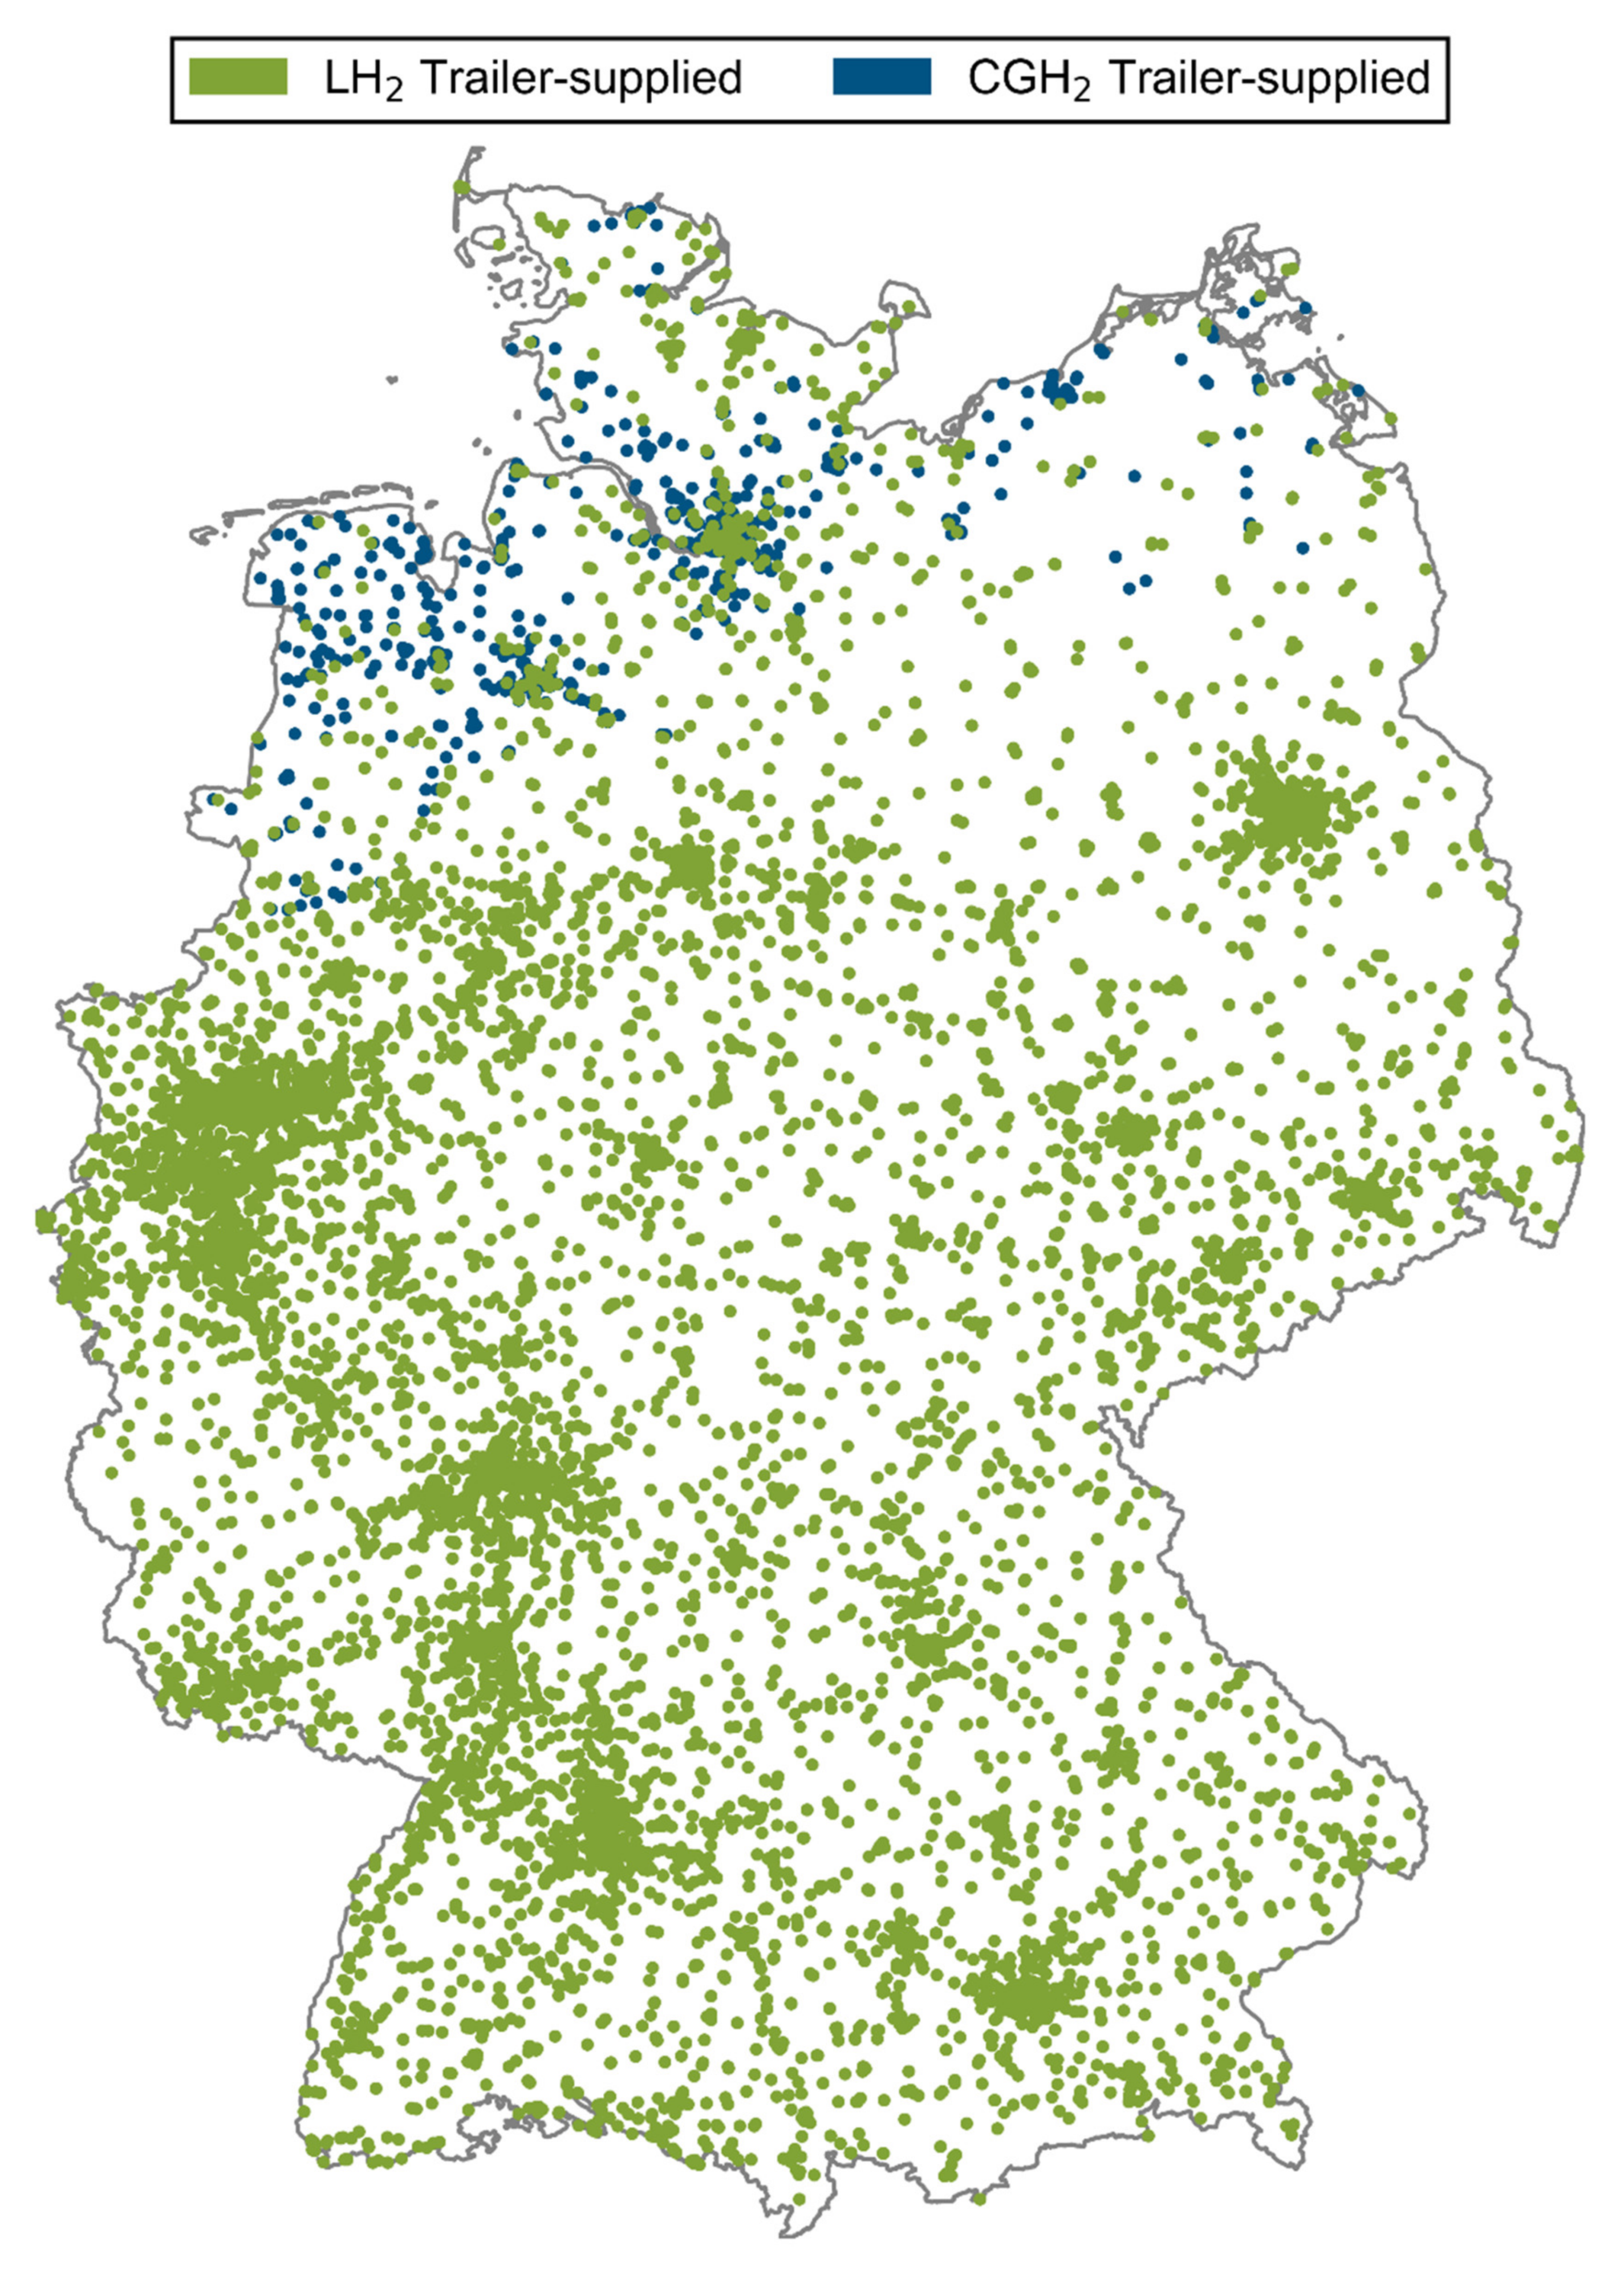
Figure 7 graphically highlights the fueling stations that use CGH
2 trailers and LH
2 trucks, considering the optimal scenario for distributing hydrogen from the production sites to the fueling stations.
In a further step, several other parameters, such as round-trip time, average speed and freight load were considered for the different technologies;
Table 7 displays a comparative summary of the weighted outcome. We observed that the majority of the results were similar, as they depend significantly on routing rather than transportation technology. The exceptions were the costs and the truck number, which mostly depend on the volume of transported hydrogen.
3.5. Sensitivity Analysis
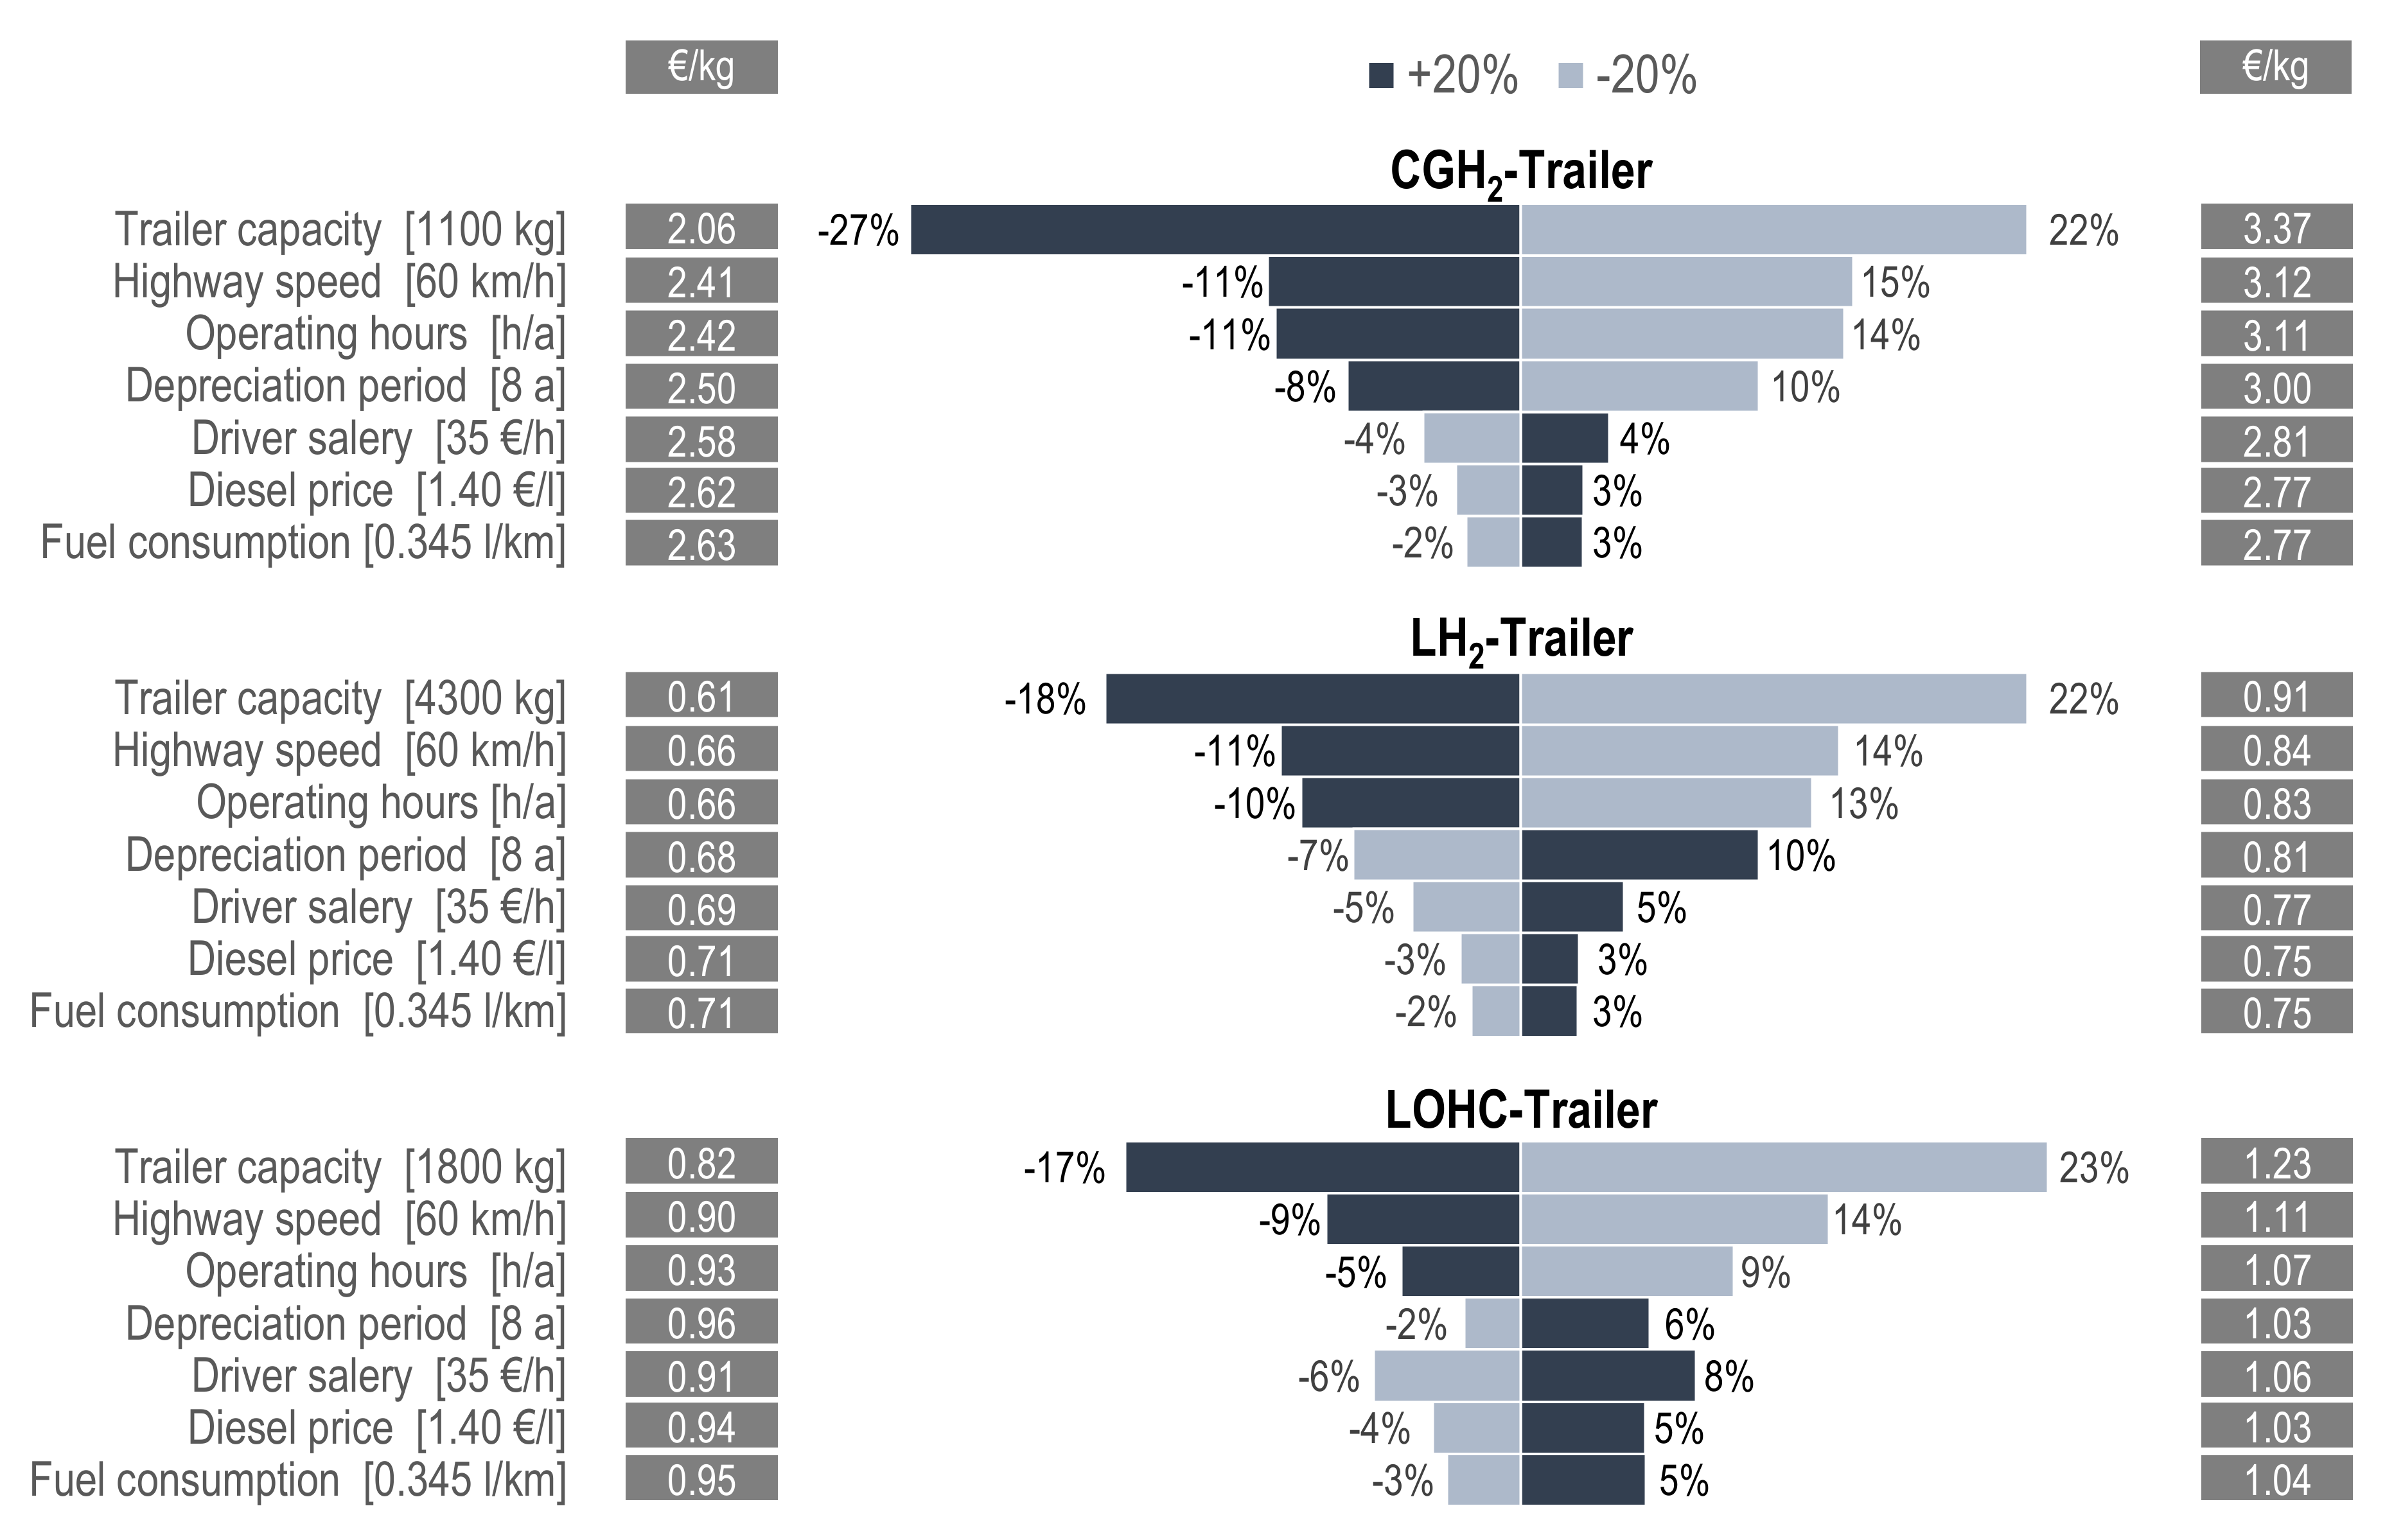
A sensitivity analysis was carried out to assess the impact of certain parameters on the transportation costs of hydrogen. Different parameters were selected and changed by ±20% to determine the model’s behavior. The transportation costs were selected separately as dependable variables for each trailer. The independent variables were the depreciation period, diesel price, operating hours, trailer capacity, driver salary, driving speed and fuel consumption. It is expected that those independent parameters will have a wide range of impacts in the future. The main challenge for the transportation system appears to be the capacity of each trailer and, as a result, it is anticipated that this will have a greater impact.
Figure 8 shows the results of the sensitivity analysis for the three technologies. For CGH
2, the capacity, highway driving speed and operational hours were the most important parameters affecting the final transportation cost. Parameters such as fuel consumption, the depreciation period and driver salary had a moderate impact on the transportation costs. For LH
2 and LOHC, the speed and operating hours were the most important parameters due to the larger effect on the calculation of the transportation costs. As can be noticed, CGH
2 had a higher sensitivity compared to the other technologies due to its high transportation cost. Generally, the OPEX
Truck parameters were examined, as they make up the biggest share of the transportation costs for all the technologies. For each technology, the highway speed and operating hours were the parameters that had the greatest influence, while diesel price and driver salary did not significantly affect the transportation costs. The CAPEX
Trailer was not examined, as it is strictly connected to the investment costs, which are expected to decrease in the future. The depreciation period had a moderate and weak impact, as it is connected to the CAPEX
Truck, which represents a small fraction of the total transportation costs.
3.6. Discussion
In terms of hydrogen transportation costs alone, LOHC trailers for short distances (50 km) and LH2 for long distances are the most cost-effective solutions. However, if supply chain costs such as the liquefaction of LH2, hydrogenation and dehydrogenation of LOHC are considered together with the costs of different fueling station types, CGH2 becomes competitive for short distances (130 km), while LH2 remains cost-effective for long distances. As expected, the transportation costs corresponded to the gravimetric storage capacity of the trailers. LH2 and CGH2 resulted in the most expensive trailers, with CGH2 trailers having the lowest capacity (assumed to be 1100 kg). The LOHC (1800 kg) is a potential carrier due its high capacity and the fact that it does not have any regulatory restrictions arising from transportation. Analytically speaking, the transportation costs for CGH2, LH2 and LOHC were 2.69, 0.73 and 0.99 €/kg of H2, respectively. There was a linear adaptation between the transport costs and distance covered. The weighted average distance between a fueling station and production site was 427 km and this distance significantly affects the operational costs of the truck (fuel consumption, travelling time, taxes). As the production sites are mainly located in the north of Germany, this average transport distance is expected to decrease for other countries that can have more distributed production. The travel time depends on the driving speed (motorway and beelines) and loading-unloading times. In addition, if the fueling station is located far from the production site, the driving speed (with an average speed of 55.8 km/h, based on the outlined assumptions) is higher, meaning less travel time, as the share of travelled distance on motorways is increasing. In future analyses, additional roads with differentiated driving speeds should be integrated in order to analyze the effects of short distances on rural streets and compare this to higher speeds on highways.
From the sensitivity analysis, an increase of 20% of the capacity results in a significant reduction in the initial transportation costs, i.e., −26.77%, −18.21% and −17.33% for CGH2, LH2 and LOHC, respectively. The capacity only affects the number of trucks per LineString; CGH2 and LOHC utilize significantly more trucks than LH2, raising concerns about traffic (by 2050, the number will almost double in comparison to today’s 1100 trucks/day on certain parts of the highway).
With respect to the comparison with Euclidean connections from source to sink, the model showed a declining detour factor with increasing distances, averaging 1.32 for the entire transport system. By adding additional roads, this factor could further decrease due to the higher density of roads, which should be considered in future studies. In addition, the implementation of alternative transport options like ships and trains could have a major influence as well and will be a topic for future work.
4. Conclusions
In this study, an analysis of the supply of 9683 hydrogen fueling stations by truck from 15 electrolysis locations in Germany was carried out by first applying Dijkstra’s shortest path algorithm on the highway grid for all available source-sink connections and optimizing the supply. The obtained results indicate that the share driven on highways and, accordingly, the average speed, increases with larger distances. In contrast, the detour factor decreases with an average value of around 1.32. It was observed that for source-sink distances below 130 km, the most cost-effective transportation mode is the CGH2, while for higher distances, LH2 is the most competitive. Thus, in our onshore wind scenario, presented here for Germany, LH2 transportation would be beneficial. In a broader context, the hydrogen transport mode is strongly dependent on other pathway-related properties, i.e., the optimal solution of hydrogen transport is not necessarily optimal when considering the entire hydrogen provision pathway. Examples are the hydrogen state at the point of production and import harbor, respectively, or the hydrogen demand at the filling station. In addition, as the presented method relies on open-source data, the approach developed in this study can be applied to different countries around the world in order to estimate the transport distances and respective costs for hydrogen transportation modes with high accuracy. Finally, the high number of up to 1849 trucks per LineString (road) per day is one of the major bottlenecks for transporting hydrogen by truck in future energy systems. Compared to the maximum truck frequencies on today’s German roads (around 1100 trucks per day), this raises concerns about the suitability of current highway infrastructure. Therefore, pipelines might be the favored option for transporting large hydrogen quantities, at least on the transmission level, where large-scale hydrogen transport is concentrated only on few LineStrings. The present model relates to a case study for Germany; nevertheless, it can be extended to other countries with mapping of the hydrogen infrastructure in the future as well as being extended to study the optimization of hydrogen transport with other means in addition to truck transport.


 ,
, 


