Article

Energy-Saving Strategies of Axial Flow Fans for Direct Dry Cooling System

1
Key Laboratory of Power Station Energy Transfer Conversion and System, Ministry of Education, Beijing 102206, China
2
School of Energy Power and Mechanical Engineering, North China Electric Power University, Beijing 102206, China
*
Author to whom correspondence should be addressed.
Energies 2021, 14(11), 3176; https://doi.org/10.3390/en14113176
Submission received: 21 March 2021 / Revised: 22 May 2021 / Accepted: 26 May 2021 / Published: 28 May 2021

Abstract

:
The operating conditions of axial flow fans are closely related to the thermo-flow characteristics of the mechanical draft direct dry cooling system. Moreover, the uneven distribution of cooling air driven by axial flow fans may lead to the deterioration of the heat transfer capacity of air-cooled condensers (ACCs). Therefore, developing energy-saving operating methods for axial flow fans is very meaningful. In this work, two kinds of adjustment strategies to make the flow field more uniform are proposed for a 2 × 300 MW direct dry cooling power-generating unit. The performance of ACCs in the prevailing wind direction is predicted with the help of the macro heat exchanger model. It is found that the inlet air temperatures of fans are significantly reduced by proposed strategies, especially at high wind speeds. Moreover, the minimum cooling air can meet the cooling demand of ACCs for the strategy which made the air flow rates of all fans consistent. Compared with the case without adjustment of fans, the total power consumption of the fan array was cut down effectively, up to 13.94% at the wind speed of 12 m/s. In conclusion, the energy efficiency of ACCs can be improved by the uniform flow field.

1. Introduction

For saving water resources and protecting the environment, the direct dry cooling system (DDCS) due to its low investment and flexible regulation has received a lot of attention and developed rapidly in the past several decades, especially in areas with water shortage. The DDCS is sensitive to environmental conditions since the cooling medium is ambient air. The flow rate of cooling air through each condenser cell varies greatly with ambient wind, which adversely affects the cooling performance of ACCs. Therefore, the regulation of axial flow fans with considerable power consumption is accepted as an effective method to improve the energy efficiency of direct dry cooling power plants.
The cooling performance of ACCs depends on the flow rate and temperature of cooling air, which varies significantly with the environmental conditions. Therefore, the influence mechanism of environmental wind on the performance of the direct air-cooling system is very important, and it was the basis of subsequent studies. Duvenhage and Kröger [1] revealed the effects of ambient wind in different directions for air-cooled condensers through numerical simulation, which mainly include the reduction in flow rates of upward fans and hot air recirculation. Rooyen and Kröger [2] studied the performance of ACC cells at different locations under windy conditions and found that the operating conditions of fans play important roles. Yang et al. [3,4] pointed out that the performance of the upwind ACC cells is poor under windy conditions, and adjusting the upwind axial flow fans or optimizing the structure of condenser cell is meaningful to improve the cooling capacity of ACCs; moreover, the deterioration of the upwind condenser cell performance and the hot air recirculation are the main adverse reasons in the wind directions of 90° and 0°, respectively. Owen and Kröger [5] investigated the effect of atmospheric temperature inversions on the fan inlet air temperature through experiments and simulations. Liu et al. [6] focused on the hot air recirculation, stating that it is greatly affected by the wind direction, and they proposed two kinds of containment measures, including the extension of the wind-wall and the regulation of fans. He et al. [7] found that the combined effect of recirculation, diffusion, and reverse irrigation leads to increased cooling air temperature and changes with wind speed and direction.
It is of great significance for the power-generating unit to enhance the performance of ACCs, especially in the case of wind conditions. Many novel layouts of ACCs have been researched. Yang et al. [8] proposed a trapezoidal layout of ACCs and found that the performance of the windward condenser cells was improved, while the hot air recirculation was also suppressed. Furthermore, ACCs with square [9], vertical [10], and circular [11,12] arrangements were studied, and the results proved that the appropriate layout of ACCs can enhance the performance of the direct dry cooling system under wind conditions. Moreover, innovative ACC cells [13,14] were proposed and proven to be effective against environmental wind interference. Unfortunately, they have hardly been applied. Moreover, many studies have suggested air guiding devices for the traditional ACCs. Huang et al. [15] studied vertically arranged multi-layer deflectors, and they determined the influence of the number, width, pitch, and inclination angle of deflectors on the cooling performance of ACCs. Gu et al. [16] proposed roof windbreak structures to withstand the ambient wind and found that windbreak with suitable parameters can produce a positive effect. Owen and Kröger [17] found that the appropriate layout of screens under the air-cooled platform is beneficial to the performance of fans. In addition, other types of diversion devices, such as a diffuser orifice plate [18] and windshield [19], have also proven to be profitable for the operation of ACCs. However, they all require additional investments.
The performance of the axial flow fan plays a key role in the thermo-flow characteristics of DDCS according to the previous researches. Adjusting the axial flow fan can reflect the advantages of low cost, effectiveness, and easy operation. Chen et al. [20] put forward various adjustment strategies of fans for ACCs and compared their performance under different ambient conditions, concluding that accelerating the speed of windward fans in the first row alone is disadvantageous for DDCS. He et al. [21] found that increasing the installation angle of fans properly can improve the net power of the direct day cooling power plant. Furthermore, they studied the adjustment schemes of the fan rotational speed [22,23] and declared that increasing the speed of upwind fans or the fan array is useful for the power-generating unit and adjusting the windward ACC cells is better than adjusting the leeward ones. Li et al. [24] investigated the optimal frequency of fans under different unit output power and environment conditions to maximize the net power, and they recommended increasing the capacity of ACCs so that the fans can operate at the optimal frequency under high loads. Wang et al. [25] studied the optimal fan operation strategies of the cogeneration of heat and power at different ambient temperatures to reduce coal consumption. Li et al. [26] associated fan performance with back pressure, and they found that the regulation of fans with high correlation coefficients can bring more benefits. In our previous research [27], it was concluded that windward fans with high rotational speed usually bring economic benefits to the power-generating unit. Moreover, the optimal rotational speeds of fan array are related to different environmental conditions, and the coal consumption may be decreased by reducing the fan speed appropriately under low temperature and wind speed [28].
In actual operation, the rotational speeds of the fans of the direct dry cooling system are usually consistent. However, the flow rate difference of the axial fans at different positions is very obvious due to the fan group effect, especially under windy conditions. Therefore, the heat transfer efficiency of ACC cells is different, which leads to the low operating efficiency of the fan array. Therefore, adjusting the fans to make the flow rate distribution uniform is beneficial to improve the utilization efficiency of the ACC cell and operating efficiency of the fan array, thereby reducing the power consumption of the fan array. The aforementioned researches placed more emphasis upon the axial flow fans by fully or partly adjusting them under multiple rotational speeds, while the energy efficiency of ACCs was rarely considered. In this work, two kinds of adjustment strategies are proposed to make the flow field of ACCs more uniform. The turbine back pressures under various environmental conditions are kept the same as the design cases. Moreover, the heat exchanger model is adopted, and the flow of exhaust steam in the pipe is considered through the UDF (user defined function) method. The power consumption of axial flow fans under different operating modes with various wind conditions is calculated in order to achieve the optimal operating strategy of fans. The remainder of this paper is organized as follows: the description of a 2 × 300 MW direct dry cooling power plant, the structure of an ACC cell, and the two adjustment strategies for the fan array are introduced in Section 2. Section 3 describes the mathematical models, the grid independence, and the experimental validation of the direct dry cooling system. Section 4 analyzes the variations in the inlet air temperatures, volumetric flow rates, rotational speeds, and power consumption of the fan array under different adjustment strategies and environmental conditions. Lastly, some conclusions are proposed in Section 5.

2. Physical Models

This paper took a 2 × 300 MW direct dry cooling power plant as the research object to study the influence of different fan speed adjustment strategies on the thermo-flow performance of a direct air-cooling system. Figure 1a displays the layout of the 2 × 300 MW direct dry cooling power plant. The boiler room, turbine hall, and ACCs are included. Each ACC was composed of 5 × 6 condenser cells. The exhaust steam of each turbine from the main exhaust pipe was distributed to six distribution pipes and delivered to the ACC cells. The five ACC cells in each column shared a distribution pipe, including three down-flow cells and two up-flow cells. The down-flow cells marked green and the up-flow cells marked yellow and red were arranged alternately in each column, with the pink arrows representing the flow directions of exhaust steam inside the finned tube bundles. The exhaust steam was cooled in the down-flow cells and the down-flow parts (marked yellow) of the up-flow cells firstly, and then uncondensed steam entered the up-flow parts (marked red) of the up-flow cells to be further condensed. The non-condensable gas was sucked away from the top of the up-flow parts by the aspirator. The wind direction of 90° blowing from the +y-axis was studied. Figure 1b demonstrates the condenser cell, including the axial flow fan, finned tube bundles, and steam duct. The cooling air passed through the finned tube bundles and exchanged heat with the steam in the tube. Figure 1c gives the arrangement and the serial numbers of condenser cells. The geometric parameters of ACCs are listed in Table 1.
Two regulation strategies of fans were studied. Strategy 1 was a coarse adjustment where the speeds of fans in Row 1 were increased to 1.1 times the rated speed (n0) and the speeds of the other fans were reduced synchronously under windy conditions, while no adjustments were taken without wind. Strategy 2 was a fine adjustment to make the volumetric flow rate of each fan as equal as possible with the maximum fan speed controlled at 1.1 n0. TRL operating conditions were selected, and Table 2 lists the main parameters. The design condition, Strategy 1, and Strategy 2 are termed as Design, Str-1, and Str-2, respectively.

3. Numerical Models and Methods

3.1. Mathematical Models

The flow and heat transfer characteristics of air could be predicted by the governing equations as follows [12]:
ρ u j φ x j = x j ( Γ φ φ x j ) + S φ + S φ ( j = 1 , 2 , 3 ) ,
where ρ is the density of air, uj represents the air velocity in the direction of xj, φ is a dependent variable, Γφ refers to the diffusion coefficient, Sφ is a source term, and Sφ′ is the additional source term required by finned tube bundles with the following expressions [9]:
S m = Δ p j L j ,
S e = q j L j ,
where Sm′ and Se′ are added to the momentum and energy equations, respectively, Δpj is the pressure drop component, qj refers to the heat flux component, and Lj represents the three-dimensional size of the finned tube bundles. The realizable kε model was adopted thanks to its advantages of predicting the flows with the features of strong streamline curvature, vortices, and rotation.
In this work, the porous medium model was applied for the fluid zone of finned tube bundles, and the addition of momentum source term Sm′ could be calculated by the formula below, which is composed of two parts: a viscous loss term (the first term on the right-hand side of Equation (4)) and an inertial loss term (the second term on the right-hand side of Equation (4)) [29].
S m = ( μ α u i + c 2 1 2 ρ u i 2 ) ,
where ui represents the face velocity normal to the finned tube surface, μ is the air dynamic viscosity, 1/α is the viscous resistance factor, and c2 is the inertial resistance factor.
This momentum source term contributed to the pressure gradient in the porous cell, creating a pressure drop that was proportional to the cooling air velocity in the cell. The pressure drop to the source term, can be expressed as below.
Δ p i = S m L i = μ α L i u i + c 2 L i 1 2 ρ u i 2 ,
where Li is the porous media thickness which is equal to the air flow path length of finned tube. By means of experiments, the variation of the pressure drop with the face velocity of finned tube bundles can be obtained, yielding a polynomial of the pressure jump coefficient against the face velocity. Hence, comparing to Equation (5), the viscous factor resistance and inertial resistance factor in the air flow direction of 4,399,322 m−2 and 28.7168 m−1, respectively, were employed in this work.
The ungrouped macro heat exchanger model was used for the finned tube bundles, in which the air was the main fluid and the exhaust steam was the auxiliary fluid. Due to the phase change of the steam, the simple-effectiveness model was adopted. The actual rate of heat transfer from the steam to air q was calculated by the following equation [29]:
q = ε C min ( t s t a 1 ) ,
where ε is the heat exchanger effectiveness, which refers to the ratio of the actual rate q to the maximum possible rate qmax, Cmin represents the minimum specific heat capacity of air and steam, and ts and ta1 are the temperatures of exhaust steam and inlet air, respectively. qmax and Cmin were calculated with the following expressions [29]:
q max = C min ( t s t a 1 ) ,
C min = min [ ( m c p ) steam , ( m c p ) air ] .
In the physical model, the finned tube bundled was dispersed into many cells, which made up several macros, as shown in Figure 2.
For the simple-effectiveness model, the heat transfer for a given cell is obtained as follows [29]:
q c e l l = ε ( m c p ) air ( t s t a 1 ) .
The heat rejection of a macro is the sum of the heat transfer of all the cells contained within the macro and can be calculated by the following formula:
q m a c r o = q c e l l .
The total heat rejection from the heat exchanger core is computed by summing the heat rejection of all the macros with the following equation:
q t o t a l = q m a c r o .
The steam inlet temperature to each macro is computed based on the energy balance of the steam at a previous macro computation. For a given macro,
q m a c r o = m steam ( h o u t h i n ) ,
where hout and hin are the inlet and outlet enthalpies of the steam in the macro. The steam outlet temperature tout from the macro was calculated by the UDF method. The values of hout and tout then became the inlet conditions to the next macro.
According to the heat balance between the exhaust steam and cooling air, the exhaust steam temperature ts can be obtained by the following formula [30]:
t s = m s ( h s h wa ) c pa m a 1 1 e k A / c pa m a + t a 1 ,
where hs and hwa refer to the enthalpies of steam and saturated water, cpa is the air-specific heat, K is the overall coefficient of heat transfer, A represents the surface area of the finned tube bundles, and ms and ma are the mass flow rate of exhaust steam and cooling air.
In the simulation, the inlet temperature of exhaust steam was assumed firstly. Then, the exhaust pressure could be calculated according to the following equation [31]:
p B = 0.00981 ( t s + 100 57.66 ) 7.46 .
The fan model was adopted to replace the actual axial flow fan, with the two main characteristics of the fan, the performance curve and the tangential flow velocity, imposed into the model by the following polynomials [12]:
Δ p = n = 1 N f n u z n - 1 ,
u θ = n = - 1 N g n r n ,
where Δp represents the pressure rise, which is a polynomial about the axial velocity uz, fn is the polynomial coefficient with the values of f1 = 172.4, f2 = 1.674, and f3 = −1.106, uθ is the tangential velocity, which is related to the structure of the fan, r refers to the distance from the fan center, and gn is polynomial coefficient with the values of g−1 = −15.1, g0 = 25.76, g1 = −11.791, g2 = 4.321, and g3 = −0.354.
For an axial flow fan, the flow rate qv, total pressure p, and shaft power P can be calculated as follows [22]:
q v q v 0 = n n 0 ,
p p 0 = ( n n 0 ) 2 ,
P P 0 = ( n n 0 ) 3 ,
where n represents the fan speed. The subscript 0 refers to the design condition.
The computational domain with the size of 2194.75 m × 2172.34 m × 400 m is shown in Figure 3. Obviously, the dimensions of length, width, and height were much larger than the central part where the power plant was located, which was helpful to obtain reliable calculation results. Under the windless condition, the top surface was defined as the pressure outlet, and the pressure inlet boundary conditions were given to the four side surfaces. When the wind came from the +y-axis, the surface where the wind entered was defined as velocity-inlet, and the speed of wind uw was specified by the user-defined function, which changed with height Z according to the following formula [32]:
u w = u 10 ( Z 10 ) 0.2 ,
where u10 is provided in this work and represents the reference speed of wind as the height is 10 m. The outlet surface is defined as pressure-outlet. The top and two side surfaces were considered symmetrical. The ground was set as a no-slip wall with the standard wall function adopted.
The intensity and viscosity ratio were selected to specify the turbulence at the velocity-inlet boundary. The turbulence kinetic energy and its diffusion rate have the following expressions [33]:
k = 3 2 ( u avg I ) 2 ,
ε = ρ c μ k 2 μ ( μ t μ ) 1 ,
where uavg represents the average velocity of air. I is the turbulence intensity and was set to 10%. cμ was taken as 0.09 empirically. The turbulent viscosity ratio μt/μ was set to 1.1.
The computational fluid dynamics software Fluent 19 was adopted to predict the performance of ACCs. The SIMPLE algorithm was chosen for the pressure-velocity coupling. For the governing equations, the convective terms were discretized by the second-order upwind differencing while central differencing schemes were applied for the diffusion terms. The divergence-free criteria of scaled residuals were set as 10−4.

3.2. Grid Independence and Experimental Validation

The commercial software Gambit was used to establish and mesh the computational domain. The thermo-flow characteristics of the central part with complex geometry structure are the most critical; thus, a tetrahedral unstructured grid with a small size was used in this area. The other domains were meshed with sparse hexahedral structured grids to improve the calculation efficiency. By changing the grid size of the ACCs area, the models with the grid numbers of 5,153,402, 7,604,487, and 9,866,763 were established. When the wind speed was set to 4 m/s, the air mass flow rate of ACCs and a specific fan were monitored. The results of the two larger grids were very close with a maximum deviation of 0.53%; thus, the number of 7,604,487 of the grid scheme was finally adopted. For the ACCs, the size of the grid was set as 0.5 m. The grid size for the boiler and turbine houses grew to 2 m. The grid size for other parts increased proportionally and reached 30 m at the edge of the computational domain.
In our previous work, the measurement of inlet temperature of a certain ACC cell was made in an actual direct air-cooling power plant with the installed capacity of 2 × 600 MW under different operation conditions, and very consistent trends were presented by comparing with the results of numerical simulation [32]. Moreover, the experiments and simulations for a scale condenser cell model were carried out [11]. The results showed that the error of the numerical simulation was within an acceptable range. In this work, the modeling and numerical methods in the aforementioned works were completely applied, implying that the results achieved here are reliable enough.
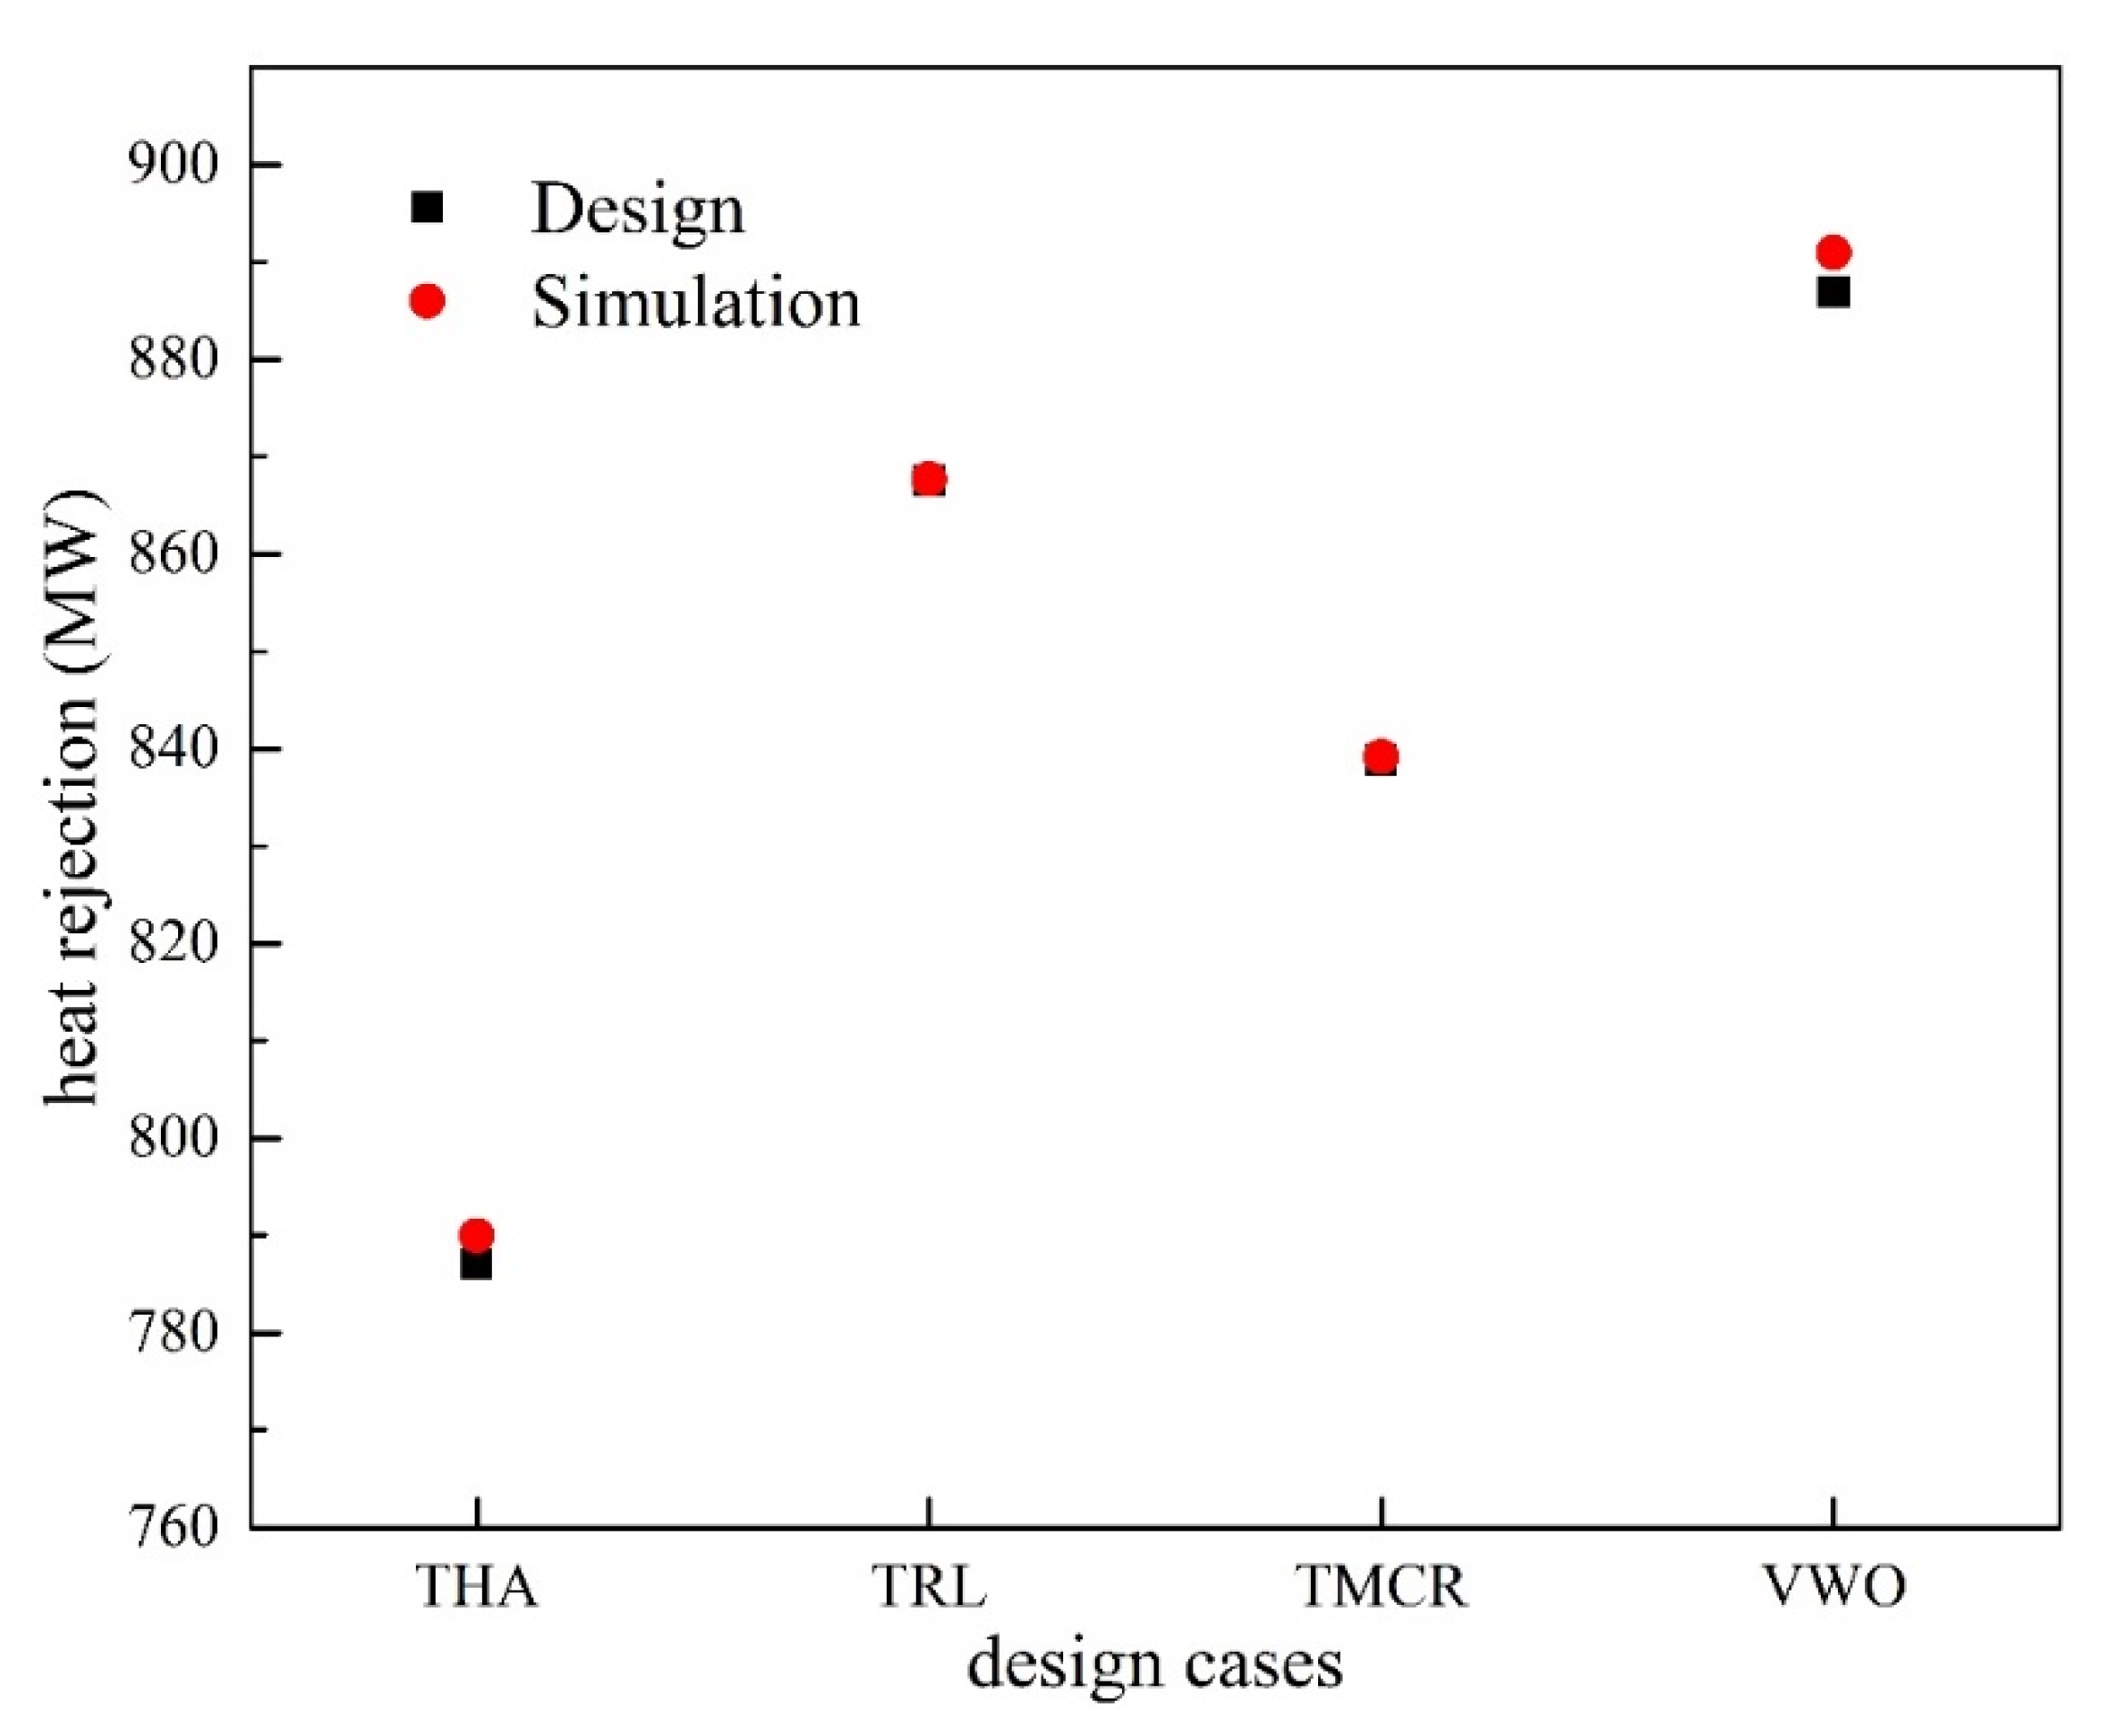
In addition, the heat rejection of several working conditions, including turbine heat acceptance (THA), turbine rated load (TRL), turbine maximum continues rate (TMCR), and valve wide open (VWO), was calculated by the method of numerical simulation. It can be seen from the comparison in Figure 4 that the results of the simulation calculation are credible.

4. Results and Discussion

4.1. Temperature and Volumetric Flow Rate of Cooling Air

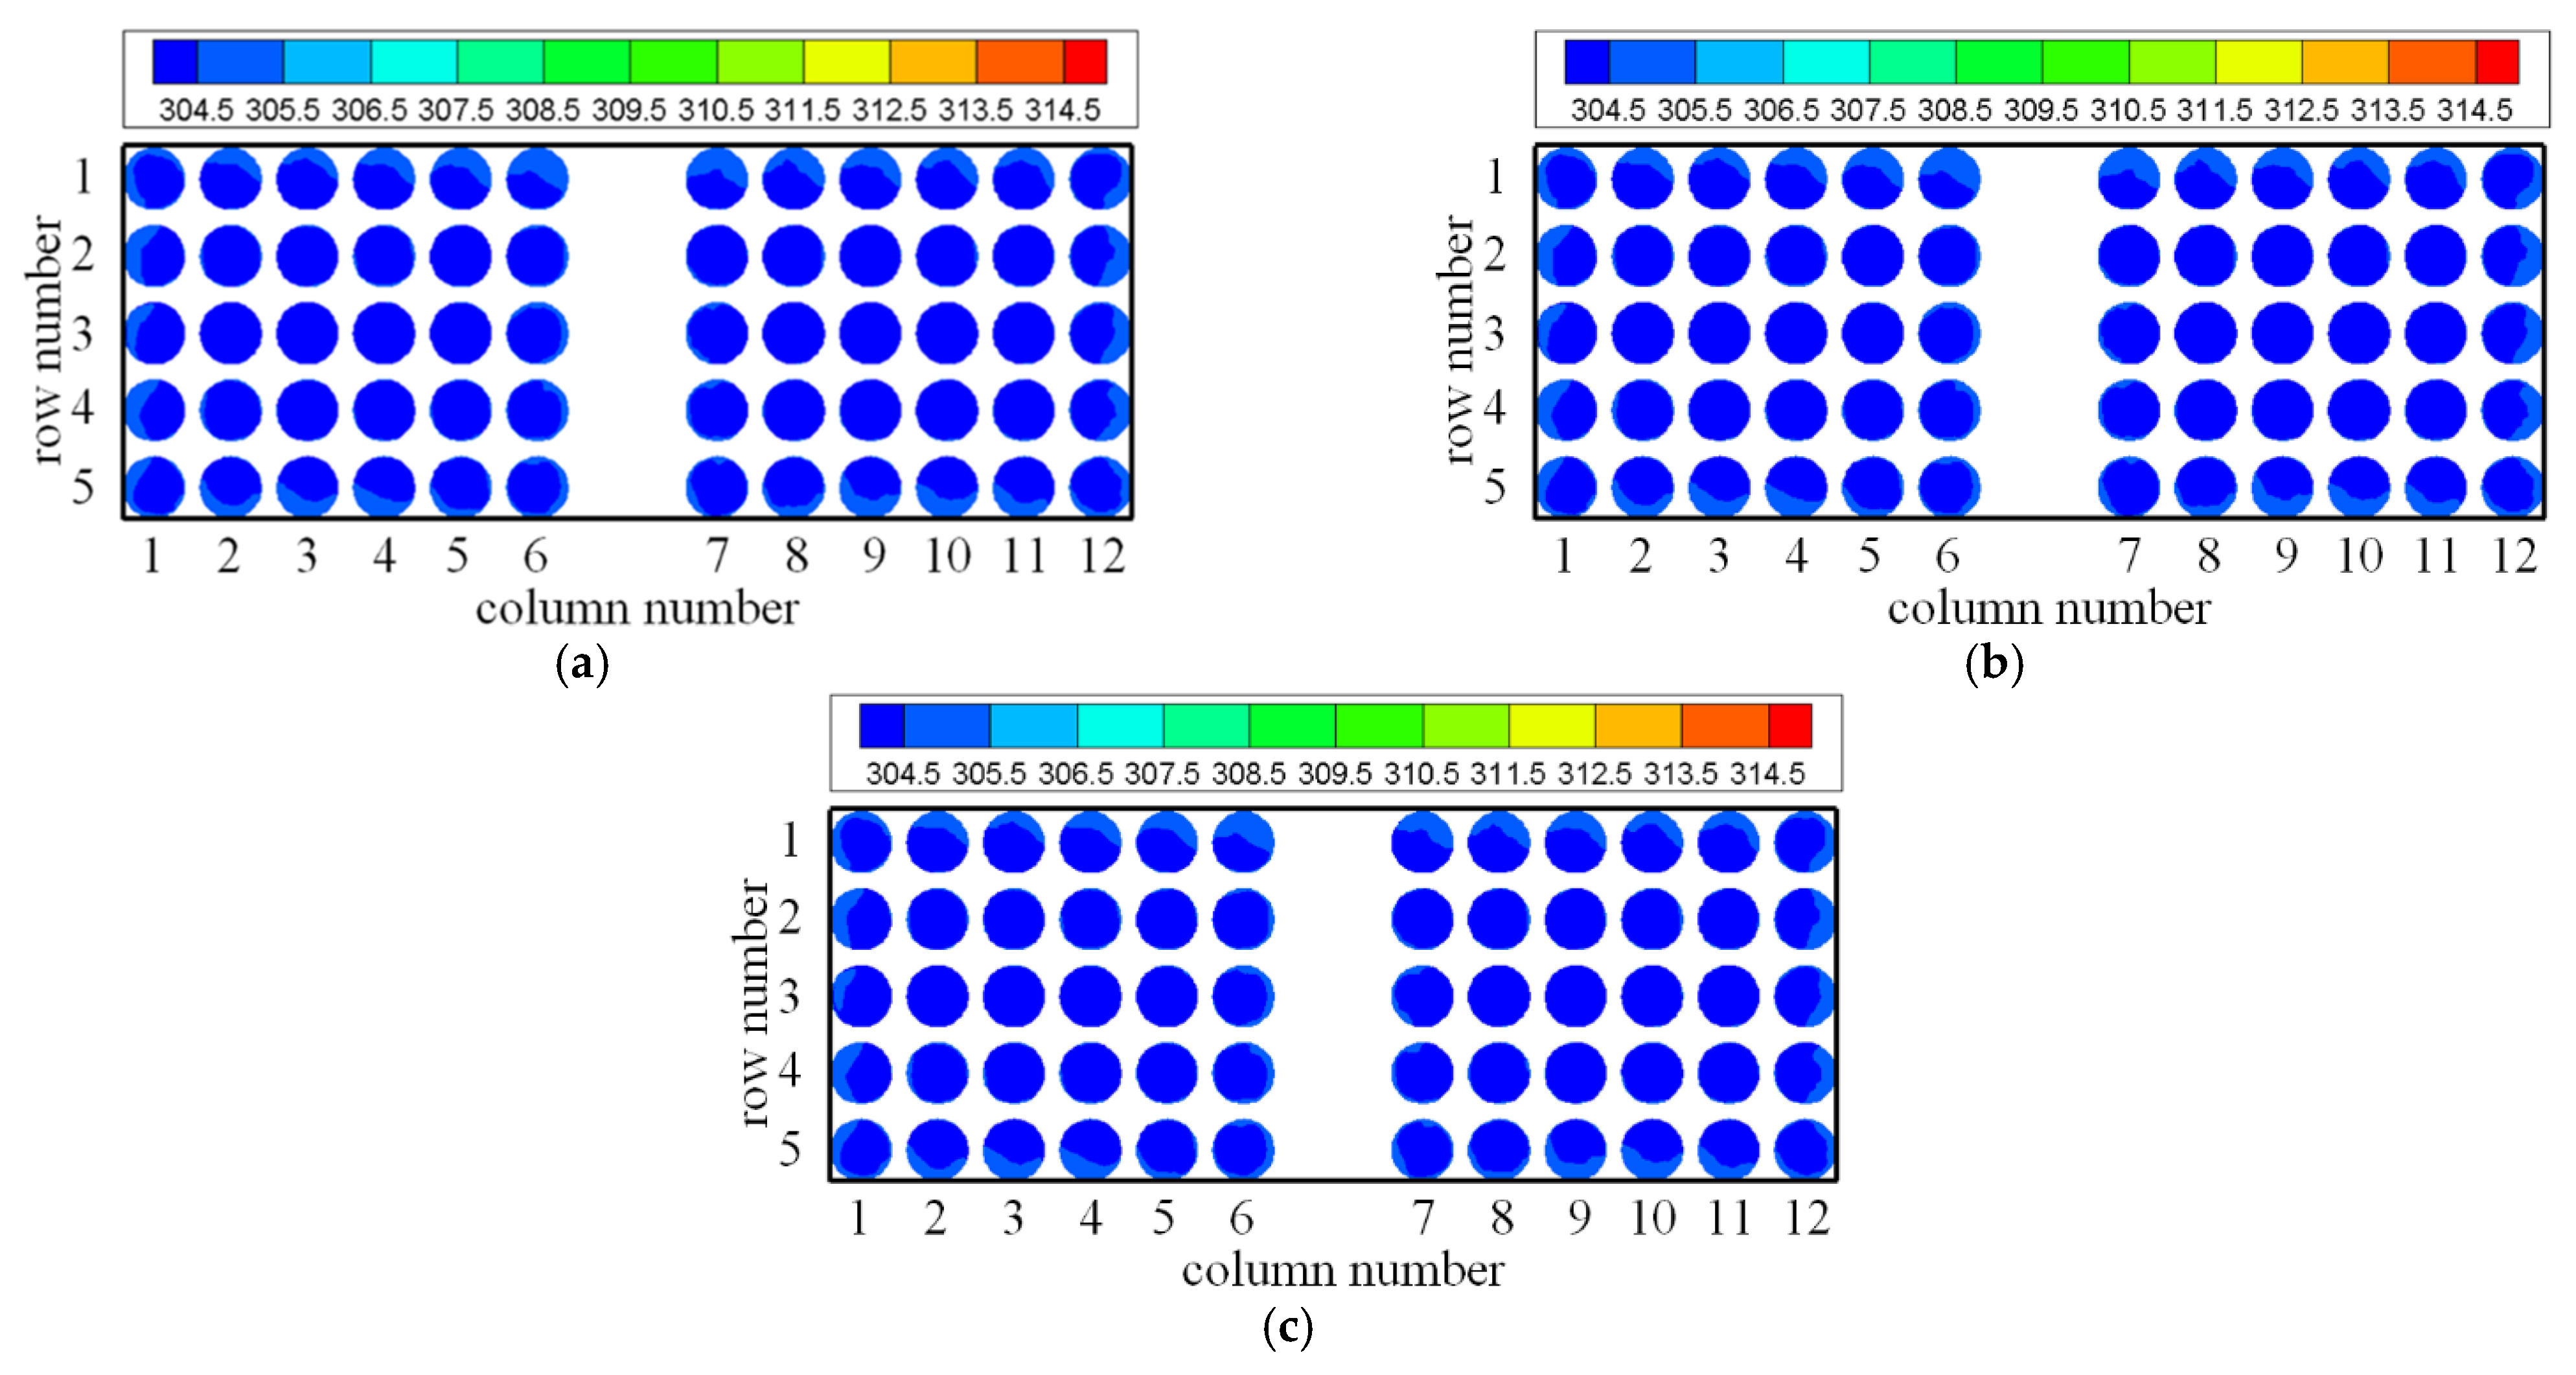
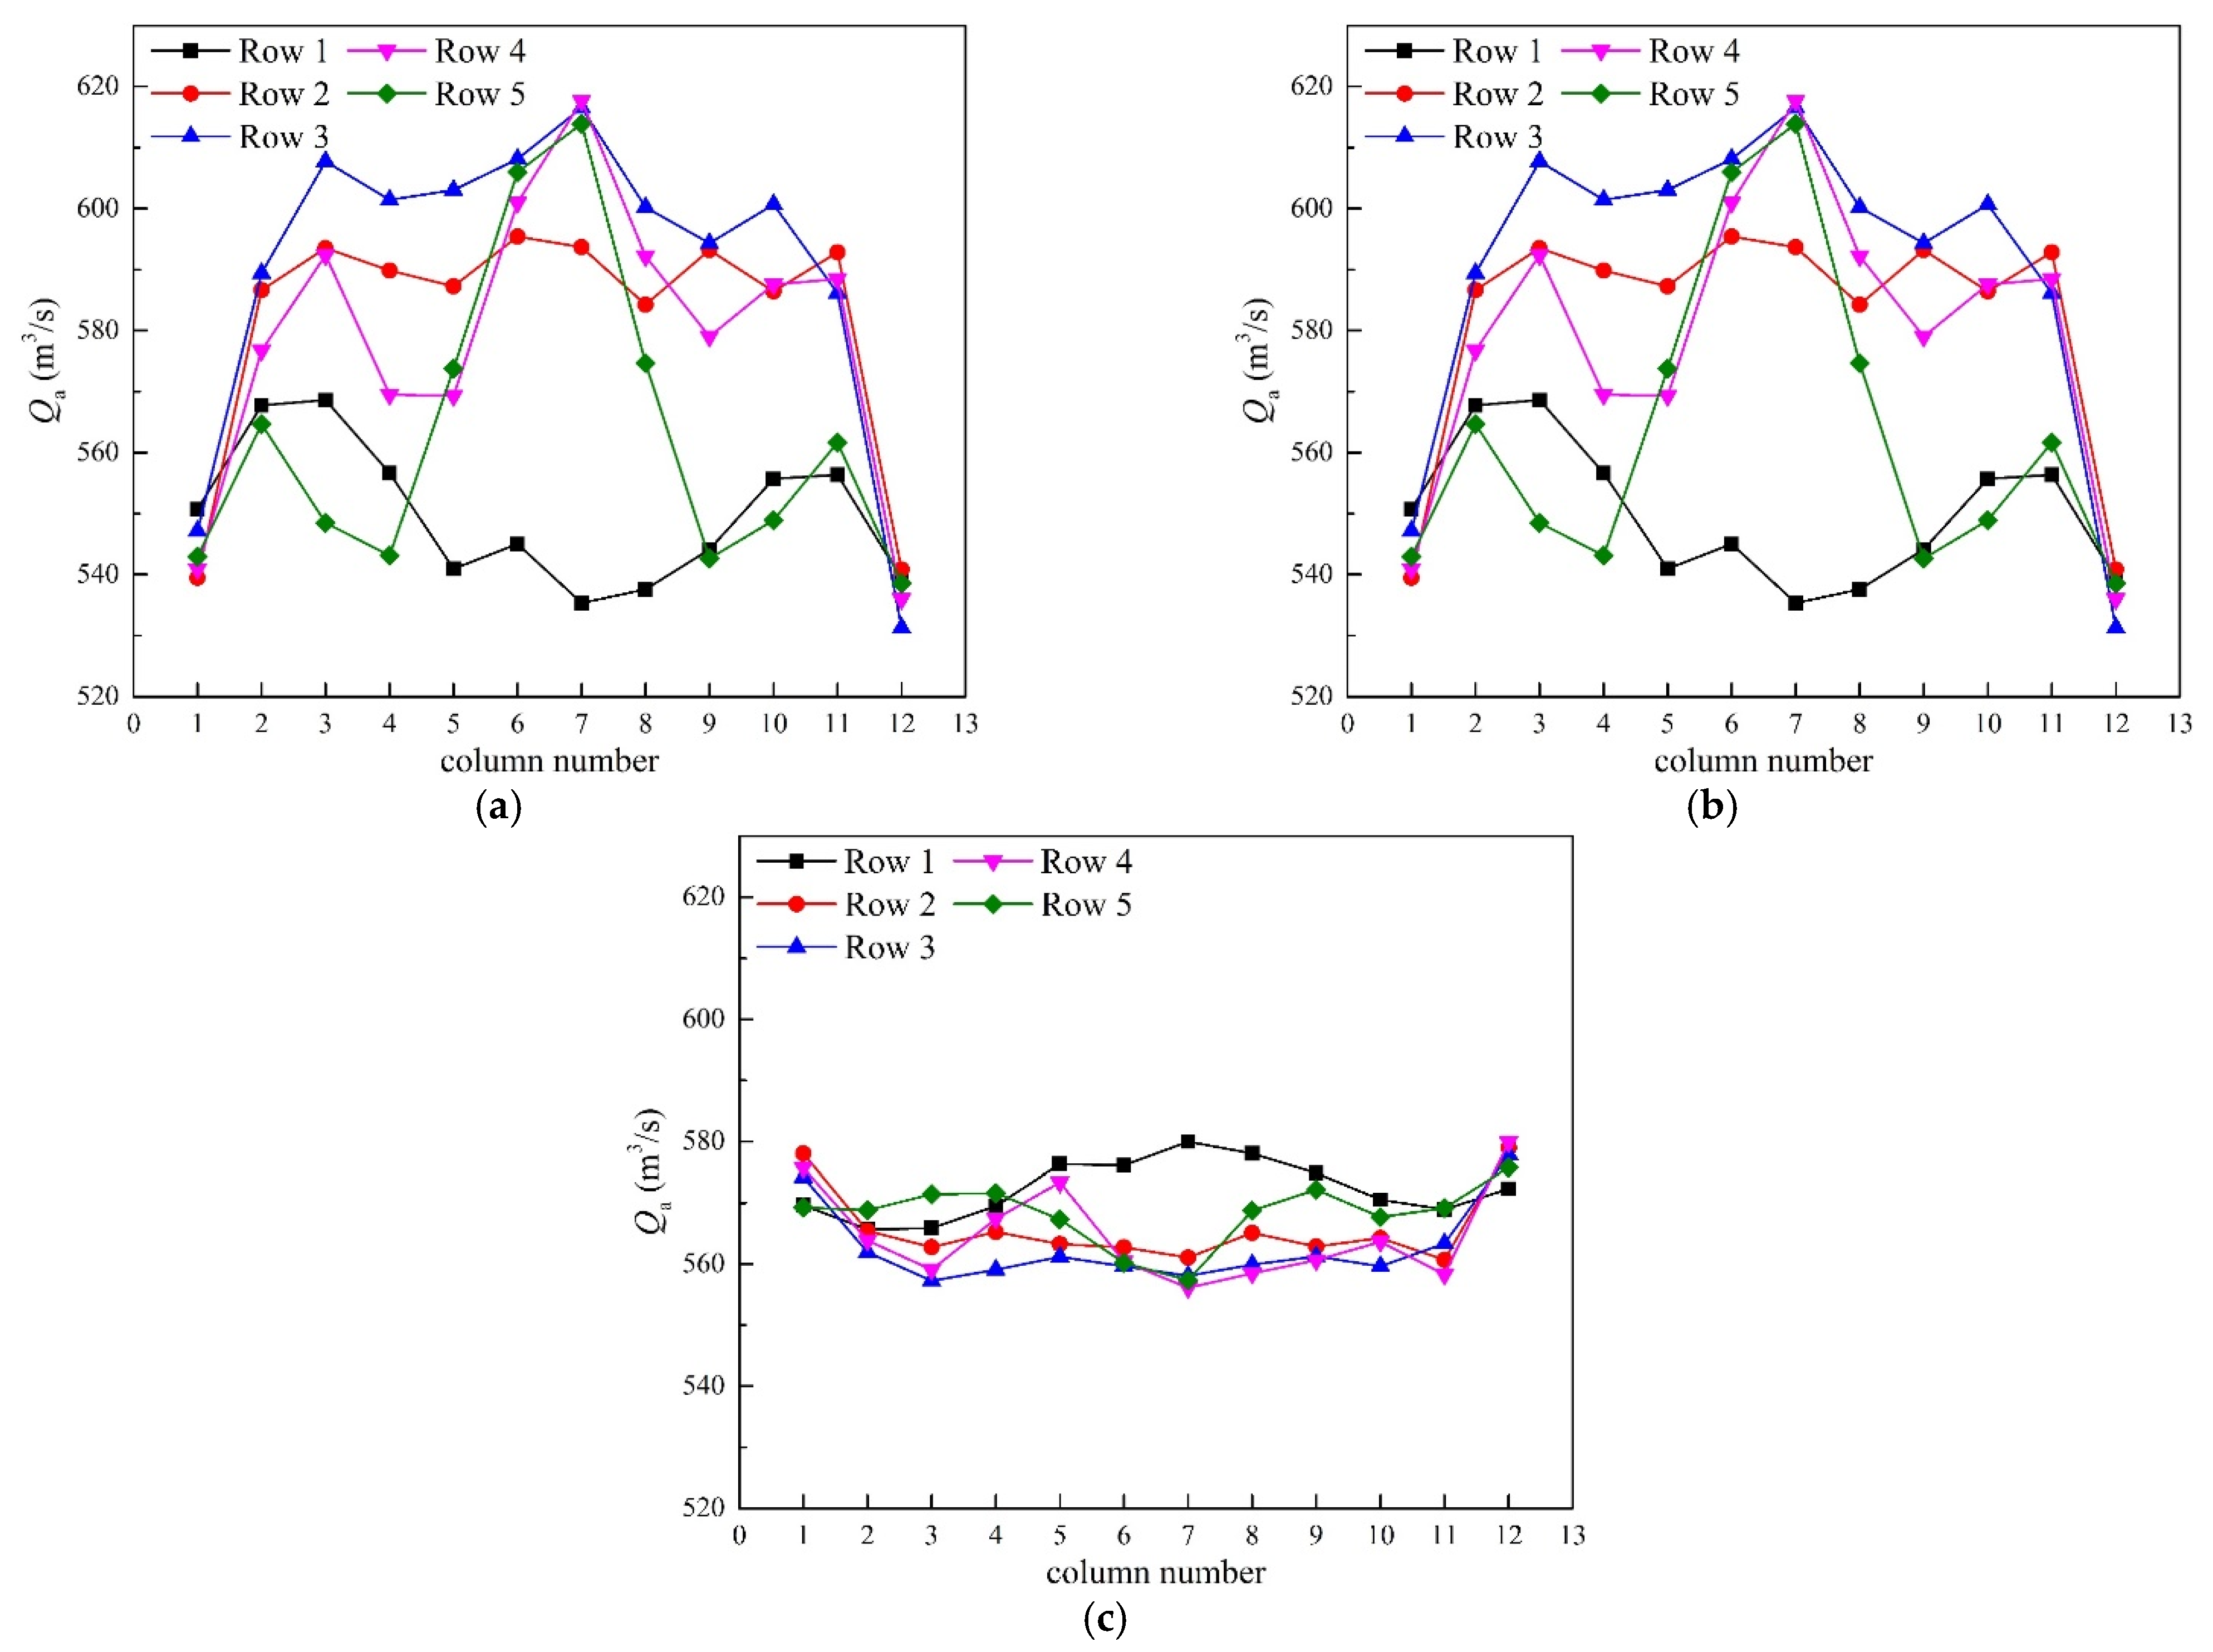
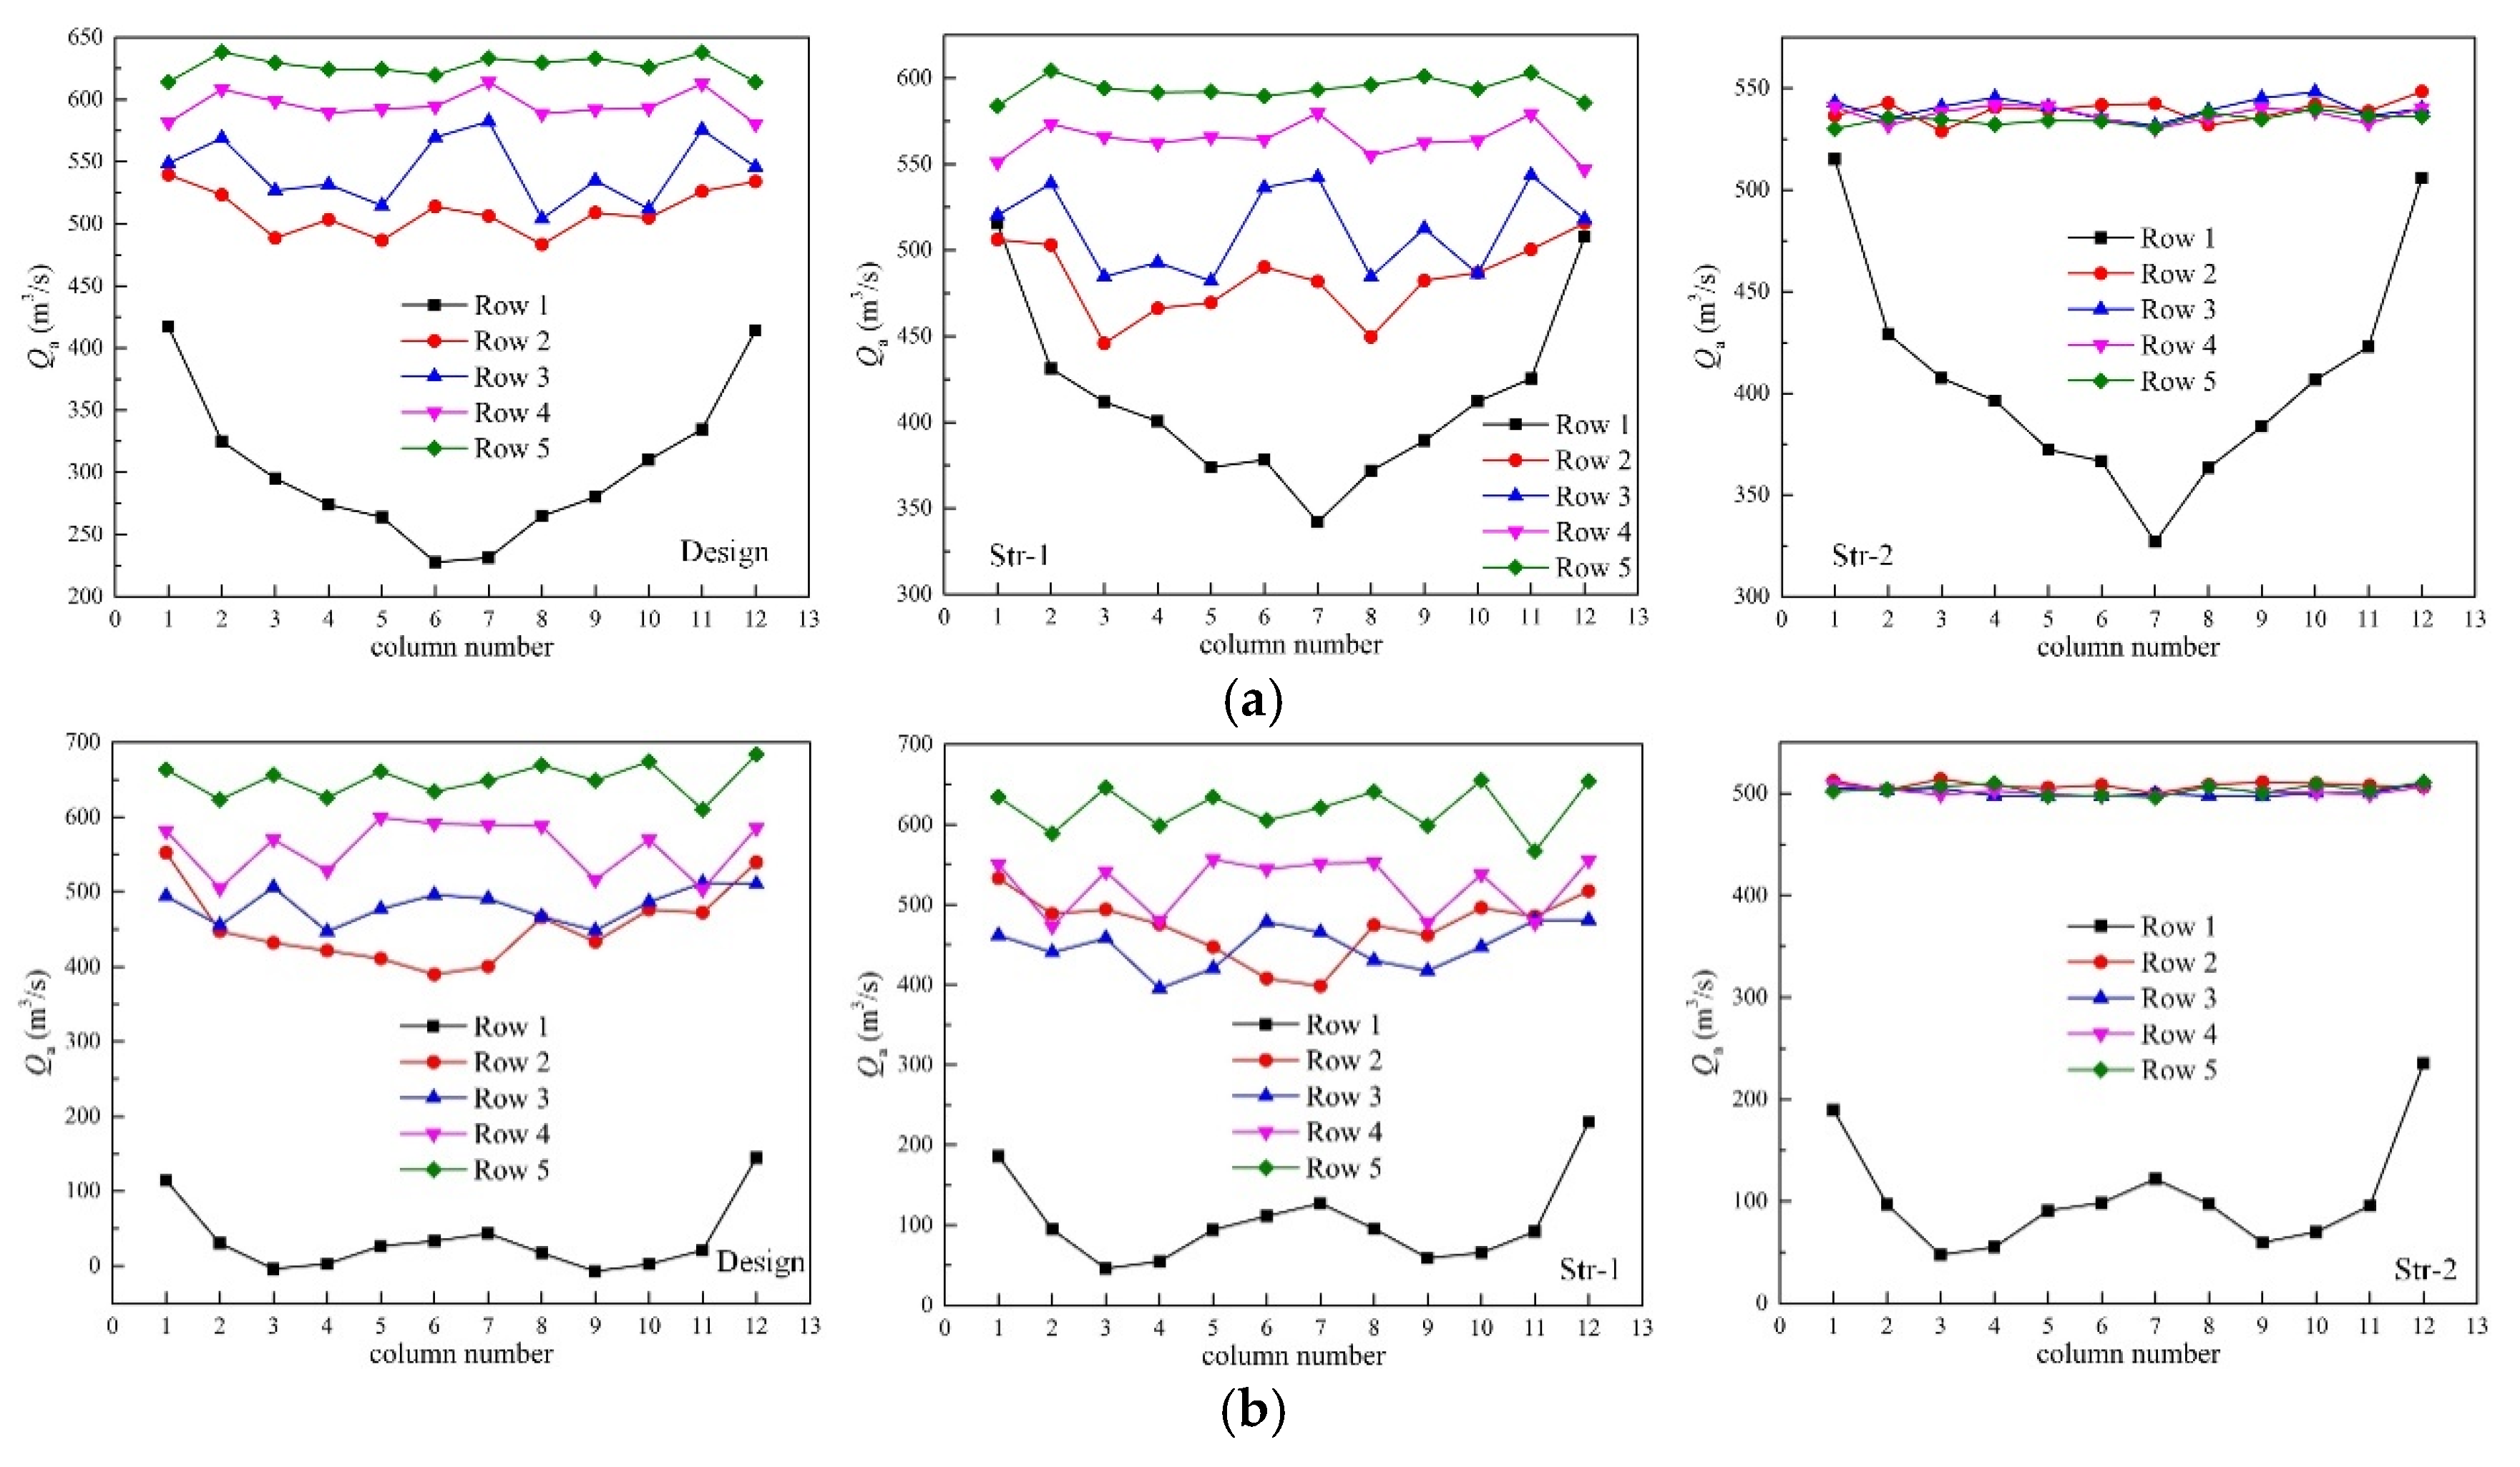
In the absence of wind, the temperature and flow fields of Str-1 case were the same as the design condition because the fans operated at the rated speed. Figure 5 gives the distributions of air temperature at fan inlet for the cases of Design, Str-1, and Str-2 under windless condition. It can be seen from Figure 5a that the temperatures of inlet air under the design condition were basically the same as the environment temperature. For Str-2 case, the inlet air temperatures hardly changed compared with the Design case, as shown in Figure 5c. However, the air volumetric flow rates of fans for Design case and Str-1, as shown in Figure 6a,b, were uneven due to the fan-group effect, even if the fan speeds were the same. The volume flow rates of the fans in Column 1, Column 12, and Row 1 were much smaller than other fans. As displayed in Figure 6c, the volumetric flow rates were relatively uniform for the Str-2 case by adjusting the fan speed.
The maximum deviation of the volumetric flow rates δv was calculated by the following formula:
δ v = max | Q a Q ¯ a Q ¯ a | ,
where Qa and Q ¯ a represent the actual and average volumetric flow rates, respectively.
Table 3 lists the parameters for Design, Str-1, and Str-2 cases. The turbine back pressure and the exhaust steam temperature remained unchanged. δv was reduced from 9.96% to 2.32% through the adjustment of Str-2, and the total volumetric flow rate of cooling air was also reduced by about 400 m3/s. This shows that making the flow field more uniform can improve the heat transfer effectiveness of condenser cells.
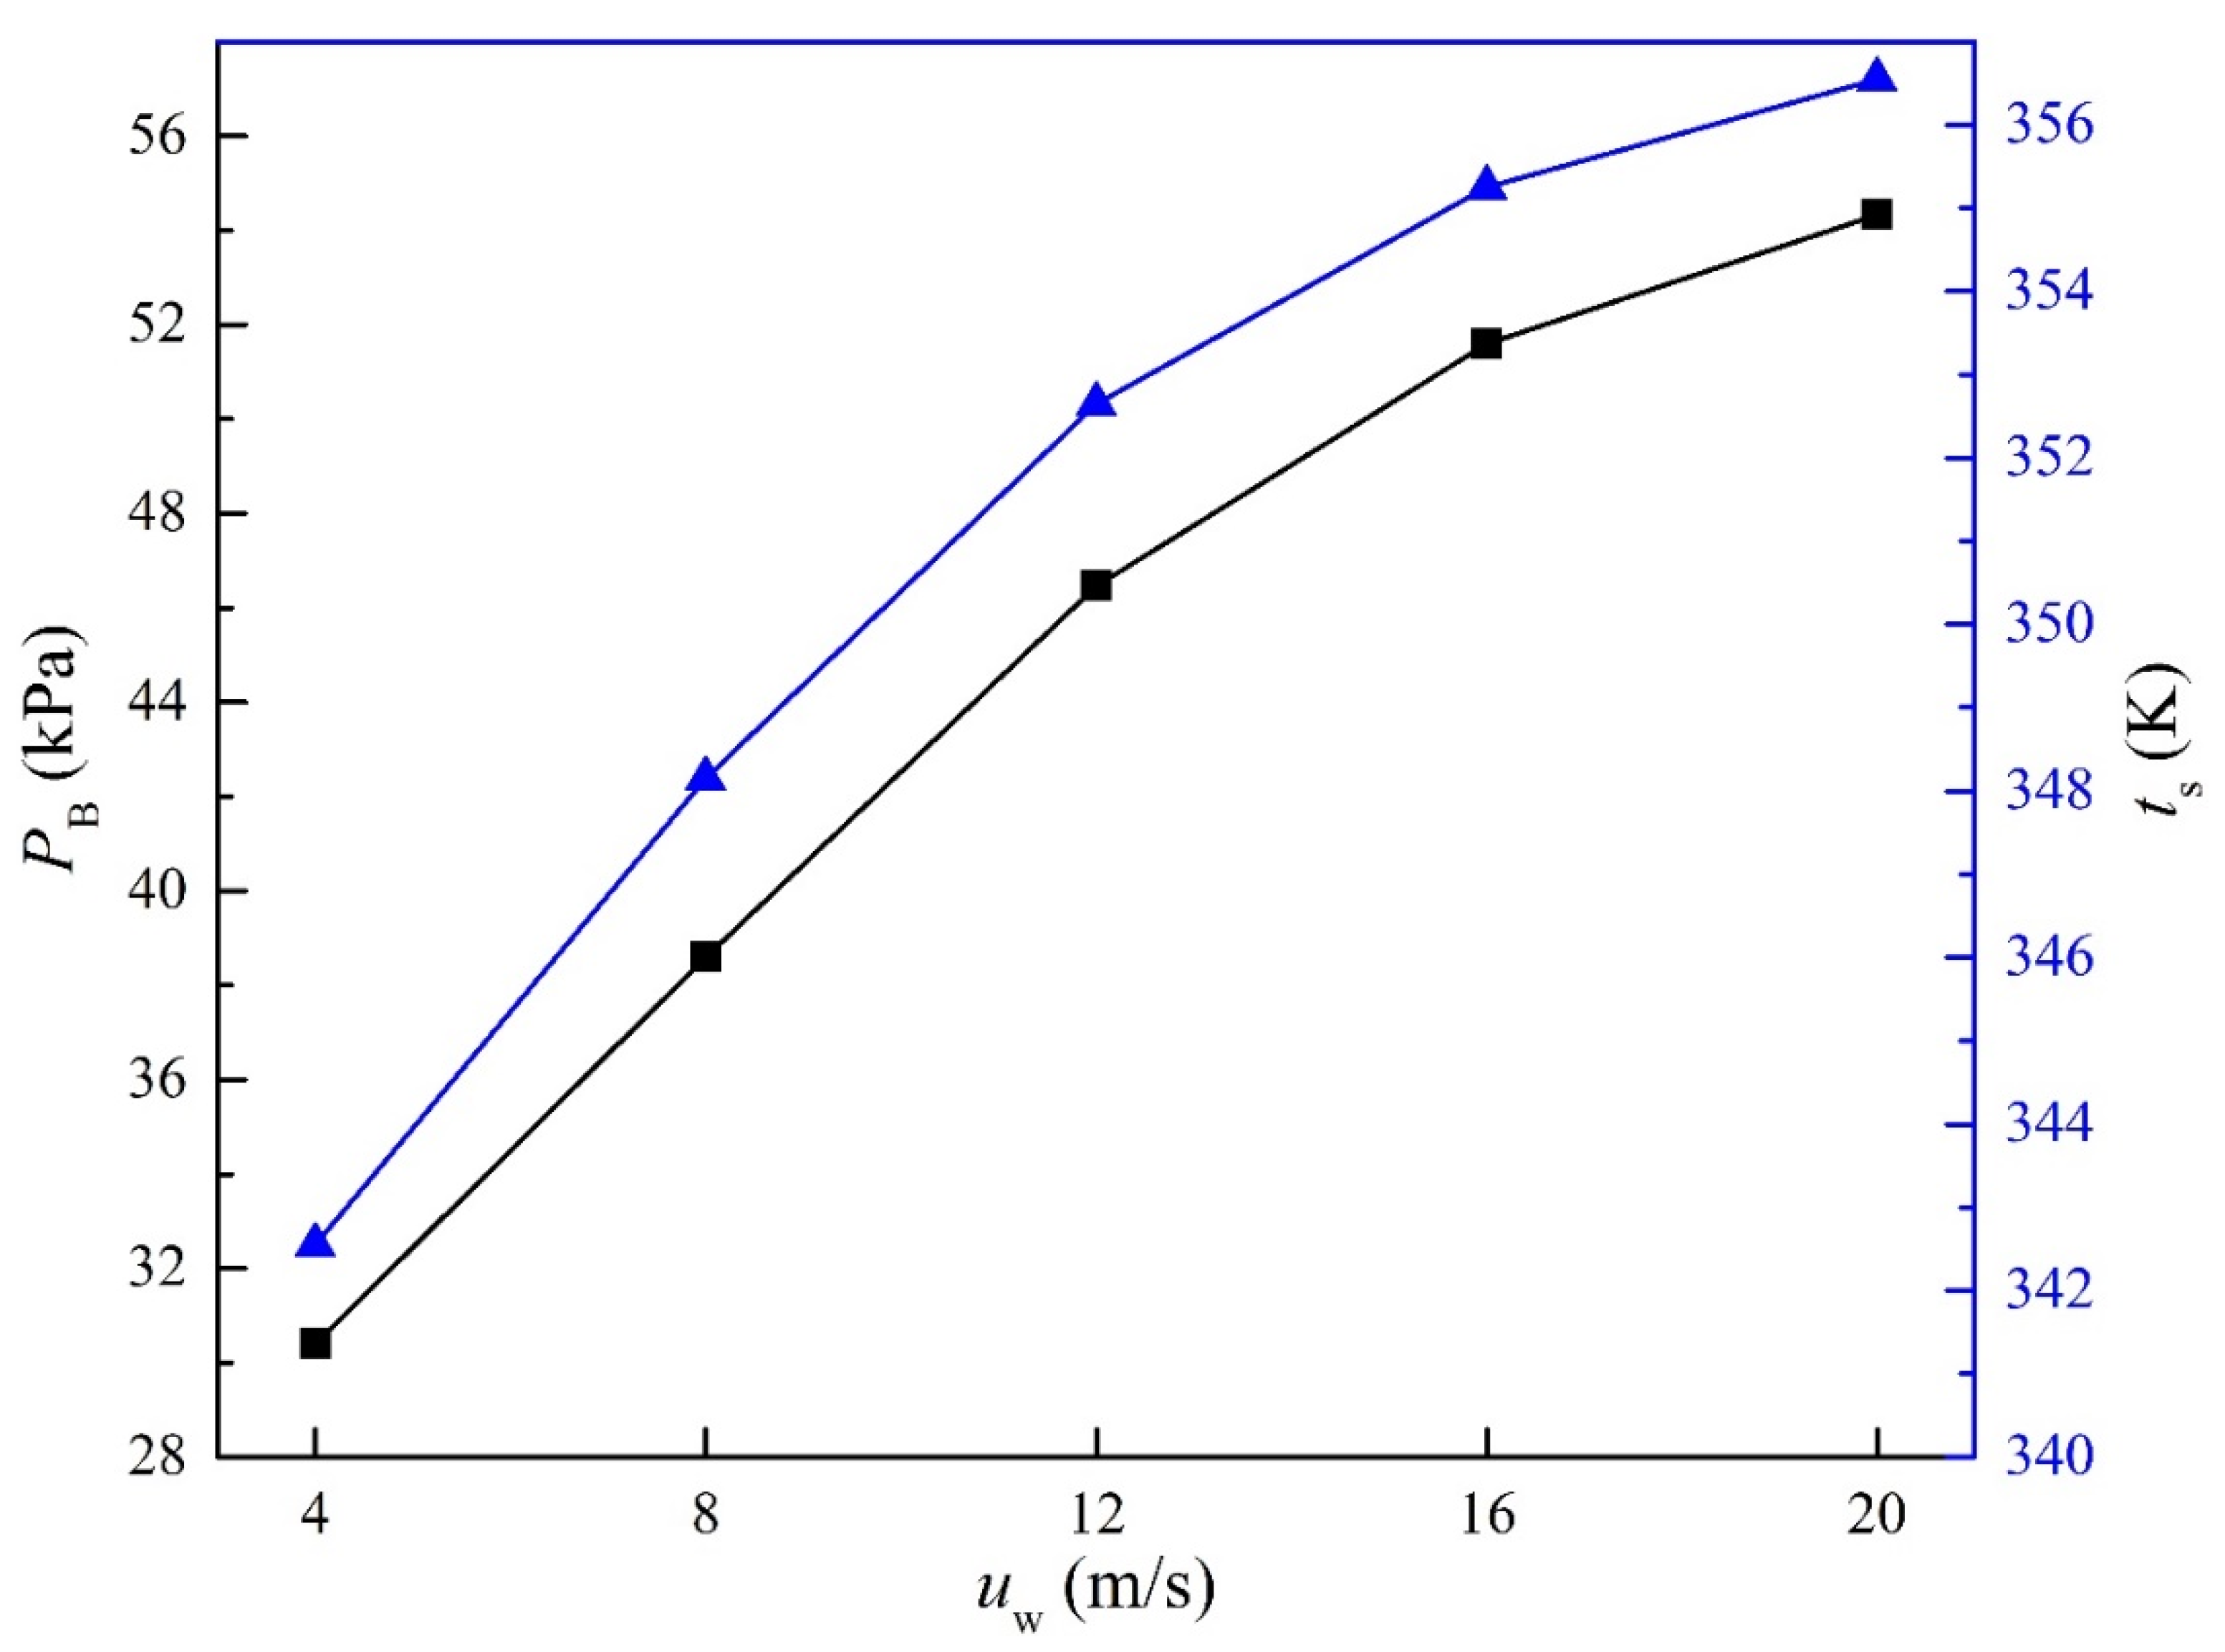
Under the wind conditions, the back pressure of turbine pB increased from 30.40 kPa to 54.33 kPa at the wind speed range of 4 m/s to 20 m/s, as shown in Figure 7. At wind speeds lower than 12 m/s, the change in pB with wind speed was basically linear, and the growth of pB slowed at larger wind speeds. The changing trend of the temperature of exhaust steam ts was basically the same as that of pB.
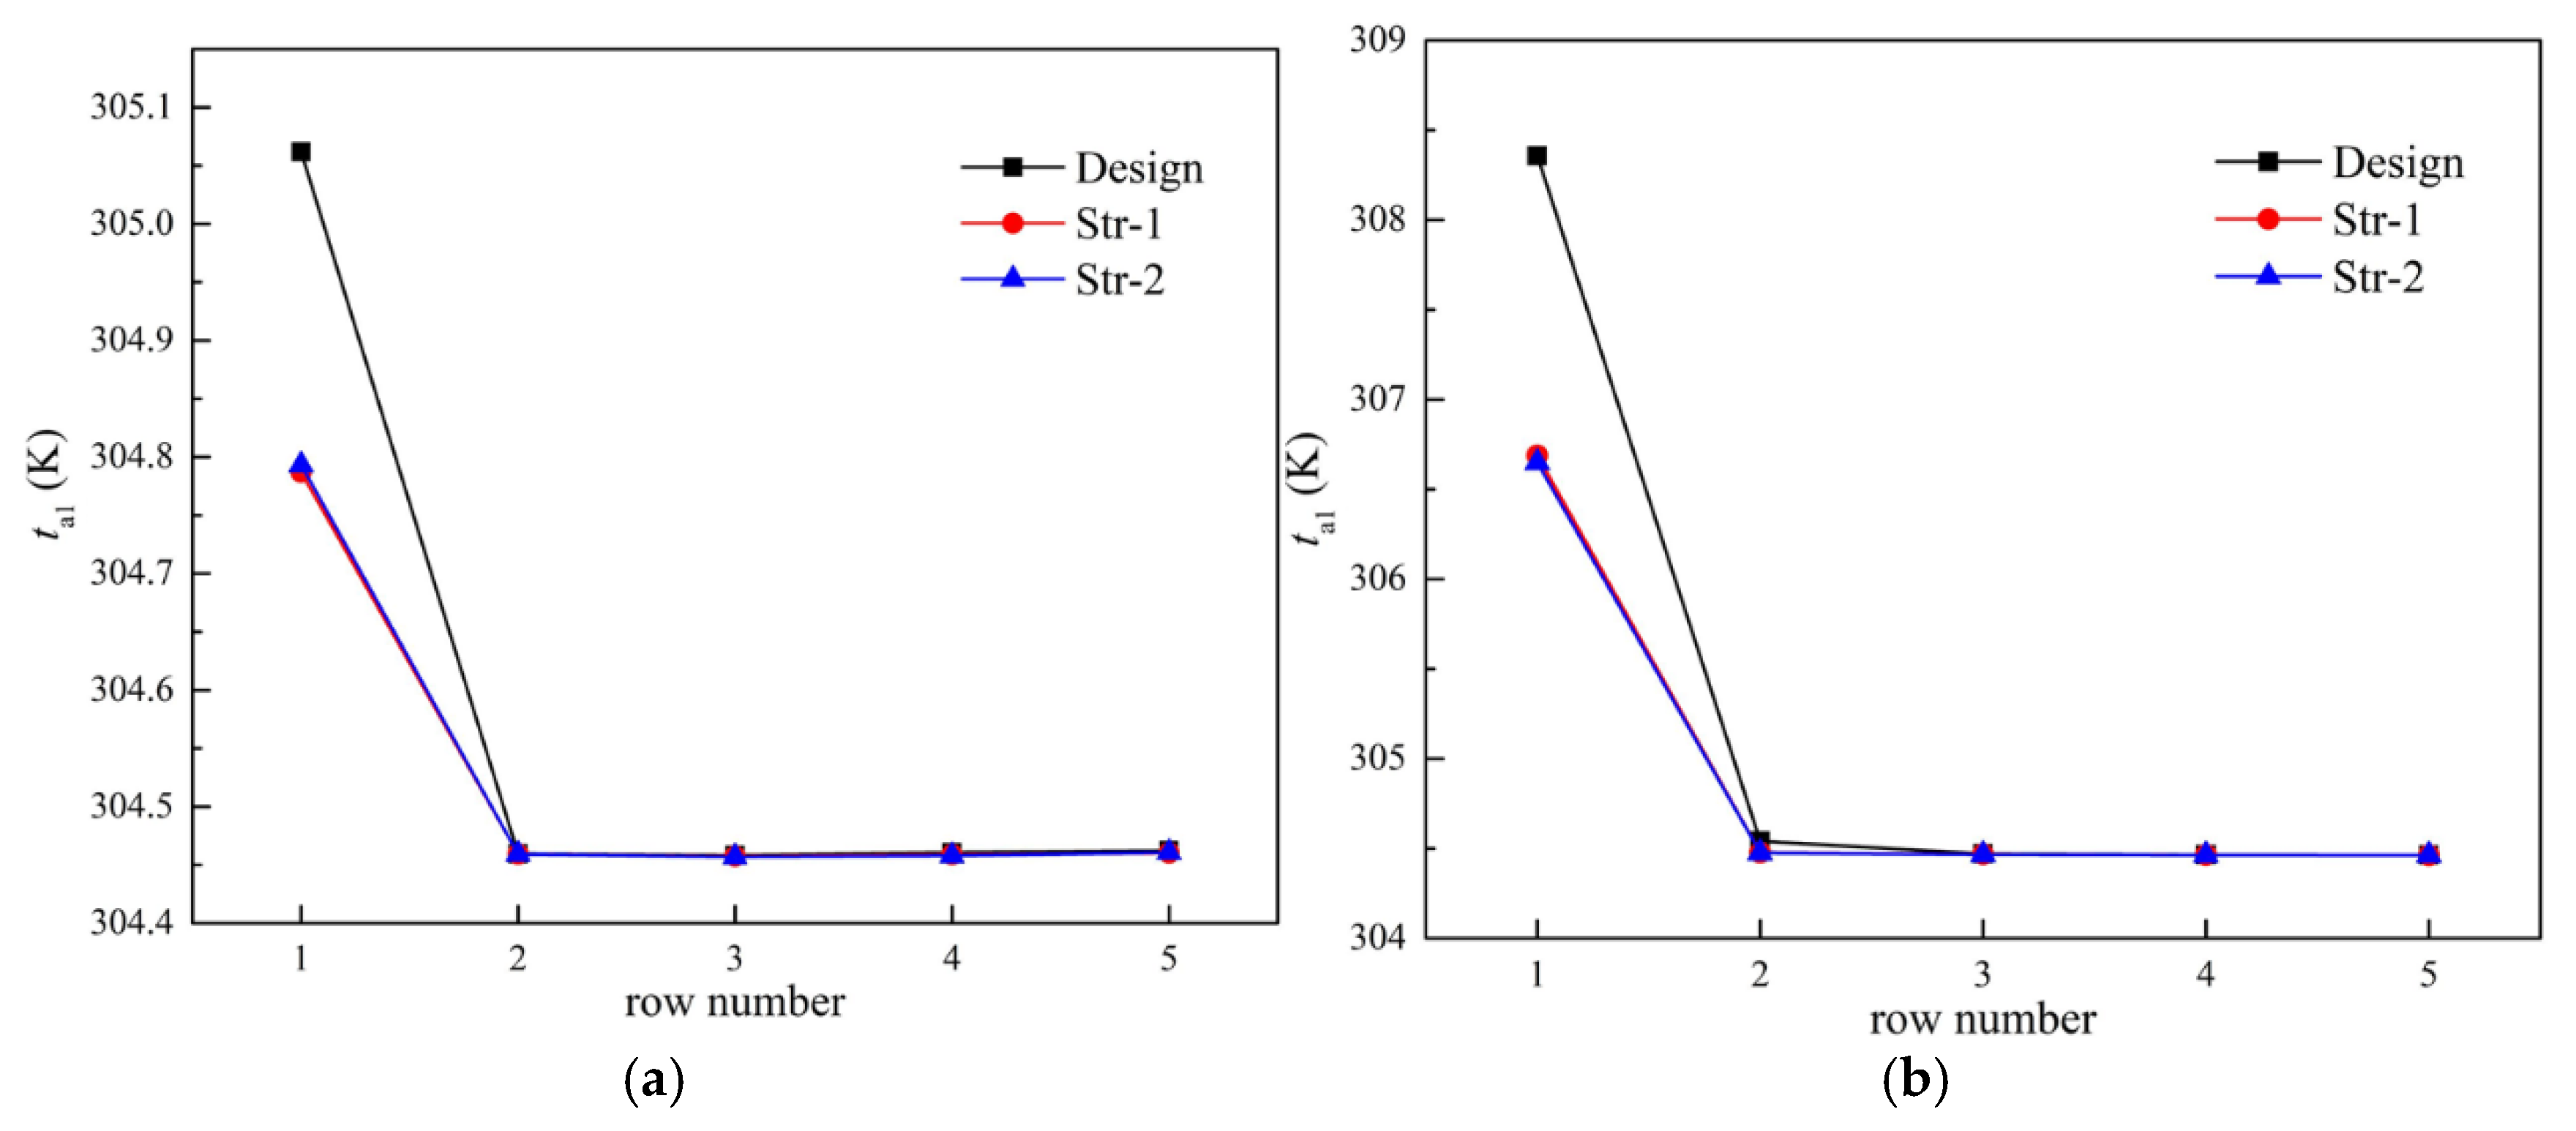
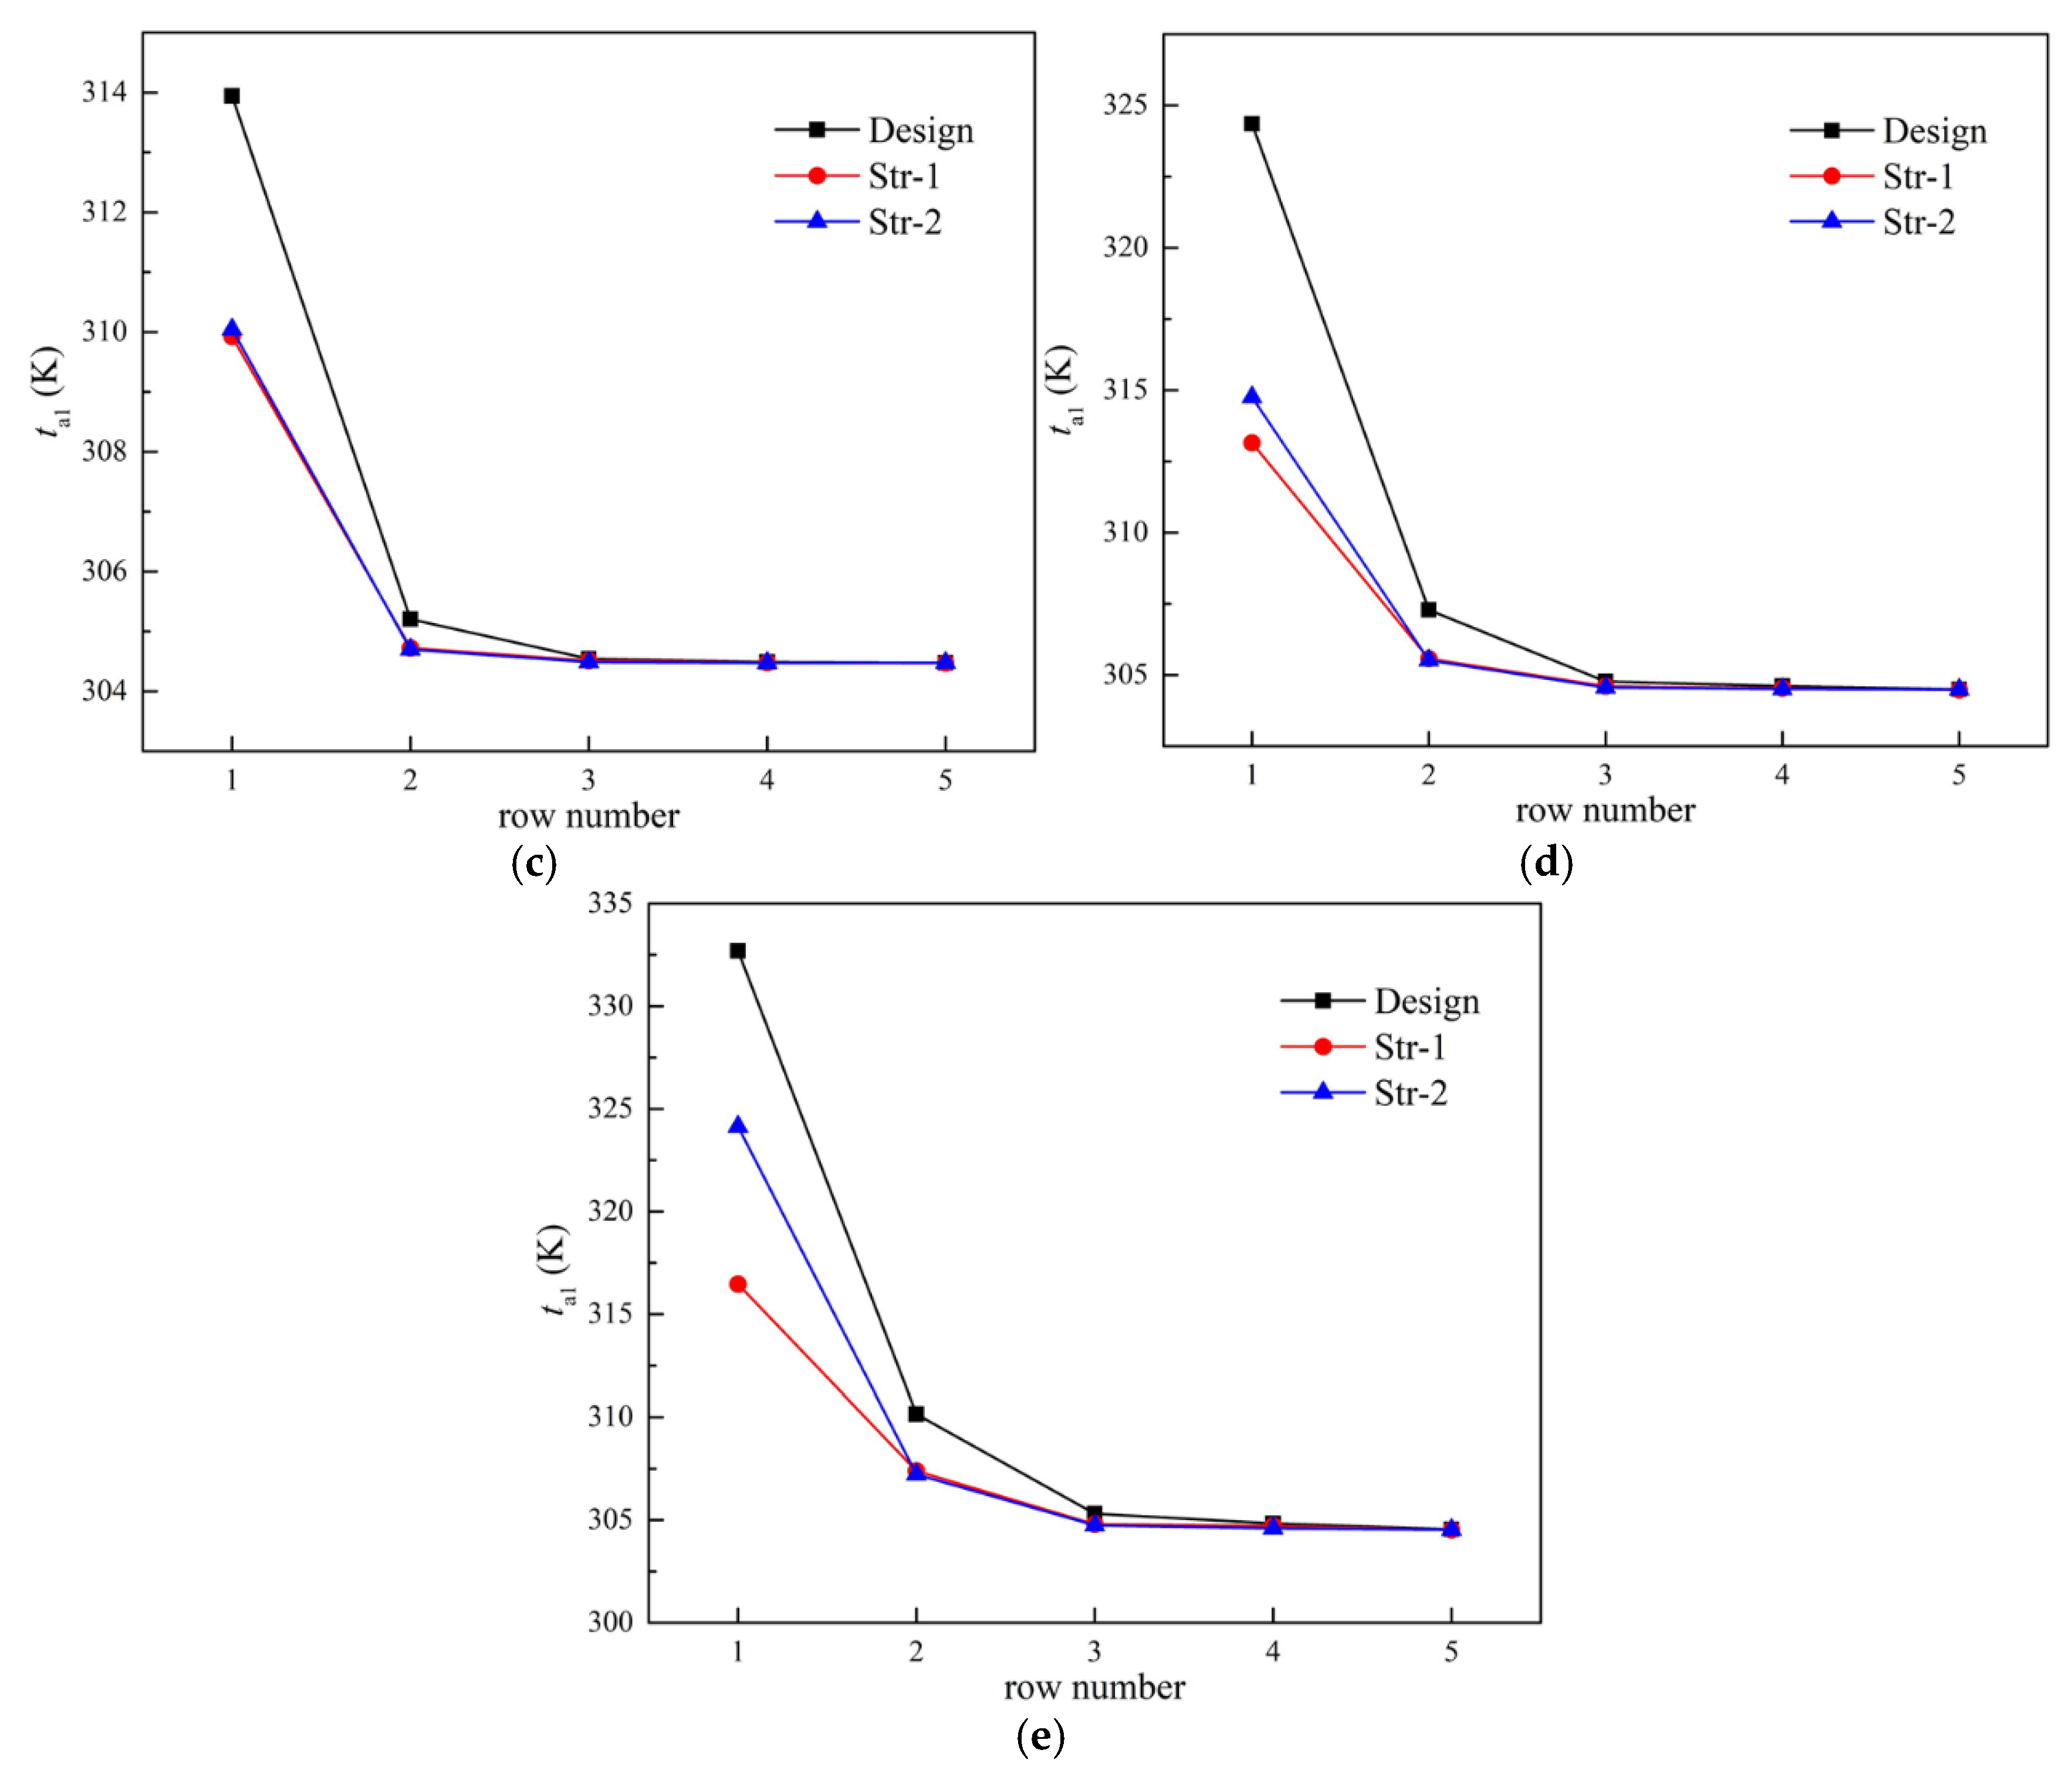
The performance degradation of ACCs under the action of wind was mainly due to changes in the cooling air entering the fans. The inlet air temperatures of each fan for the Design, Str-1, and Str-2 cases are demonstrated in Figure 8. It is evident that the inlet temperatures in Row 1 were much higher than others, which was more obvious under high wind speeds. Moreover, the highest value appeared in the central area of Row 1 of each ACC. The methods of Str-1 and Str-2 could reduce the air temperature of Row 1 significantly. The temperature difference of the other rows for different operating models was not obvious. This shows that the high fan speed of Row 1 was beneficial to reduce the inlet air temperature. At the wind speed of 4 m/s, the inlet air temperatures of leeward fans were basically the same as the ambient temperature, as shown in Figure 8a. However, as the wind speed increased, the rises in inlet temperatures of the leeward fans became more and more significant, as shown in Figure 8b,c. The inlet air temperatures of fans in Row 2 reached 306 K and 314 K at wind speeds of 12 m/s and 20 m/s, respectively, which are much higher than the ambient temperature. In addition, the air temperatures of leeward fans in the two proposed operating strategies also decreased.
Figure 9 displays the average inlet air temperatures of each row. Obviously, the average inlet air temperatures of leeward fans for Str-1 and Str-2 cases were almost the same at various wind speeds. Moreover, the average temperatures of Row 1 showed no difference and were much lower than the design conditions at wind speeds lower than 12 m/s. The temperatures of Row 1 for Str-1 cases were lowest at high wind speeds. Furthermore, the temperature difference between the leeward fans for Str-1 and Str-2 gradually widened compared with the design condition with increasing wind speed.
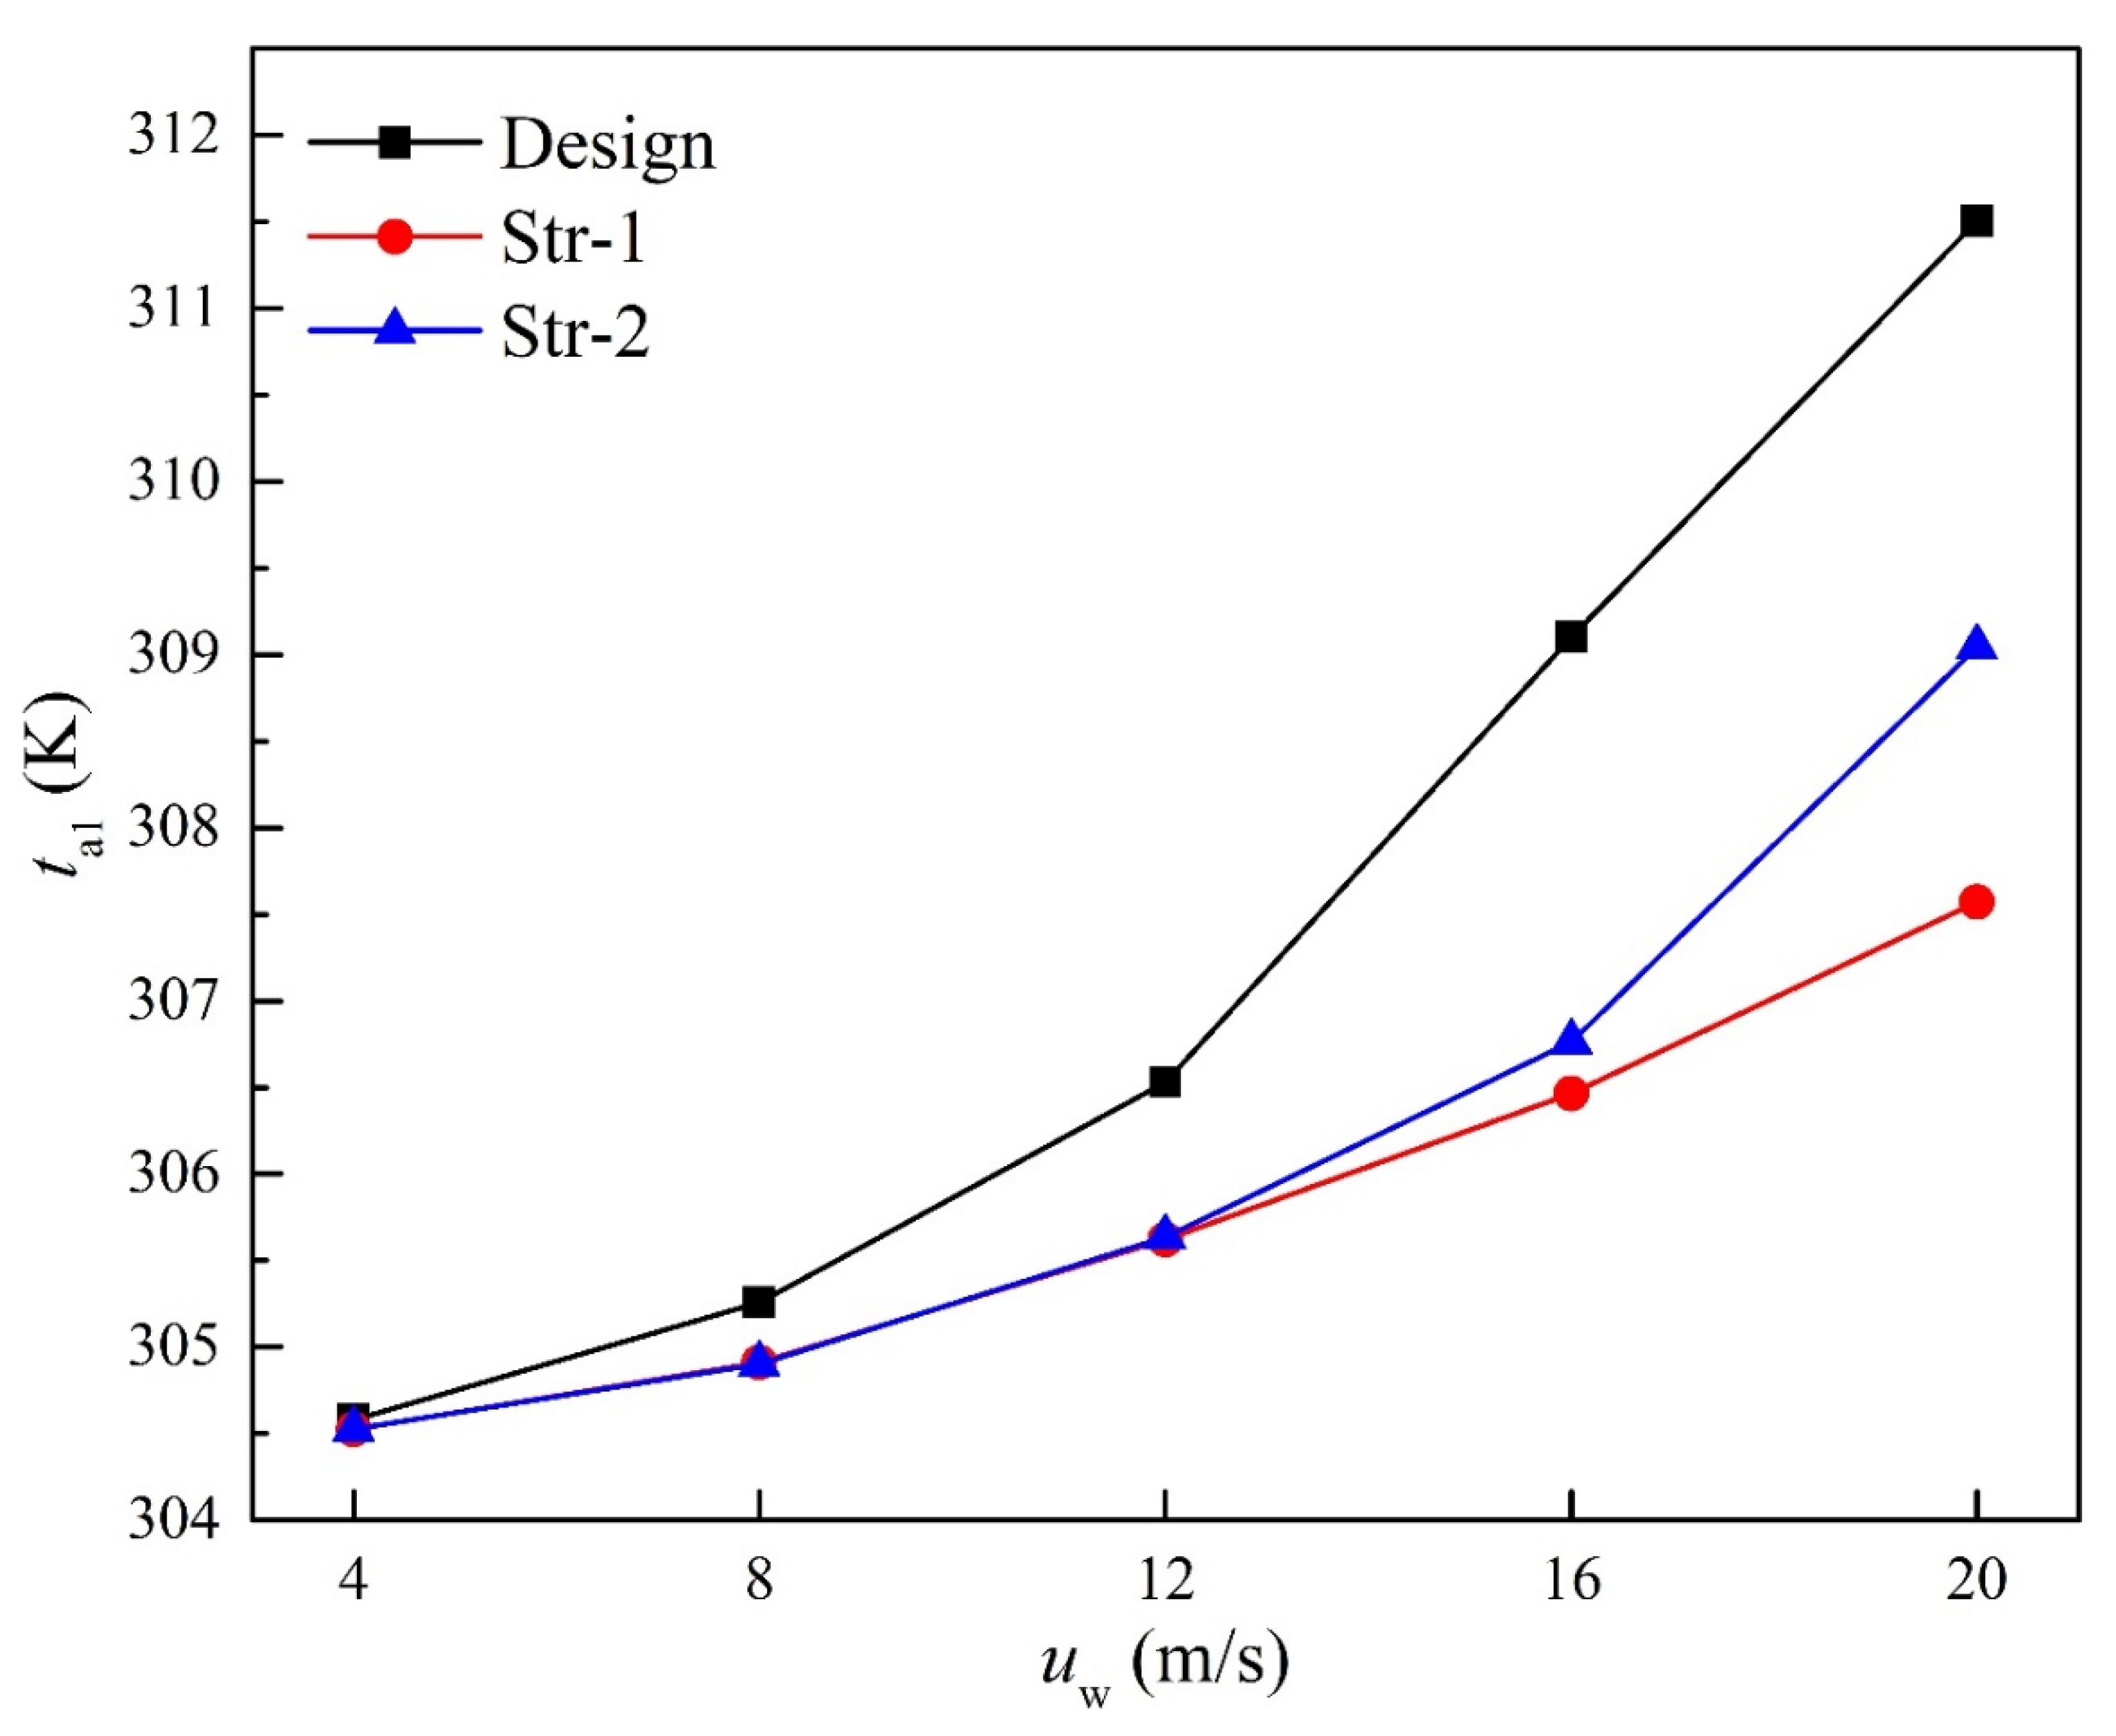
The average inlet temperatures of cooling air at different wind speeds are given in Figure 10. A greater value of the ambient wind speed led to a faster increase in the average temperature, and the temperatures for Design cases were much higher than those for Str-1 and Str-2 cases at high wind speed. The average temperatures for Str-1 and Str-2 were almost the same when the wind speed was smaller than 12 m/s, as also illustrated in Figure 9. The average temperatures for Str-1 grew more slowly than other operating methods at high wind speeds. The biggest temperature difference between Design and Str-1 cases reached 3.93 K when the wind speed was 20 m/s.
As wind speeds of 4 m/s, 12 m/s, and 20 m/s were selected as representative wind conditions, the distribution of volumetric flow rate of each fan for three operating methods is presented in Figure 11. It shows that the volumetric flow rates of cooling air increased rapidly along the wind direction. Compared with design conditions, the flow rates of the first row on the windward side for Str-1 and Str-2 cases were increased, becoming more pronounced at low wind speeds. The distribution of the volumetric flow rate of Str-1 was relatively more uniform compared to the design conditions. For Str-2, the leeward fans provided almost the same volumetric flow rate of cooling air, except for the highest wind speed.
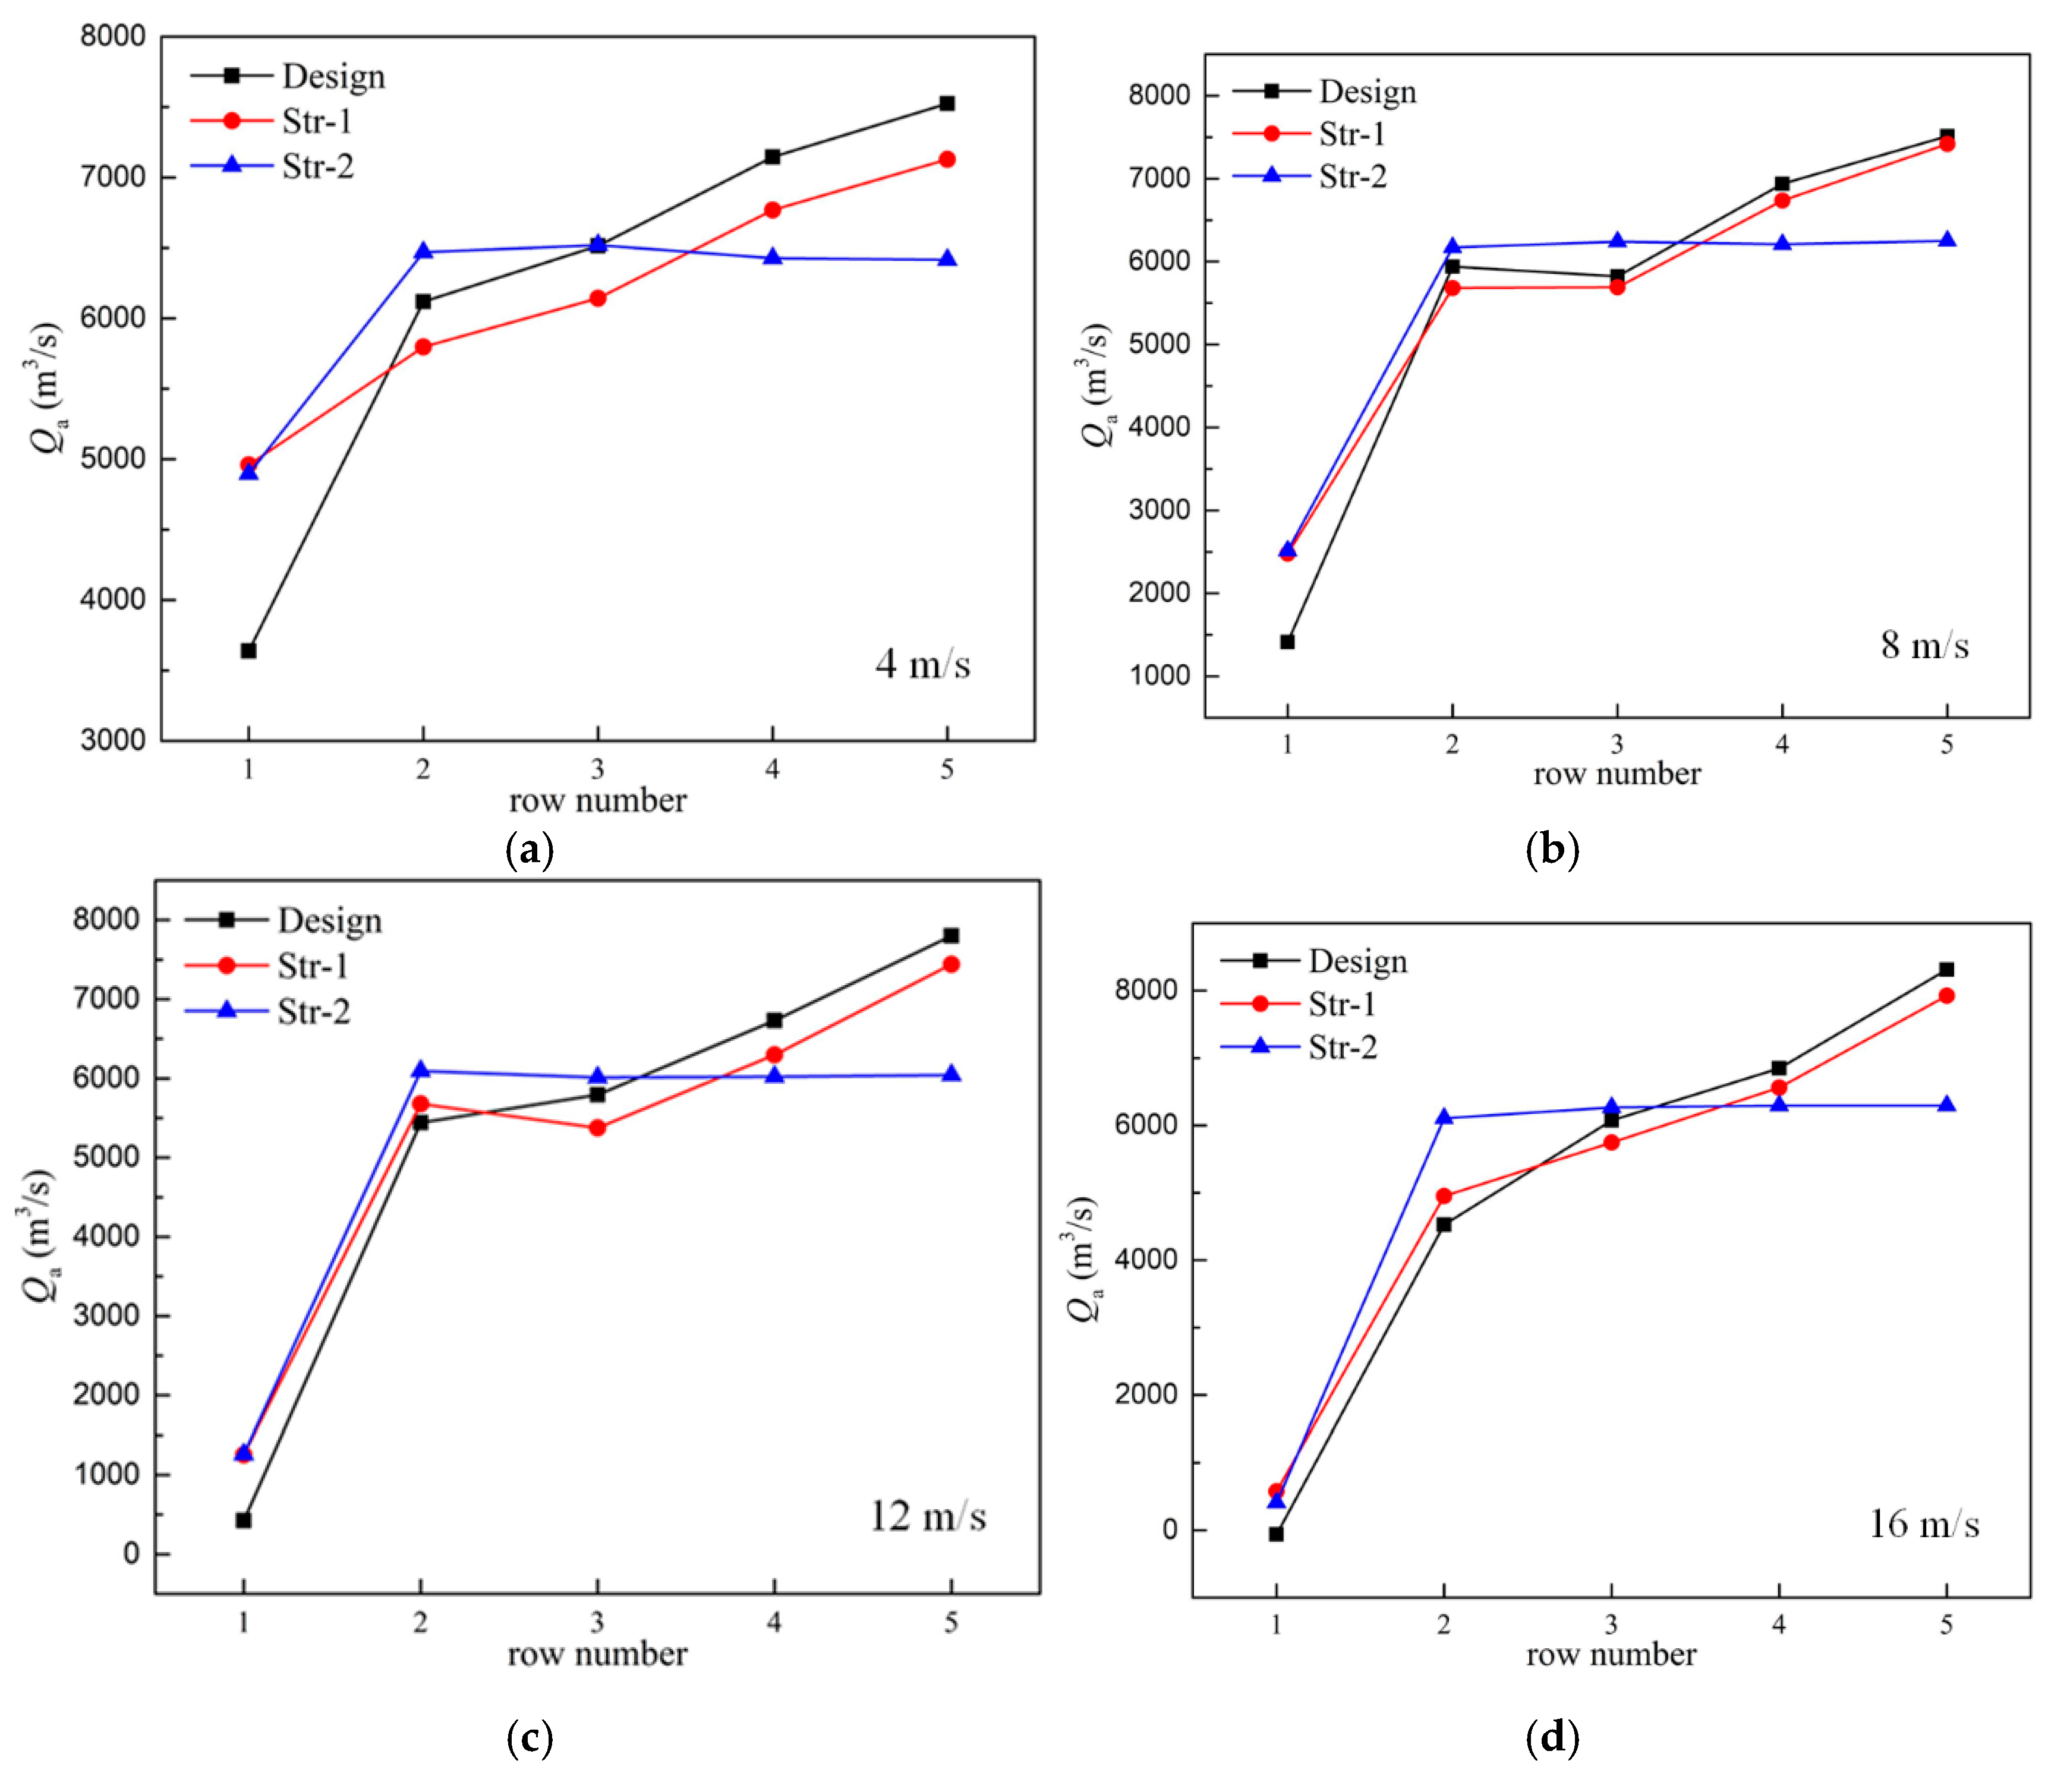
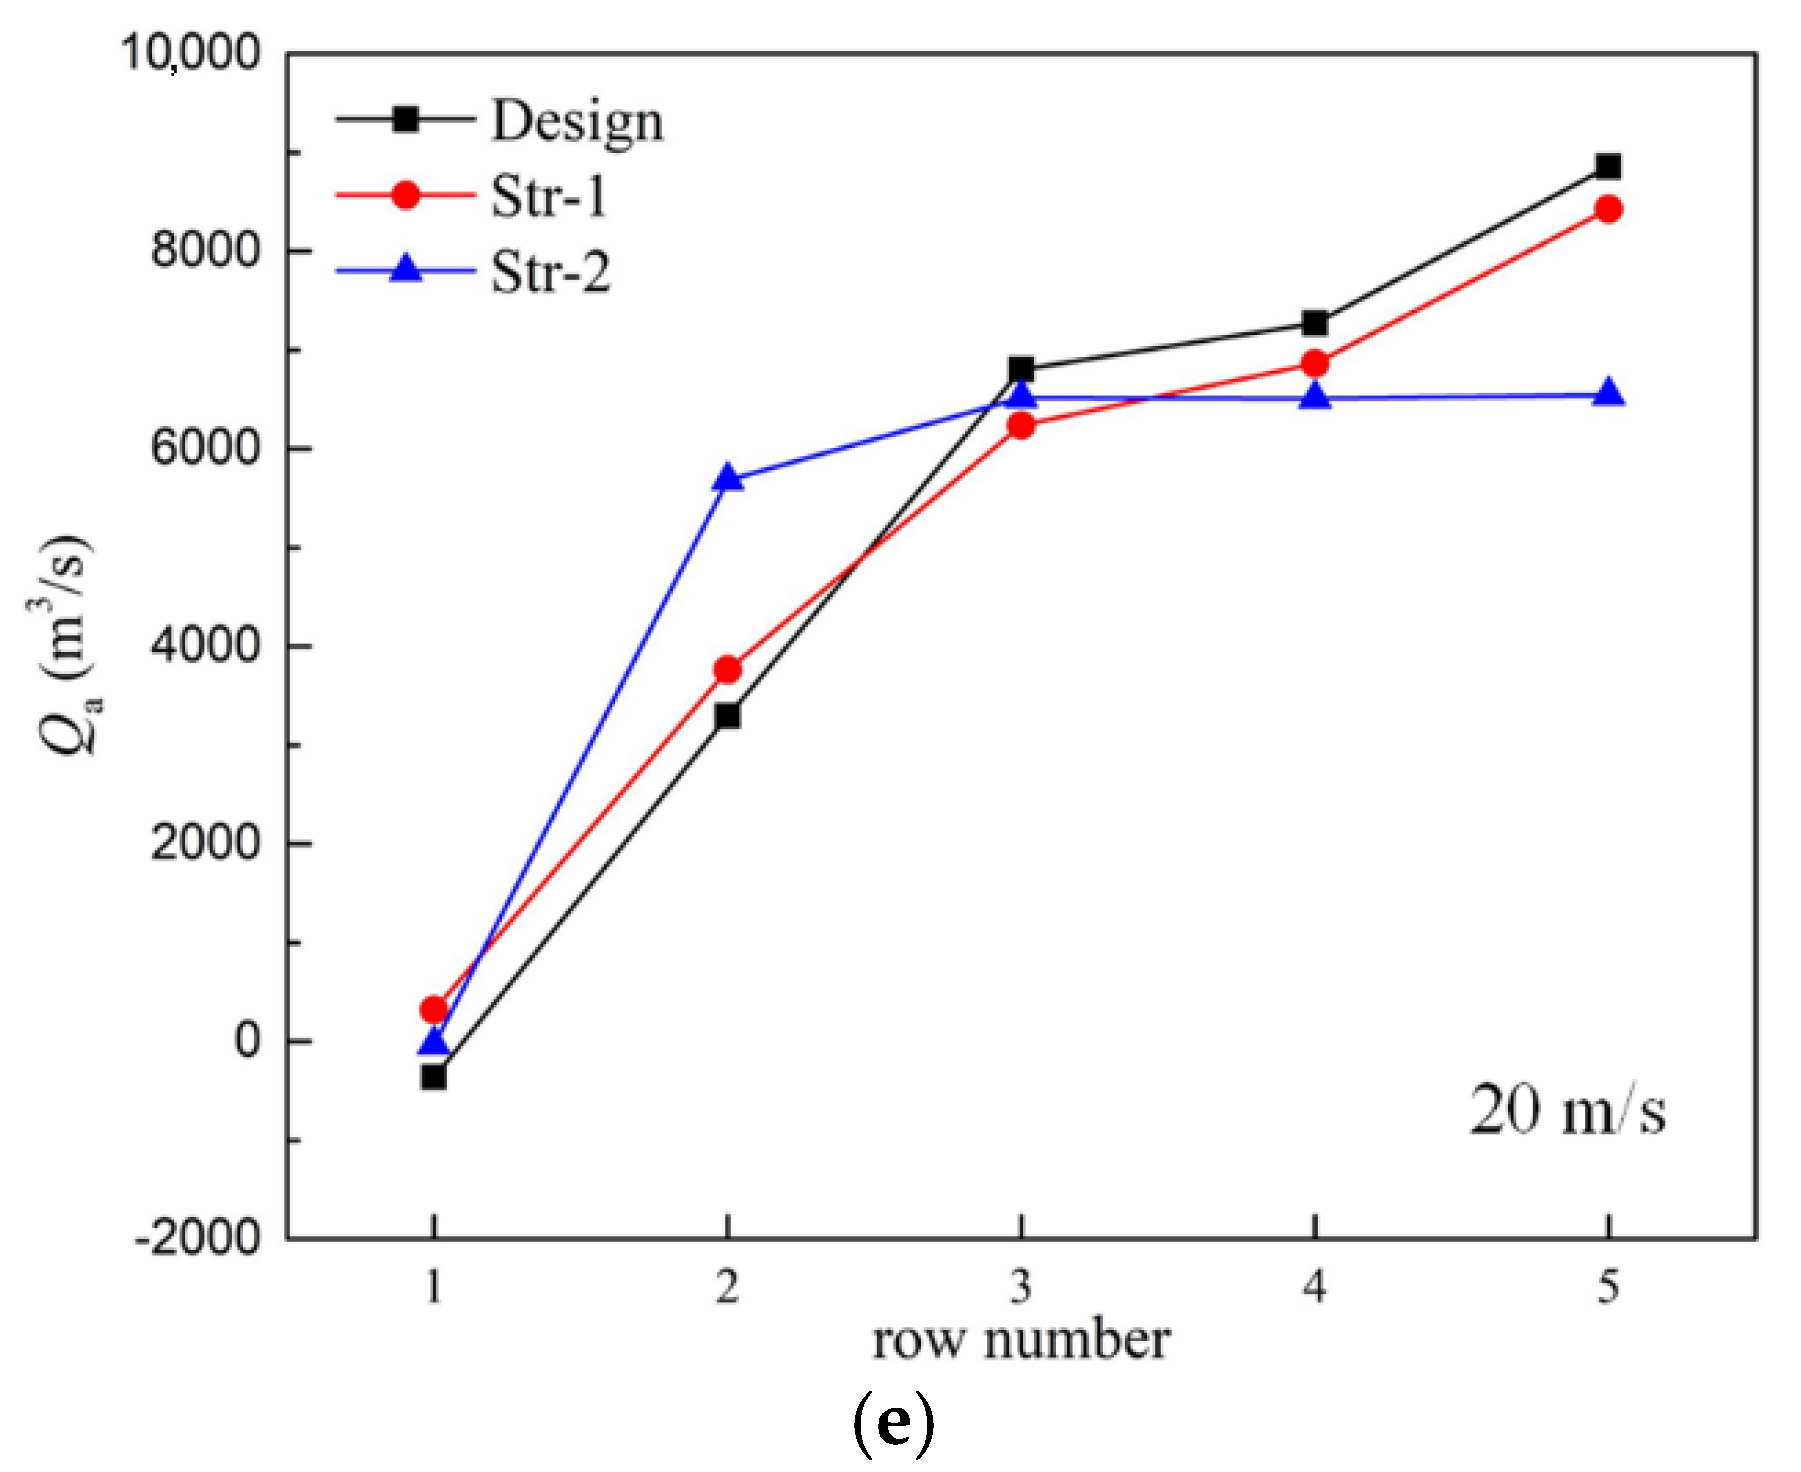
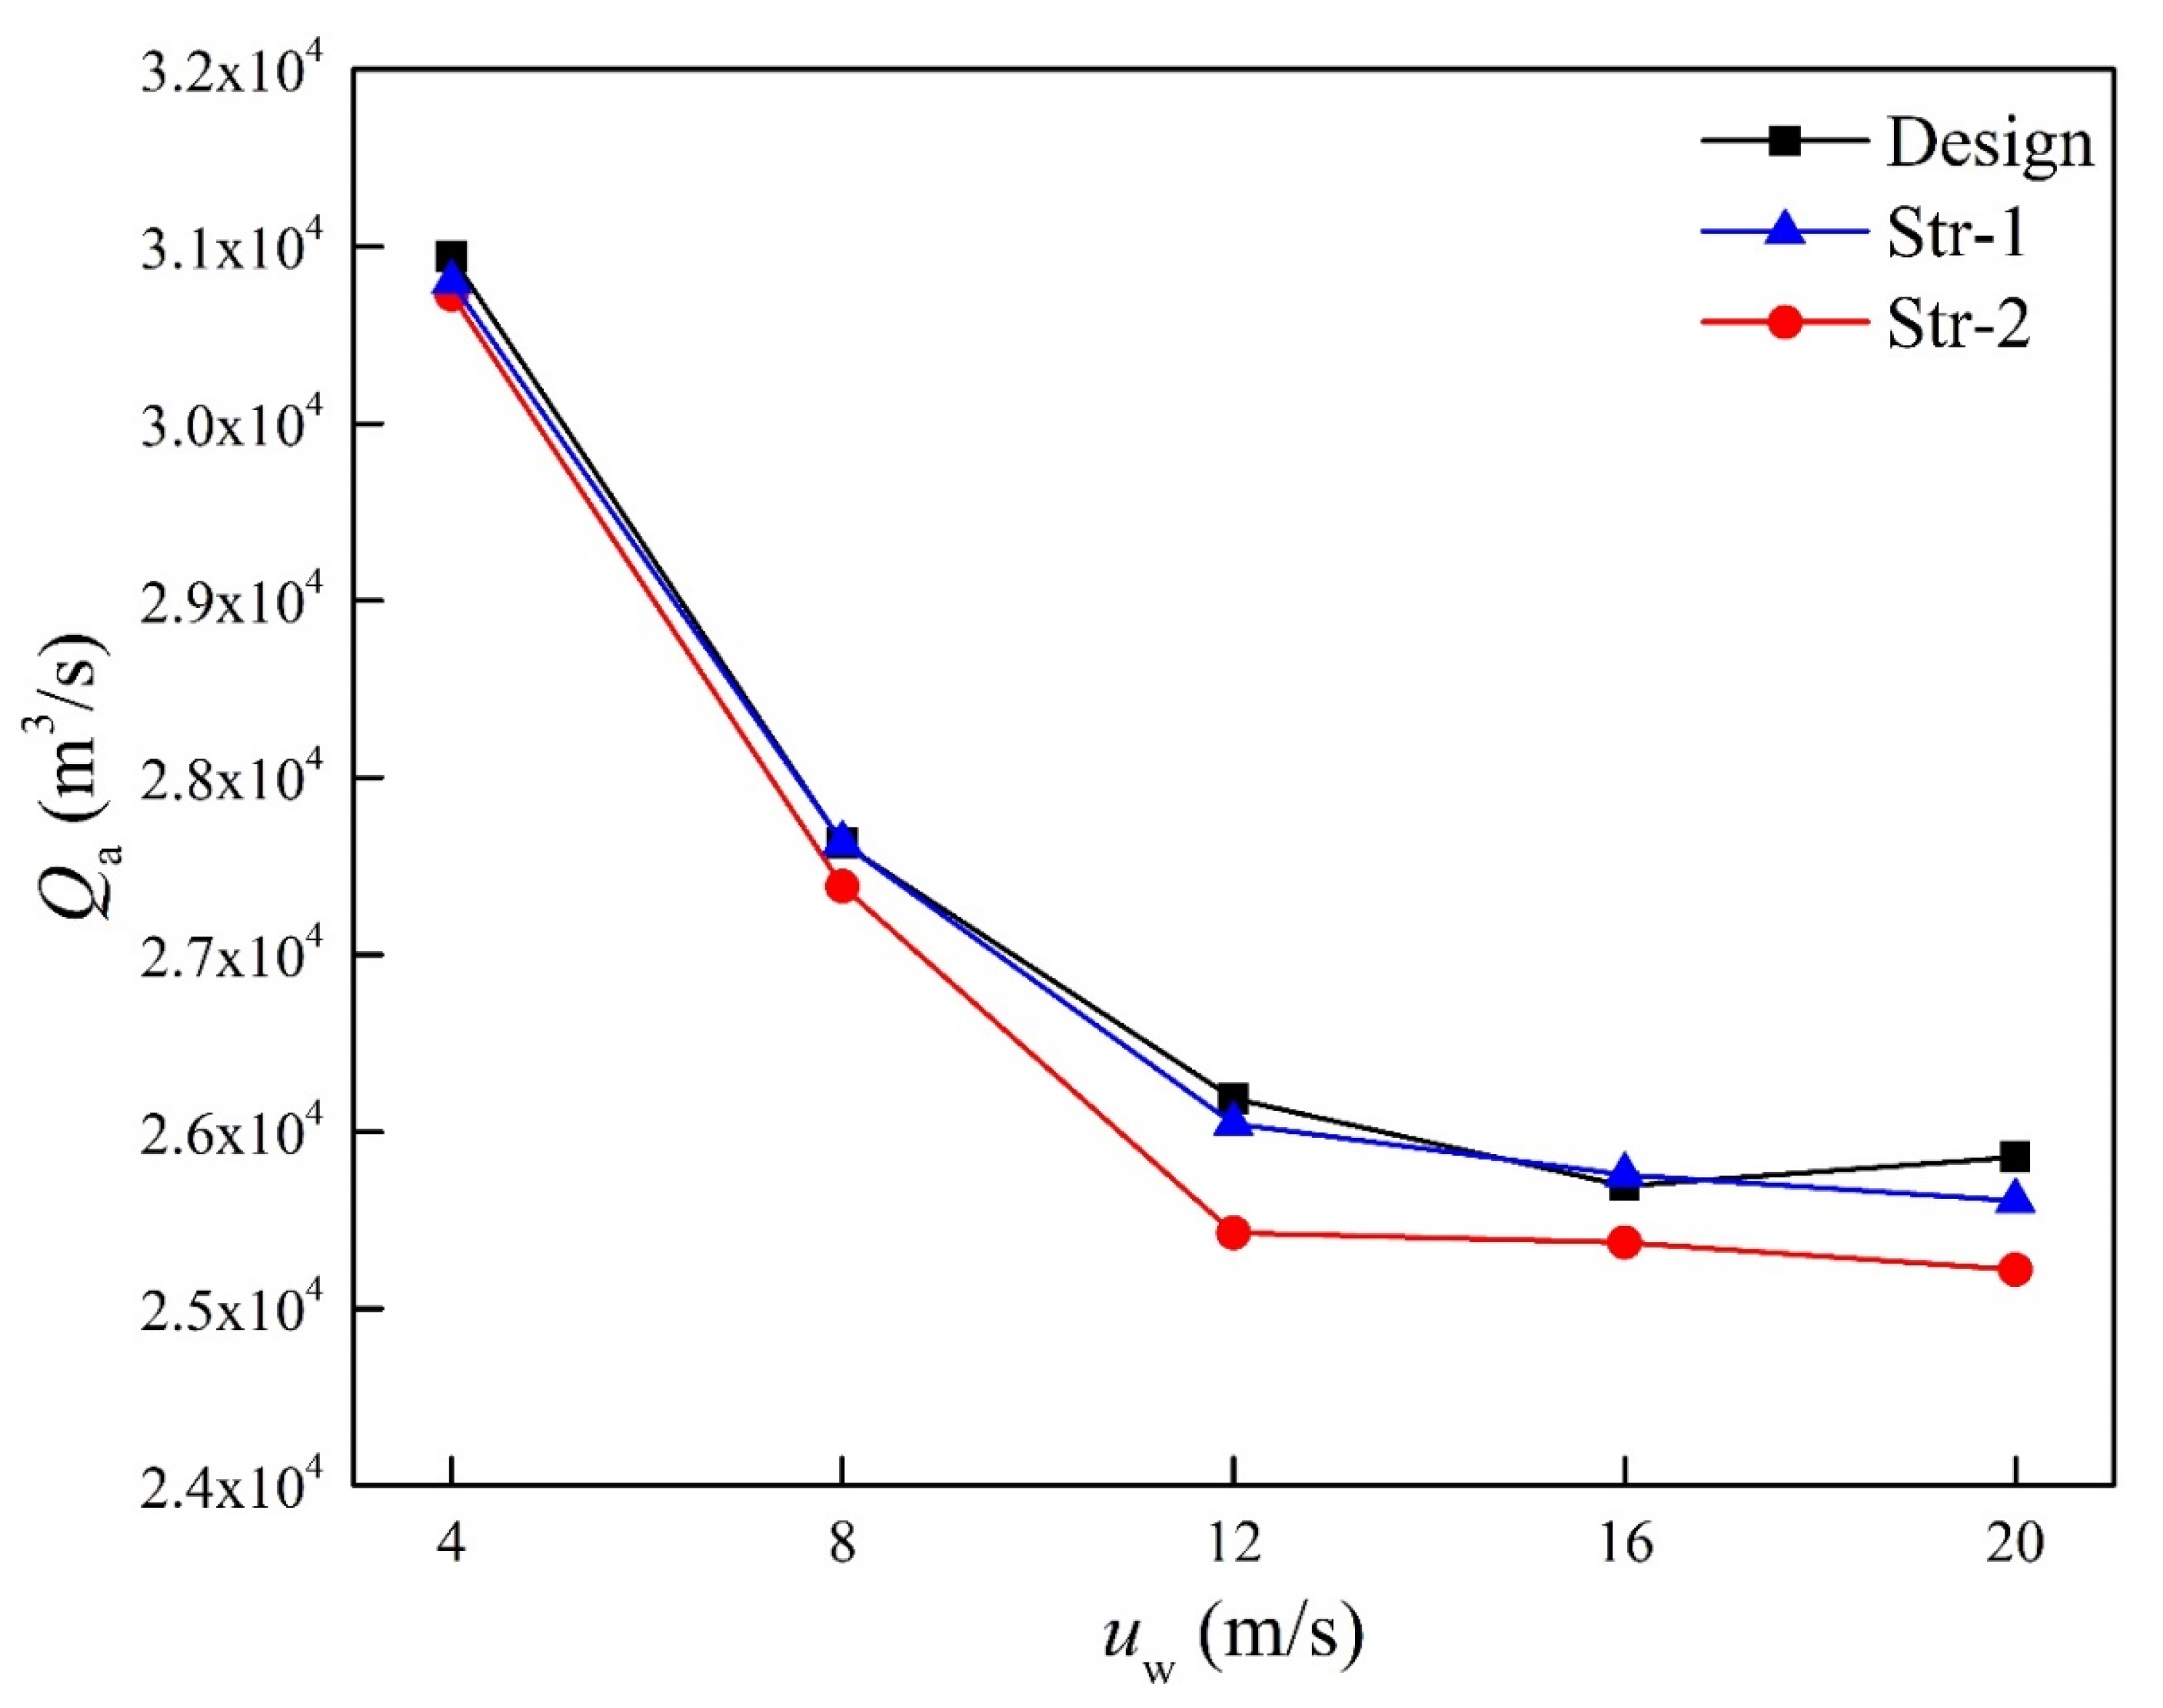
Figure 12 shows the total air volumetric flow rates of each row at different wind speeds. In general, the high speed of upwind fans in Row 1 could enhance the volumetric flow rate, but this trend became smaller as the wind speed increased. The volumetric flow rates of leeward fans in each row for Str-2 were very consistent upon adjusting the fan speed. For Str-1, the volumetric flow rates for Row 3 to Row 5 were basically reduced proportionally compared to the design cases. The volumetric flow rates of Row 2 of Str-1 were smaller than the design conditions at low wind speeds, and the situation was just the opposite at high wind speed although the speeds of leeward fans were lower than the rated speed. Figure 13 gives the total volumetric flow rates. The cooling air flow rates required by Design and Str-1 cases were nearly the same, which were both larger than Str-2 cases, proving that Str-2 was most beneficial to the heat transfer of ACCs.
It can be concluded that Str-1 led to a bigger improvement in cooling air temperature while Str-2 optimized the flow field to a greater extent.

4.2. Rotational Speed

For convenience, a new parameter, the ratio of fan speed Rn, is proposed and defined with the following formula:
R n = n n 0 × 100 % .
The ratios of the rotational speed of leeward fans for Str-1 are given in Table 4, showing that the actual fan speeds on the downstream side were reduced under windy conditions and the highest value appeared at the wind speed of 8 m/s.
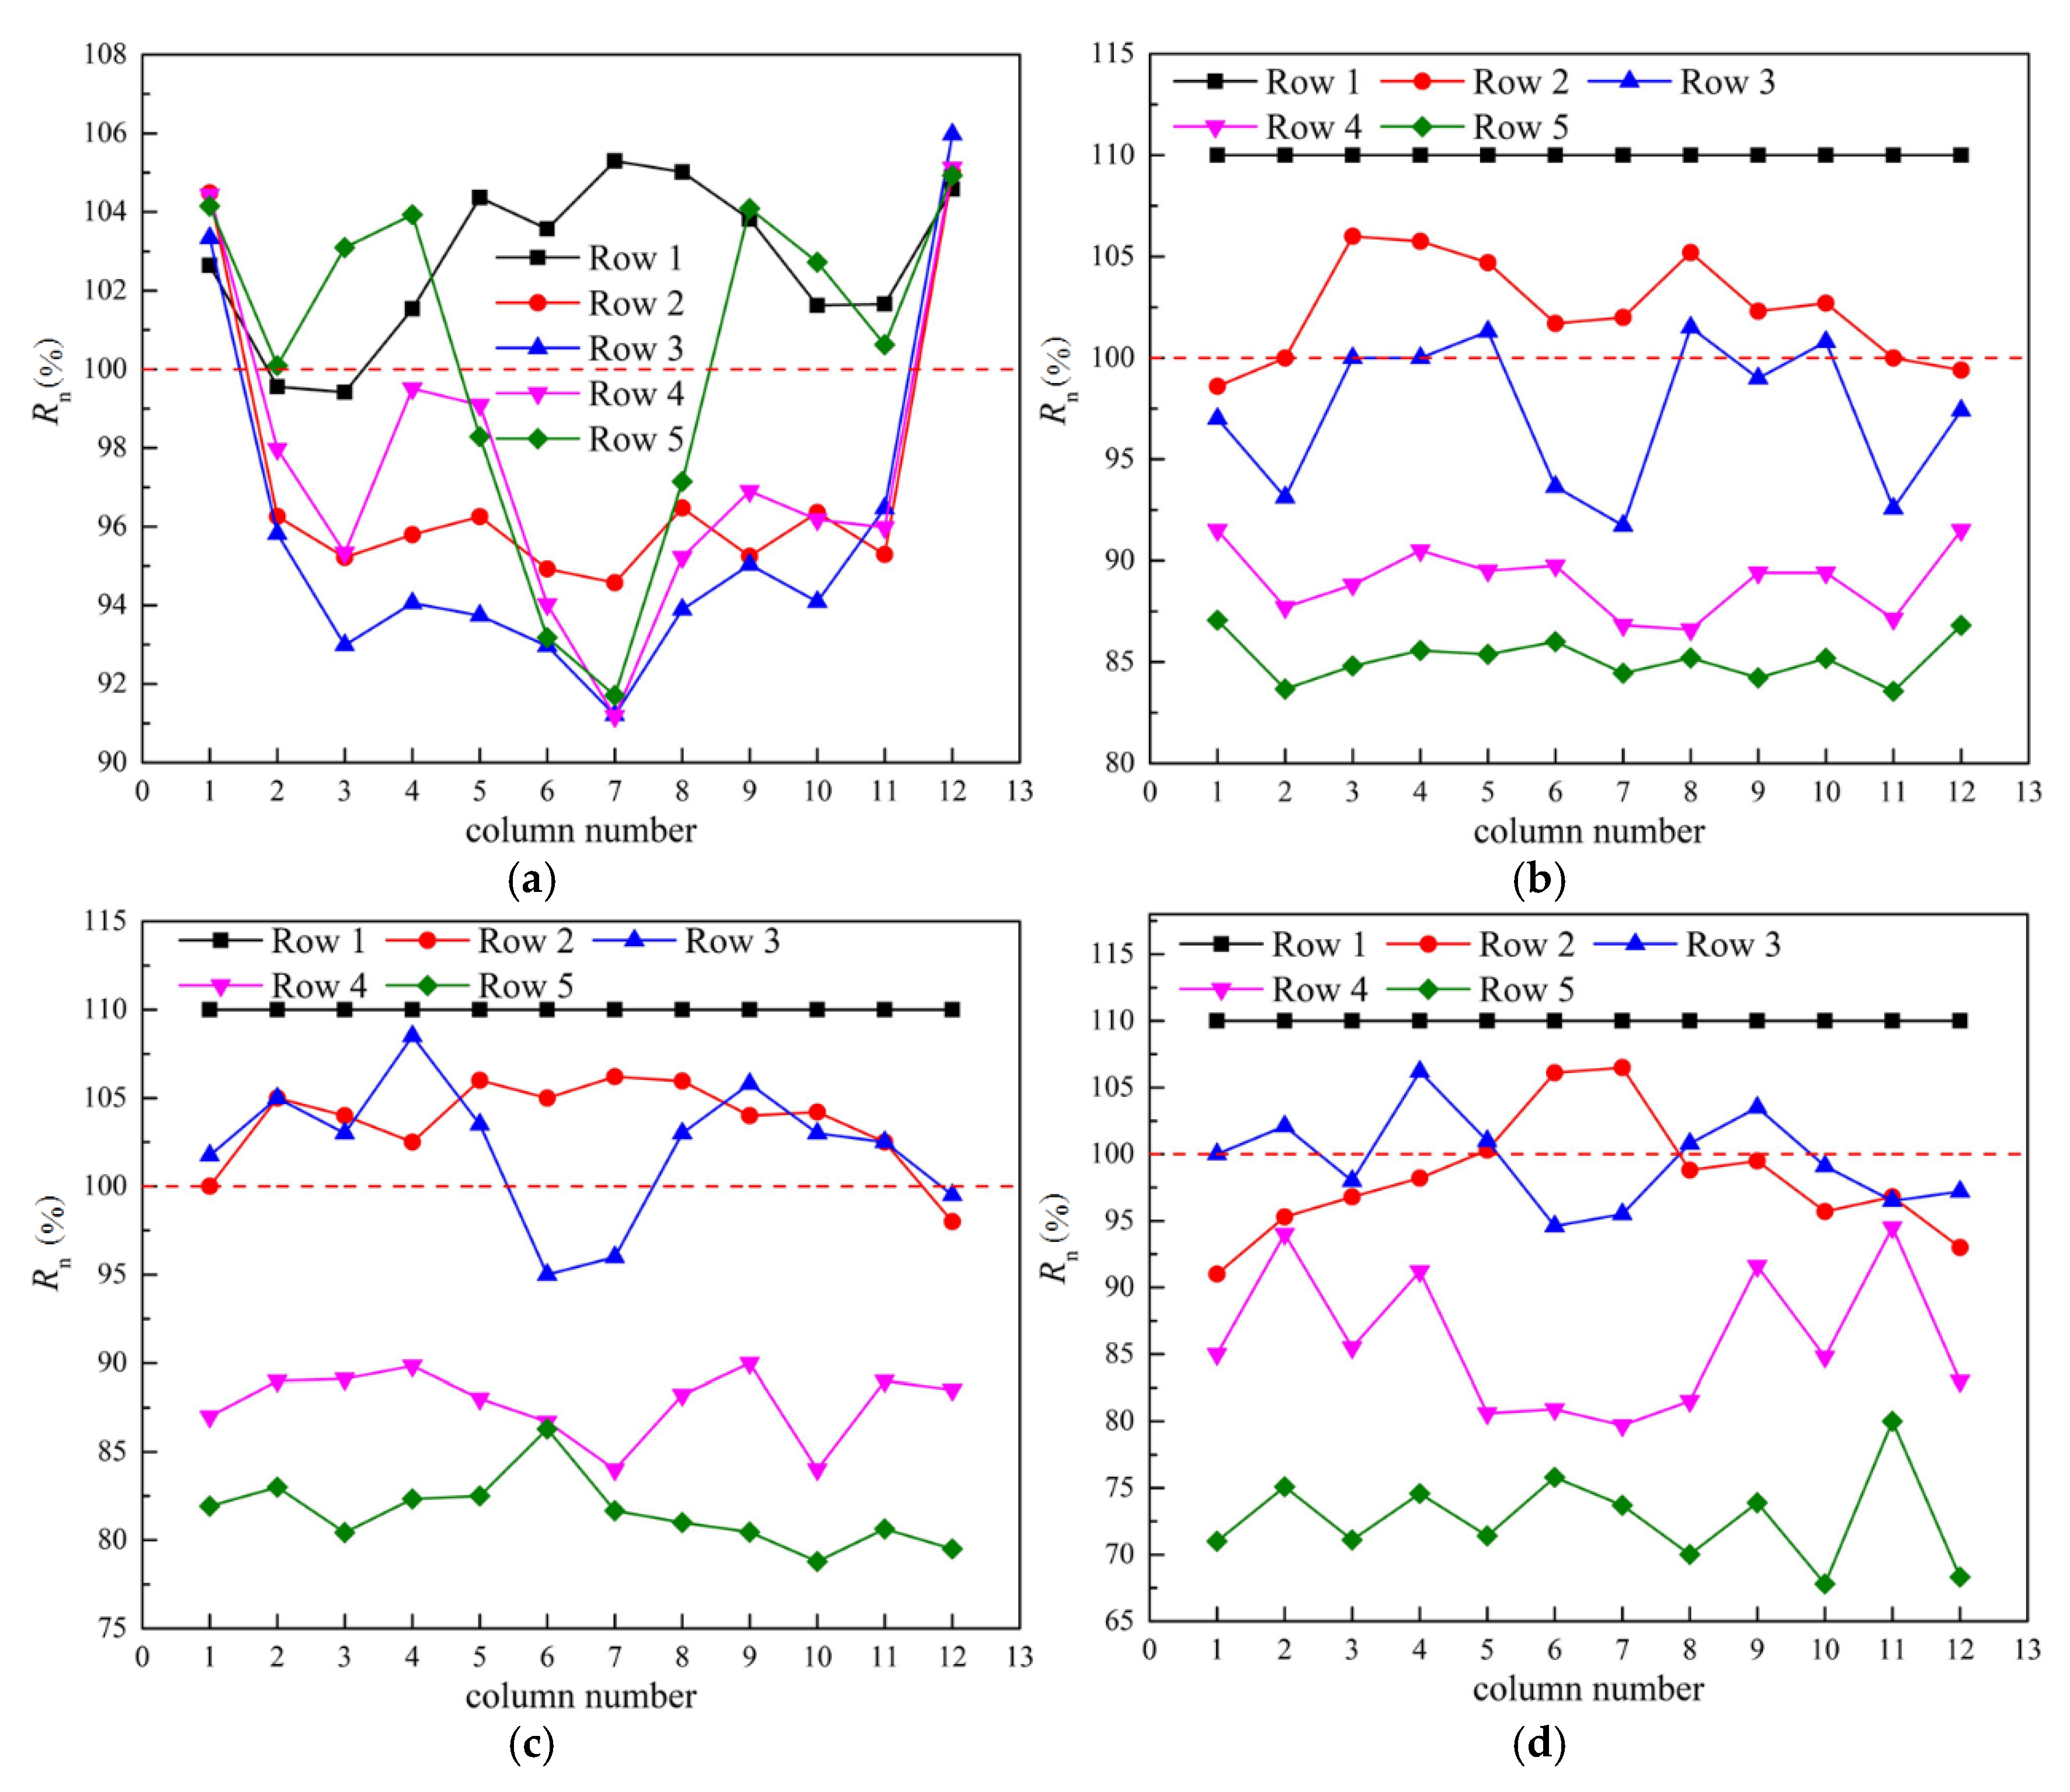
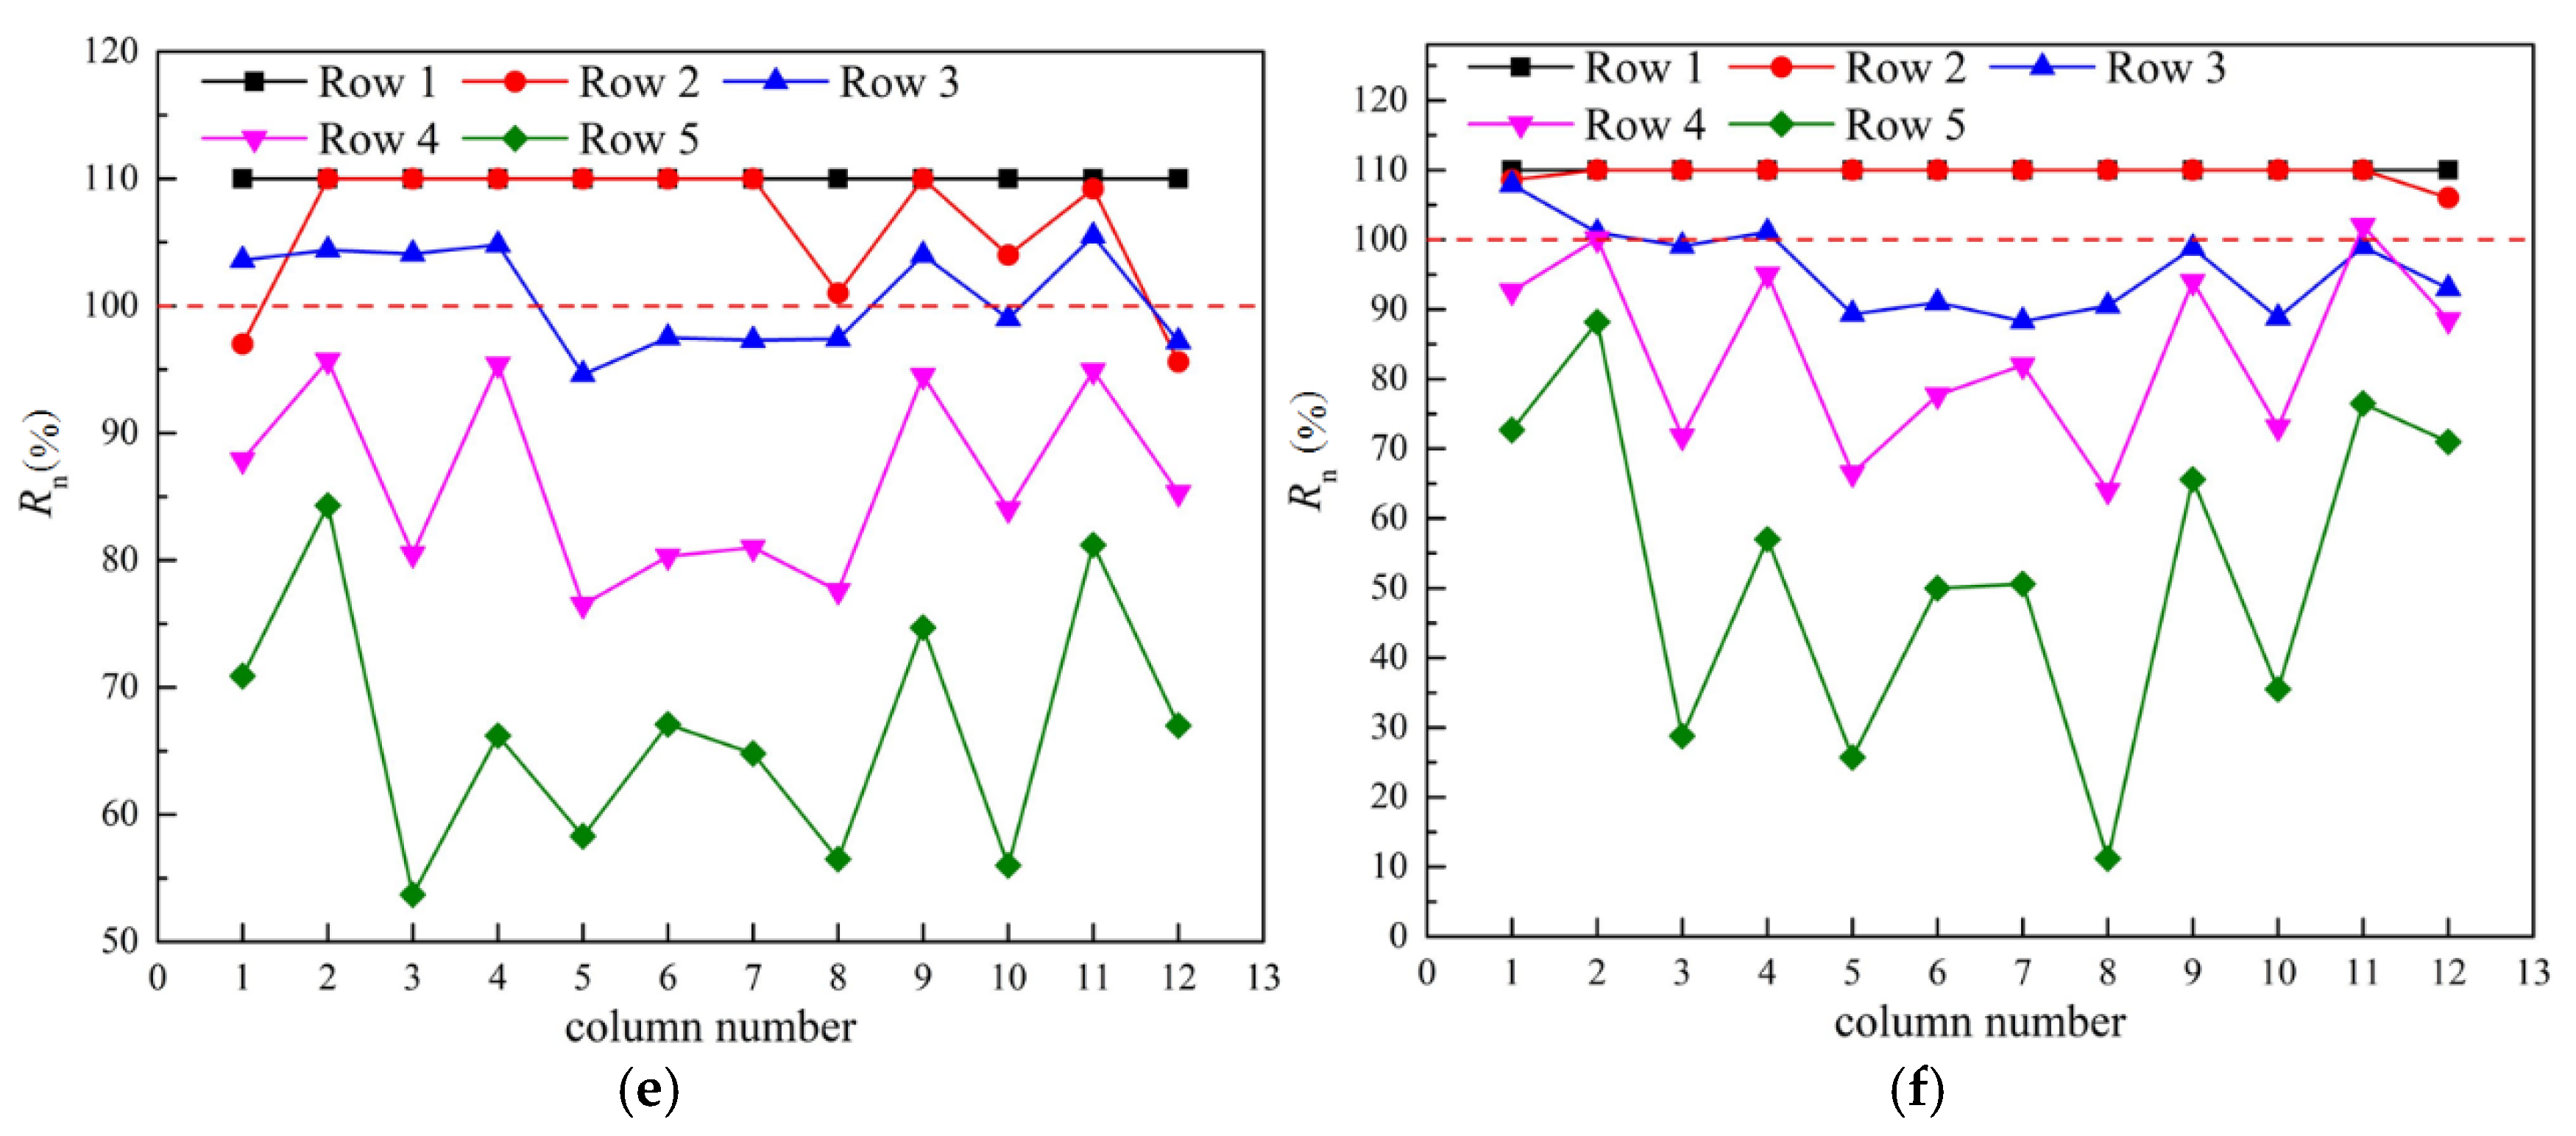
The distribution of rotational speeds of Str-2 is shown in Figure 14. Without wind, as shown in Figure 14a, the speed ratio of all fans in Column 1 and Column 12, as well as some fans in Row 1 and Row 5, exceeded 100. The speeds of other fans were lower than the rated speed. Under windy conditions, the speed ratios of the fans in Row 1 reached the maximum value of 110 and almost all increased to 110 in Row 2 when the wind speed reached 20 m/s. The fan speeds of Row 3 were basically around the rated speed. The speed of the fans in the last two rows was basically lower than the rated speed. In addition, the fluctuation range of the rotational speeds of the fans in the last two rows became larger with the increased wind speed. Except for the second and third rows, the speed of the fan along the wind direction was reduced.

4.3. Power Consumption

For analyzing the influence of speed adjustment on the heat rejection of condenser cells, an evaluation index, Rf, is proposed below, which refers to the ratio of heat rejection per energy consumption to the value under rated conditions. It can be considered as the cost-effectiveness of the fans to some extent.
R f = Φ i / P f , i Φ i , 0 / P f , i , 0 ( i = 1 , 2 , 3 , 4 , 5 ) ,
where Φi is the total heat rejection of ACCs in row i, and Pf,i represents the total power consumption of fans in row i.
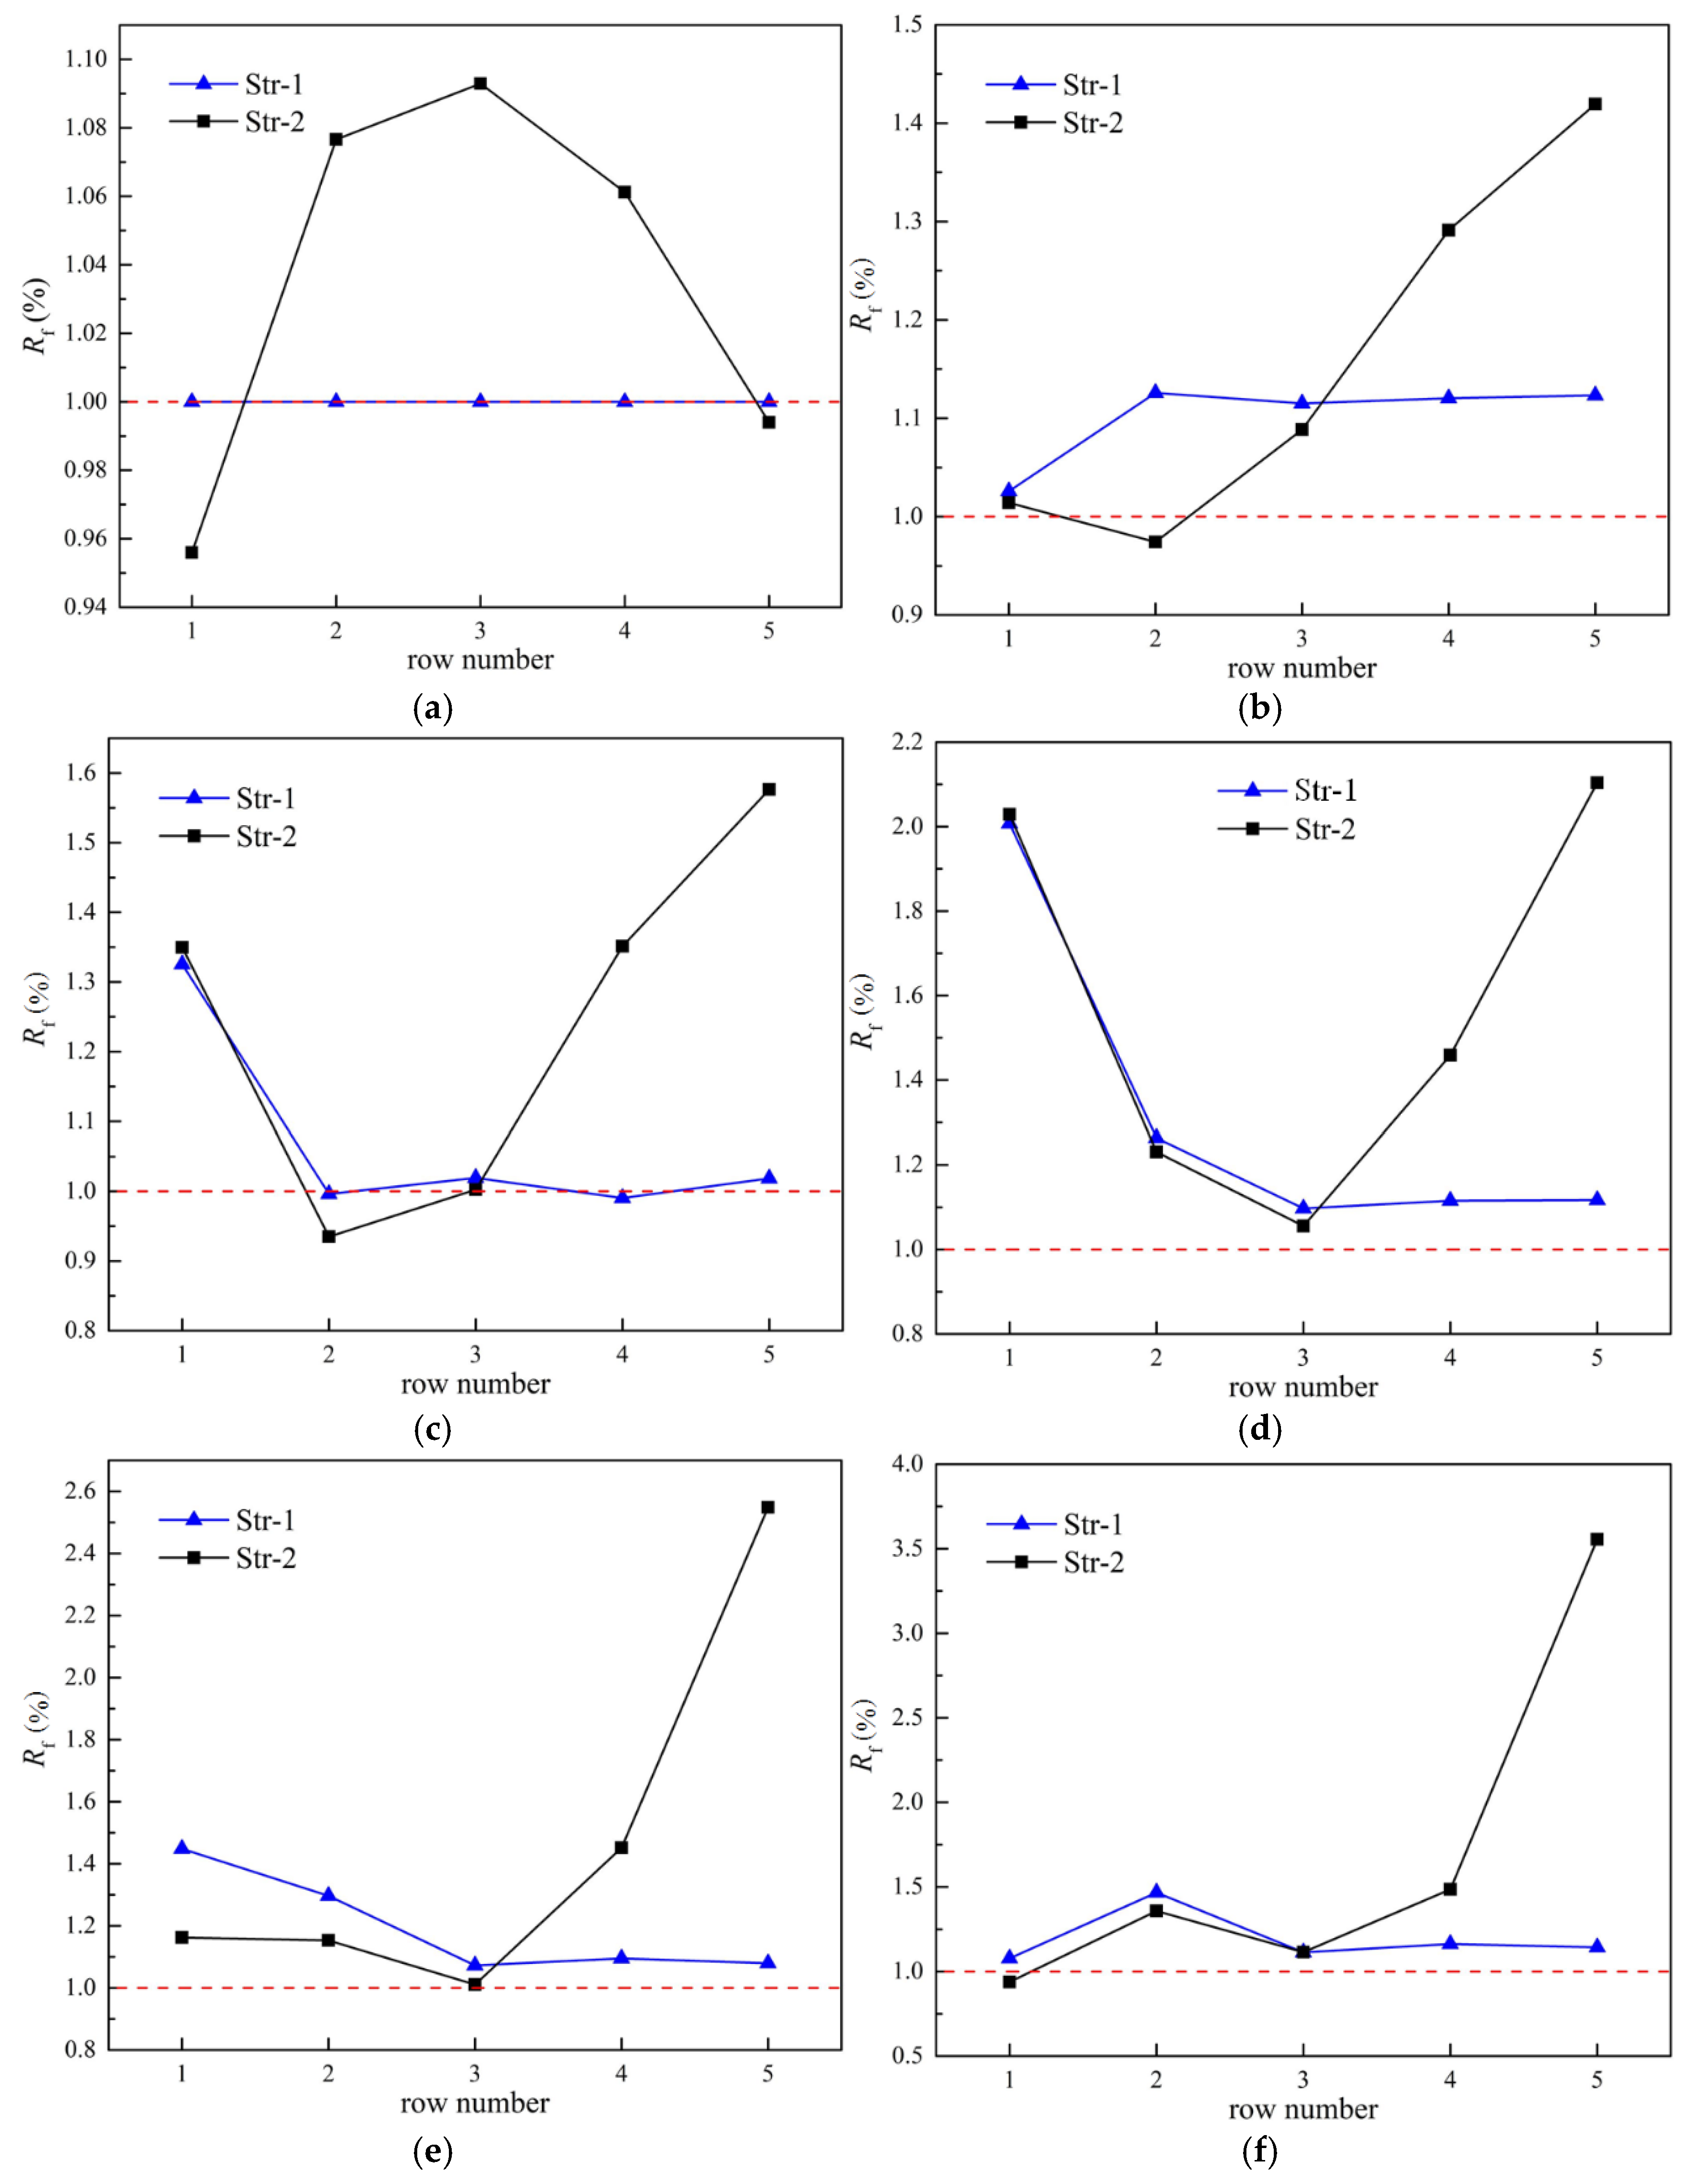
The values of Rf of Str-1 and Str-2 cases are demonstrated in Figure 15. Under the windless condition, the cost-effectiveness of the edge fans for Str-2 was reduced, while that of the middle fans was increased, and the third-row fan has the highest value, as shown in Figure 15a. In the presence of wind, the cost-effectiveness of fans in Row 1 for Str-1 and Str-2 cases gradually increased first and attained the maximum value under the wind condition of 12 m/s, before decreasing. For Str-1, the cost-effectiveness of the fans in Rows 3, 4, and 5 was basically the same and reached the minimum at 8 m/s. Under higher wind speeds, the cost-effectiveness of fans in Row 2 was significantly higher than that of the other leeward fans. This shows that the increase in the speed of the fans in Row 1 was beneficial to the operation of the fans in Row 2 at high wind speeds. For Str-2, the cost-effectiveness of the fans in Row 2 dropped firstly and then increased with the speed of the wind. Its value was less than 1 under low wind speed and exceeded 1 under high wind speeds. The cost-effectiveness of the last two rows gradually increased. Moreover, the cost-effectiveness of Row 3 was always similar for Str-1 and Str-2 cases. This shows that the improvements in the cost-effectiveness for Str-2 were more significant.
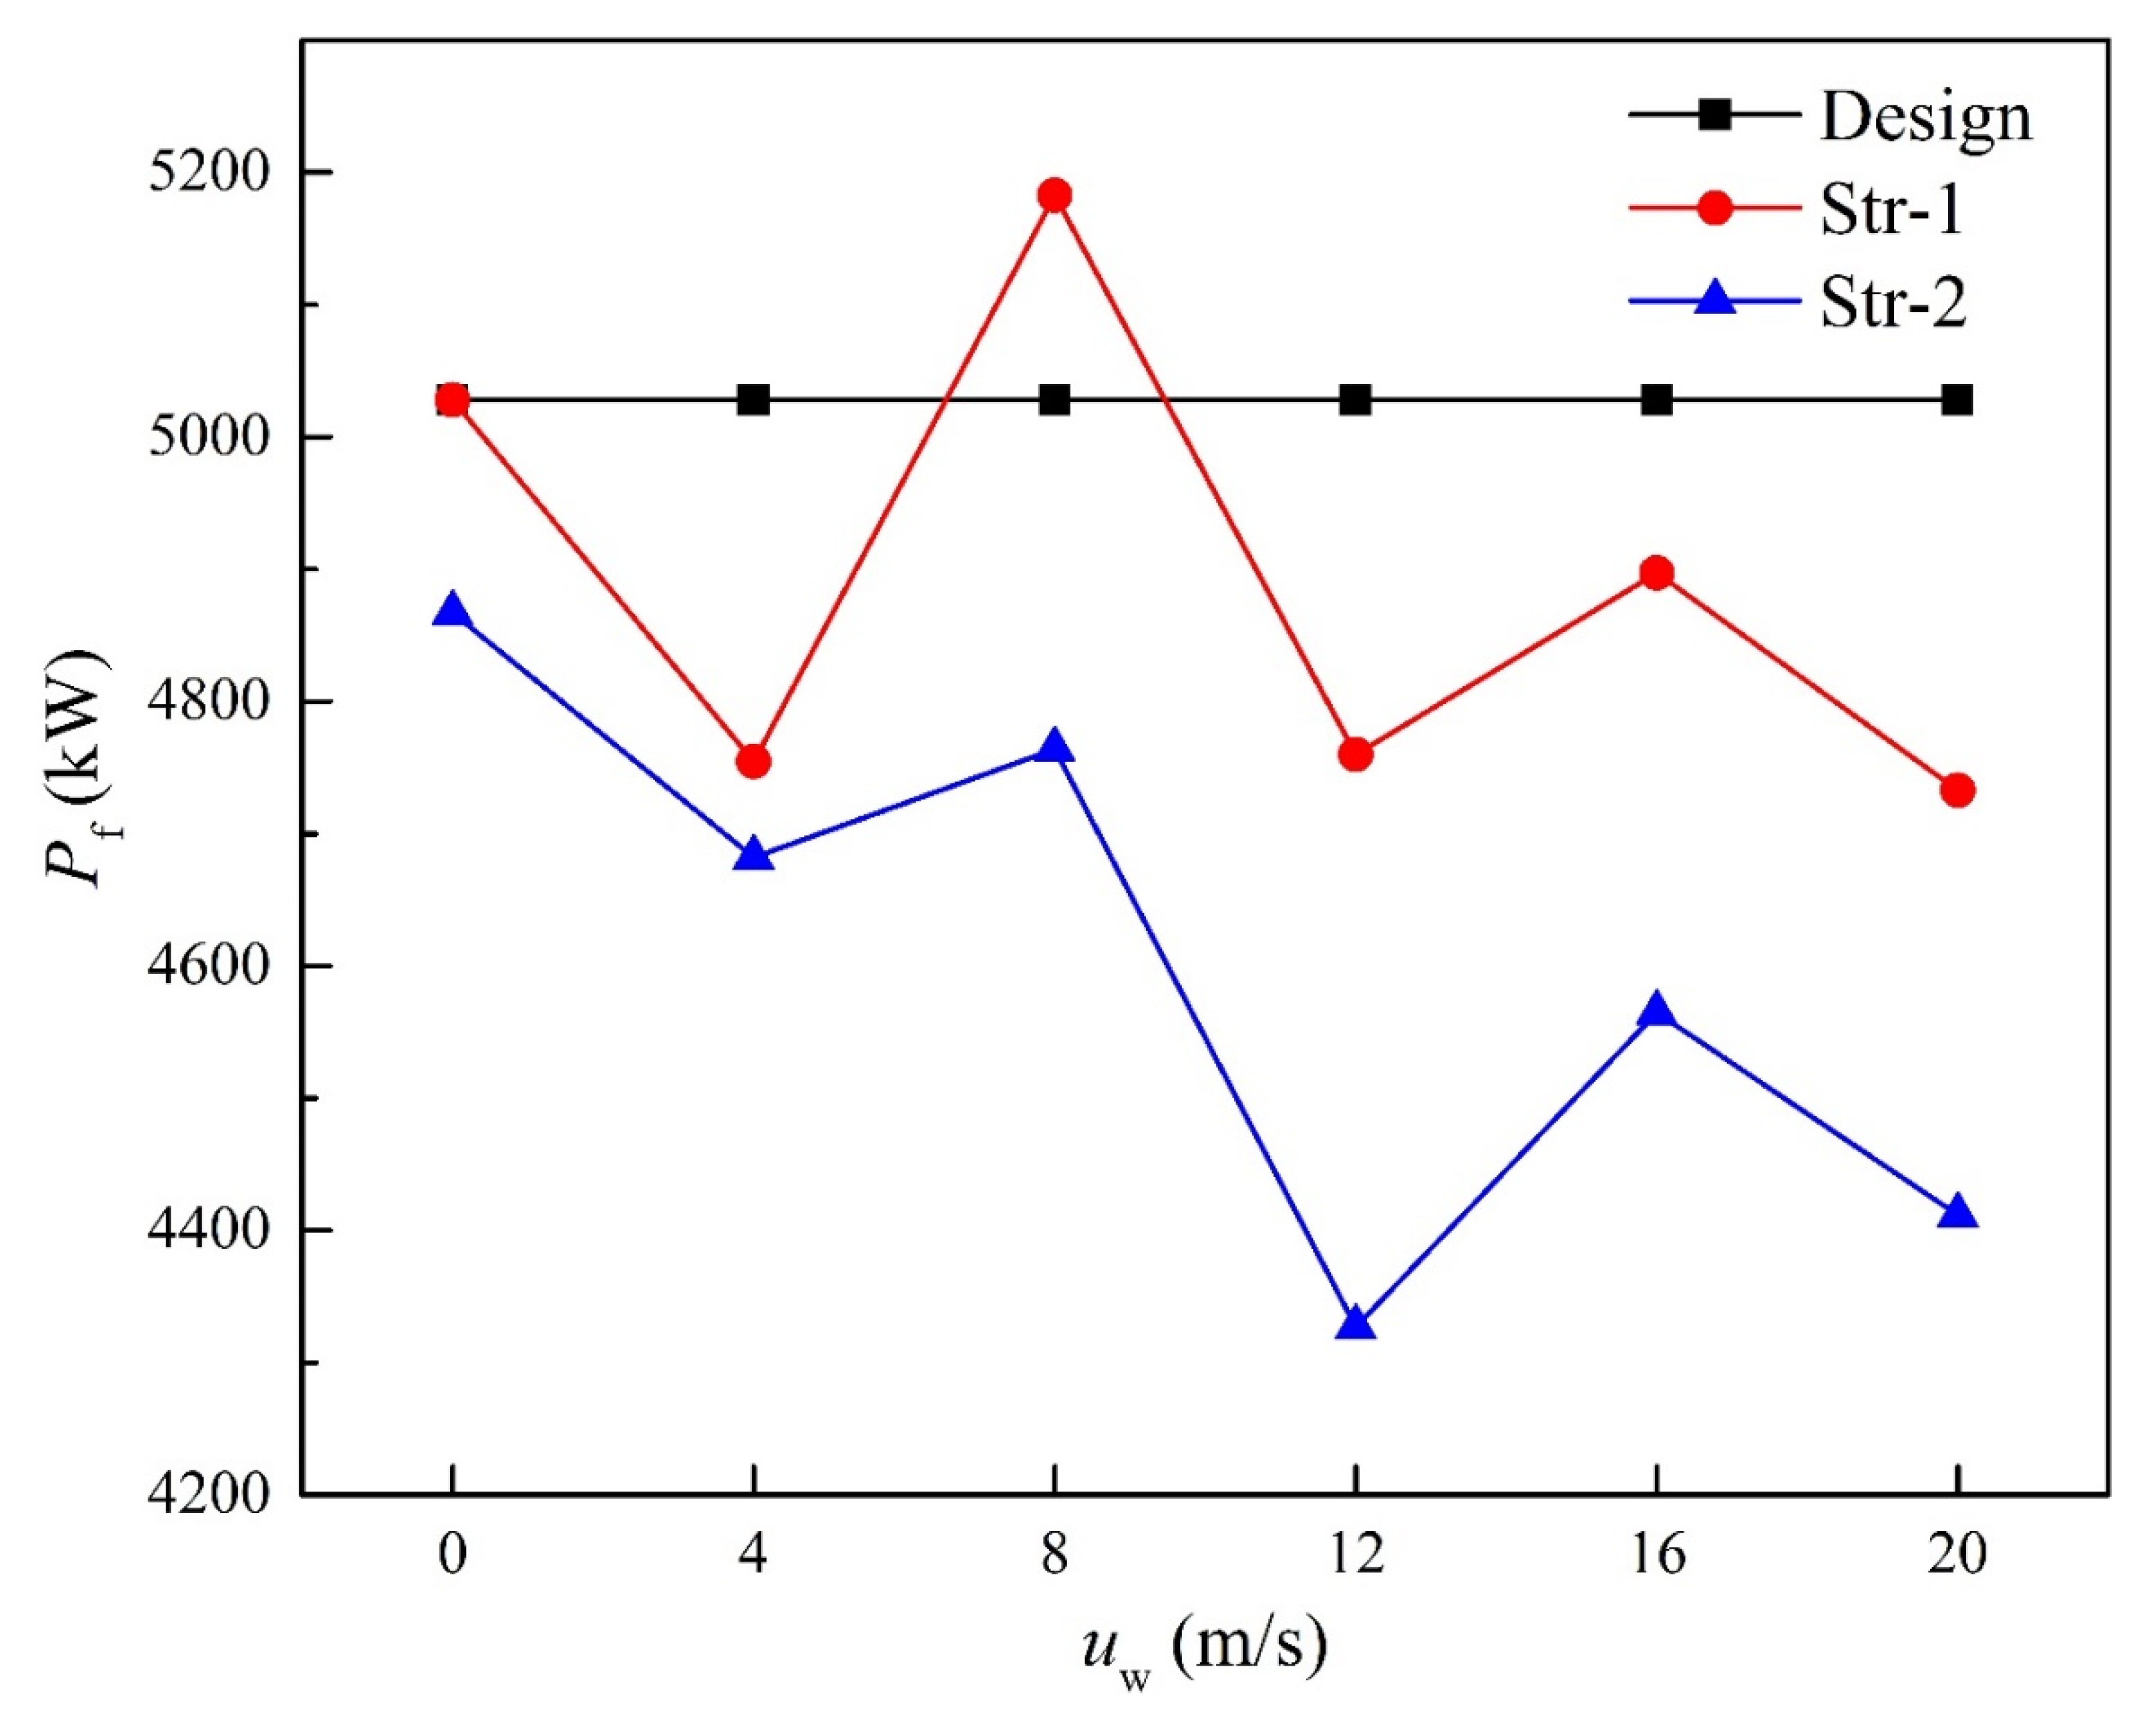
The total power consumption of fans for different strategies is compared in Figure 16. It can be observed that the changing trend was the same for Str-1 and Str-2. Str-2 could slightly reduce the power consumption of the fans in the absence of wind. Under windy conditions, the power consumption was highest when the wind speed was 8 m/s. The power consumption for the Str-2 case was minimal at any wind speed. Str-1 could also reduce the total power consumption of fans, except for the wind speed of 8 m/s. The energy saved by Str-1 and Str-2 was not very different under the wind condition of 4 m/s. At higher wind speeds, the gap between the two strategies became very clear.
The saving-power ratio δf is proposed and calculated by the following formula:
δ f = P f P f , 0 P f , 0 × 100 % ,
where Pf is the total power consumption of the fan array.
The saving-power ratio for Str-1 and Str-2 cases under windy conditions is shown in Table 5. The maximum appeared at the wind speed of 12 m/s for Str-2 with a value of 13.94%. At high wind speeds, Str-2 performed much better than Str-1. It can be concluded that Str-2 could effectively reduce the operating cost of the power plant with DDCS, especially at high wind speeds. Moreover, the total power consumption of the fan array of Str-2 was reduced by 3.20% under windless conditions.
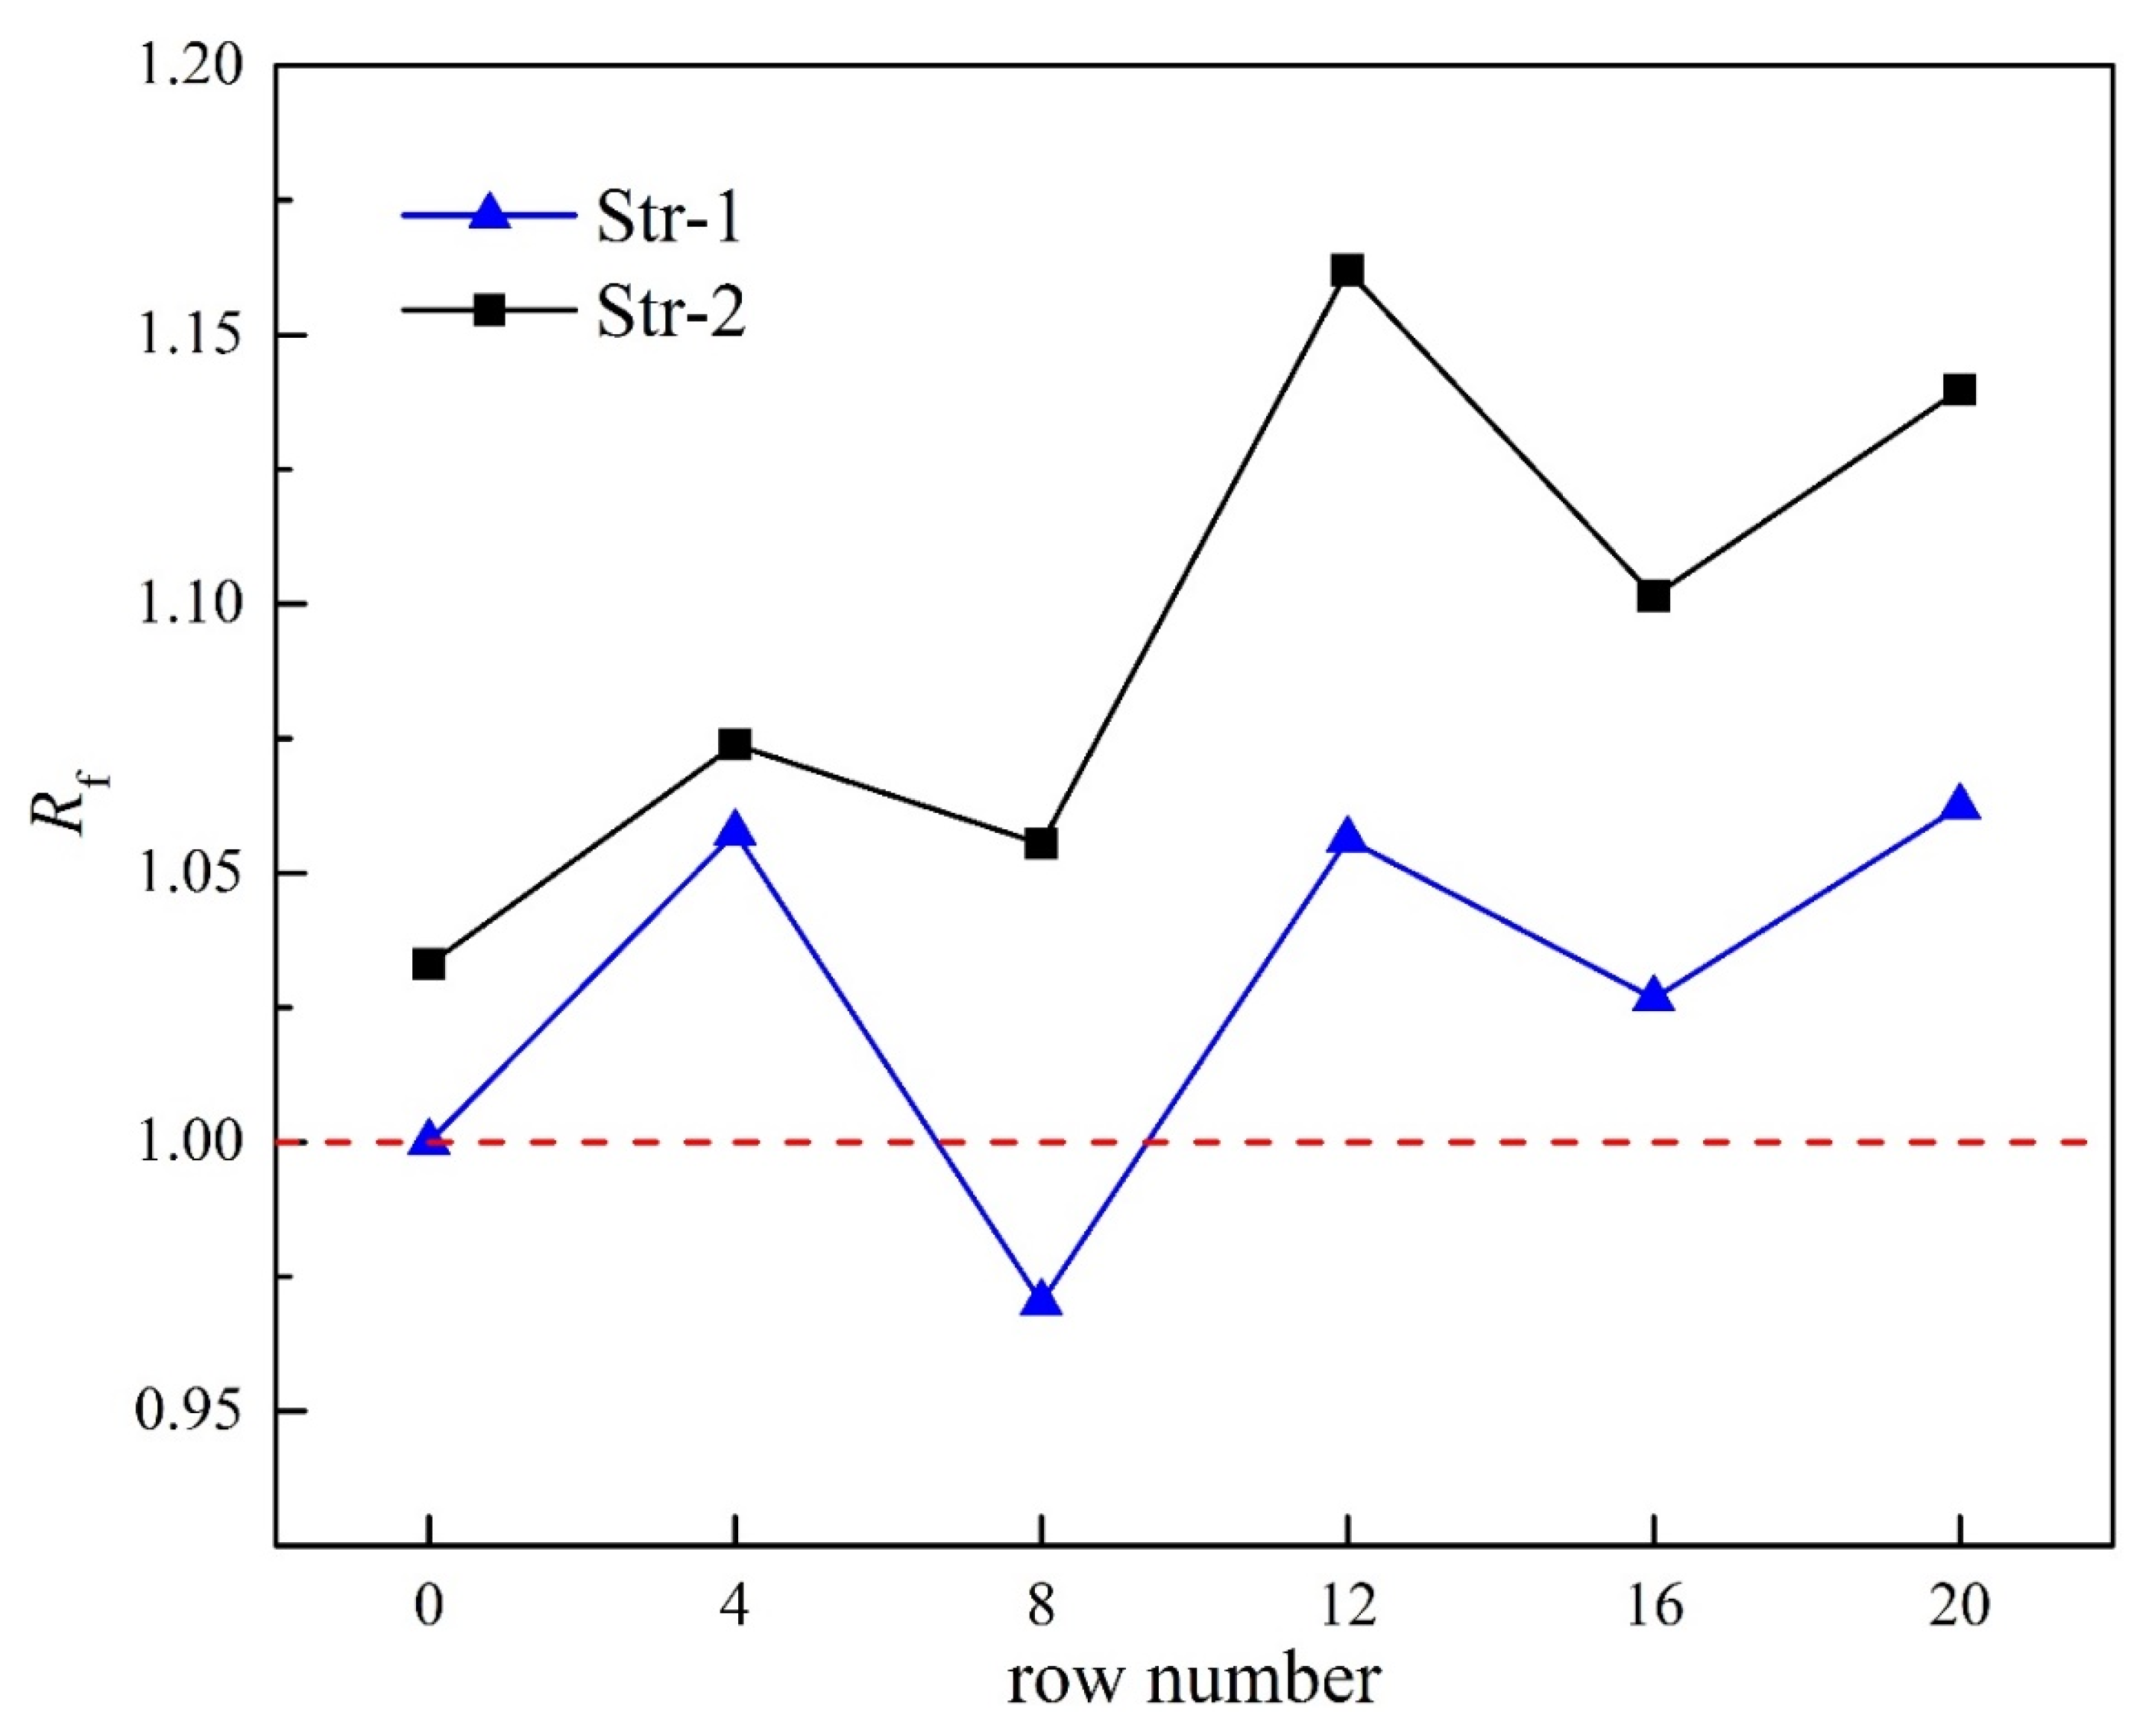
Figure 17 gives the cost-effectiveness of ACCs for Design, Str-1, and Str-2 cases at different wind speeds. It can be seen that the cost-effectiveness of the fan array in Str-2 was always the highest, and it reached 1.16 at the wind speed of 12 m/s. This shows that Str-2 improved the power efficiency of fans greatly.

5. Conclusions

In this work, two different fan adjustment strategies, Str-1 and Str-2, were proposed to improve the performance of ACCs in a 2 × 300 MW direct dry cooling power plant under various ambient conditions. The heat exchanger model was used for the finned tube bundles. By comparing with the original design condition, the following conclusions can be drawn:
(1)
In the absence of wind, the heat transfer efficiency of ACCs could be improved by Str-2, thereby reducing the demand of cooling air and power consumption of the fan array.
(2)
Under windy conditions, the inlet air temperatures of the strategies of Str-1 and Str-2 were reduced, especially at high wind speeds. Str-1 performed better and the average inlet air temperature of fans could be reduced by 3.93 K at the wind speed of 20 m/s.
(3)
The distribution of volumetric flow rates of Str-1 and Str-2 cases was more even, especially for Str-2 cases. The total volumetric flow rates of Str-2 cases were the smallest under various wind conditions, while the flow rates of Design and Str-1 cases were almost the same.
(4)
The cost-effectiveness of the fans in Row 1 for Str-1 and Str-2 increased firstly and then decreased with the wind speed, and it was just the opposite in Row 2. The cost-effectiveness of the fans in Rows 4 and 5 for Str-2 cases was much higher than other cases. The cost-effectiveness of the fans in Row 3 did not change much.
(5)
The fan adjustment strategy Str-2 could greatly reduce the power consumption of the fan array, especially at high wind speeds. At the wind speed of 12 m/s, the energy-saving ratio of Str-2 reached 13.94%.
It can be concluded that Str-2 could restrain the adverse effects of ambient wind and effectively improve the operating efficiency of the direct dry cooling power plant, which can be considered for application in actual operations.

Author Contributions

Conceptualization, W.H.; methodology, W.H.; software, W.H. and L.C.; Validation, W.H. and L.C.; formal analysis, W.H.; investigation, W.H.; resources, W.H.; data curation, W.H.; writing—original draft preparation, W.H.; writing—review and editing, L.Y.; visualization, L.Y.; supervision, L.Y.; project administration, L.Y. and X.D.; funding acquisition, L.Y. and X.D. All authors have read and agreed to the published version of the manuscript.

Funding

The financial support from the National Natural Science Foundation of China (Grant Nos. 51776067 and 51821004) for this research is gratefully acknowledged.

Institutional Review Board Statement

Not applicable.

Informed Consent Statement

Not applicable.

Data Availability Statement

Not applicable.

Conflicts of Interest

The authors declare no conflict of interest.

Nomenclature

Asurface area of the finned tube bundles (m2)
Cspecific heat capacity (kJ·kg−1·K−1)
fnpolynomial coefficient of the pressure drop for the fan
gnpolynomial coefficient for the tangential velocity
Koverall coefficient of heat transfer
Lthickness of the finned tube bundles (m)
nrotational speed of axial flow fan (r·min−1)
ppressure (Pa)
Pshaft power (kW)
qheat flux (W·m−2)
qvvolumetric flow rate (m3·s−1)
Qavolumetric flow rate of cooling air (m3·s−1)
rthe distance to the fan center (m)
Ssource term
S’additional source term
ttemperature (°C)
uvelocity (m·s−1)
ufface velocity (m·s−1)
Zheight above the ground (m)
Greek symbols
Γdiffusion coefficient (m2·s−1)
ρdensity (kg·m−3)
φdependent variable
εheat-exchanger effectiveness or diffusion rate of turbulence kinetic energy
δratio
Φheat rejection (kJ)
Subscripts
0designed condition
1inlet
aair
Bback
faxial flow fan
θperipheral direction
ssteam
vvolume

References

  1. Duvenhage, K.; Kröger, D.G. The influence of wind on the performance of forced draught air-cooled heat exchangers. J. Wind Eng. Ind. Aerod. 1996, 62, 259–277. [Google Scholar] [CrossRef]
  2. Rooyen, J.A.V.; Kröger, D.G. Performance trends of an air-cooled steam condenser under windy conditions. J. Eng. Gas Turbines Power 2008, 130, 277–285. [Google Scholar] [CrossRef] [Green Version]
  3. Yang, L.J.; Du, X.Z.; Yang, Y.P. Space characteristics of the thermal performance for air-cooled condensers at ambient winds. Int. J. Heat Mass Transf. 2011, 54, 3109–3119. [Google Scholar] [CrossRef]
  4. Yang, L.J.; Du, X.Z.; Yang, Y.P. Wind effect on the thermo-flow performances and its decay characteristics for air-cooled condensers in a power plant. Int. J. Therm. Sci. 2012, 53, 175–187. [Google Scholar] [CrossRef]
  5. Owen, M.; Kröger, D.G. Contributors to increased fan inlet temperature at an air-cooled steam condenser. Appl. Therm. Eng. 2013, 50, 1149–1156. [Google Scholar] [CrossRef]
  6. Liu, P.; Duan, H.; Zhao, W. Numerical investigation of hot air recirculation of air-cooled condensers at a large power plant. Appl. Therm. Eng. 2009, 29, 1927–1934. [Google Scholar] [CrossRef]
  7. He, W.; Han, D.; Yue, C.; Pu, W.; Dai, Y. Mechanism of the air temperature rise at the forced draught fan inlets in an air-cooled steam condenser. Appl. Therm. Eng. 2014, 71, 355–363. [Google Scholar] [CrossRef]
  8. Yang, L.J.; Wang, M.H.; Du, X.Z.; Yang, Y.P. Trapezoidal array of air-cooled condensers to restrain the adverse impacts of ambient winds in a power plant. Appl. Energy 2012, 99, 402–413. [Google Scholar] [CrossRef]
  9. Jin, R.; Yang, X.; Yang, L.; Du, X.; Yang, Y. Square array of air-cooled condensers to improve thermo-flow performances under windy conditions. Int. J. Heat Mass Transf. 2018, 127, 717–729. [Google Scholar] [CrossRef]
  10. Chen, L.; Yang, L.; Du, X.; Yang, Y. A novel layout of air-cooled condensers to improve thermo-flow performances. Appl. Energy 2016, 165, 244–259. [Google Scholar] [CrossRef]
  11. Kong, Y.; Wang, W.; Huang, X.; Yang, L.; Du, X.; Yang, Y. Circularly arranged air-cooled condensers to restrain adverse wind effects. Appl. Therm. Eng. 2017, 124, 202–223. [Google Scholar] [CrossRef]
  12. Kong, Y.; Wang, W.; Huang, X.; Yang, L.; Du, X.; Yang, Y. Direct dry cooling system through hybrid ventilation for improving cooling efficiency in power plants. Appl. Therm. Eng. 2017, 119, 254–268. [Google Scholar] [CrossRef]
  13. Haffejee, R.A.; Laubscher, R. Development of a thermofluid network modeling methodology for double-row air-cooled condensers. Therm. Sci. Eng. Progress 2020, 19, 100646. [Google Scholar] [CrossRef]
  14. Zhou, Y.; Cheng, Y.; Zhang, N.; Shi, H. Numerical simulation study of novel air-cooled condenser with lateral air supply. Case Stud. Therm. Eng. 2019, 13, 100354. [Google Scholar] [CrossRef]
  15. Huang, X.; Chen, L.; Kong, Y.; Yang, L.; Du, X. Effects of geometric structures of air deflectors on thermo-flow performances of air-cooled condenser. Int. J. Heat Mass Transf. 2018, 118, 1022–1039. [Google Scholar] [CrossRef]
  16. Gu, H.; Zhe, Z.; Wang, H.; Qi, C. A numerical study on the effect of roof windbreak structures in an air-cooled system. Appl. Therm. Eng. 2015, 90, 684–693. [Google Scholar] [CrossRef]
  17. Owen, M.T.F.; Kröger, D.G. The effect of screens on air-cooled steam condenser performance under windy conditions. Appl. Therm. Eng. 2010, 30, 2610–2615. [Google Scholar] [CrossRef]
  18. Zhang, X.; Wu, T. Effects of diffuser orifice plate on the performance of air-cooled steam condenser. Appl. Therm. Eng. 2016, 98, 179–188. [Google Scholar] [CrossRef]
  19. Yuan, W.; Sun, F.; Zhao, Y. Numerical study on the impact mechanism of windshield devices on frozen phenomena in a direct air-cooled system. Int. J. Heat Mass Transf. 2019, 142, 118206. [Google Scholar] [CrossRef]
  20. Chen, L.; Sun, Y.; Yang, L.; Du, X.; Yang, Y. Rotational speed adjustment of axial flow fans to maximize net power output for direct dry cooling power generating units. Heat Transf. Asian Res. 2019, 49, 356–382. [Google Scholar] [CrossRef]
  21. He, W.F.; Zhang, X.K.; Han, D.; Gao, L. Sensitivity analysis from the blade angle regulation of the forced draught fans in an air-cooled steam condenser. Appl. Therm. Eng. 2017, 123, 810–819. [Google Scholar] [CrossRef]
  22. He, W.; Dai, Y.; Han, D.; Yue, C.; Pu, W. Influence from the rotating speed of the windward axial fans on the performance of an air-cooled power plant. Appl. Therm. Eng. 2014, 65, 14–23. [Google Scholar] [CrossRef]
  23. He, W.F.; Chen, J.J.; Han, D.; Wen, T.; Luo, L.T.; Li, R.Y.; Zhong, W.C. Numerical analysis from the rotational speed regulation within the fan array on the performance of an air-cooled steam condenser. Appl. Therm. Eng. 2019, 153, 352–360. [Google Scholar] [CrossRef]
  24. Li, X.; Wang, N.; Wang, L.; Yang, Y.; Maréchal, F. Identification of optimal operating strategy of direct air-cooling condenser for Rankine cycle based power plants. Appl. Energy 2018, 209, 153–166. [Google Scholar] [CrossRef]
  25. Wang, N.; Zhang, Y.; Fu, P.; Feng, P.; Yang, Y. Heat transfer and thermal characteristics analysis of direct air-cooled combined heat and power plants under off-design conditions. Appl. Therm. Eng. 2018, 129, 260–268. [Google Scholar] [CrossRef]
  26. Li, J.; Bai, Y.; Li, B. Operation of air cooled condensers for optimised back pressure at ambient wind. Appl. Therm. Eng. 2018, 128, 1340–1350. [Google Scholar] [CrossRef]
  27. Huang, W.; Chen, L.; Wang, W.; Yang, L.; Du, X. Cooling Performance Optimization of Direct Dry Cooling System Based on Partition Adjustment of Axial Flow Fans. Energies 2020, 13, 3179. [Google Scholar] [CrossRef]
  28. Huang, W.; Chen, L.; Yang, L.; Du, X. Operation strategies of axial flow fans in a direct dry cooling system under various meteorological conditions. Heat Transf. Asian Res. 2021. [Google Scholar] [CrossRef]
  29. ANSYS Inc. Fluent User’s Guide; ANSYS Inc.: Lebanon, NH, USA, 2012. [Google Scholar]
  30. Chen, L.; Yang, L.; Du, X.; Yang, Y. Novel air-cooled condenser with V-frame cells and induced axial flow fans. Int. J. Heat Mass Transf. 2018, 117, 167–182. [Google Scholar] [CrossRef]
  31. Yang, L.J.; Wu, X.P.; Du, X.Z.; Yang, Y.P. Dimensional characteristics of wind effects on the performance of indirect dry cooling system with vertically arranged heat exchanger bundles. Int. J. Heat Mass Transf. 2013, 67, 853–866. [Google Scholar] [CrossRef]
  32. Yang, L.; Du, X.; Yang, Y. Measures against the adverse impact of natural wind on air-cooled condensers in power plant. Sci. China Technol. Sci. 2010, 53, 1320–1327. [Google Scholar] [CrossRef]
  33. Yang, L.J.; Du, X.Z.; Yang, Y.P. Influences of wind-break wall configurations upon flow and heat transfer characteristics of air-cooled condensers in a power plant. Int. J. Heat Mass Transf. 2011, 50, 2050–2061. [Google Scholar] [CrossRef]
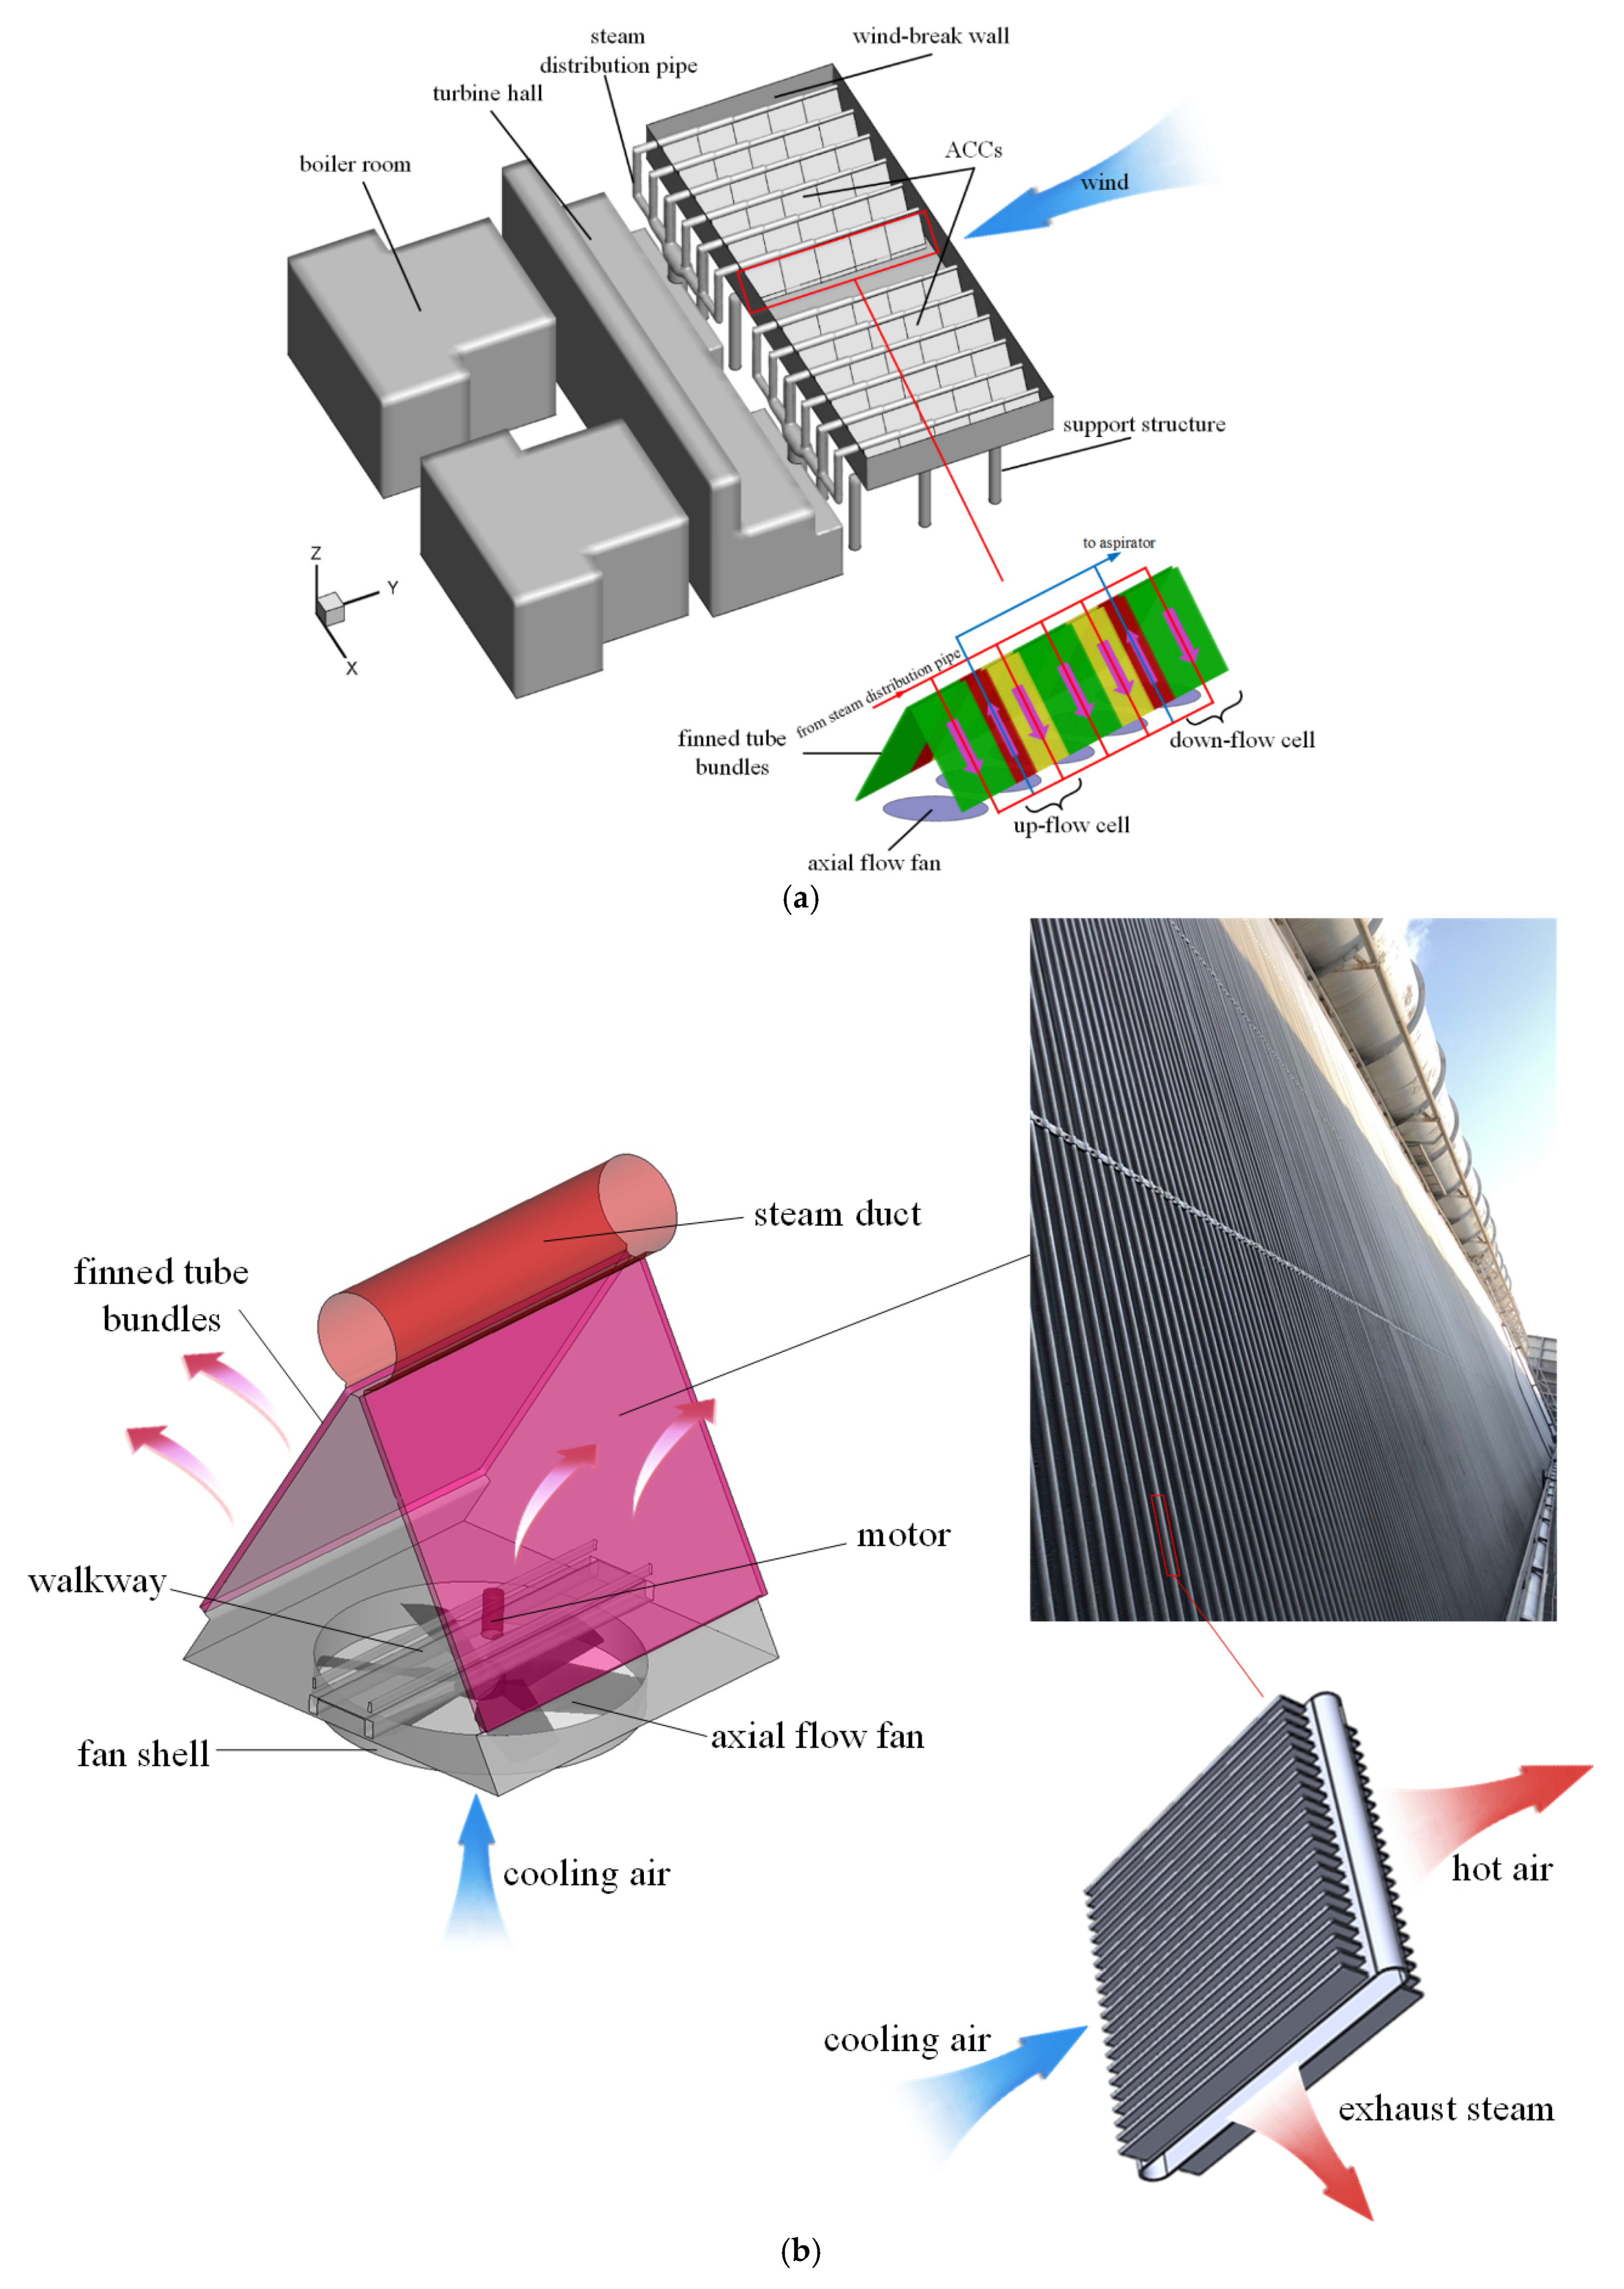
Figure 1. Layout of 2 × 300 MW direct dry cooling power generation unit: (a) main buildings, ACCs, and finned tube bundles; (b) ACC cell; (c) serial numbers of condenser cells.
Energies 14 03176 g001aEnergies 14 03176 g001b
Figure 2. Schematics of cells and macros.
Energies 14 03176 g002
Figure 3. Computational domain and boundary conditions.
Energies 14 03176 g003
Figure 4. Design and simulated heat rejection of a 2 × 300 MW direct dry cooling power generating unit under several operating conditions.
Energies 14 03176 g004
Figure 5. Temperature distribution of inlet air of the fans under windless condition: (a) Design case; (b) Str-1 case; (c) Str-2 case.
Energies 14 03176 g005
Figure 6. Distribution of volumetric flow rate of the fans under windless condition: (a) Design case; (b) Str-1 case; (c) Str-2 case.
Energies 14 03176 g006
Figure 7. Variations of turbine back pressure and exhaust steam temperature with wind speed.
Energies 14 03176 g007
Figure 8. Distribution of inlet air temperatures of the fans at various wind speeds: (a)4 m/s; (b) 12 m/s; (c) 20 m/s.
Energies 14 03176 g008
Figure 9. Average inlet air temperatures of fans in each row for Design, Str-1, and Str-2 cases at different wind speeds: (a) 4 m/s; (b) 8 m/s; (c) 12 m/s; (d) 16 m/s; (e) 20 m/s.
Energies 14 03176 g009aEnergies 14 03176 g009b
Figure 10. Average inlet air temperatures of ACCs for Design, Str-1, and Str-2 cases under windy conditions.
Energies 14 03176 g010
Figure 11. Volumetric flow rates of each fan for Design, Str-1, and Str-2 cases at different wind speeds: (a) 4 m/s; (b) 12 m/s; (c) 20 m/s.
Energies 14 03176 g011aEnergies 14 03176 g011b
Figure 12. Total volumetric flow rates of fans in each row for Design, Str-1, and Str-2 cases at various wind speeds: (a) 4 m/s; (b) 8 m/s; (c) 12 m/s; (d) 16 m/s; (e) 20 m/s.
Energies 14 03176 g012aEnergies 14 03176 g012b
Figure 13. Total volumetric flow rates of fans for Design, Str-1, and Str-2 cases under windy conditions.
Energies 14 03176 g013
Figure 14. Rotational speed of each fan for Str-2 cases under various ambient conditions: (a) no wind; (b) 4 m/s; (c) 8 m/s; (d) 12 m/s; (e) 16 m/s; (f) 20 m/s.
Energies 14 03176 g014aEnergies 14 03176 g014b
Figure 15. Cost-effectiveness of the fans in each row for Str-1 and Str-2 cases under various ambient conditions: (a) no wind; (b) 4 m/s; (c) 8 m/s; (d) 12 m/s; (e) 16 m/s; (f) 20 m/s.
Energies 14 03176 g015
Figure 16. Total power consumption of fans for Design, Str-1, and Str-2 cases at different wind speeds.
Energies 14 03176 g016
Figure 17. Cost-effectiveness of ACCs for Design, Str-1, and Str-2 cases at different wind speeds.
Energies 14 03176 g017
Table 1. Geometric parameters of ACCs.
ParameterValue
Number of condenser cells60
Length of ACC cell (m)11.31
Width of ACC cell (m)11.24
Height of ACC platform (m)35
Number of axial flow fans60
Fan diameter (m)9.144
Total power consumption of axial flow fans (kW)5028
Rotational speed of fan (r/min)72
Volumetric flow rate (m3/s)474.9
Total pressure of fan (Pa)122.1
Material of base tube/finCs/Al
Density of fin (kg/m3)2719
Specific heat of fin (J/kg/K)871
Thermal conductivity of fin (W/m/K)202.4
Major axis of base tube for finned tube bundles (mm)219
Minor axis of base tube for finned tube bundles (mm)19
Width of fin (mm)19
Height of fin (mm)200
Pitch of fins (mm)2.3
Thickness of fin (mm)0.25
Table 2. Main parameters of TRL operating condition.
ParameterValue
Ambient temperature (K)304.45
Atmospheric relative humidity (%)63
Ambient pressure (Pa)101,325
Pressure of main steam (MPa)16.67
Temperature of main steam (°C)538
Mass flow rate of main steam (t/h)1004.2
Main steam enthalpy (kJ/kg)3397.2
Pressure of reheat steam (MPa)3.427
Temperature of reheat steam (°C)538
Mass flow rate of reheat steam (t/h)821.988
Reheat steam enthalpy (kJ/kg)3536.9
Back pressure of turbine (MPa)0.031
Temperature of exhaust steam (°C)69.9
Mass flow rate of exhaust steam (t/h)689.378
Exhaust steam enthalpy (kJ/kg)2557.71
Table 3. Comparison of main parameters for Design, Str-1, and Str-2 cases under windless condition.
CasepB (kPa)ts (°C)Qa (m3/s)δv (%)Pf (kW)
Design24.15964.234,4229.965028
Str-124.15964.234,4229.965028
Str-224.15964.234,0082.324867
Table 4. The ratios of the rotational speed of leeward fans for Str-1 cases at various wind speeds.
CaseRn (%)
uw = 0 m/suw = 4 m/suw = 8 m/suw = 12 m/suw = 16 m/suw = 20 m/s
Str-110094.798.594.759694.5
Table 5. The ratio of saving-power δf for Str-1 and Str-2 cases under various wind conditions.
Caseδf (%)
uw = 0 m/suw = 4 m/suw = 8 m/suw = 12 m/suw = 16 m/suw = 20 m/s
Str-105.44−3.075.332.605.87
Str-23.26.885.2513.949.2112.26
Publisher’s Note: MDPI stays neutral with regard to jurisdictional claims in published maps and institutional affiliations.