Article

Impact of Enclosure Boundary Patterns and Lift-Up Design on Optimization of Summer Pedestrian Wind Environment in High-Density Residential Districts

1
College of Urban Construction, Zhejiang Shuren University, Hangzhou 310015, China
2
Faculty of Environmental Engineering, The University of Kitakyushu, Fukuoka 8080135, Japan
*
Author to whom correspondence should be addressed.
Energies 2021, 14(11), 3199; https://doi.org/10.3390/en14113199
Submission received: 8 April 2021 / Revised: 25 May 2021 / Accepted: 26 May 2021 / Published: 30 May 2021

Abstract

:
A comfortable wind environment favors the sustainable development of urban residential districts and public health. However, the rapid growth of high-rise urban residential districts leads to low wind velocity environments in summer. This study examines the influence of enclosure boundary patterns and lift-up design on the wind environment and proposes an optimization strategy to improve the low wind velocity environment in residential districts in summer. A typical residential district in Hangzhou was selected; the average wind velocity, calm wind zone ratio and comfortable wind zone ratio were selected as the evaluation indexes. The wind environment for different enclosure boundary patterns and lift-up designs were obtained via computational fluid dynamics (CFD) simulations. The results indicate that the pedestrian wind environment is greatly improved in residential districts by reducing the height/width of the enclosure boundary, increasing the permeability rate and adopting a lift-up design in all buildings within residential districts. A combination of permeable railings and lift-up design is recommended; this can increase the average wind velocity and the ratio of comfortable wind zones by 70% and 200%, respectively. This study provides practical guidelines for the optimization of a low wind velocity environment in Chinese high-density residential districts in summer.

1. Introduction

With the rapid development of urbanization in China, land resources are becoming increasingly scarce, and building density and height in urban residential districts are rapidly increasing [1,2]. High-density residential districts exhibit reduced ventilation and heat dissipation conditions, thus leading to low wind velocity environments and poor thermal comfort in residential districts [3]. This problem is particularly serious in summer, especially in the densely populated eastern coastal areas of China [4]. These related phenomena may negatively affect the sustainable development of urban residential districts. For instance, air stagnation due to a low wind velocity environment may prevent the evacuation of airborne pathogens [5,6]. During epidemic periods of infectious diseases, this issue is particularly prominent, and the concentration of pollutants poses a clear threat to public health safety [7]. Especially during the development of the COVID-19 epidemic, it is essential to improve the pedestrian-height wind environment in urban high-density residential districts for public health safety purposes [8].
A series of studies has been conducted to investigate effective methods for improving the pedestrian wind environment. Field measurements, wind tunnel experiments, and computational fluid dynamics (CFD) simulations are often employed to analyze outdoor wind environments [9,10]. Du et al. adopted the overall mean velocity rate (OMVR) as an evaluation criterion, and through a wind tunnel experiment on the campus of the Hong Kong Polytechnic University, they demonstrated that the area of acceptable wind comfort increases from 20% to 50% via the adoption of building opening and lift-up design [4]. Tsanga et al. performed wind tunnel experiments to study the influence of building separation on pedestrian wind environments under low and high wind conditions, and found that when the building separation is smaller than half of the building width, it imposes adverse effects on the natural ventilation conditions for pedestrians [11].
Although wind tunnel experiments are reliable, they are relatively expensive and insufficiently flexible to be applied to architecture design on a large scale. Instead, the CFD simulation method has the advantages of high speed, easy implementation, high accuracy and effectiveness, and low cost [12,13]. Therefore, with the development of computer technology and grid generation techniques, increasing numbers of researchers have performed CFD simulations to study urban wind environments [14,15,16]. For instance, Hang et al. used CFD simulations to numerically investigate the air age and air exchange efficiency of an ideal high-density building complex under the effect of parallel winds, and proposed that wide streets and small building array lengths could help improve ventilation [17]. Based on a highly simplified model, Li and Chen adopted the CFD technique to simulate the wind environment around buildings and found that when the area of the opening remains the same, the larger the number of openings, the better the distribution of the vertical wind velocity behind the building [18].
In recent years, an increasing number of studies have focused on the pedestrian wind environment in residential districts. For example, Wang et al. introduced dimensionless layout parameters of rank-and-file building groups through wind tunnel experiments, and they proposed that changing the building layout and orientation can help produce a good wind environment [19]. Hadavi and Pasdarshahri quantified the effects of the wind velocity, urban planning district density, and urban form on the infiltration rate via CFD simulations, and concluded that building tightness enhancement could reduce the infiltration rate and augment the exfiltration rate [20]. Hu et al. analyzed the relationship between the residential building density and wind environment and reported that when the residential building density increases from 0.18 to 0.32, the outdoor average wind velocity ratio decreases by 0.18 and the average air age increases by 58.63 s [21]. Hong and Lin compared the wind environments of several residential areas with different layout patterns and tree arrangements and concluded that orienting the long facades of buildings parallel to the prevailing wind direction can yield satisfactory thermal comfort [22]. Ghadikolaei et al. analyzed the effects of wing wall at the balcony on the natural ventilation performance in medium-rise residential buildings [23]. Besides, Tes et al. explored the impact of lift-up building models with different core heights and widths, and found that the lift-up core height is the most influential parameter and governs the area and magnitude of high and low wind velocity zones around such buildings [24]. Guo et al. compared the natural ventilation performance of different building morphologies via CFD simulation, and indicated that enclosed city blocks are unfavorable to natural ventilation [25]. Kubota et al. carried out wind tunnel tests on 22 residential neighborhood districts selected from actual Japanese cities, and concluded that an increase in the gross building coverage ratio decreases the mean wind velocity ratio [26].
However, most of these studies were concerned with the effects of different building layout patterns, densities and heights on the wind environment in residential districts. The influence of different enclosure boundary patterns on residential wind environments has rarely been considered in studies to date. Several studies have analyzed the influence of the lift-up building model on the wind environment, but few have analyzed the influence of the combination of the enclosure boundary and lift-up design on the wind comfort of a residential district. The research objects in most of the literature are highly simplified, ideal models such that planning and architectural practice constraints are neglected. The results of related studies do not reflect the complexity and diversity of urban construction projects.
Chinese residential districts exhibit their own characteristics due to local urban guidelines, customs and culture [22]. They are distinguished by enclosed boundaries, lift-up designs and regular layout patterns. Closed boundaries are mainly divided into four patterns: low-rise podiums, main buildings, solid walls and permeable railings. Appropriate types of enclosure boundaries and the combined design of boundaries and lift-up options have been noted as being highly important for achieving a comfortable outdoor environment in residential districts. However, existing studies generally neglect these aspects. Moreover, there remains a lack of quantitative analysis and research on the effect of different combined designs on the wind environment in residential areas. It is essential for architects to develop a design method to determine the optimum arrangement for creating a comfortable wind environment.
In this paper, the characteristics of 16 high-density residential districts in the Yangtze River Delta region of China were analyzed. Then, a typical residential district in Hangzhou was selected to investigate the low wind velocity environment problem in summer. With regard to the CFD simulation method, the average wind velocity, calm wind zone ratio and comfortable wind zone ratio were selected as the evaluation indexes to quantify the results of the wind environment under different enclosure boundaries and lift-up forms, and the impacts of different improvement measures on the low wind velocity environment were determined. The research framework is shown in Figure 1. The results of this study provide practical guidelines for the optimization of low wind velocity environments in high-density residential districts in summer.

2. Methodology

2.1. Case Selection

2.1.1. Survey of Residential Districts in the Yangtze River Delta

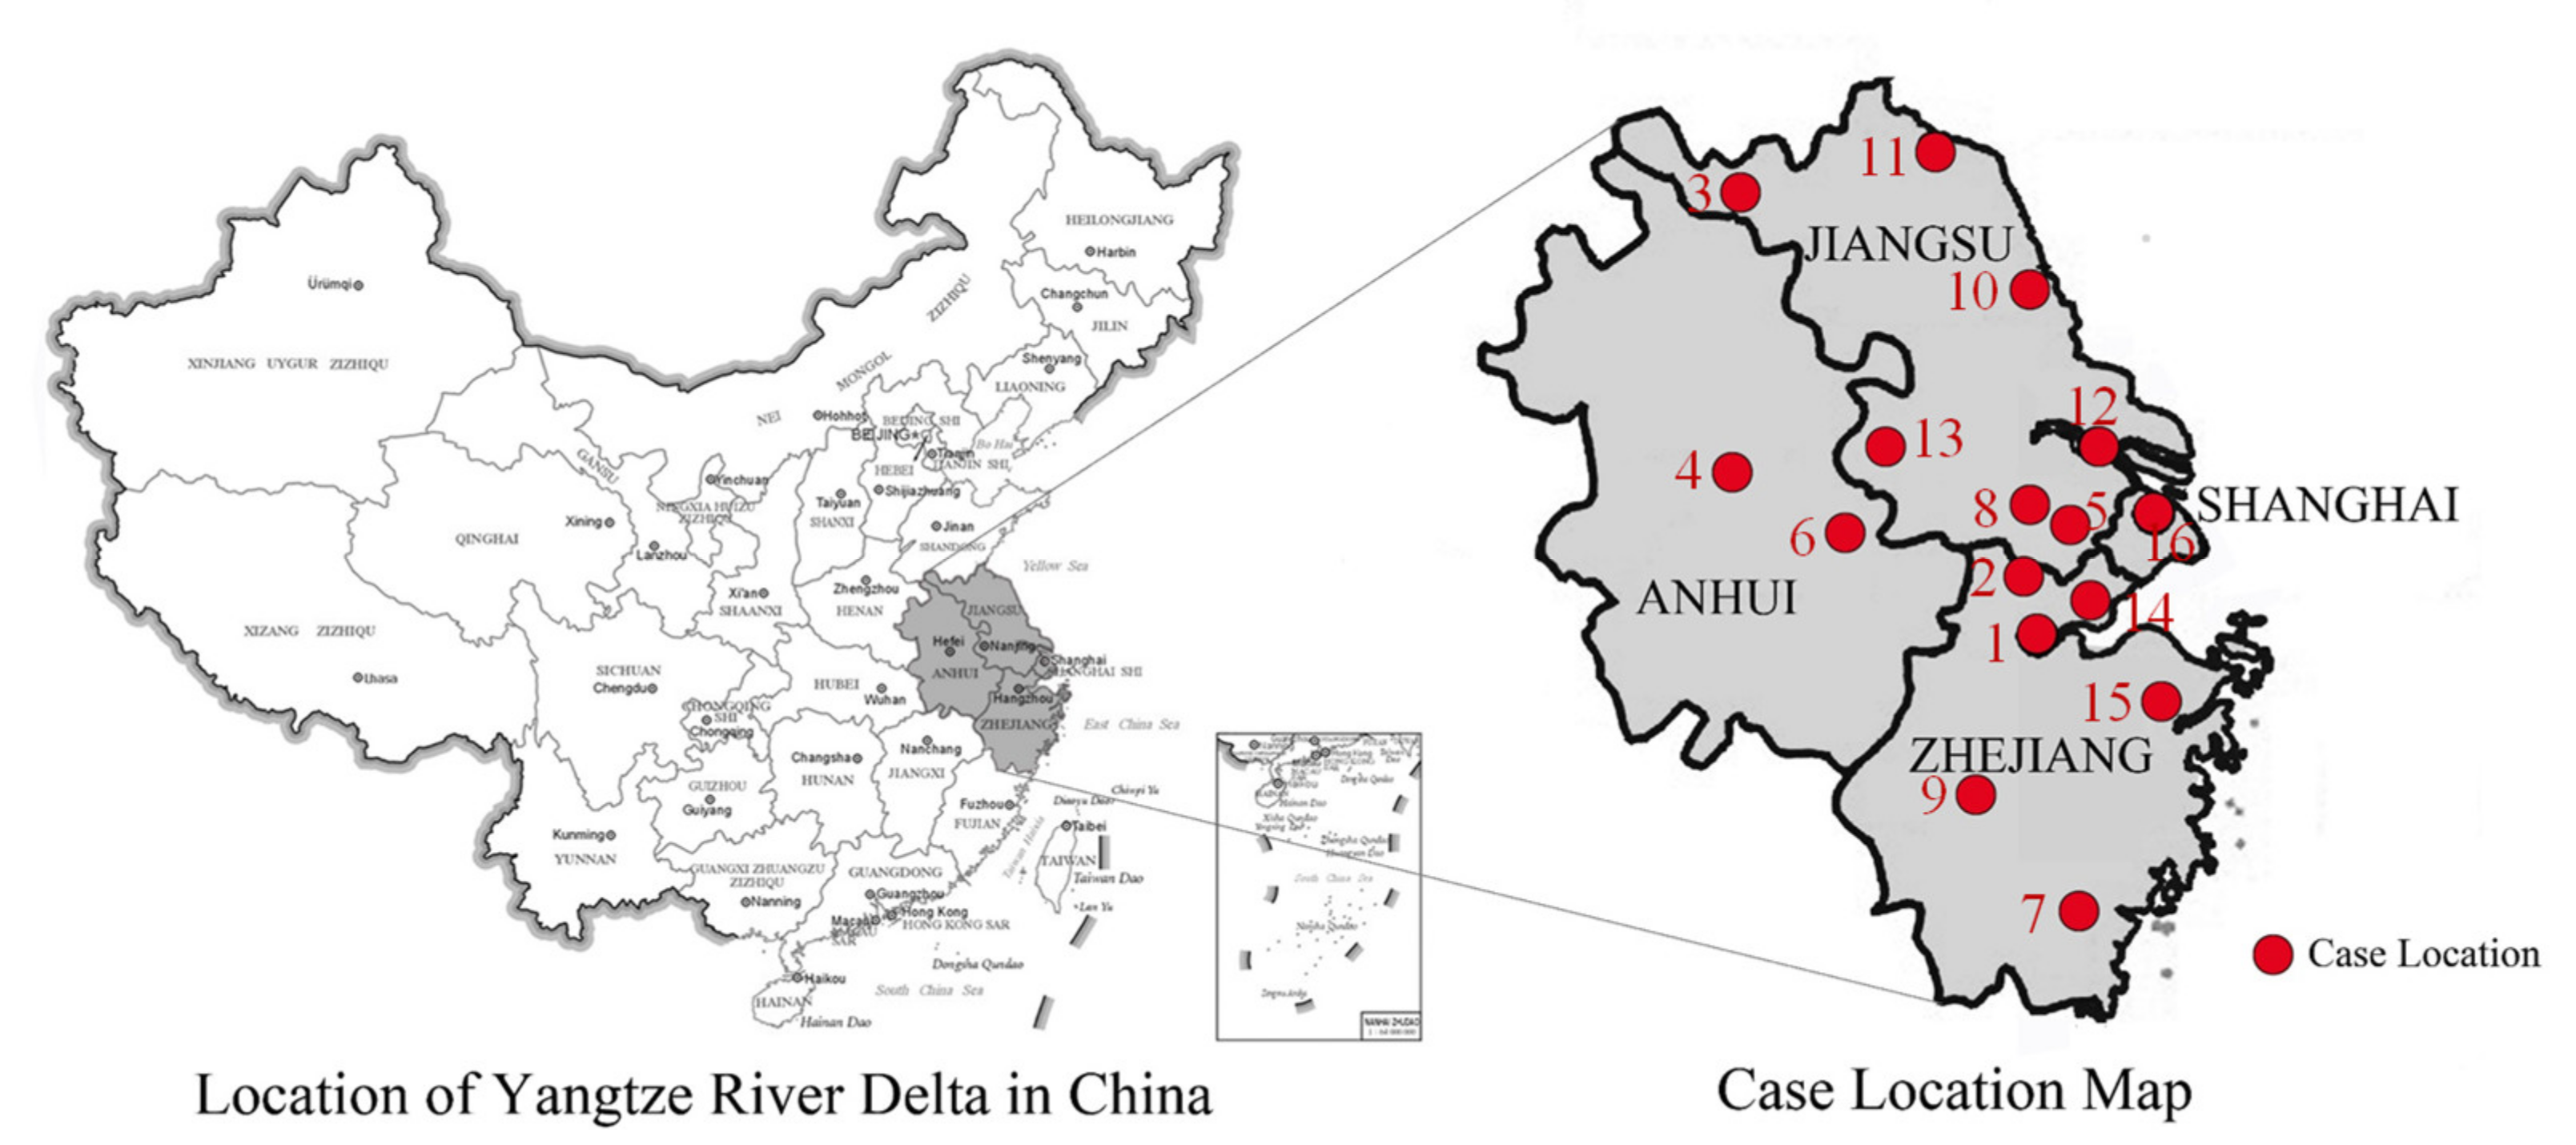
The Yangtze River Delta urban agglomeration is one of the most economically developed and urbanized areas in China. According to Chinese specifications [27], in this study, a high-density residential district is defined as a site area ranging from 2–10 ha containing 11 layers or more with a floor area ratio higher than 2. Sixteen high-density residential districts are randomly selected in typical cities. Figure 2 shows the locations of these residential districts, and Figure 3 illustrates the details of these residential districts with the depicted information sourced from Google Earth images. Due to the geographic environmental constraints, sunlight norms, and urban planning requirements in the Yangtze River Delta region, certain common characteristics are observed in these residential districts.

2.1.2. Common Characteristics of High-Density Districts

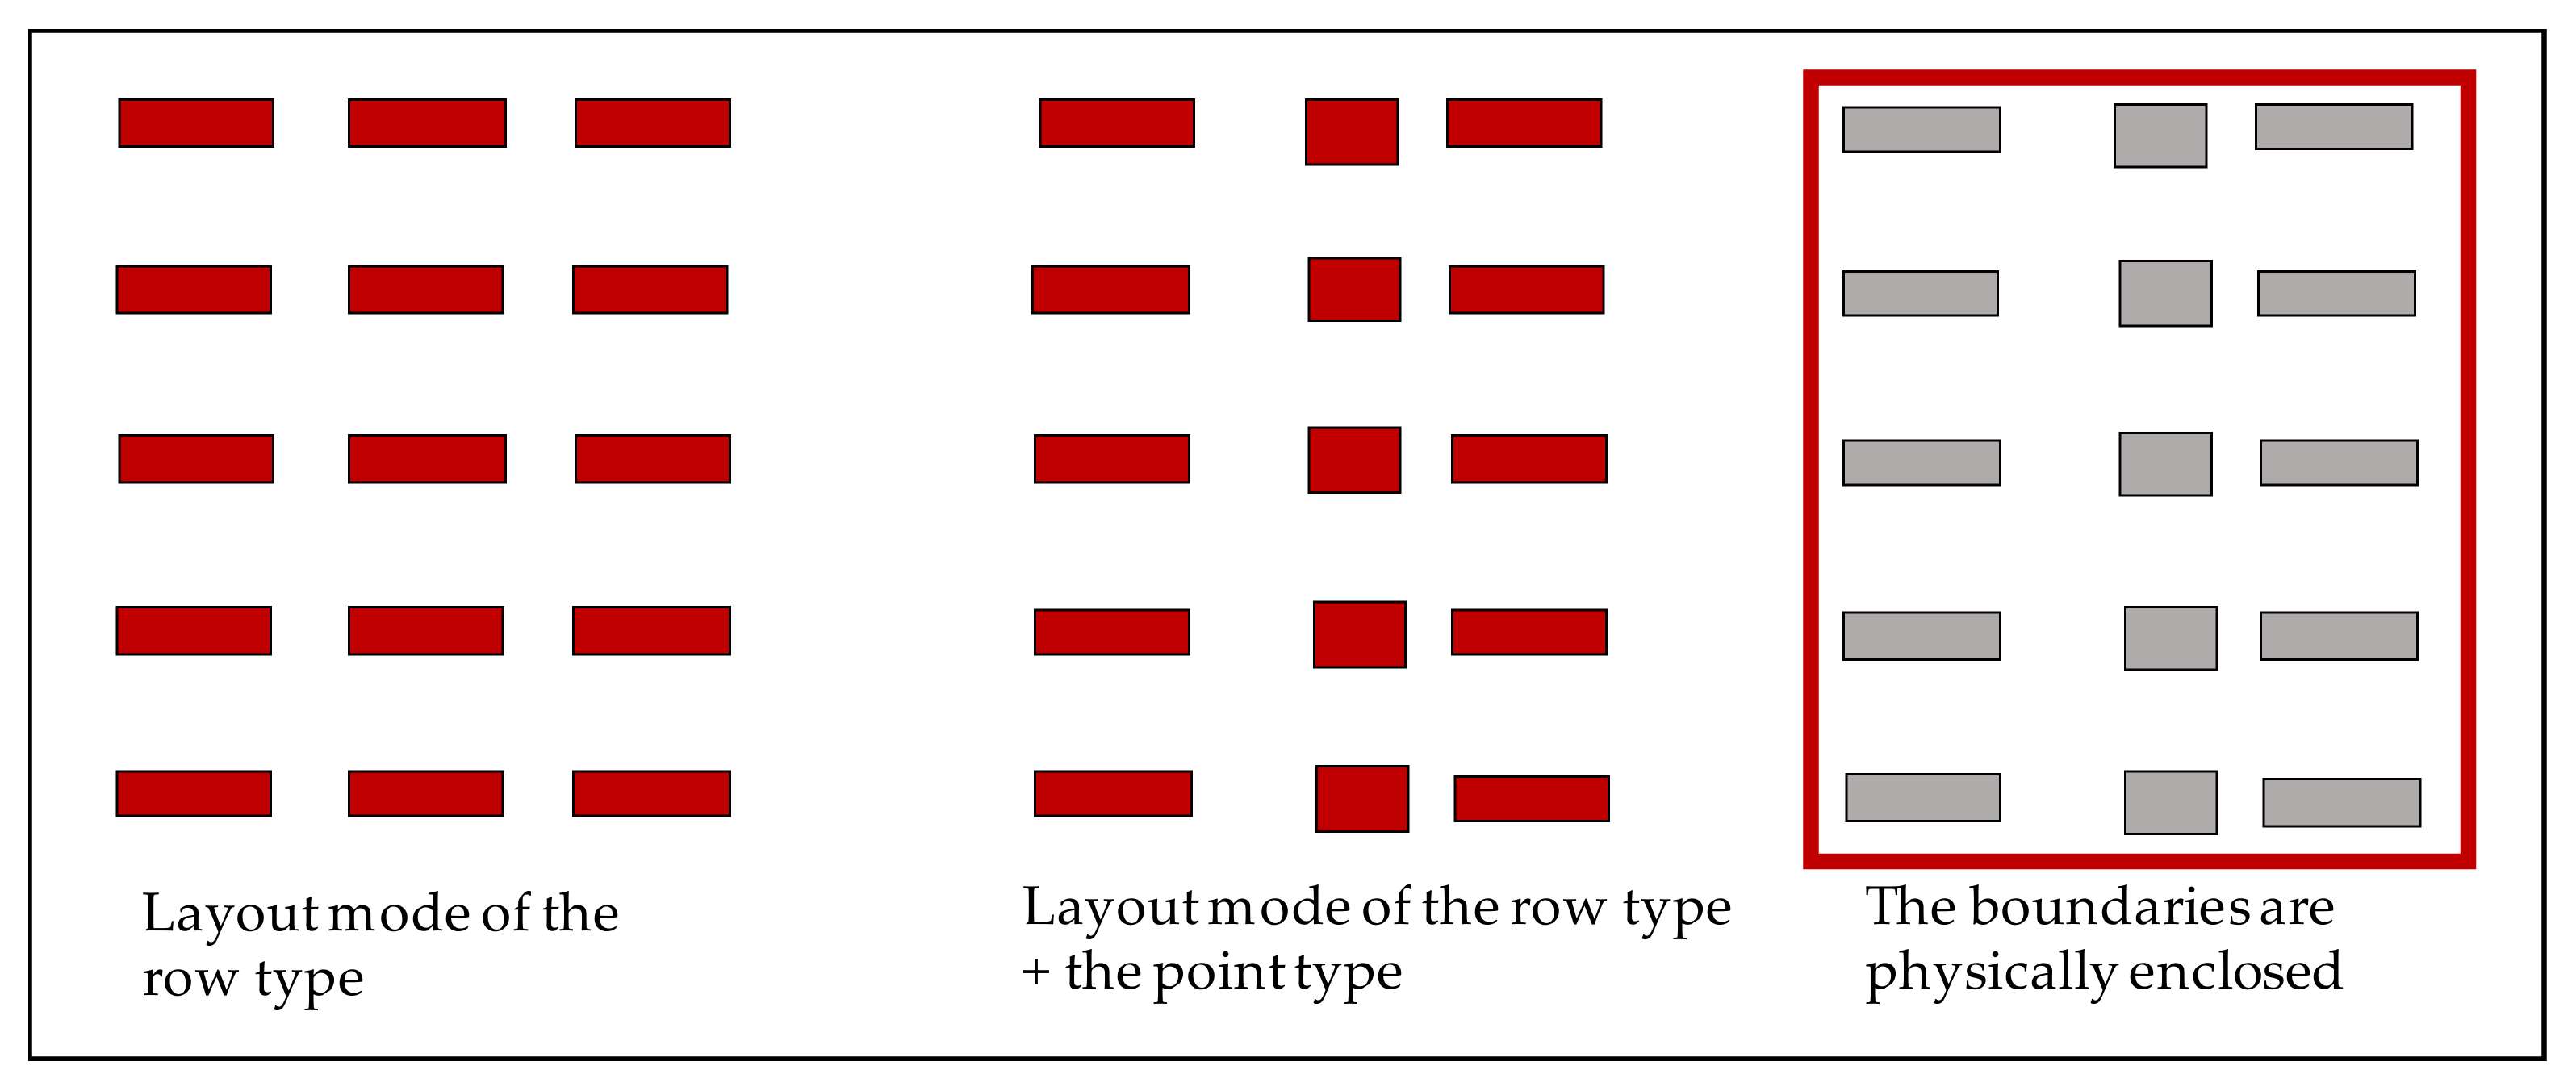
  • The Yangtze River Delta is situated in the hot summer and cold winter region. The best orientation is toward the south or slightly toward the southeast or southwest to attain sufficient sunlight and ventilation. The layout of buildings largely indicates a combination layout mode of the row type or the row type + the point type (see Figure 4).
  • The residential districts are gated communities [28]. The boundaries of the residential districts are physically enclosed, leaving only a few pedestrian and vehicular access entrances. In addition to natural boundaries (e.g., lakes), the enclosed boundaries of these residential districts usually include four types of enclosures: low-rise podiums, main buildings, solid walls, and permeable railings (as shown in Figure 5).
  • In certain newly constructed high-density residential districts, some or all buildings adopt a lift-up design to provide public spaces for people to rest or parking for non-motorized vehicles.

2.1.3. Selection of a Typical Case

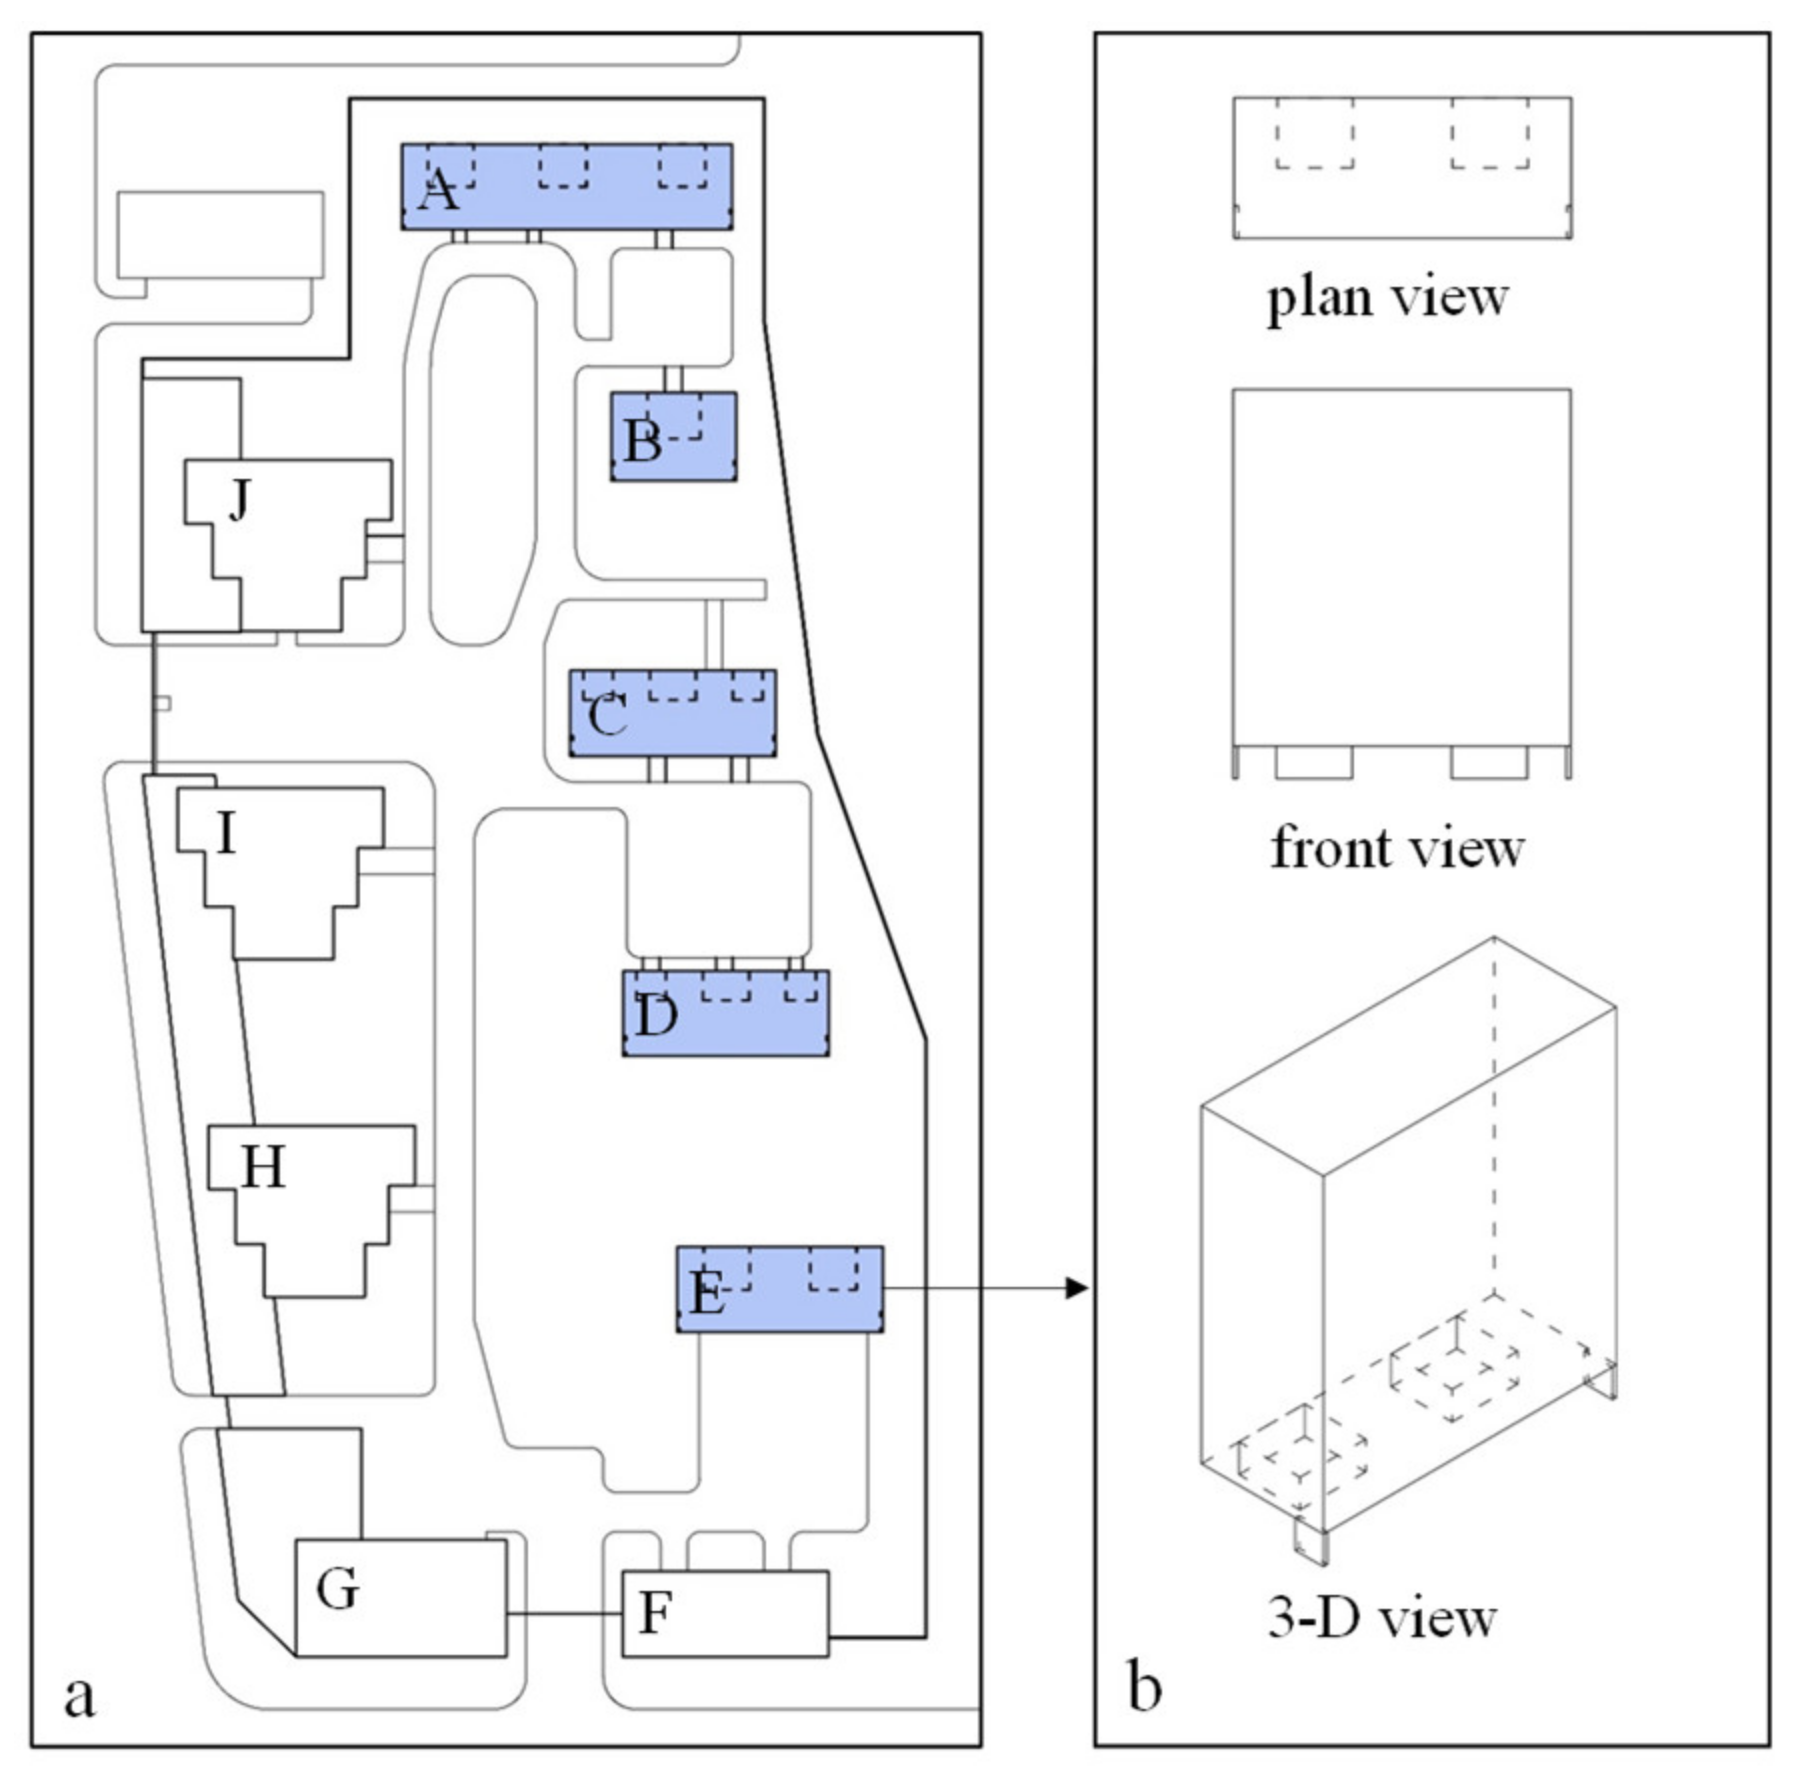
Based on the common characteristics of residential districts, Case 1 (i.e., a typical high-density residential district in the central urban area of Hangzhou city) was chosen as the research object. The residential district mainly consists of ten high-rise buildings A–J (refer to Figure 6a), among which buildings A–E contain lift-up areas with a height of 3 m. The main structure of the lift-up buildings is elevated from the ground by a combination of columns, shear walls and a central core. Figure 6a shows the locations of the lift up areas and the vertical structural elements. Figure 6b shows the schematic diagrams of the lift-up building E. The core area percentage is expressed as the percentage of area covered by the core of the plan area of the building at the ground level, which is termed the “area percentage” [24]. The area percentage value in this study was 18.1–27.4%.
City roads border the western and southern sides of the residential district. The western side is enclosed by a low-rise podium that is 8 m in height and 11 m in depth, while the northern and eastern sides are separated from the neighboring areas via permeable railings. The dimensions of the area are 240 m at its longest point and 120 m at its widest point, with a total area of 2.7 ha and a maximum building height of 54 m.

2.2. CFD Simulation Setup

2.2.1. Geometric Model and Domain Size

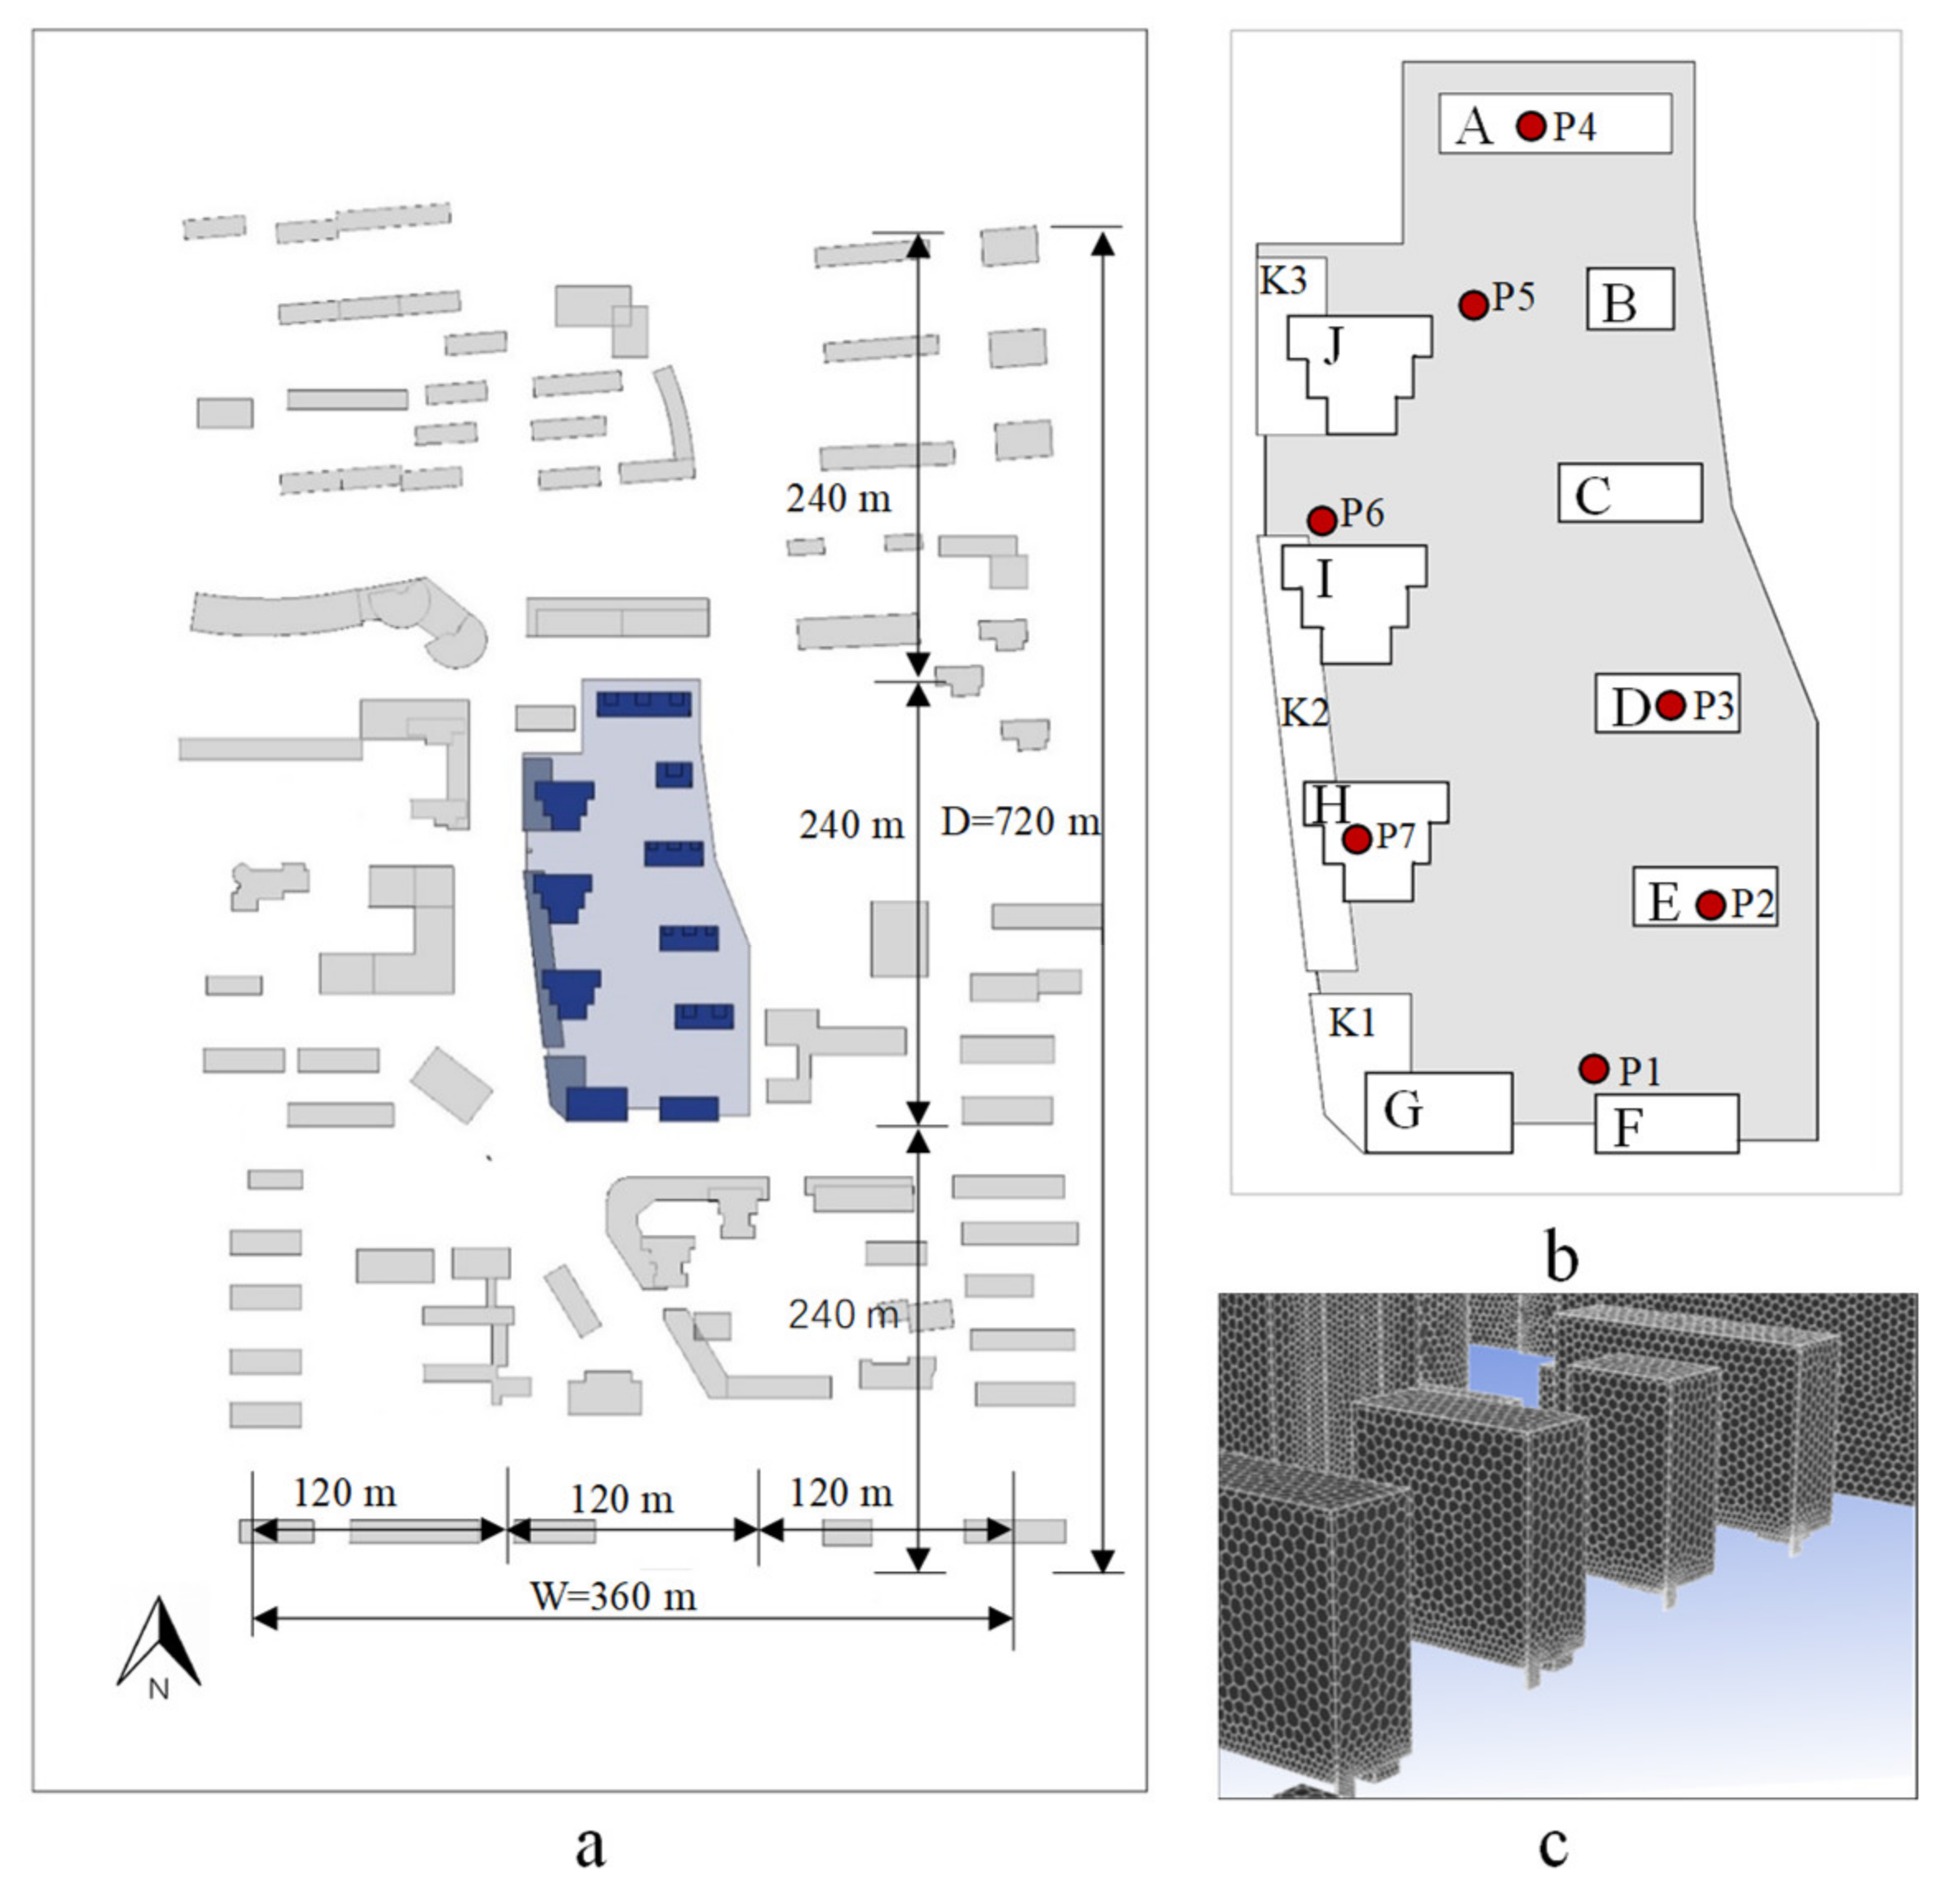
According to existing research [29,30], to accurately reproduce the flow field in this residential district, the geometric model considers the building information in the target area (i.e., the blue area shown in Figure 7a), and the surrounding area is three times larger than the target area (see Figure 7a). Detailed information was retrieved from field measurements and Google Earth images.
The CFD calculation area in the present study satisfies a distance of 4D from the entrance to the nearest building boundary, a distance of 6D to the outflow boundary, a distance of 4W to the side boundary and a distance of 5H to the top boundary, where D is the total length of the building complex (D = 720 m), H is the maximum building height of the target complex (H = 72 m), W is the total width of the building complex (W = 360 m) and the obstruction rate is 2.4%, which is lower than the recommended maximum obstruction ratio of 3% [31].

2.2.2. CFD Model and Grid Arrangement

A commercial CFD program, ANSYS Fluent 19.0, was adopted in the present study. The unsteady Reynolds-averaged Navier–Stokes (RANS) equations with the RNG k-e turbulence model were used to solve the turbulent wind flow in the computational domain [32]. This model was verified by simulating wind flows at the urban scale, with an average relative error of 12% with respect to the measured data [33].
A polygonal grid scheme was adopted in this study, which is adaptable to different geometric shapes. The grid spacing was set to 20 m in the surrounding open area, which was gradually reduced to 3 m in the object model. To accurately represent key simulation areas (e.g., lift-up floors and pedestrian heights), the grid size was thus refined to 1 m. This resulted in a total grid number of 3 million, and the corresponding local grid division is shown in Figure 7c.

2.2.3. Boundary Conditions

As the research target is located in the city, it was difficult to obtain the boundary data in the city by field measurement. Moreover, it was hard to gain enough meteorological data in the large area, and difficult to conduct field measurement to verify the large-scale simulation results of the wind environment. Hence, the wind data from the Hangzhou Meteorological Bureau were used as the inflow boundary conditions. The Hangzhou Meteorological Bureau used the interpolation method to get the wind field based on the real-time data of each meteorological monitoring point. The average wind velocity near the inflow boundary from 10:40 a.m. to 11:40 a.m. on 22 July 2020 was 1.7 m/s and the wind direction was south-southwest. The upstream vertical boundary in the calculation domain was set as the inflow boundary, and the outflow boundary was set as the pressure outlet. The vertical velocity profile along the inflow boundary was modeled as a power law based on the structural building code [34].
V h = V 0 h h 0 α
where Vh is the wind velocity at a height of h, m/s; V0 is the wind velocity at height h0 m/s; h0 = 10 m; and α is the roughness index. The target area is located in a dense urban area of a large city with a ground topography of category C, and the exponent of the power law α = 0.22 [34]. The computations were performed on an 8-core workstation (Intel Core i7-9700, 3.0 GHz) with 32 GB DDR of system memory. When the scaled residuals reached 10−4 for mass conservation, U, V, W, k, ε, the solution was considered to be converged.

2.3. CFD Validation

To verify the reliability of the CFD simulation results, this study carried out field measurements in the target residential district. The field measurements were conducted from 10:40 a.m. to 11:40 a.m. on 22 July 2020, with seven anemometers (405i, Testo, Testo AG). The field measurement net covered seven locations for pedestrian activities in the district, as shown in Figure 7b. Velocity measurement points 1–6 were located 1.5 m above the ground, measurement points 2–4 were situated in the lift-up area, and measurement point 7 was located 1.5 m above the roof.
The wind velocity results obtained with the CFD simulation method at a height of 1.5 m were compared to the measured results, as shown in Figure 8. The average error between the CFD model simulation data and the measured data is 20.4%. The trends at the different positions are the same, which verifies the reliability of the CFD simulation results [29]. Therefore, the CFD model established in this study and the obtained simulation results are credible.

2.4. Case Design

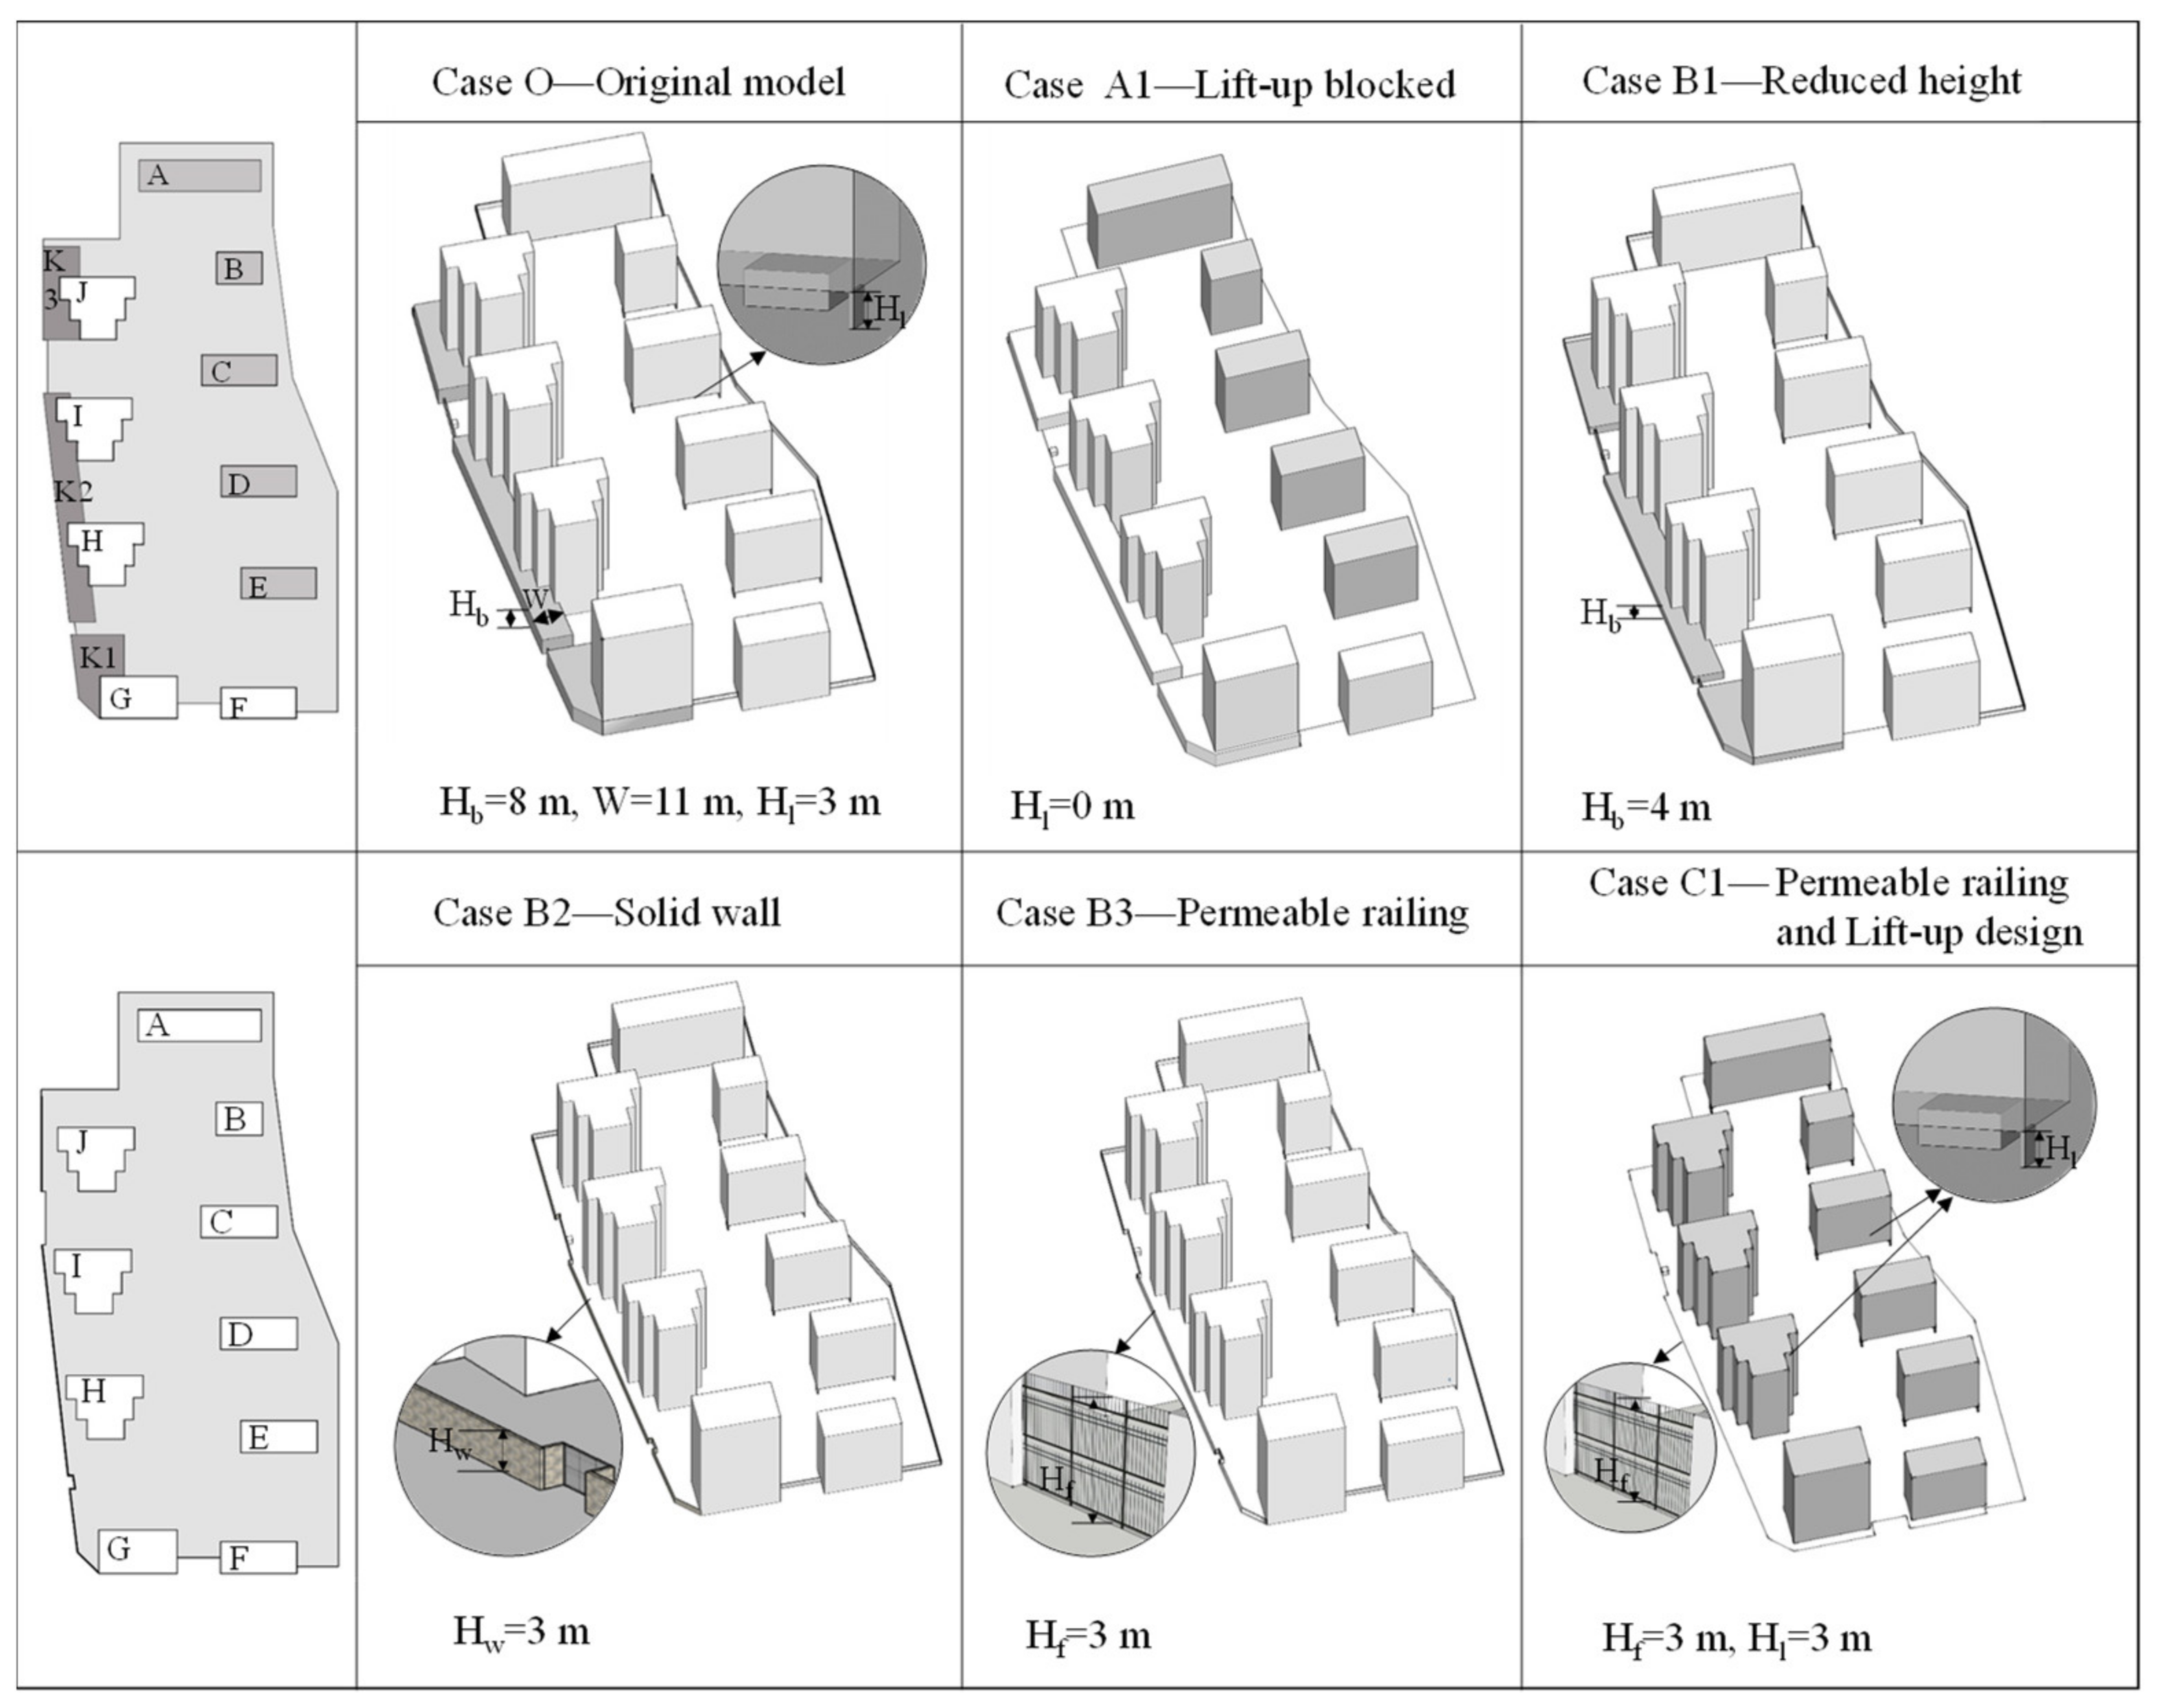
Considering engineering practices, on the basis of not altering the layout of residential districts, this study adopted the enclosure boundaries and the lift-up design as the parameter design, and 6 cases were obtained (refer to Figure 9).
Case O represents the original state of the research target. The northern and eastern enclosure boundaries are permeable iron railings, and the southern enclosure boundary is the main building. The dominant wind direction in Hangzhou in summer is south-southwest (SSW), and the changes in enclosure boundary patterns largely involve the optimization of the western boundary.
Case A1, as shown in Figure 9, indicates that the existing lift-up areas of buildings A–E are blocked. Cases B1, B2, and B3, as shown in Figure 9, reveal the changes in the western enclosure boundary pattern. Case B1 reduces the enclosure boundary height and changes the podium height from 8 to 4 m. In Case B2, the enclosure height and depth are reduced. The podium is changed to a solid wall with a height of 3 m and a thickness of 0.3 m. In Case B3, the degree of the enclosure boundary is changed, and the podium is replaced by a permeable railing with a height of 3 m. Case C1 (see Figure 9) considers the combined design of a permeable railing and lift-up, i.e., the western podium is changed to a 3-m-high permeable railing. All high-rise buildings A–J contain a lift-up area that is 3 m high.

2.5. Wind Environment Evaluation Index

According to the study of Du et al., summer wind comfort criteria are typically classified into five groups [35]: (i) an unfavorable wind environment for pedestrian activities due to low wind conditions; (ii) a favorable wind environment for pedestrian activities, including light, gentle and moderate breezes; (iii) a tolerable wind environment for any activity; (iv) an intolerable wind environment for any activity; and (v) a dangerous outdoor environment.
According to the research of Lawson [36], the NEN 8100 standard [37], and the air ventilation assessment (AVA) scheme [38] regarding wind comfort indicators, the summer low wind comfort indicators are summarized in Table 1. Based on previous studies [39,40], the following indicators were selected as evaluation indexes for the summer low wind velocity environment:
  • Average wind velocity: The average wind velocity considers all velocity measurement points at a height of 1.5 m above the ground surface in the residential district.
  • Calm wind zone ratio: The area with a wind velocity lower than 1 m/s is defined as a calm wind zone. Considering comfort and pollutant diffusion, the lower the calm wind zone ratio at the measurement points, the better the wind environment.
  • Comfortable wind zone ratio: The area with a wind velocity between 1 and 5 m/s is a comfortable wind zone. The higher the comfortable wind zone ratio, the better the wind environment.

3. Results and Discussion

Wind data for the target residential district were retrieved from the design standards for wind and thermal environmental design of residential buildings [41]. In July, the dominant wind direction in Hangzhou is SSW at a wind velocity of 2.5 m/s. The summer wind rose map is shown in Figure 10. Within the outdoor pedestrian activity range of the residential district, 70 measurement points were selected at a uniform height of 1.5 m (refer to Figure 11). The wind environment results in the different cases were obtained through CFD simulations, and the wind environment evaluation indexes in the different cases were summarized and compared. Moreover, axes X1, X2, and X3, corresponding to the three typical boundaries, were selected to evaluate the change trends in the wind velocity at typical axial velocity measurement points.

3.1. Original Model

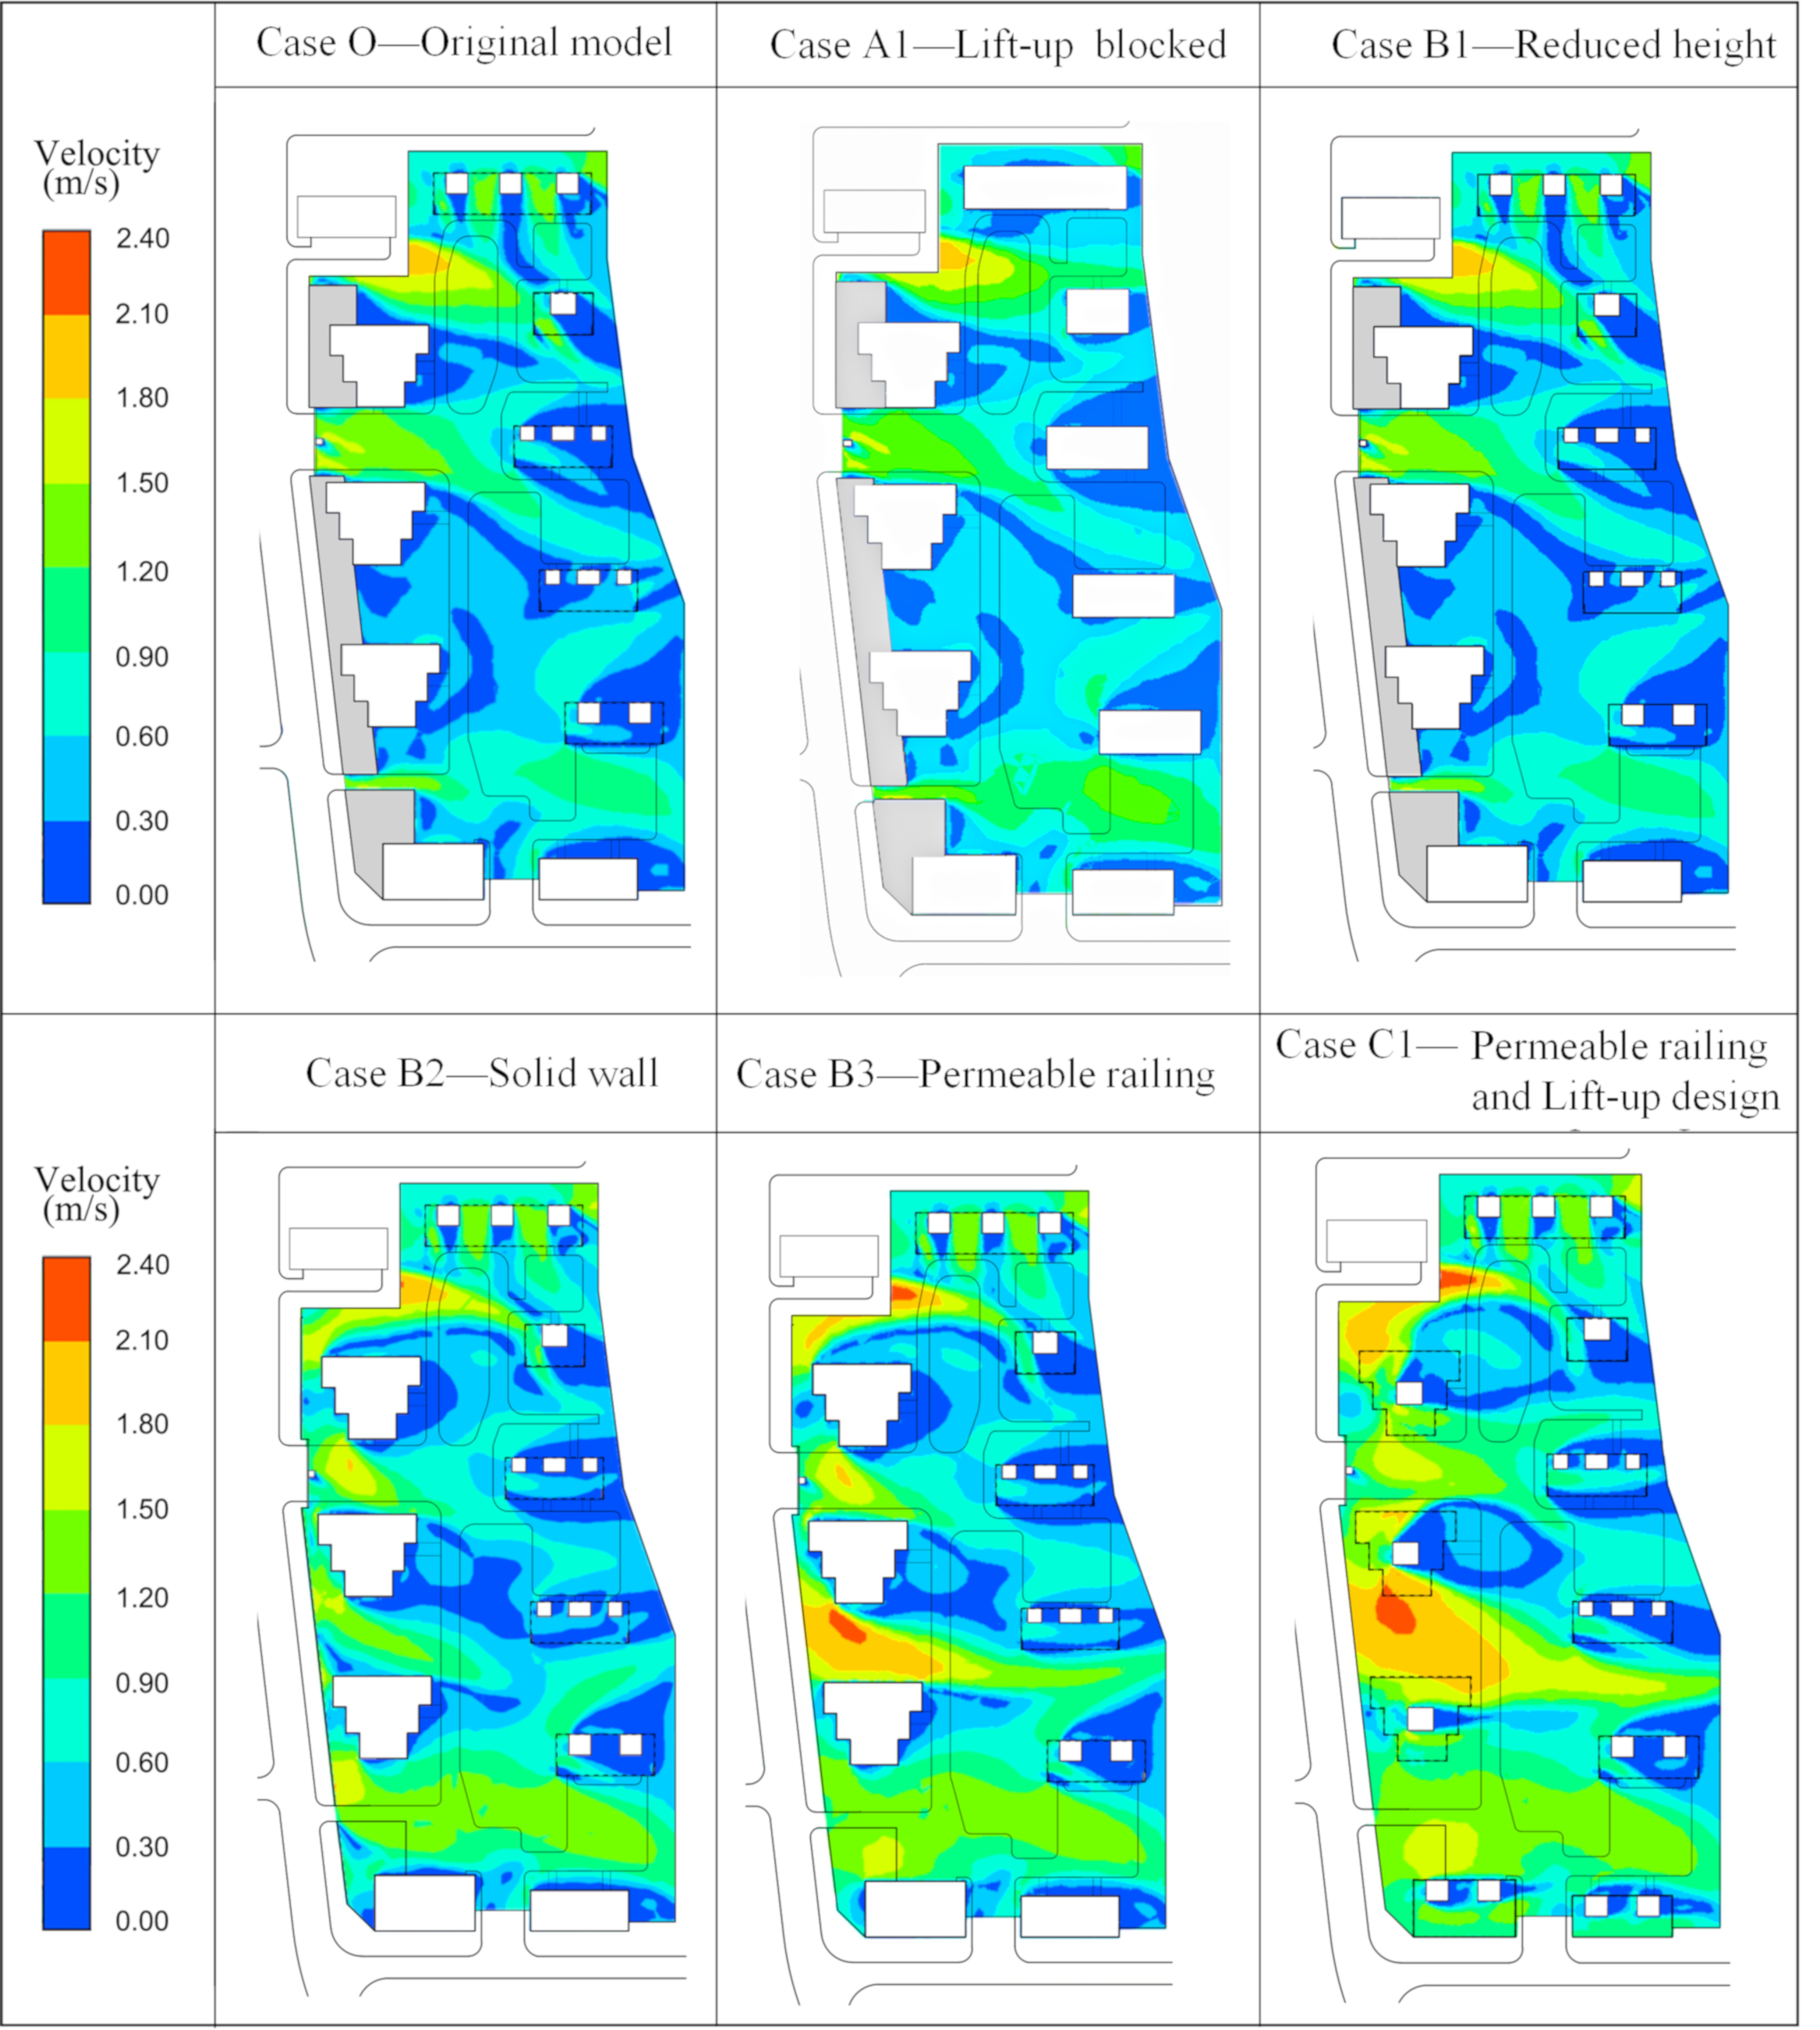
Figure 12, Figure 13 and Figure 14 depict the wind environment simulation results for the six cases in summer. Case O, as shown in Figure 12, indicates that the wind velocities in the western and southern entrance plaza areas are higher than those in the other areas and that the wind velocities in most of the residential district are low. Table 2 shows that the average wind velocity in the whole residential district is 0.63 m/s. Eighty-three percent of the outdoor spaces throughout the entire residential district are found in the calm wind zone, which is not conducive to pedestrian activities, and only 17% of the outdoor spaces are located in the comfort zone. In general, the overall wind comfort in the residential district is unsuitable for pedestrian activities during the hot and humid summer months.

3.2. Lift-Up Design

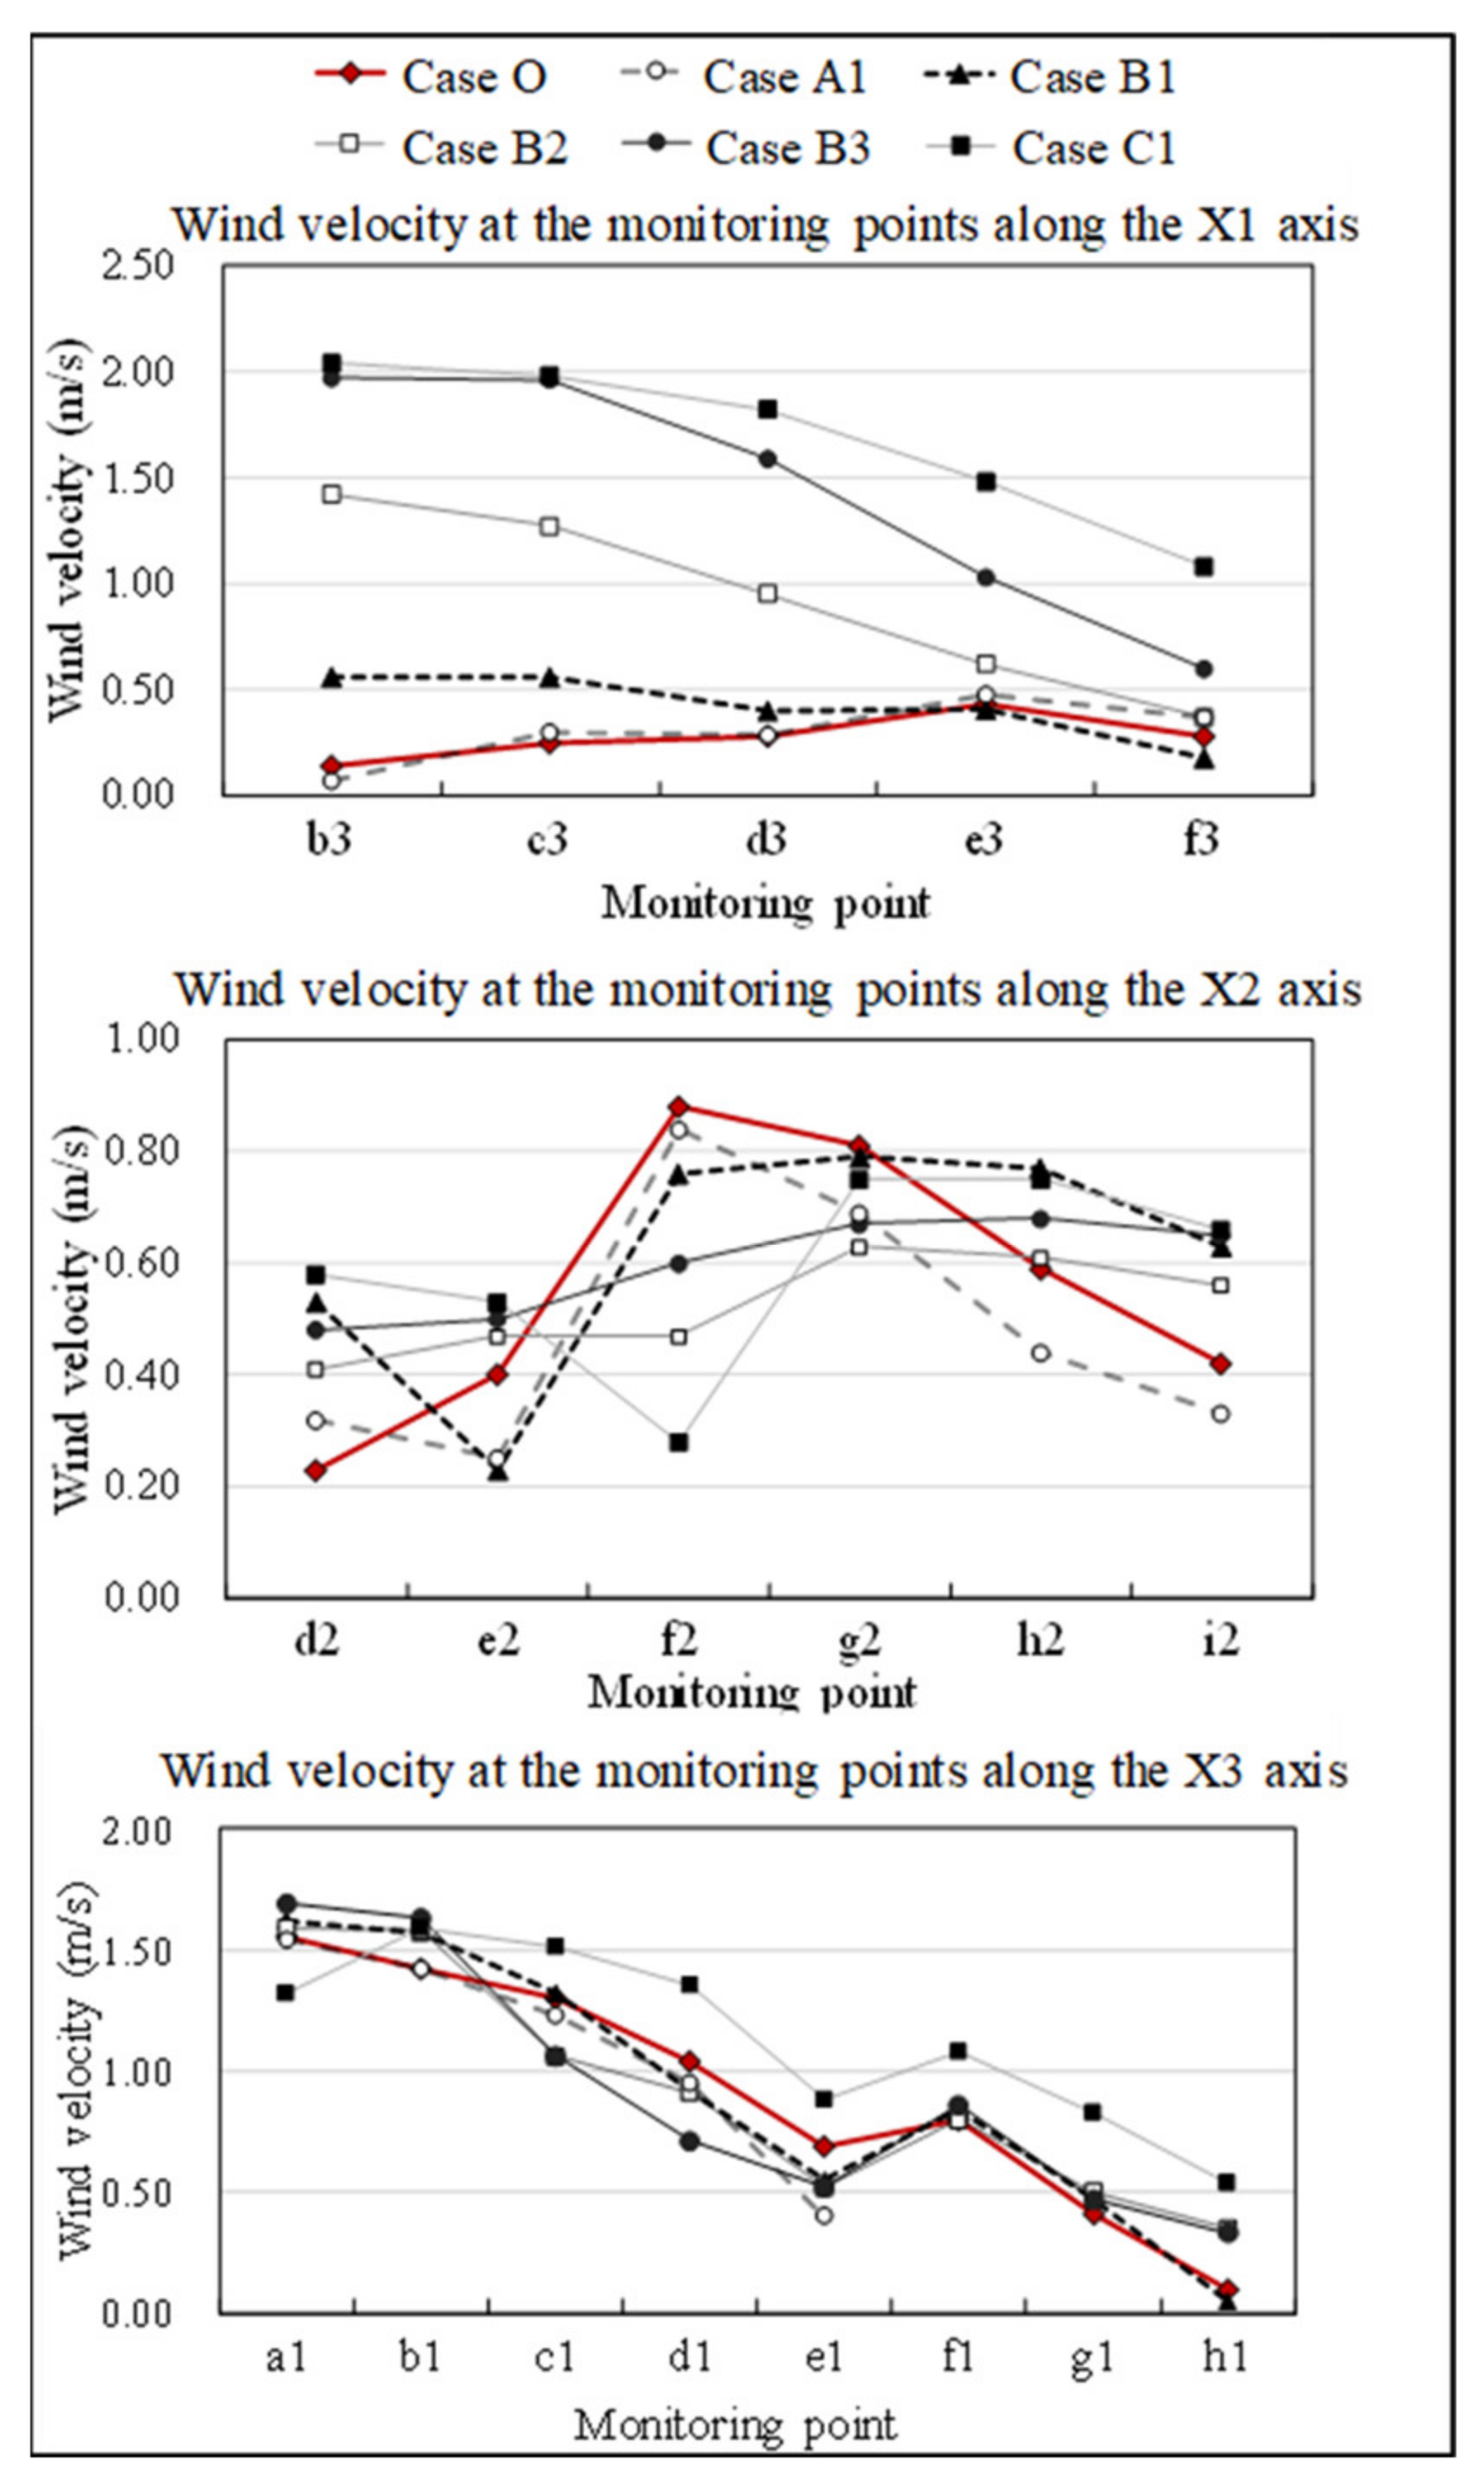
In Figure 12, Figure 13 and Figure 14, the results of wind environment simulation show that winds beyond the lift-up area are blocked for Case A1. Comparing Case A1 with Case O reveals that the lift-up buildings within the residential district increase the wind velocity in nearby areas. Axis X2 is located 15 m downwind to the north of lift-up building D (refer to Figure 11). Figure 15 shows the wind velocity at the monitoring points along axis X2, i.e., at g2, h2, and i2, and the wind velocities are 0.12, 0.15 and 0.09 m/s higher in Case O than those in Case A1, respectively.
However, the lift-up design in Case O does not improve the low wind velocity environment throughout the entire residential area. Table 2 indicates that the overall average wind velocity in Case A1 is 0.69 m/s, and the comfortable wind zone ratio is 22%. The overall wind comfort zone in the residential area remains limited. There are no velocity measurement points in the lift-up area in Case A1, so the average wind velocities cannot be directly compared. When the lift-up area velocity measurement points are removed, the average wind velocity in Case A1 is slightly higher (3%) than that in Case O.

3.3. Patterns of Enclosure Boundaries

Case B1 in Figure 12, Figure 13 and Figure 14 shows the wind environment simulation results after podium height reduction. The wind velocity behind the podium greatly increases, but the wind velocity change in the rest of the residential district is small. The average wind velocity reaches 0.66 m/s, which is 5% higher than that in the original case. Furthermore, the comfortable wind zone ratio is 17%, and 83% of the outdoor spaces occurring in the calm wind zone are suitable for pedestrian activities. In general, the improvement in residential wind comfort is not obvious.
Case B2 in Figure 12, Figure 13 and Figure 14 depicts the wind environment simulation results after adoption of a solid wall. Figure 13 and Table 2 demonstrate that the average wind velocity reaches 0.79 m/s, which is 25% higher than that in the original case. The comfortable wind zone ratio is 31%, which is 82% higher than that in the original case. Overall, the wind environment comfort is notably improved.
Case B3 in Figure 12, Figure 13 and Figure 14 shows the wind environment simulation results after the adoption of a permeable railing. Table 2 indicates that the average wind velocity in the residential district reaches 0.85 m/s, i.e., 35% higher than that in the original case. The comfortable wind zone ratio reaches 34%, and the increase in the ratio of the wind comfort zone is 100%.
According to Cases B1 to B3, the higher the permeability of the enclosure boundary is, the smaller the wind barrier, and the higher the proportion of the wind comfort zone. The wind comfort increases from Cases B1 to B3 and is optimal in Case B3.

3.4. Combination of the Permeable Railing and Lift-Up Design

Figure 12, specifically Case C1, and Figure 14 show the wind environment simulation results based on the permeable railing and lift-up design. All buildings in the residential area adopt the lift-up design. As indicated in Table 2, the average wind velocity in the residential area reaches 1.07 m/s, and the wind comfort zone ratio is 51%. Compared to Case B3, Case C1 also lifts the boundary buildings, and the average wind velocity increases by 26%. The ratio of the calm wind zone decreases by 26%, and the ratio of the comfortable wind zone increases by 50%. The lift-up design is applied to all buildings in the residential district, which notably improves the wind environment.
Compared with Case O, Case C1 has an average wind velocity that increases by 70%; more than half of the outdoor areas are located in the comfort zone, the ratio of the calm wind zone decreases by 41%, and the ratio of the wind comfort zone increases by 200%. The comfortable wind environment in the residential area is greatly improved. Among these six cases, the combined case exhibits the most apparent improvement effects on the wind environment.
Through a wind tunnel experiment on the campus of the Hong Kong Polytechnic University, Du and Mak demonstrated that pedestrian-level wind comfort is greatly improved with the adoption of measures such as opening and lift-up [3]. Tes et al. analyzed the impact of lift-up building models with different core heights and widths on surrounding wind environments [24].
In this study, we confirmed that the lift-up design affects wind comfort on hot summer days and further examined the difference between the partial lift-up design and the total lift-up design. In addition, the effect of the enclosure boundary patterns on wind comfort in residential districts was examined.

3.5. Effects of Different Enclosure Boundaries on the Wind Environment along the Horizontal Direction

To further study the influence of the different enclosure boundary patterns on the surrounding wind velocity environment, three enclosure boundary patterns were selected based on Case O: the low-rise podium, main building, and permeable railing. Along the leeward direction of the boundary, horizontal lines at a height of 1.5 m were selected as axes X1, X2, and X3. Velocity measurement points were selected at 11-m intervals along the horizontal lines. Figure 10 shows the locations of the axes.
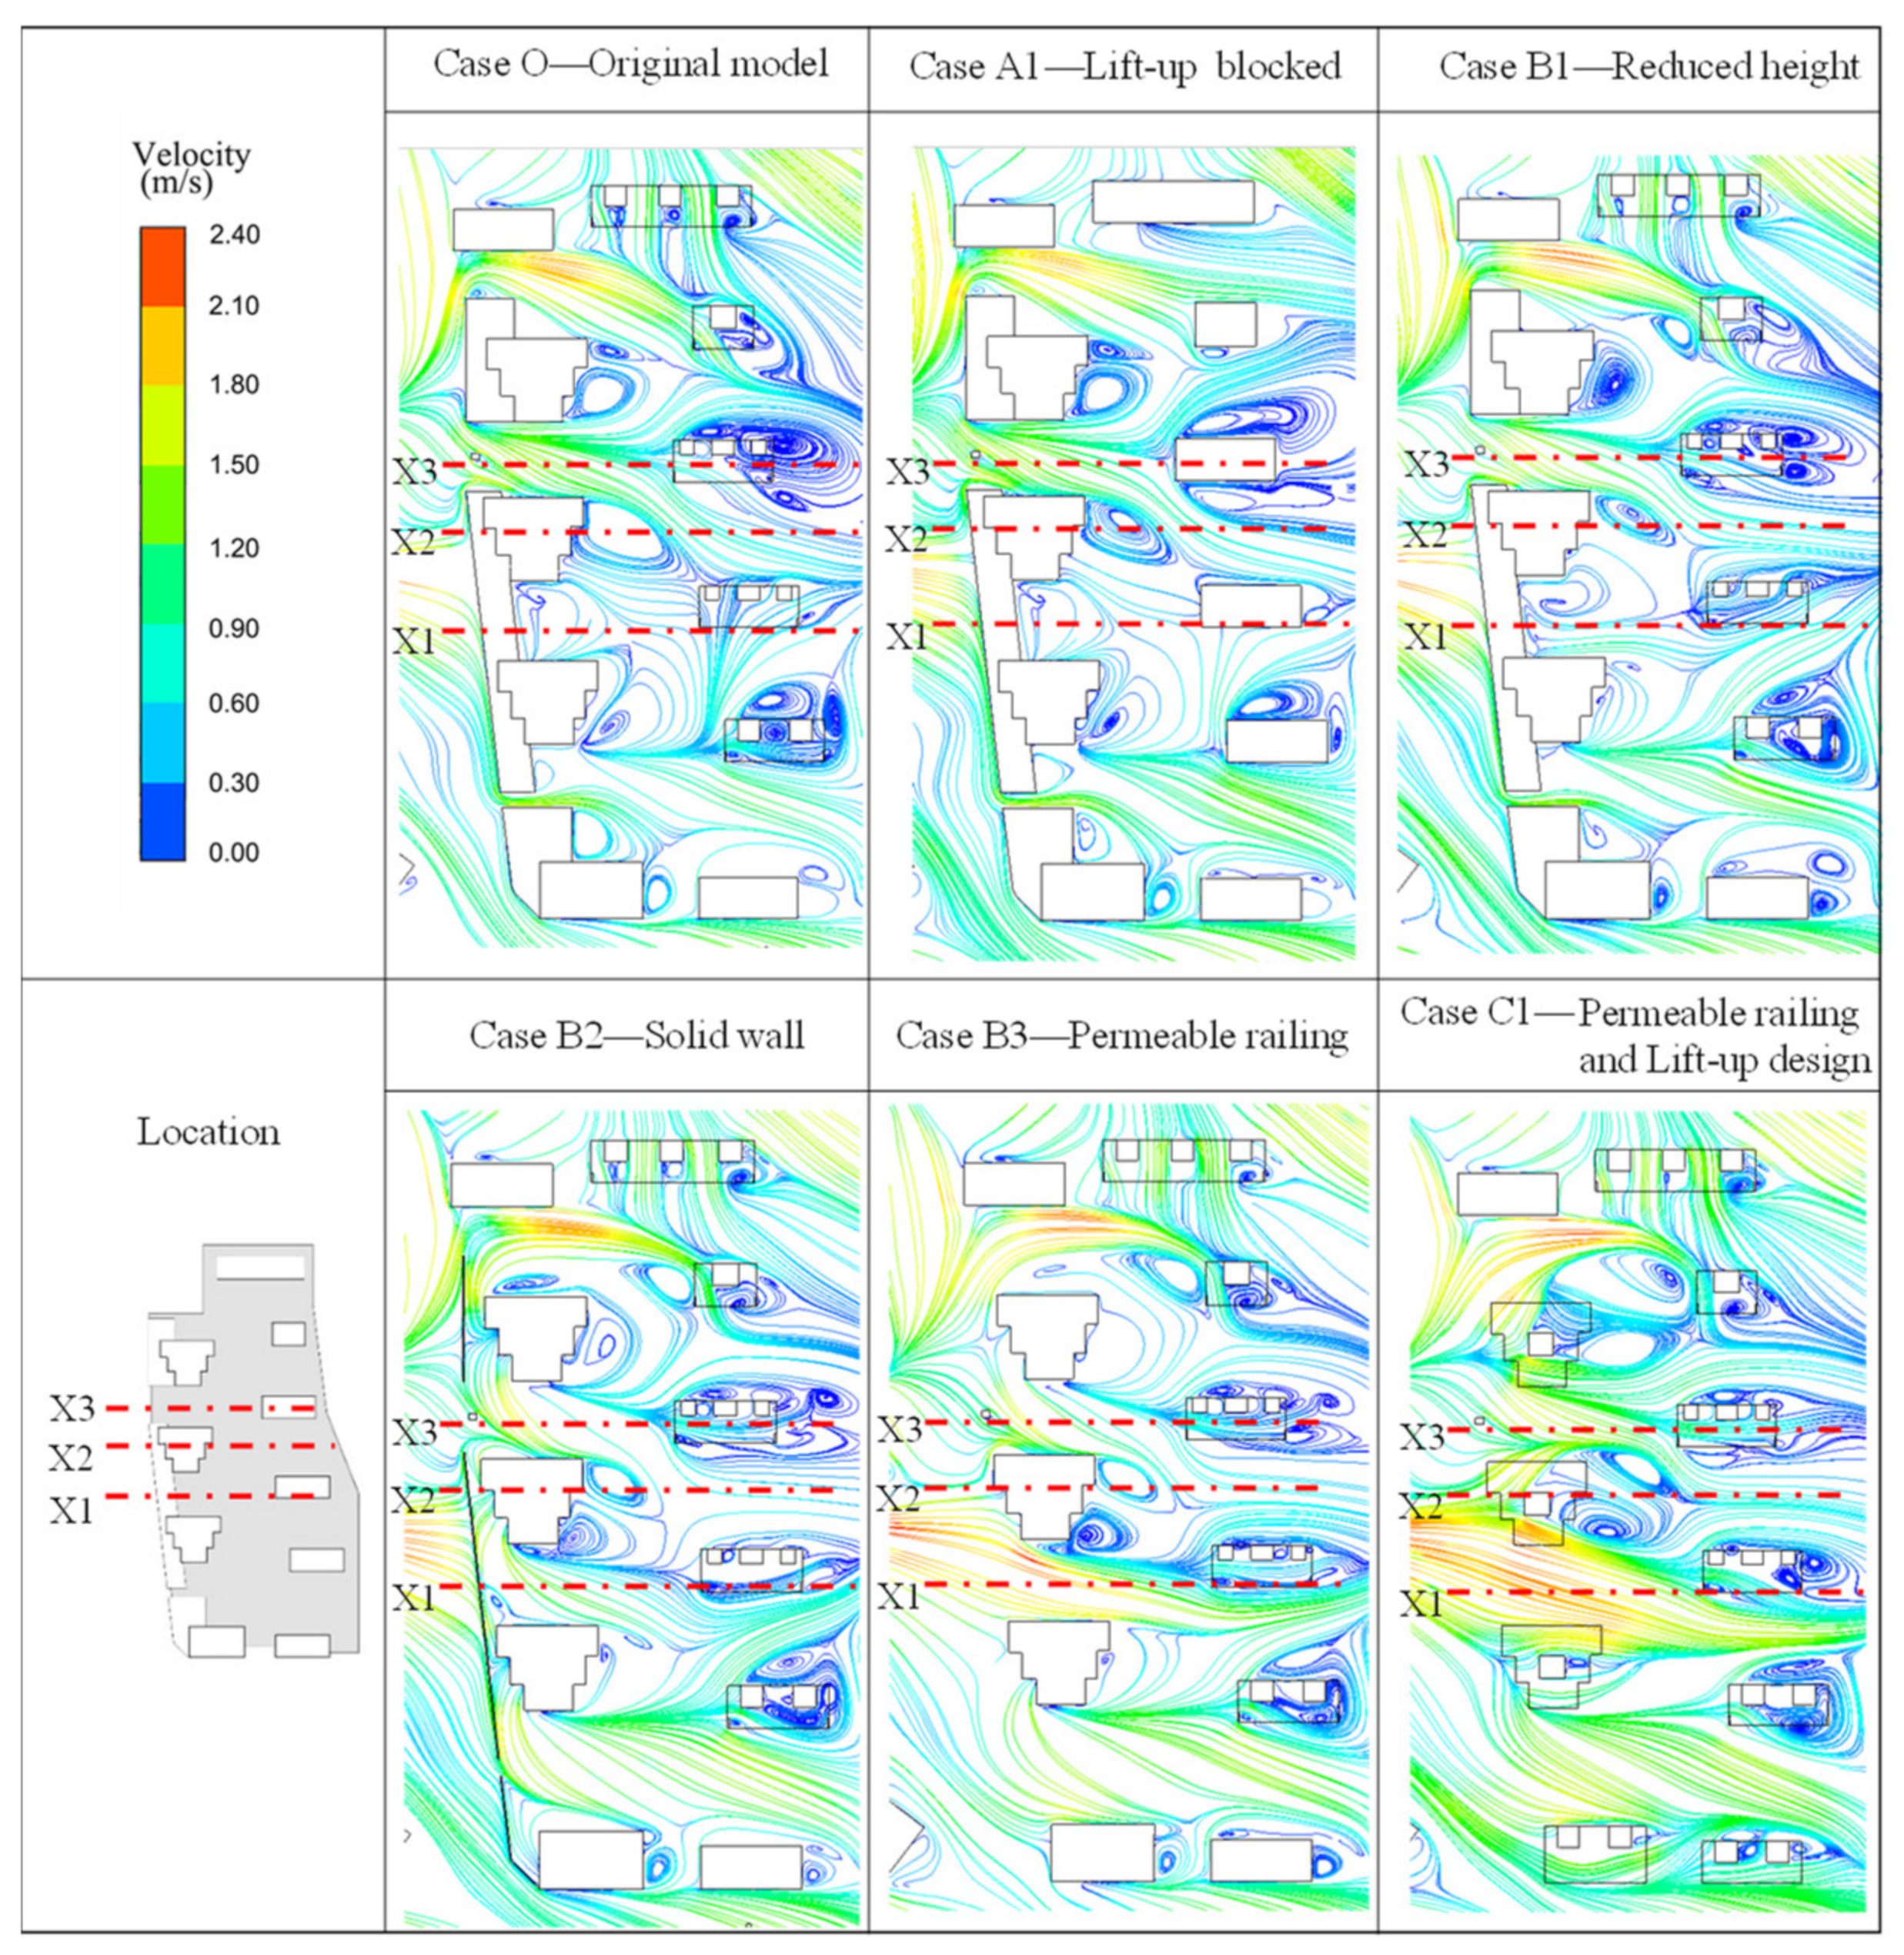
As shown in Figure 14 and Figure 15, the wind velocity along the X1 axis is most notably affected by different boundary conditions. In case O, the 8-m podium provides the most obvious barrier to wind flow. In case B1, the 4-m-high podium provides a weaker barrier to wind. In case B2, the solid wall provides a smaller barrier to wind. The wind velocity at the various measurement points exhibits relatively large variations. Compared to that for the original case, the wind velocity at point b3 nearest to the boundary (11 m) indicates the most notable increase, with the maximum increase occurring in Case C1 (i.e., an increase of 1.9 m/s). The wind velocity at point f3 (55 m) also increases, with a maximum increase of 0.8 m/s in Case C1. The wind velocity is directly affected by the conditions in these cases. The main reason for this phenomenon is that the wind velocity of the horizontal boundary corresponding to the X1 axis depends on the enclosure boundary patterns.
The changes in the X2 axis wind velocity vary in different cases. Compared with those in Case O, the maximum increase in the wind velocity occurs at d2 in Case C1, with an increase of 0.4 m/s, while the maximum decrease occurs at f2 in Case C1, decreasing by 0.6 m/s. The horizontal boundary corresponding to the X2 axis is the main building. As shown in Figure 15, the wind velocity is not greatly affected by the change in cases but is affected mainly by the corresponding wind shadow area of the main building.
As shown in Figure 14 and Figure 15, the variation in the range of the wind velocity along the X3 axis is very limited in the different cases. The maximum wind velocity change occurs at h1 in Case C1, and the wind velocity increases by 0.4 m/s. The horizontal boundary corresponding to axis X3 is the permeable fence, which is the residential area entrance. The wind velocity is slightly affected by the change in cases.
In general, the different enclosure boundary patterns directly influence the horizontal wind field along the downwind direction, and the wind gradually decreases with increasing distance from the boundary. This exerts a slight effect on the wind velocity along the nonadjacent axes.

4. Conclusions

The purpose of this study was to analyze the impacts of various enclosure boundary patterns and the lift-up design on the pedestrian wind environment in a high-density residential district and to improve the low wind velocity environment in summer. A typical residential district in Hangzhou was selected, and the wind environment results for different enclosure boundary patterns and the lift-up design were obtained via CFD simulations. The average wind velocity, calm wind zone ratio and comfortable wind zone ratio in different cases were quantitatively analyzed, and optimization strategies for the pedestrian low wind velocity environment in residential districts were determined. The main conclusions are as follows.
  • Reducing the height and width of the enclosure boundary and increasing the permeability rate of the enclosure boundary increase the overall average wind velocity at the pedestrian level in the residential district. Compared with that in Case O, the average wind velocities in Cases B1, B2, and B3 increase by 5%, 25% and 35%, respectively.
  • The lift-up design in all buildings of residential districts can notably improve the wind environment. Compared to that in Case B3, the average wind velocity in Case C1 increases by 26%, and the ratio of the comfortable wind zone increases by 50%. When the buildings inside the residential district adopt the lift-up design, the wind velocity is only improved in nearby areas. However, the low wind velocity environment throughout the whole residential district is not enhanced.
  • The combination of permeable railings and the lift-up design should be recommended because this combination has the most notable improvement effect. Compared with that in Case O, the average wind velocity in Case C1 increases by 70%, and the ratio of comfortable wind zone increases by 200%.
  • The enclosure boundary pattern has an obvious influence on the wind field along the horizontal downwind direction but only a slight influence on the wind speed along the nonadjacent axes. Moreover, the influence gradually decreases with increasing distance from the boundary.
In this study, we focus on the influence of the enclosure boundary patterns and the lift-up design in the hot summer and cold winter region of China. However, the characteristics of residential districts vary greatly in different areas of China. We will investigate the effects of different enclosures for various climates in future studies. Simulations for larger areas will be performed to gain more accurate CFD inflow boundary conditions. Besides, we will also try to use the Weather Research and Forecasting (WRF) and CFD methods to obtain more complete data for the inflow boundary.

Author Contributions

Z.J. developed the original idea, designed the methodology, and wrote the original draft, which was revised by W.G. Both authors have read and agreed to the published version of the manuscript.

Funding

This research received no external funding.

Institutional Review Board Statement

Not applicable.

Informed Consent Statement

Not applicable.

Data Availability Statement

Not applicable.

Acknowledgments

The authors are thankful to anonymous reviewers for their helpful comments.

Conflicts of Interest

The authors declare no conflict of interest.

References

  1. Xiao, M.; Simon, S.; Pregger, T. Energy System Transitions in the Eastern Coastal Metropolitan Regions of China—The Role of Regional Policy Plans. Energies 2019, 12, 389. [Google Scholar] [CrossRef] [Green Version]
  2. Zhong, S.; Qian, Y.; Zhao, C.; Leung, R.; Wang, H.; Yang, B.; Fan, J.; Yan, H.; Yang, X.; Liu, D. Urbanization-induced urban heat island and aerosol effects on climate extremes in the Yangtze River Delta region of China. Atmos. Chem. Phys. 2017, 17, 5439–5457. [Google Scholar] [CrossRef] [Green Version]
  3. Du, Y.; Mak, C.M. Improving pedestrian level low wind environment in high-density cities: A general framework and case study. Sustain. Cities Soc. 2018, 42, 314–324. [Google Scholar] [CrossRef]
  4. Peng, L.; Liu, J.P.; Wang, Y.; Chan, P.W.; Lee, T.C.; Peng, F.; Wong, M.S.; Li, Y. Wind weakening in a dense high-rise city due to over nearly five decades of urbanization. Build. Environ. 2018, 138, 207–220. [Google Scholar] [CrossRef]
  5. Vervoort, R.; Blocken, B.; Van Hooff, T. Science of the Total Environment Reduction of particulate matter concentrations by local removal in a building courtyard: Case study for the Delhi American Embassy School. Sci. Total Environ. 2019, 686, 657–680. [Google Scholar] [CrossRef] [PubMed]
  6. Qin, H.; Lin, P.; Siu, S.; Lau, Y.; Song, D.X. Influence of site and tower types on urban natural ventilation performance in high-rise high-density urban environment. Build. Environ. 2020, 179, 106960. [Google Scholar] [CrossRef]
  7. Lin, G.; Zhang, S.; Zhong, Y.; Zhang, L.; Ai, S.; Li, K.; Su, W.; Cao, L.; Zhao, Y.; Tian, F.; et al. Community evidence of severe acute respiratory syndrome coronavirus 2 (SARS-CoV-2) transmission through air. Atmos. Environ. 2021, 246, 118083. [Google Scholar] [CrossRef]
  8. Coccia, M. How (Un)sustainable Environments Are Related to the Diffusion of COVID-19: The Relation between Coronavirus Disease 2019, Air Pollution, Wind Resource and Energy. Sustainability 2020, 12, 9709. [Google Scholar] [CrossRef]
  9. Huang, T.-L.; Kuo, C.-Y.; Tzeng, C.-T.; Lai, C.-M. The Influence of High-Rise Buildings on Pedestrian-Level Wind in Surrounding Street Canyons in an Urban Renewal Project. Energies 2020, 13, 2745. [Google Scholar] [CrossRef]
  10. Blocken, B.; Stathopoulos, T.; Van Beeck, J.P.A.J. Pedestrian-level wind conditions around buildings: Review of wind-tunnel and CFD techniques and their accuracy for wind comfort assessment. Build. Environ. 2016, 100, 50–81. [Google Scholar] [CrossRef]
  11. Tsang, C.W.; Kwok, K.C.S.; Hitchcock, P.A. Wind tunnel study of pedestrian level wind environment around tall buildings: Effects of building dimensions, separation and podium. Build. Environ. 2012, 49, 167–181. [Google Scholar] [CrossRef]
  12. Zhen, M.; Zhou, D.; Bian, G.M.; Yang, Y.; Liu, Y. Wind environment of urban residential blocks: A research review. Archit. Sci. Rev. 2019, 62, 66–73. [Google Scholar] [CrossRef]
  13. Blocken, B. 50 years of Computational Wind Engineering: Past, present and future. J. Wind Eng. Ind. Aerodyn. 2014, 129, 69–102. [Google Scholar] [CrossRef]
  14. Liu, S.; Pan, W.; Zhang, H.; Cheng, X.; Long, Z.; Chen, Q. CFD simulations of wind distribution in an urban community with a full-scale geometrical model. Build. Environ. 2017, 117, 11–23. [Google Scholar] [CrossRef]
  15. Park, B.; Lee, S. Investigation of the Energy Saving Efficiency of a Natural Ventilation Strategy in a Multistory School Building. Energies 2020, 13, 1746. [Google Scholar] [CrossRef] [Green Version]
  16. Ying, X.; Wang, Y.; Li, W.; Liu, Z.; Ding, G. Group Layout Pattern and Outdoor Wind Environment of Enclosed Office Buildings in Hangzhou. Energies 2020, 13, 406. [Google Scholar] [CrossRef] [Green Version]
  17. Hang, J.; Li, Y. Age of air and air exchange efficiency in high-rise urban areas and its link to pollutant dilution. Atmos. Environ. 2011, 45, 5572–5585. [Google Scholar] [CrossRef]
  18. Li, Y.; Chen, L. Study on the influence of voids on high-rise building on the wind environment. Build Simul. 2020, 13, 419–438. [Google Scholar] [CrossRef] [PubMed] [Green Version]
  19. Wang, X.; Chen, Y.; Sun, N.; Chen, S.; Li, Q. Wind tunnel experiment and optimization design of wind environment around buildings with parallel layout. J. Zhejiang Univ. Sci. A 2012, 46, 454–462. (In Chinese) [Google Scholar] [CrossRef]
  20. Hadavi, M.; Pasdarshahri, H. Quantifying impacts of wind speed and urban neighborhood layout on the infiltration rate of residential buildings. Sustain. Cities Soc. 2020, 53, 101887. [Google Scholar] [CrossRef]
  21. Hu, K.; Cheng, S.; Qian, Y. CFD Simulation Analysis of Building Density on Residential Wind Environment. J. Eng. Sci. Technol. Rev. 2018, 11, 35–43. [Google Scholar] [CrossRef]
  22. Hong, B.; Lin, B. Numerical studies of the outdoor wind environment and thermal comfort at pedestrian level in housing blocks with different building layout patterns and trees arrangement. Renew. Energy 2015, 73, 18–27. [Google Scholar] [CrossRef]
  23. Ghadikolaei, F.M.; Ossen, D.R.; Mohamed, M.F. Effects of wing wall at the balcony on the natural ventilation performance in medium-rise residential buildings. J. Build. Eng. 2020, 31, 101316. [Google Scholar] [CrossRef]
  24. Tse, K.T.; Zhang, X.; Weerasuriya, A.U.; Li, S.W.; Kwok, K.C.S.; Mak, C.M. Adopting ‘lift-up’ building design to improve the surrounding pedestrian-level wind environment. Build. Environ. 2017, 117, 154–165. [Google Scholar] [CrossRef]
  25. Guo, F.; Zhu, P.; Wang, S.; Duan, D.; Jin, Y. Improving Natural Ventilation Performance in a High-Density Urban District: A Building Morphology Method. Proc. Eng. 2017, 205, 952–958. [Google Scholar] [CrossRef]
  26. Kubota, T.; Miura, M.; Tominaga, Y.; Mochida, A. Wind tunnel tests on the relationship between building density and pedestrian-level wind velocity: Development of guidelines for realizing acceptable wind environment in residential neighborhoods. Build. Environ. 2008, 43, 1699–1708. [Google Scholar] [CrossRef]
  27. GB 50180-2018. In Standard for Urban Residential Area Planning and Design; Ministry of Housing and Urban-Rural Development of the People’s Republic of China: Beijing, China, 2018.
  28. Deng, F. Comparative study on gated communities of China and the western private community. Urban Probl. 2011, 11, 2–8. (In Chinese) [Google Scholar] [CrossRef]
  29. Liu, S.; Pan, W.; Zhao, X.; Zhang, H.; Cheng, X.L.; Long, Z.; Chen, Q. Influence of surrounding buildings on wind flow around a building predicted by CFD simulations. Build. Environ. 2018, 140, 1–10. [Google Scholar] [CrossRef]
  30. Zhuang, Z.; Yu, Y.; Ye, H.; Tan, H.; Xie, J. Review on CFD Simulation Technology of Wind Environment around Buildings. Build. Sci. 2014, 30, 108–114. (In Chinese) [Google Scholar] [CrossRef]
  31. Tominaga, Y.; Mochida, A.; Yoshie, R.; Kataoka, H.; Nozu, T.; Yoshikawa, M.; Shirasawa, T. AIJ guidelines for practical applications of CFD to pedestrian wind environment around buildings. J. Wind Eng. Ind. Aerodyn. 2008, 96, 1749–1761. [Google Scholar] [CrossRef]
  32. Shih, T.H.; Liou, W.W.; Shabbir, A.; Yang, Z.; Zhu, J. A new k-ε eddy-viscosity model for high Reynolds number turbulent flows–model development and validation. Comput. Fluids 1995, 24, 227–238. [Google Scholar] [CrossRef]
  33. Blocken, B.; Persoon, J. Pedestrian wind comfort around a large football stadium in an urban environment: CFD simulation, validation and application of the new Dutch wind nuisance standard. J. Wind Eng. Ind. Aerodyn. 2009, 97, 255–270. [Google Scholar] [CrossRef]
  34. GB50009-2012. In Code for Loads of Building Structures; Ministry of Housing and Urban-Rural Development of the People’s Republic of China: Beijing, China, 2012.
  35. Du, Y.; Mak, C.M.; Kwok, K.; Tse, K.T.; Lee, T.; Ai, Z.; Liu, J.; Niu, J. New criteria for assessing low wind environment at pedestrian level in Hong Kong. Build. Environ. 2017, 123, 23–36. [Google Scholar] [CrossRef] [Green Version]
  36. Lawson, T.V. The Wind Content of the Built Environment. J. Wind Eng. Ind. Aerodyn. 1978, 3, 93–105. [Google Scholar] [CrossRef]
  37. Willemsen, E.; Wisse, J.A. Design for wind comfort in The Netherlands: Procedures, criteria and open research issues. J. Wind Eng. Ind. Aerodyn. 2007, 95, 1541–1550. [Google Scholar] [CrossRef]
  38. Ng, E. Policies and technical guidelines for urban planning of high-density cities–Air ventilation assessment (AVA) of Hong Kong. Build. Environ. 2009, 44, 1478–1488. [Google Scholar] [CrossRef]
  39. Ma, T.; Chen, T. Classification and pedestrian-level wind environment assessment among Tianjin’s residential area based on numerical simulation. Urban Clim. 2020, 34, 100702. [Google Scholar] [CrossRef]
  40. Janssen, W.D.; Blocken, B.; van Hooff, T. Pedestrian wind comfort around buildings: Comparison of wind comfort criteria based on whole-flow field data for a complex case study. Build. Environ. 2013, 59, 547–562. [Google Scholar] [CrossRef]
  41. DB33/1111-2015. In Design Standards for Wind and Thermal Environment of Residential Buildings; Zhejiang Housing and Urban-Rural Development Department: Beijing, China, 2015.
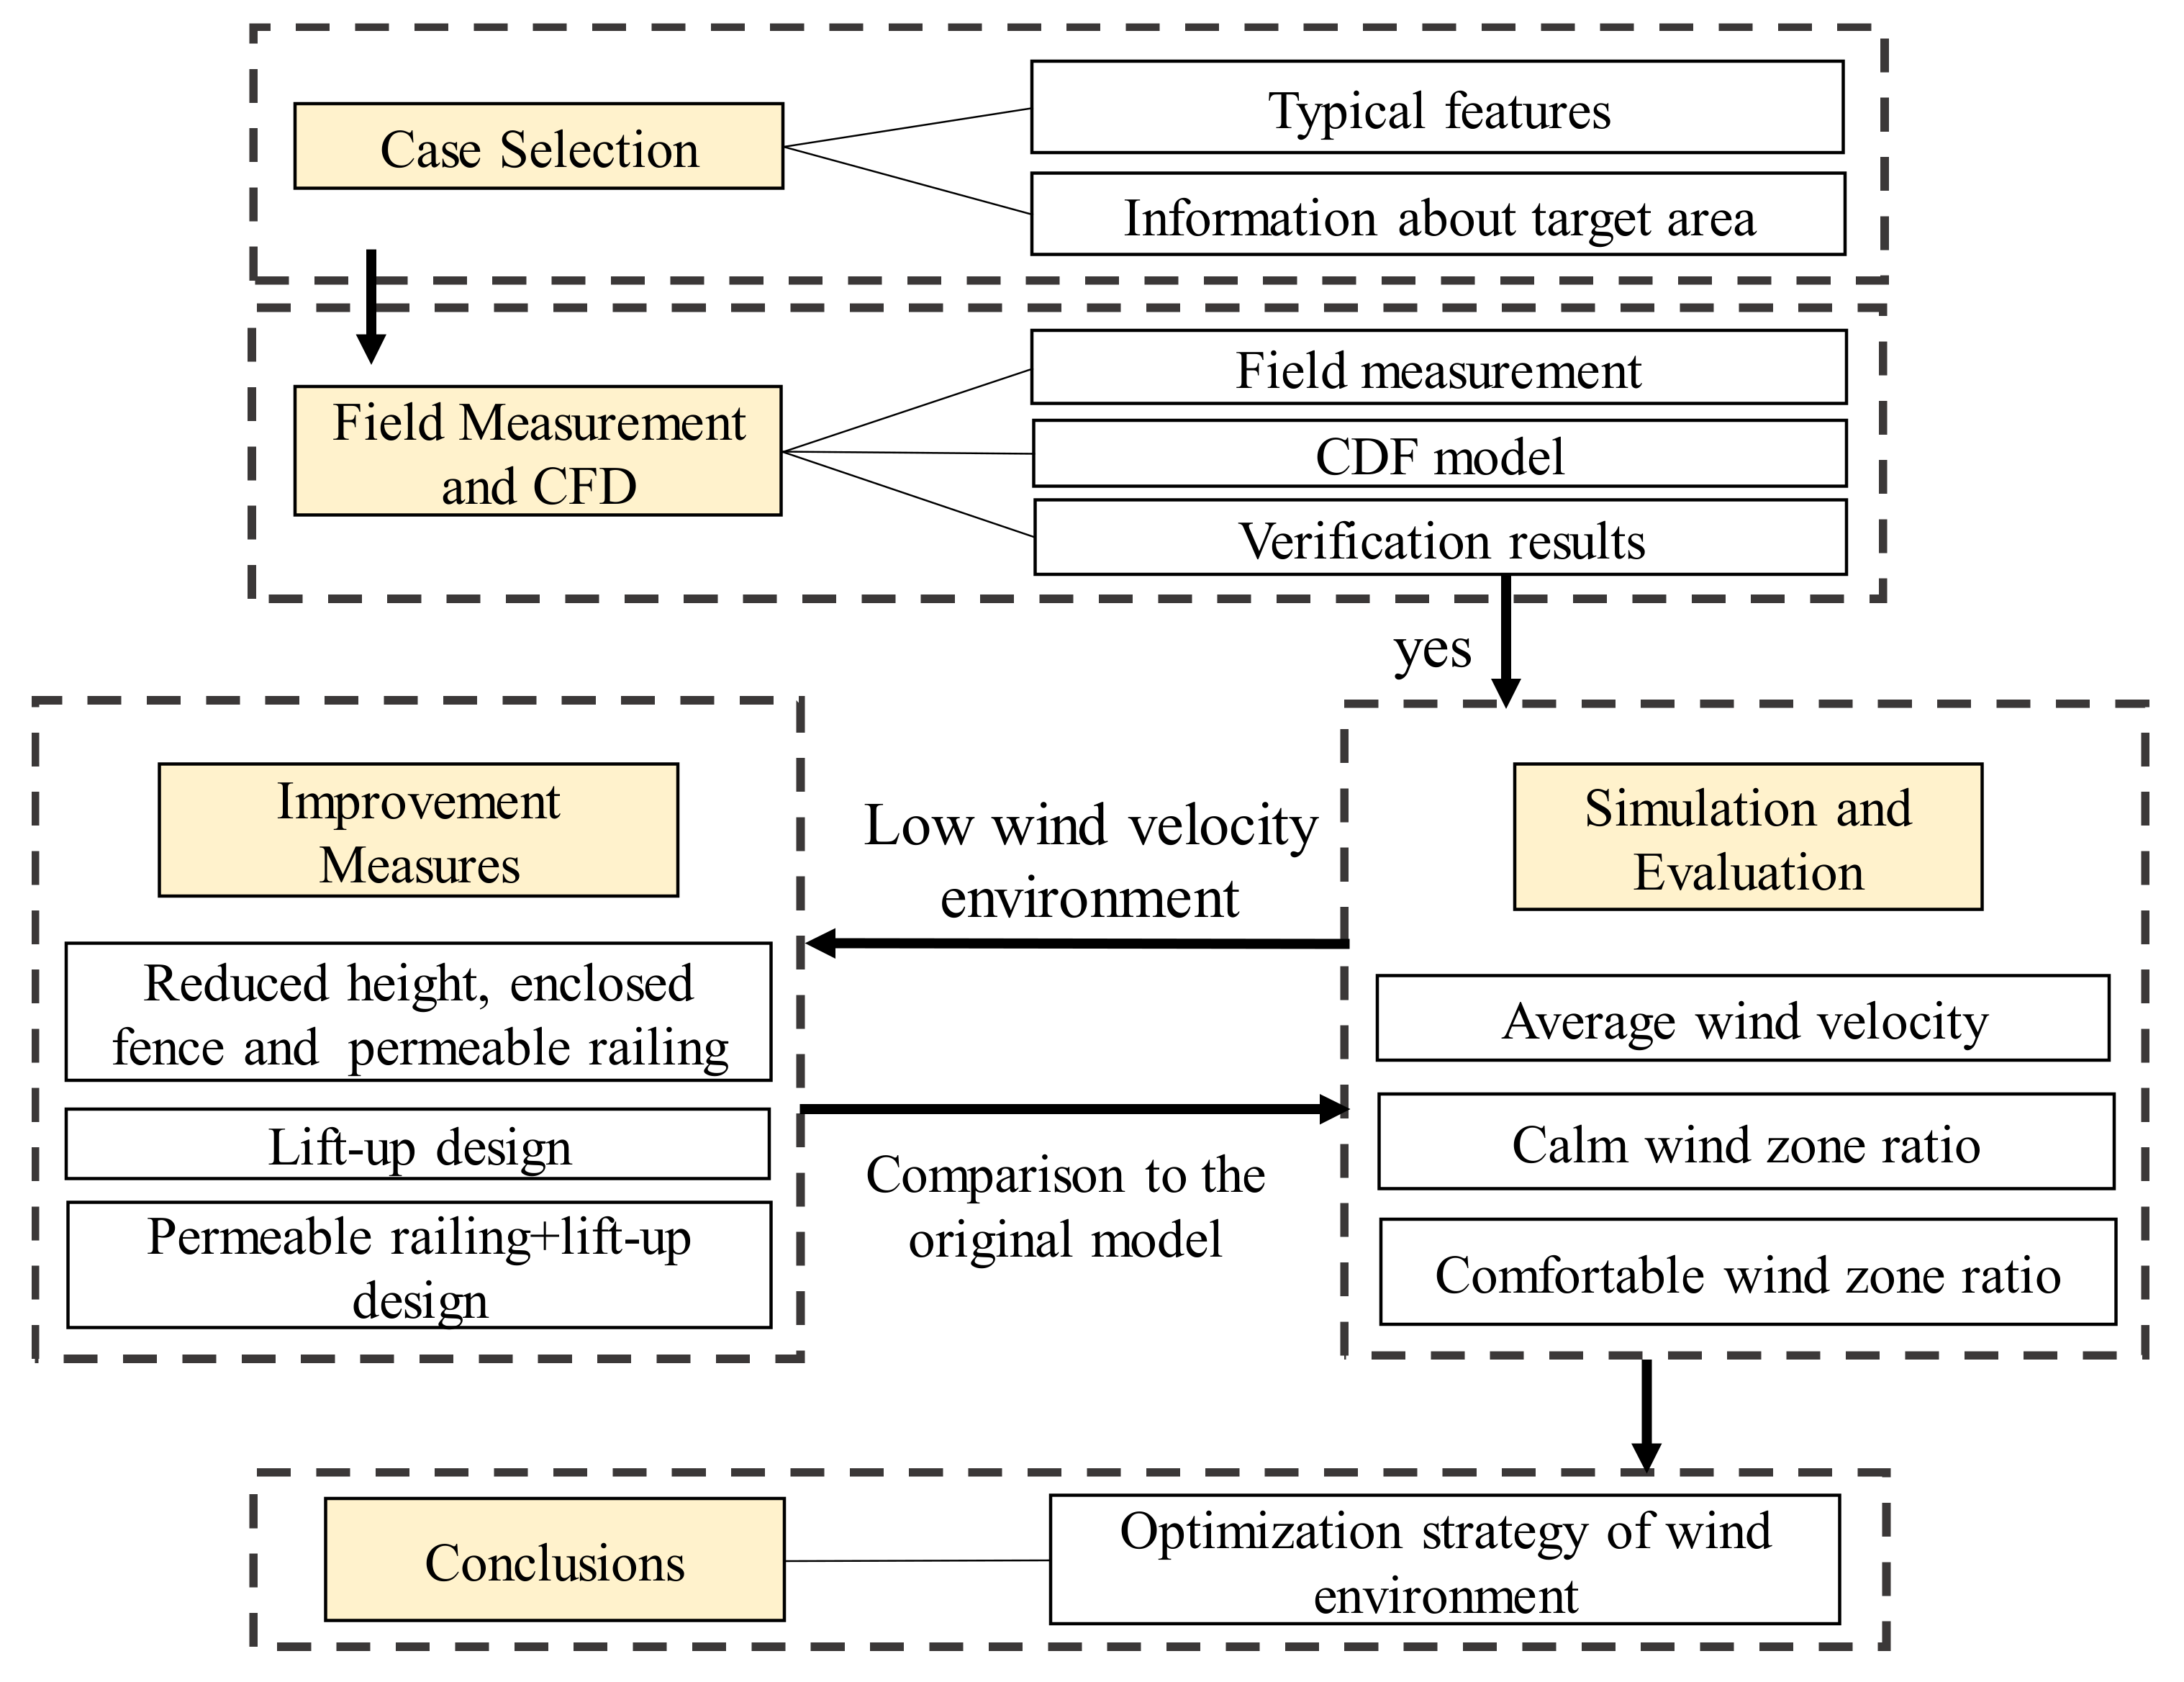
Figure 1. Framework and workflow of this study.
Energies 14 03199 g001
Figure 2. Distribution map of the case locations.
Energies 14 03199 g002
Figure 3. Site layouts of 16 high-density districts in the Yangtze River Delta region of China.
Energies 14 03199 g003
Figure 4. Characteristics of high-density residential districts in the Yangtze River Delta region of China.
Energies 14 03199 g004
Figure 5. Four typical patterns of enclosed boundaries in residential districts.
Energies 14 03199 g005
Figure 6. Schematic diagram of lift-up buildings: (a) The locations of the lift-up areas and the vertical structural elements, (b) schematic diagrams of the lift-up building E.
Energies 14 03199 g006
Figure 7. CFD model: (a) typical residential district and surrounding buildings, (b) measurement point locations, (c) grid arrangement.
Energies 14 03199 g007
Figure 8. Comparison of the average measured and simulated wind velocity values at points 1–7.
Energies 14 03199 g008
Figure 9. Design of the six cases.
Energies 14 03199 g009
Figure 10. Wind rose map for Hangzhou in July, information used from reference [41].
Energies 14 03199 g010
Figure 11. Location of the 70 velocity measurement points.
Energies 14 03199 g011
Figure 12. Wind velocity simulation results corresponding to the six cases.
Energies 14 03199 g012
Figure 13. Wind velocity box plots for the six cases.
Energies 14 03199 g013
Figure 14. Streamline patterns of X1, X2, and X3 at pedestrian height for the six cases.
Energies 14 03199 g014
Figure 15. X1, X2, and X3 velocity measurement point wind velocities for the six cases.
Energies 14 03199 g015
Table 1. Summer low wind comfort criteria in terms of the average wind velocity.
TypeDescriptionAverage Wind Velocity (m/s)
UnfavorableCalm0–1 [36,38]
FavorableLight breeze1–1.8 [36]
Gentle breeze1.8–3.6 [36]
Moderate breeze3.6–5.0 [37]
TolerableFresh breeze5.0–7.6 [37]
IntolerableStrong breeze7.6–15 [37]
DangerousGale>15 [37]
Table 2. Results of the wind environment simulation for the six cases.
TypeCase OCase A1Case B1Case B2Case B3Case C1
Average wind velocity (m/s)0.630.690.660.790.851.07
Number of measurement points705870707070
Calm wind zone ratio83%78%83%69%66%49%
Comfortable wind zone ratio17%22%17%31%34%51%
Ratio of wind velocity increase/*5%25%35%70%
Ratio of calm wind zone reduction/*017%20%41%
Ratio of comfortable wind zone increase/*082%100%200%
* There are no wind velocity measurement points in the lift-up area in Case A1.
Publisher’s Note: MDPI stays neutral with regard to jurisdictional claims in published maps and institutional affiliations.