1. Introduction
VSC-HVDC technology is a promising solution for integration of future offshore wind farms into the existing AC system and also an attractive bulk power transmission structure in the next-generation networks [
1]. VSC-HVDC can contribute to voltage stability improvement during severe disturbance [
2,
3,
4,
5,
6,
7,
8,
9,
10,
11,
12,
13], while the control schemes of the VSC-HVDC play an important role in the enhancement of the voltage stability [
2,
3,
4,
5,
6,
7,
10,
11,
12,
13]. In recent years, there are a number of research efforts focusing on the voltage stability of multi-terminal HVDC networks [
2,
3,
4,
5,
6,
7,
8,
9,
10,
11,
12,
13]. In [
2], the AC grid is considered as a simplified mode, thus the dynamics interactions between the VSC-HVDC and the AC network are not counted. This study investigates the capacity transferring power of the AC line when applying different AC voltage control strategies. A reactive-power control strategy of VSC-HVDC for enhancement of power system transients is proposed in [
4]. In this control scheme, a supplementary reactive power reference is added to the actual reactive power reference. An adaptive supplementary damping control based on the goal representation heuristic dynamic programming (GrHDP) is introduced in [
5]. In [
6], the impact of loads on the voltage stability is studied by modeling loads as exponential load and induction motor, while the dynamics of the AC network were neglected. In the above-mentioned research, the improvement of voltage stability by using the VSC-HVDC networks is analyzed qualitatively with limited detailed analysis of VSC capacity.
It is also found that the control schemes of VSC have an important effect on the voltage stability. Several control methods of the VSC-HVDC networks to provide voltage enhancement during the AC voltage drops are presented in [
5,
6,
7,
8,
9,
10,
11,
12,
13]. However, in those papers, the limits of the reference reactive current are always selected corresponding to different control modes, which will restrict the capability of VSC for reactive support, especially under serious voltage falls. Authors of [
9] investigate the stability of an interconnected AC/DC network through adjustment of the VSC-MTDC operating point according to Hopf Bifurcation theory.
In [
10], the influence of VSC-HVDC for reactive power control on the stability of the AC grid is introduced. In this paper, three different reactive power control modes are presented, which are constant reactive power control, constant AC voltage control, and AC voltage margin control. The impact of these reactive control modes on transient angle stability of the AC grid as well as dynamic power angle stability of the AC system is studied. In this study, the authors focus only on angle stability of the AC system. The voltage stability was not discussed much in this research. Moreover, upper and lower values of the current limiter in the control scheme are fixed.
In [
11], analysis of voltage regulation of VSC-HVDC on power system stability is investigated. In this study, the reference reactive current is determined by a
V−iq characteristic curve based on the grid code of Spain. Additionally, a control design method based on fractional order control theory is used for design of an AC voltage controller. The reference reactive current is not automatically changed according to faults suddenly occurring in the AC grid. Additionally, the model of the test case system is still reduced, with only two VSC-HVDC connected to an AC voltage source.
In [
12], a control system is developed to provide reactive power support under short-circuit faults of the AC network. The reactive current limit can be changed depending on operation modes. This control scheme employs three different operation modes depending on conditions of the AC system, namely conditions of steady state, infeed grid fault, sending end grid fault, and conditions of sending end grid fault which is not cleared in time. However, the reactive current limit in this control scheme is not automatically changed according to real conditions of the system. Decisions of grid operators are still required. In an operation mode for maximum reactive power, the control scheme will default to using the total capacity of VSC for reactive generation without taking care of the realistic frequency of the system. This can lead to the frequency worsening because of a shortage of active power. Additionally, this control system also requires a communication system receiving an external control signal. The case study of [
12] is based on the transmission network of Denmark with only one VSC-HVDC link, and it is restricted to the realistic grid.
Therefore, it is necessary to develop a proper control approach of the multi-VSC-HVDC networks embedded in the AC system in order to automatically adjust the output reactive power depending on the real-time severe conditions of the system.
In this paper, a more realistic multi-VSC-HVDC system feeding into the electric power system of south Germany is established. In order to consider dynamics of the AC network, instead of using the ideal voltage source, synchronous generators are used. For analyzing the impact of loads, static loads and induction motors are employed. Furthermore, an adaptive control method of the VSC-HVDC networks is proposed to enhance the voltage support by automatically adjusting the reactive current limits while ensuring not to worsen the frequency of the system according to the dynamics conditions of the system. This results in the maximum utilization of the VSC capability for reactive power support. The key merit of this proposed adaptive control is automatically following to dynamic operation conditions of the AC network based on the system frequency. It therefore contributes to improvement of voltage stability as well as angle stability of the AC system. As a result, effective operation of the AC grid embedded to VSC-HVDC links can be enhanced. In addition, this novel control method applied to a VSC operates without requirement of exchanging information with other VSC. This novel adaptive control could be described as “act locally but support globally”. Finally, the simulation results realize the performance of the proposed adaptive control method.
The rest of the paper is organized as follows.
Section 2 describes the VSC-HVDC system embedded in the representative AC system based on the south German network and its model.
Section 3 presents the proposed adaptive control method of the VSC-HVDC system integrated with the AC network. Simulation results and discussion are analyzed in
Section 4. Finally, the conclusions are drawn in
Section 5.
2. Model of the Hybrid VSC-HVDC-AC System
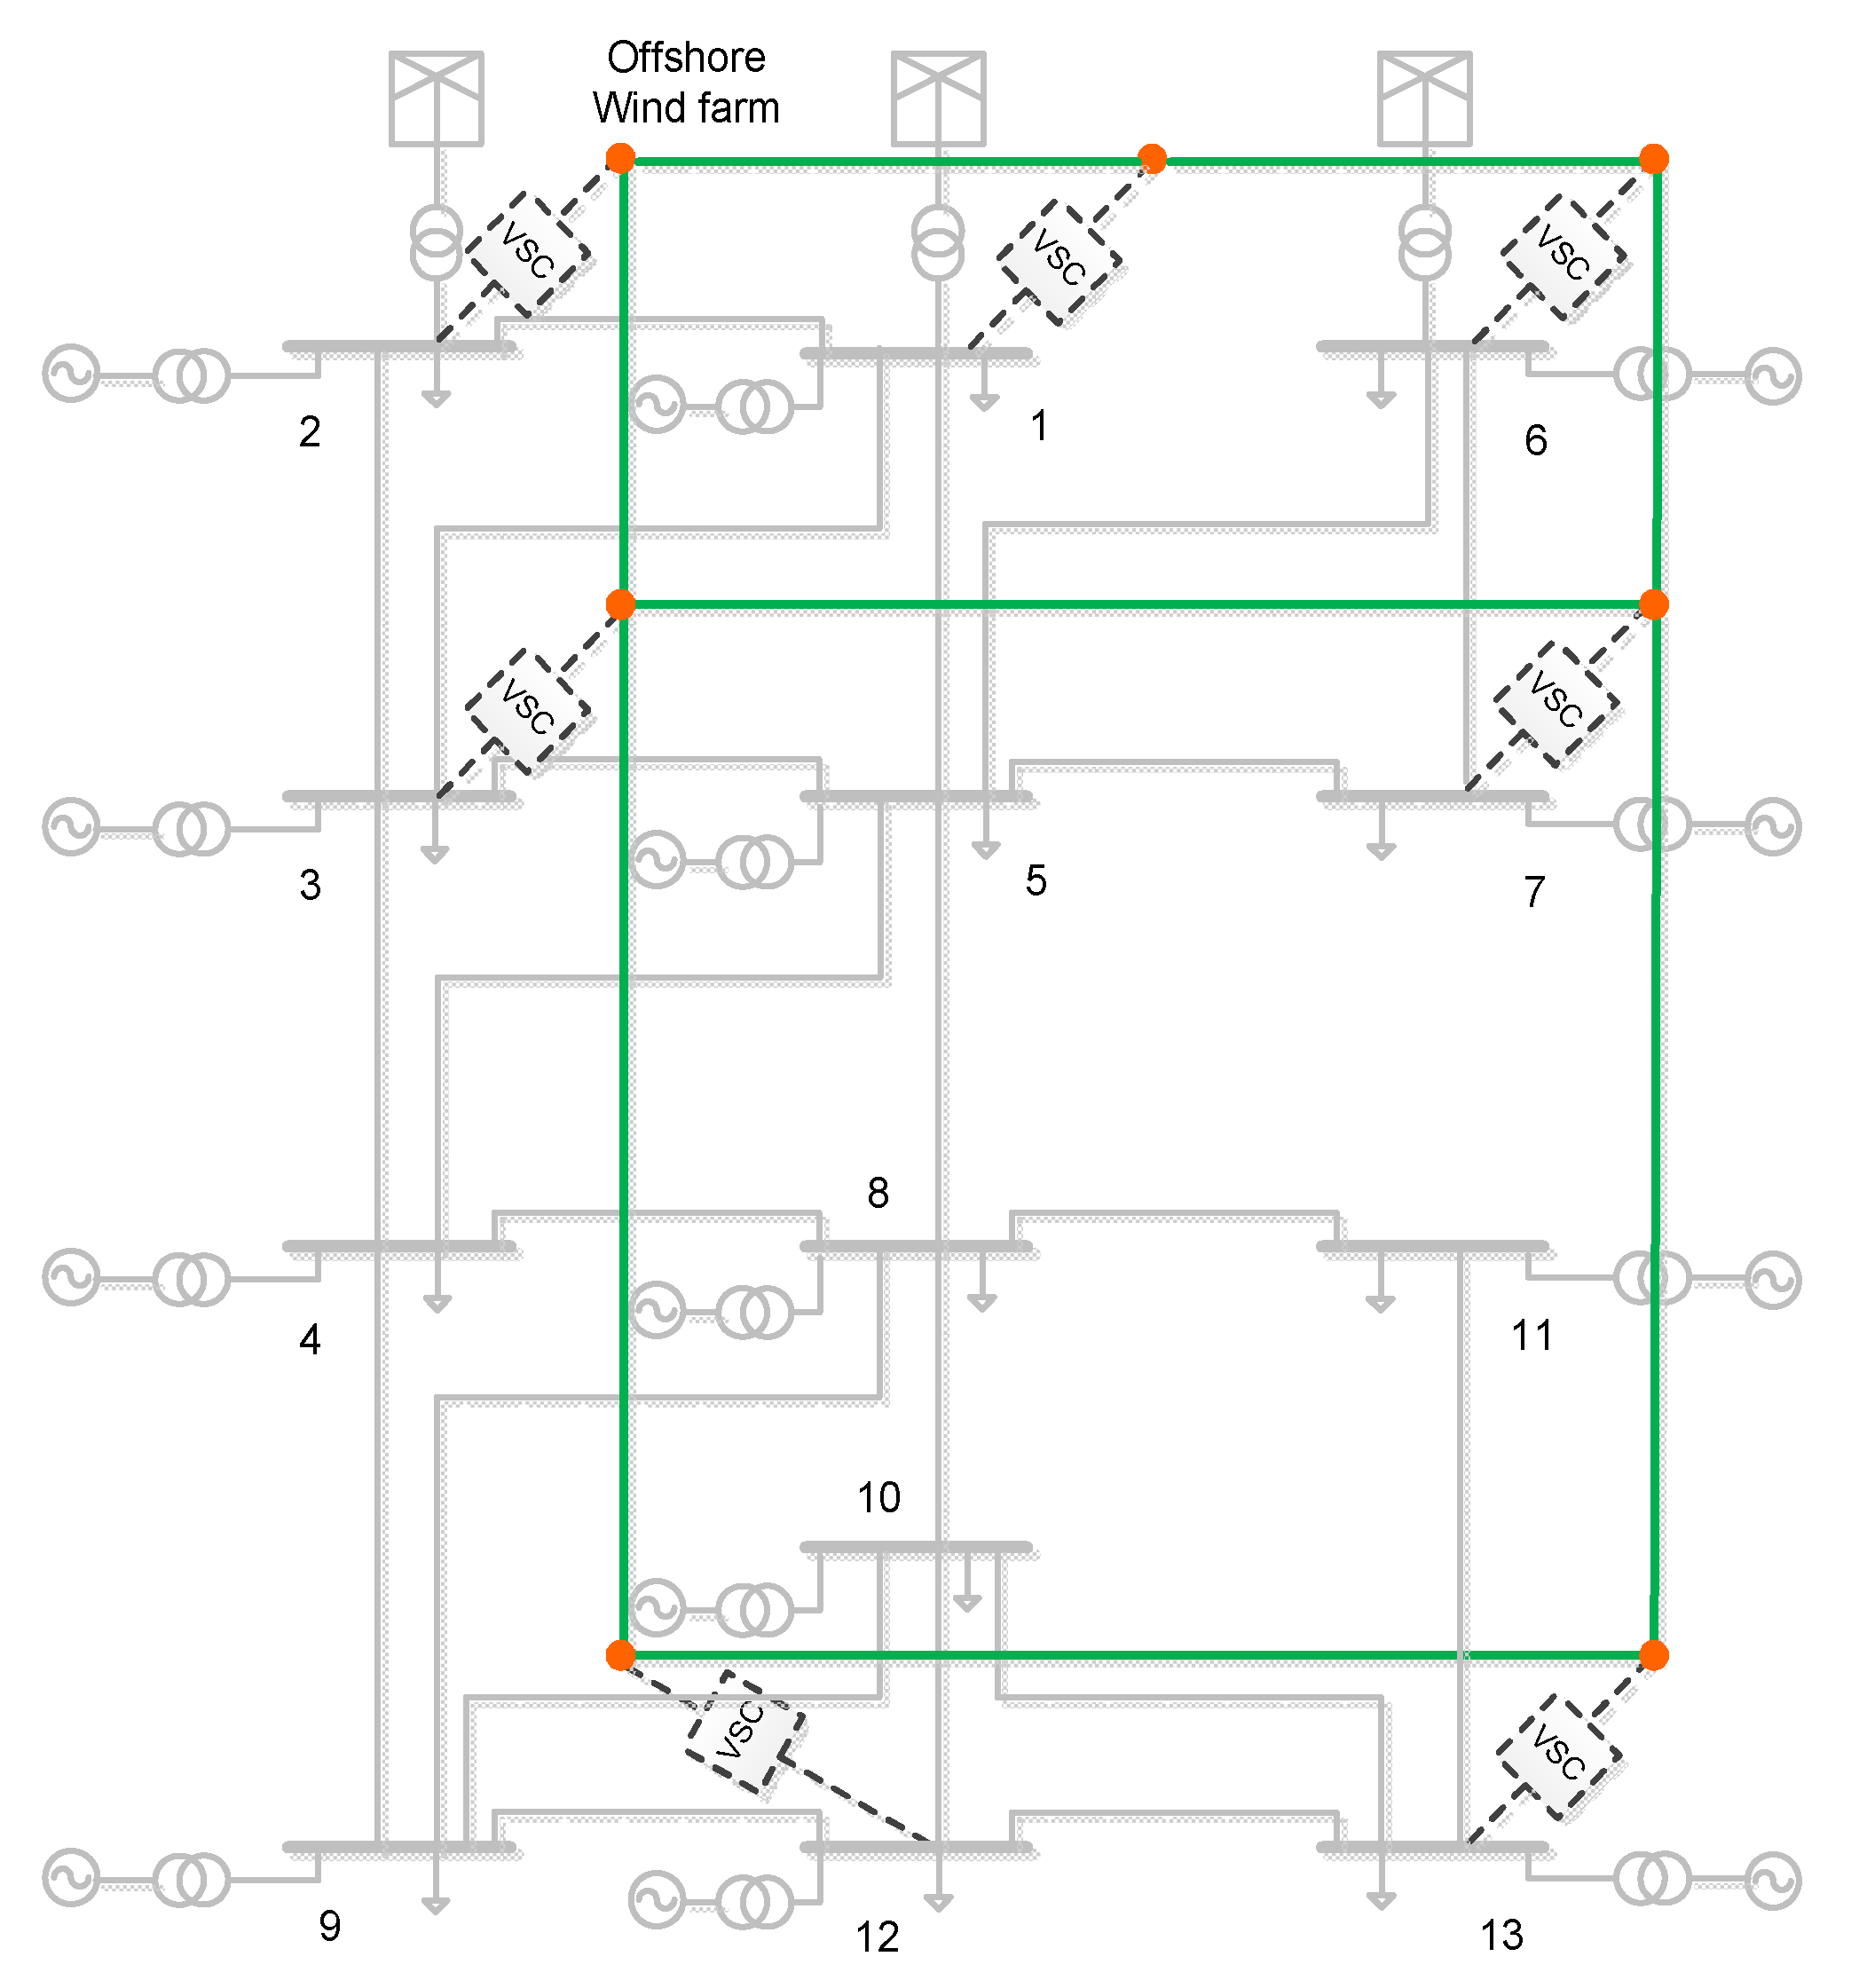
The configuration overview of the sample hybrid VSC-HVDC-AC network, as shown in
Figure 1, is used for analysis in this paper. This hybrid network is based on a reduced AC transmission network of Germany and is already presented in [
14,
15,
16]. The system is composed of an overlay of multi-VSC-HVDC links and a representative AC network based on the transmission network in Germany. The overlay VSC-HVDC grid represents the planned HVDC lines to transfer power from projected offshore wind farms in the north to heavy load centers in the south of Germany. More detail of the representative AC network is provided in
Appendix A,
Appendix B and
Appendix C. The represented hybrid AC-DC system is divided into regional AC grids, the overlay HVDC transmission grid, and three aggregated offshore wind farms in the north. Local loads and generating plants close together are grouped and considered as the regional load and generation sub-networks, respectively. The HVDC lines are underground cables. This system was built in PSCAD. It is composed of an overlay multi-VSC-HVDC including 7 VSC stations and 7 HVDC links, with the voltage level of 800 kV, 13 aggregated generators representing 13 regional AC generation grids, 3 aggregated wind farms, 16 transformers connecting with 13 generators and 3 wind farms, and 22 AC transmission lines with the voltage level of 380 kV. In order to consider dynamic behaviors of the AC network, synchronous generators, and AC transmission line with PI-models, the static loads and dynamic loads are adopted to model the AC network.
Table A3 and
Table A4 in the Appendix list the main parameters of the AC network. Detailed modeling of subgroup units is described as follows.
2.1. Model of The VSC-HVDC System
This section describes an overview of the main components of the VSC system and the average model.
2.1.1. Main Components of the VSC-HVDC System
The typical configuration of a VSC-HVDC is depicted in
Figure 2. Main components of the VSC-HVDC include AC filters, transformers, coupling reactors, DC cables, DC capacitors, two three-phase VSCs, and their control systems. Transformers are normally used to transform the AC voltage to a proper level for the converters. Coupling reactors are used to control currents through them in order to control active and reactive flows. AC filters are employed to prevent harmonics caused by the switching of converters. DC cables are taken from [
17]. DC capacitors are required to keep the power balance during transients and reduce the voltage ripple on the DC side and their size should be properly designed [
18,
19]. The two-level VSC and its average model are employed in this study.
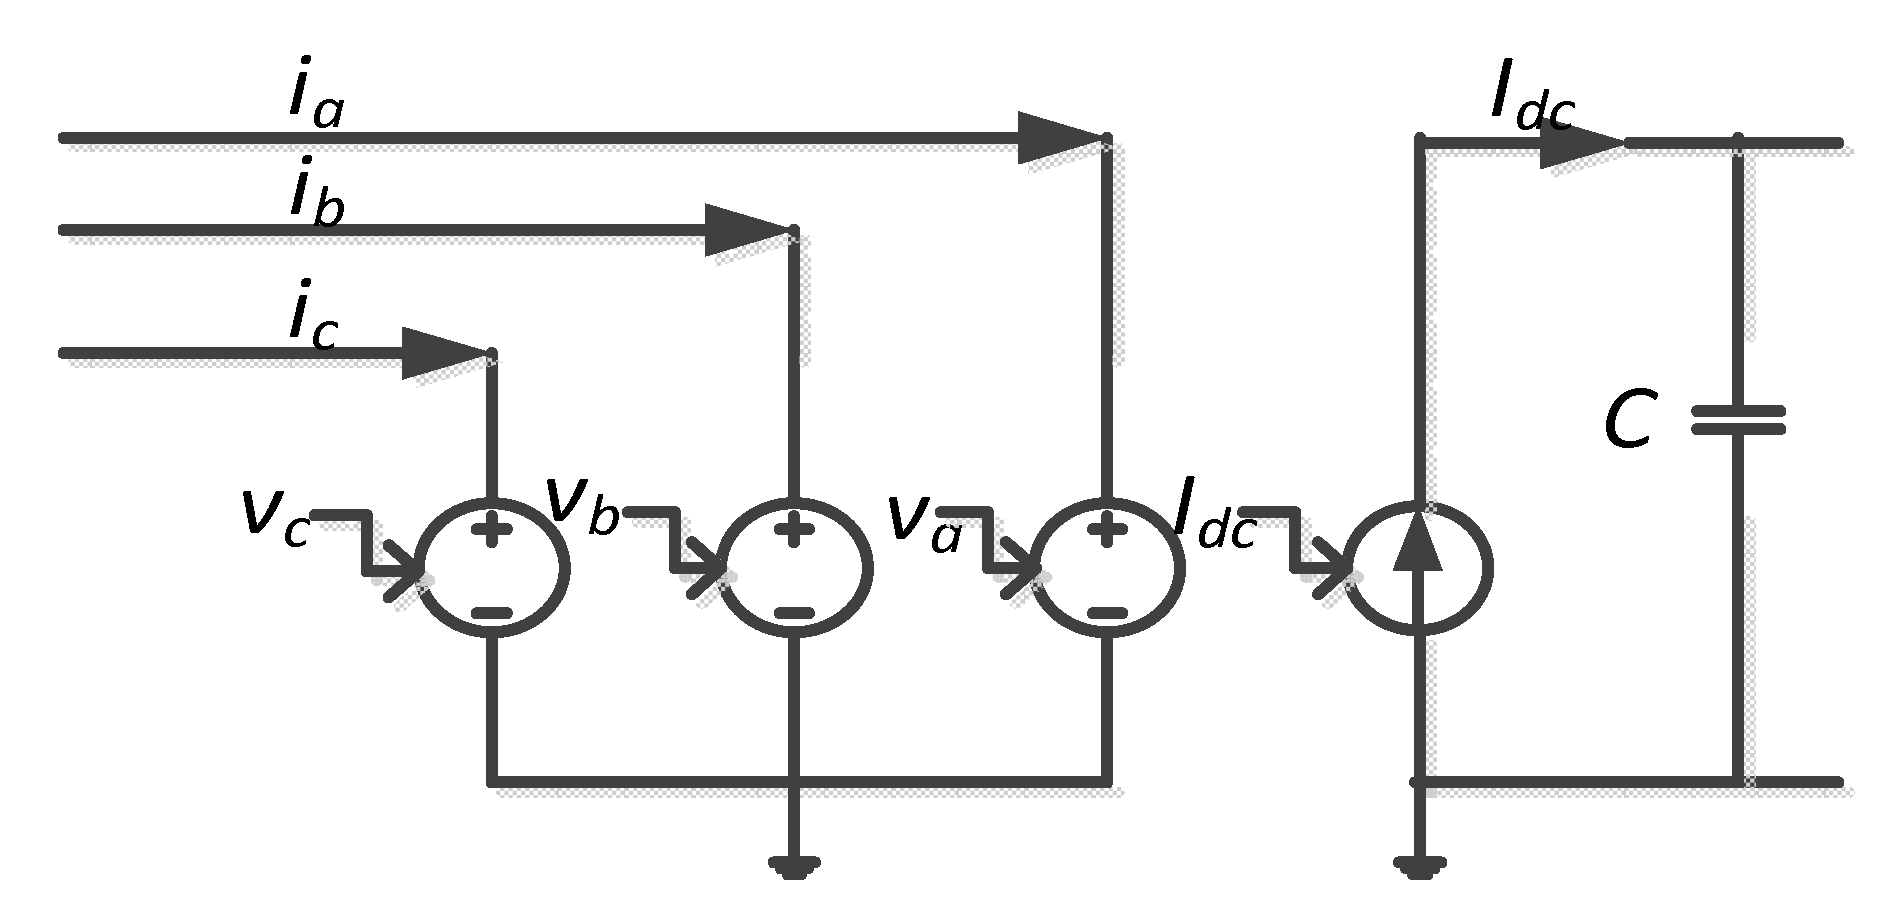
Figure 2 shows a schematic diagram of a controlled-frequency VSC system whose kernel is a current-controlled VSC [
20]. The VSC system can be considered as the composition of an ideal VSC, an equivalent DC-bus capacitor, and a DC voltage source which represents the DC transmission system. In the VSC system, each phase of the VSC AC-side terminals is interfaced with a regional AC subsystem via an interface AC filter. The AC filter includes a resistor in series with inductor and a shunt capacitor with capacitance C
f. The filter provides a low-impedance path for switching current harmonics generated by the VSC and thus prevents them from penetrating into the AC subsystem. The current-controlled VSC and the filter capacitor deliver the real and reactive power (
Ps,
Qs) and (0,
Qc), respectively. Therefore, the effective power output of the VSC system exchanged to the AC network is (
Ps,
Qs +
Qc).
Vt,abc and
Vsabc are the AC voltages at the terminal and PCC respectively,
iL,abc are the current flowing to the AC network,
ron denotes the switch on-state resistance of VSC, while R and L are resistance and inductance at AC side of VSC, and
ρ is the output of PLL.
2.1.2. The Average Model of the VSC System
There are several representations of the hybrid AC-DC for the purpose of modeling and control system. Of those choices, representation of the AC system in the
dq0 coordination system facilitates the control. In comparison with
abc-frame control, the
dq0 control reduces the number of plants to be controlled from three to two. Furthermore, instantaneous decoupled control of active and reactive power, which is exchanged between the VSC system and the AC system, can be implemented. Additionally, one of the merits of the
dq0 control is that the control variables are DC quantities in steady state so that zero steady-state error is readily achieved [
21]. This advantage is important for compensator design, especially in cases that frequency can change.
where
mj is achieved from the
dq0-abc transformation of the reference voltage,
Vctrol. Neglecting losses in the VSC system, as seen in
Figure 3, the power balance between the DC and AC side is written as:
From (1) and (2), the controlled current on the DC side can be determined as:
Otherwise, the controlled current on the DC side can be derived in the
dq0 frame. The real and reactive power exchanged to the AC subsystem at the PCC (the point of common coupling) are determined as:
where
Vsd and
Vsq are the AC system
dq0 frame voltages. As a consequence, the controlled current on the DC side can be computed as:
DC filters and measurement filters are not taken into account in the average model.
2.2. Model of the AC System
The AC side includes regional AC subsystems and offshore wind farms. The regional generation subsystems are represented by the aggregated synchronous generators [
22]. Aggregated offshore wind farms are modeled as in [
22]. For the problem of voltage stability analysis, the static loads and dynamic loads are modeled in order to consider dynamic responses. Main parameters of the test case AC grid are provided in the
Table A2,
Table A3, and
Table A4 in the Appendix.
2.2.1. Model of Synchronous Generator
The synchronous generator consists of an excitation system and a turbine system. The model of the excitation system adopts the IEEE V2 Compatible Solid-State Exciter (SCRX19) [
23,
24,
25,
26]. The output field voltage is regulated by a control scheme to keep the voltage of the system unchanged at
Vref. The nomenclature in the block diagram of the exciter system, shown in
Figure 4, is as follows:
Vref: The reference voltage in per-unit, which the exciter acts to control.
If: The field current received from the machine in per-unit. It applies to the negative current logic.
Vabc: Receives input from the node loop component.
Exst: Input to modify Vref and is suitable for connecting a power system stabilizer.
Ef: This output is the computed field voltage applied directly to the synchronous machine. The V2 compatible hydro-governor model [
23,
24] is used in this study. Inputs of the model include the reference speed (SP), mechanical torque from the machine (T
m0), and machine rotor speed (w). The output is the mechanical torque (T
m). It is also noted that the ability of regulating the terminal voltage is limited by the capacity of generating the reactive power margin. In the studied system, the power factor of the generator is kept at 0.85.
2.2.2. Model of Components in AC Side
To consider dynamic behavior of loads, static loads and induction motors are used.
The static loads are represented by the exponential load model, which can be expressed as follows:
where
P and
Q are the equivalent active and reactive power of the load when the bus voltage magnitude is
V,
P0 and
Q0 are rated active and reactive power of the load at the voltage magnitude of
V0, and
NP,
NQ,
KPF, and
KQF denote the characteristics of the load with voltage and frequency respectively, which can be typically chosen as
NP =
NQ = 2.0,
KPF = 1,
KQF = −1.
AC transmission lines are modeled as a Pi-model. Parameters R, L, and C of AC lines are lumped and listed in
Table A3. A model of a 3-phase, 2-winding transformer is used in this study based on the classical modeling approach [
27].
2.3. Model of HVDC Transmission Lines
Underground DC cables should be used for DC transmission lines because of reasons coming from technical and public opinion aspects [
28]. The model of DC transmission lines derived in the study is represented as a π model. Each DC cable is denoted by a number of π models in series depending on its distance, as shown in
Figure 5. The acceptable number of these pi sections will be investigated and determined.
Figure 6 depicts the comparison of the impedance spectra of the Pi-model with the distributed model of 800 kV, 500 km-long cable. It is obviously noted that more pi sections will give better results but have more computational burden. It is shown that with four pi-sections, a close approximation of DC transmission lines is considered adequate.
2.4. Model of Wind Farms
Figure 7 describes the configuration of an aggregated wind farm [
22]. PMSG is used in this study. Wind farm includes a block of wind speed model, wind turbine, wind generator, three-phase transformer, as well as the control system. Detailed modeling of wind farms is derived from previous publications [
14,
15,
16,
22]. Modeling of wind farms is briefly introduced in
Appendix B.
3. A Novel Adaptive Control for the Multi-VSC-HVDC System
In this section, the control method of a multi VSC-HVDC is presented and analyzed. The control scheme applied to one VSC-HVDC as well as the coordinate control strategy for a multi-terminal VSC-HVDC system is introduced.
The control system of the VSC system shown in
Figure 8 can be classified into an outer control loop, an inner control loop, and a phase-locked loop (PLL). The outer controller is designed to provide the reference currents for the inner controller. The inner controller regulates the currents, keeping track of reference currents, and also decouples the d- and q-axes in order to control active and reactive currents independently. The function of PLL is to regulate the
ω(t) for synchronization with the AC system voltage. Since the scope of this research focuses on the control system of the VSC-HVDC, the aforementioned main control loops will be discussed in the following subsections.
3.1. The Inner Control Loop
One of the purposes of the control system is to regulate the instantaneous real and reactive power at the PCC (
Ps(
t) and
Qs(
t)). Normally, there are two methods to achieve this goal [
21]. The first method, deployed mainly in flexible alternating current transmission systems’ (FACTS) controllers, is the voltage-mode control approach [
29,
30]. In this way, the real and reactive power are regulated by the relationship between the magnitude and the phase of the VSC AC side terminal voltage and that of the PCC voltage [
31]. The merit of this method is that it is simple and has a low number of control loops [
30]. However, since the VSC line current is not directly controlled, the VSC cannot be protected against over-currents, especially when there is a fault in the AC network. To overcome this demerit, the second method, which is called “current-mode control”, forces the VSC AC side current to be controlled, as shown in
Figure 9. In this control scheme, the amplitude and phase of the VSC line current with respect to the PCC voltage are used to control both active and reactive power. Furthermore, the current-mode control method provides robustness against variations in parameters of the VSC as well as the AC system, better dynamic performance, and higher control precision than the first approach [
32].
Figure 9 depicts the control system diagram of the VSC based on the second method in
dq0 frame. A decoupling control is employed to control active current and reactive current independently. A conventional PI controller is used, where an integral part is necessary to avoid a steady-state error. The resulting control equations are written as follows. The list of the symbols can be found in the list of nomenclature at the end of the manuscript.
3.2. The Outer Control Loop
The aim of the outer control loop is to generate the current references for the inner current control loop. Depending on the different control objectives, the active current reference can be achieved through either active power control loop or DC voltage control loop. In the VSC-HVDC link, one VSC is to control active power, while the other one is to control DC voltage. The reactive current reference can be obtained from either reactive power or AC voltage control loop depending on the strength of the AC system that connects to the VSC-HVDC link.
In the steady state, thanks to the PLL
Vsq = 0, therefore, Equations (4) and (5) can be rewritten as:
Based on Equations (17) and (18), it is obvious that active and reactive power can be controlled by
id and
iq, respectively. Therefore, the reference currents for the inner controller can be determined as:
where
id,
iq, and
Vd,
Vq are the currents and voltages at the AC grid side in the
d-axis and
q-axis, respectively.
It is also noted that in the current-mode control approach, the DC voltage should be constant, thus the VSC system exists as a bidirectional power flow path between the AC side and the DC side. Yet, in this study, the DC bus voltage varies during disturbance, and therefore, it needs to be controlled. Consequently, it is important to develop the control system taking into account both the active and DC bus voltage control, as shown in
Figure 10. From the literature, DC bus voltage control can be broadly divided into two categories, namely, the master-slave and DC droop control [
33]. The main disadvantage of the former is that operation of the DC network as well as the hybrid AC/DC system relies on the normal operating condition of the VSC controlling DC voltage. This leads to immediate outage of the system when the VSC responsible for controlling DC bus voltage is disconnected. The latter should use more than one VSC system to control the DC bus voltages, which has been presented in several publications [
34,
35,
36,
37,
38]. Hence, when a disconnection of one VSC in the droop control scheme occurs, the remaining part of the system will continue to function normally. Thus, the reliability of the system is improved. For these reasons, the DC droop control scheme is used for the multi-VSC-HVDC systems in this study.
When a disturbance occurs in the AC system, for instance a three-phase short circuit, which results in large changes of the voltage at the PCC of the AC system, the objective of the control system is to control the amplitude subsystem voltage,
Vs,abc. Additionally,
Vsd and
Vsq in
dq0 frame can be controlled in order to regulate the amplitude of the AC voltage. The control scheme applied for the VSC is presented in
Figure 11, in which
Vsd and
Vsq can be regulated by
idref and
iqref, respectively.
The inner control loop is the current-mode controller that is already presented in the previous section, shown in
Figure 9. The additional equations describing the outer control loop are as follows:
3.3. The PLL
The function of PLL is to regulate
ω(t) for synchronization with the AC system voltage [
39]. The PLL employs a negative feedback control system that regulates
ρ at (
ω0t +
θ0) and is composed of three main components: the error signal calculator, the compensator, and the voltage-controlled oscillator (VCO). The control system diagram of the PLL is depicted in
Figure 12. The equation describing the PLL can be expressed as follows:
In (26), H(p) is a transfer function and the limitations of ω(t) should be chosen properly to allow excursions of ω(t) during transients.
3.4. Concept of Adaptive Current Controller
It is obligatory to have a current limiter for VSC in order to protect over-current fault. A current limiter will keep reference active and reactive currents determined by the outer control loop in permitted ranges and provide for the inner control loop, as shown in
Figure 13. The maximum reference current limit of the VSC can be expressed as:
where
Klim is the parameter that reflects the ability of the VSC for the over-current trip (usually selected as 1.5 [
40]), and
irated is the nominal current of VSC. The limit current is composed of two components in
dq0 frame: an active current limit and a reactive current limit, which can be defined as:
where
idlim and
iqlim are limit values of active and reactive currents, and their values are determined by different control schemes. In [
12], limit values of reactive currents are changed based on operation modes of the system as well as specific applications.
For the conventional control strategies, fixed or preset values of the limit current of VSC are typically calculated according to control modes, and it does not consider the actual capacity and hence the available capacity amount of VSCs for stabilizing the AC voltage during transients caused by different kinds of contingency. In our study, the current controller margins of the VSC, namely
idlim and
iqlim, will be automatically changed according to dynamic frequency of the AC system, which will be expressed in the following paragraph, as shown in
Figure 13. It is seen in
Figure 14 that there are several current limit values depending on different operation schemes of the VSC-HVDC, as follows:
In a conventional control scheme, the current limit of VSC is chosen at the point C corresponding to the steady-state point S. In this control scheme, the available headroom of VSC for reactive power support is denoted by AR
C, as seen in
Figure 14.
In our proposed adaptive control system, the current limit is dynamically adjusted within the range from point C to point A, depending on the real-time frequency of the AC system. If the real-time frequency is equal to the required minimum frequency (determined by the grid code), the current limit is at point B according to the available headroom of VSC, denoted by ARB. In realistic operation scenarios of the grid, the AC frequency can be higher, which can lead to the available headroom of VSC for reactive power support, ARD. As a result, the proposed adaptive controller can maximally utilize the available headroom of VSC for the highest reactive power support.
It is noted that in order to transfer desired active power in steady-state operation, the lower limit of the active current must be at least equal to the nominated active current. Therefore, in the conventional control method, the upper limit of the reactive current in such traditional control strategies can be calculated as:
With the different operation strategies, the current reference limits are set at different set-points, as depicted in
Figure 13, which provides the different current controller margins of the VSC. Consequently, it can be concluded that with existing control methods, the reactive current limit of the VSC is pre-fixed, which restricts the enhancement of the voltage support during sudden faults of the system. Therefore, it is essential to develop a control approach so that the voltage stability is automatically improved within the capacity of VSC.
3.5. Dynamic Reactive Power Booster
From the above analysis, in order to exhaust the capacity of VSC to enhance the voltage support under voltage drops, instead of fixing limit values of the reference current, an adaptive control method applied to the VSC-HVDC is proposed, as shown in
Figure 13, and it allows to automatically regulate the limits according to the dynamics change of the frequency during severe faults. This proposed control scheme is composed of an outer control loop, an inner current controller, and an adaptive current controller for automatically achieving maximum reactive power support while ensuring to not make the change of the frequency worse during voltage drops and the outer control loop. This control approach can be called a dynamic reactive power booster.
The core concept is based on available headroom of VSC in order to automatically change the limits of the reactive current reference in order to increase voltage support while ensuring minimal effect on the frequency under unexpected operation conditions of the system. The dynamic reactive power booster can be described as follows.
First, the limits of the reference reactive current are calculated according to dynamic changes of the frequency (the realistic condition of the system), as:
Second, the reference reactive current can be determined as:
Finally, the reference active current can be derived as:
where
id_comp can be determined as:
where
id0,
iqo are provided by the outer control loop,
idref,
iqref are the actual reference current signal determined by the dynamic reactive power booster,
ilim is the maximum permitted current of VSC,
idlim is the lower permitted value of the active current,
iq_max is the dynamic limit of the reactive limiter, and
id_comp is the signal which will be compared with
id0.
Kf is the parameter depending on the system and it should be properly chosen.
The selection of the parameter
Kf can be basically determined as follows:
where
is the maximum active power that the system can generate in primary control,
and
are generated active power and nominal frequency of the system in steady state,
is the permitted minimum frequency of the system, and
Vsd is the d-axis AC voltage of the system connected to VSC.
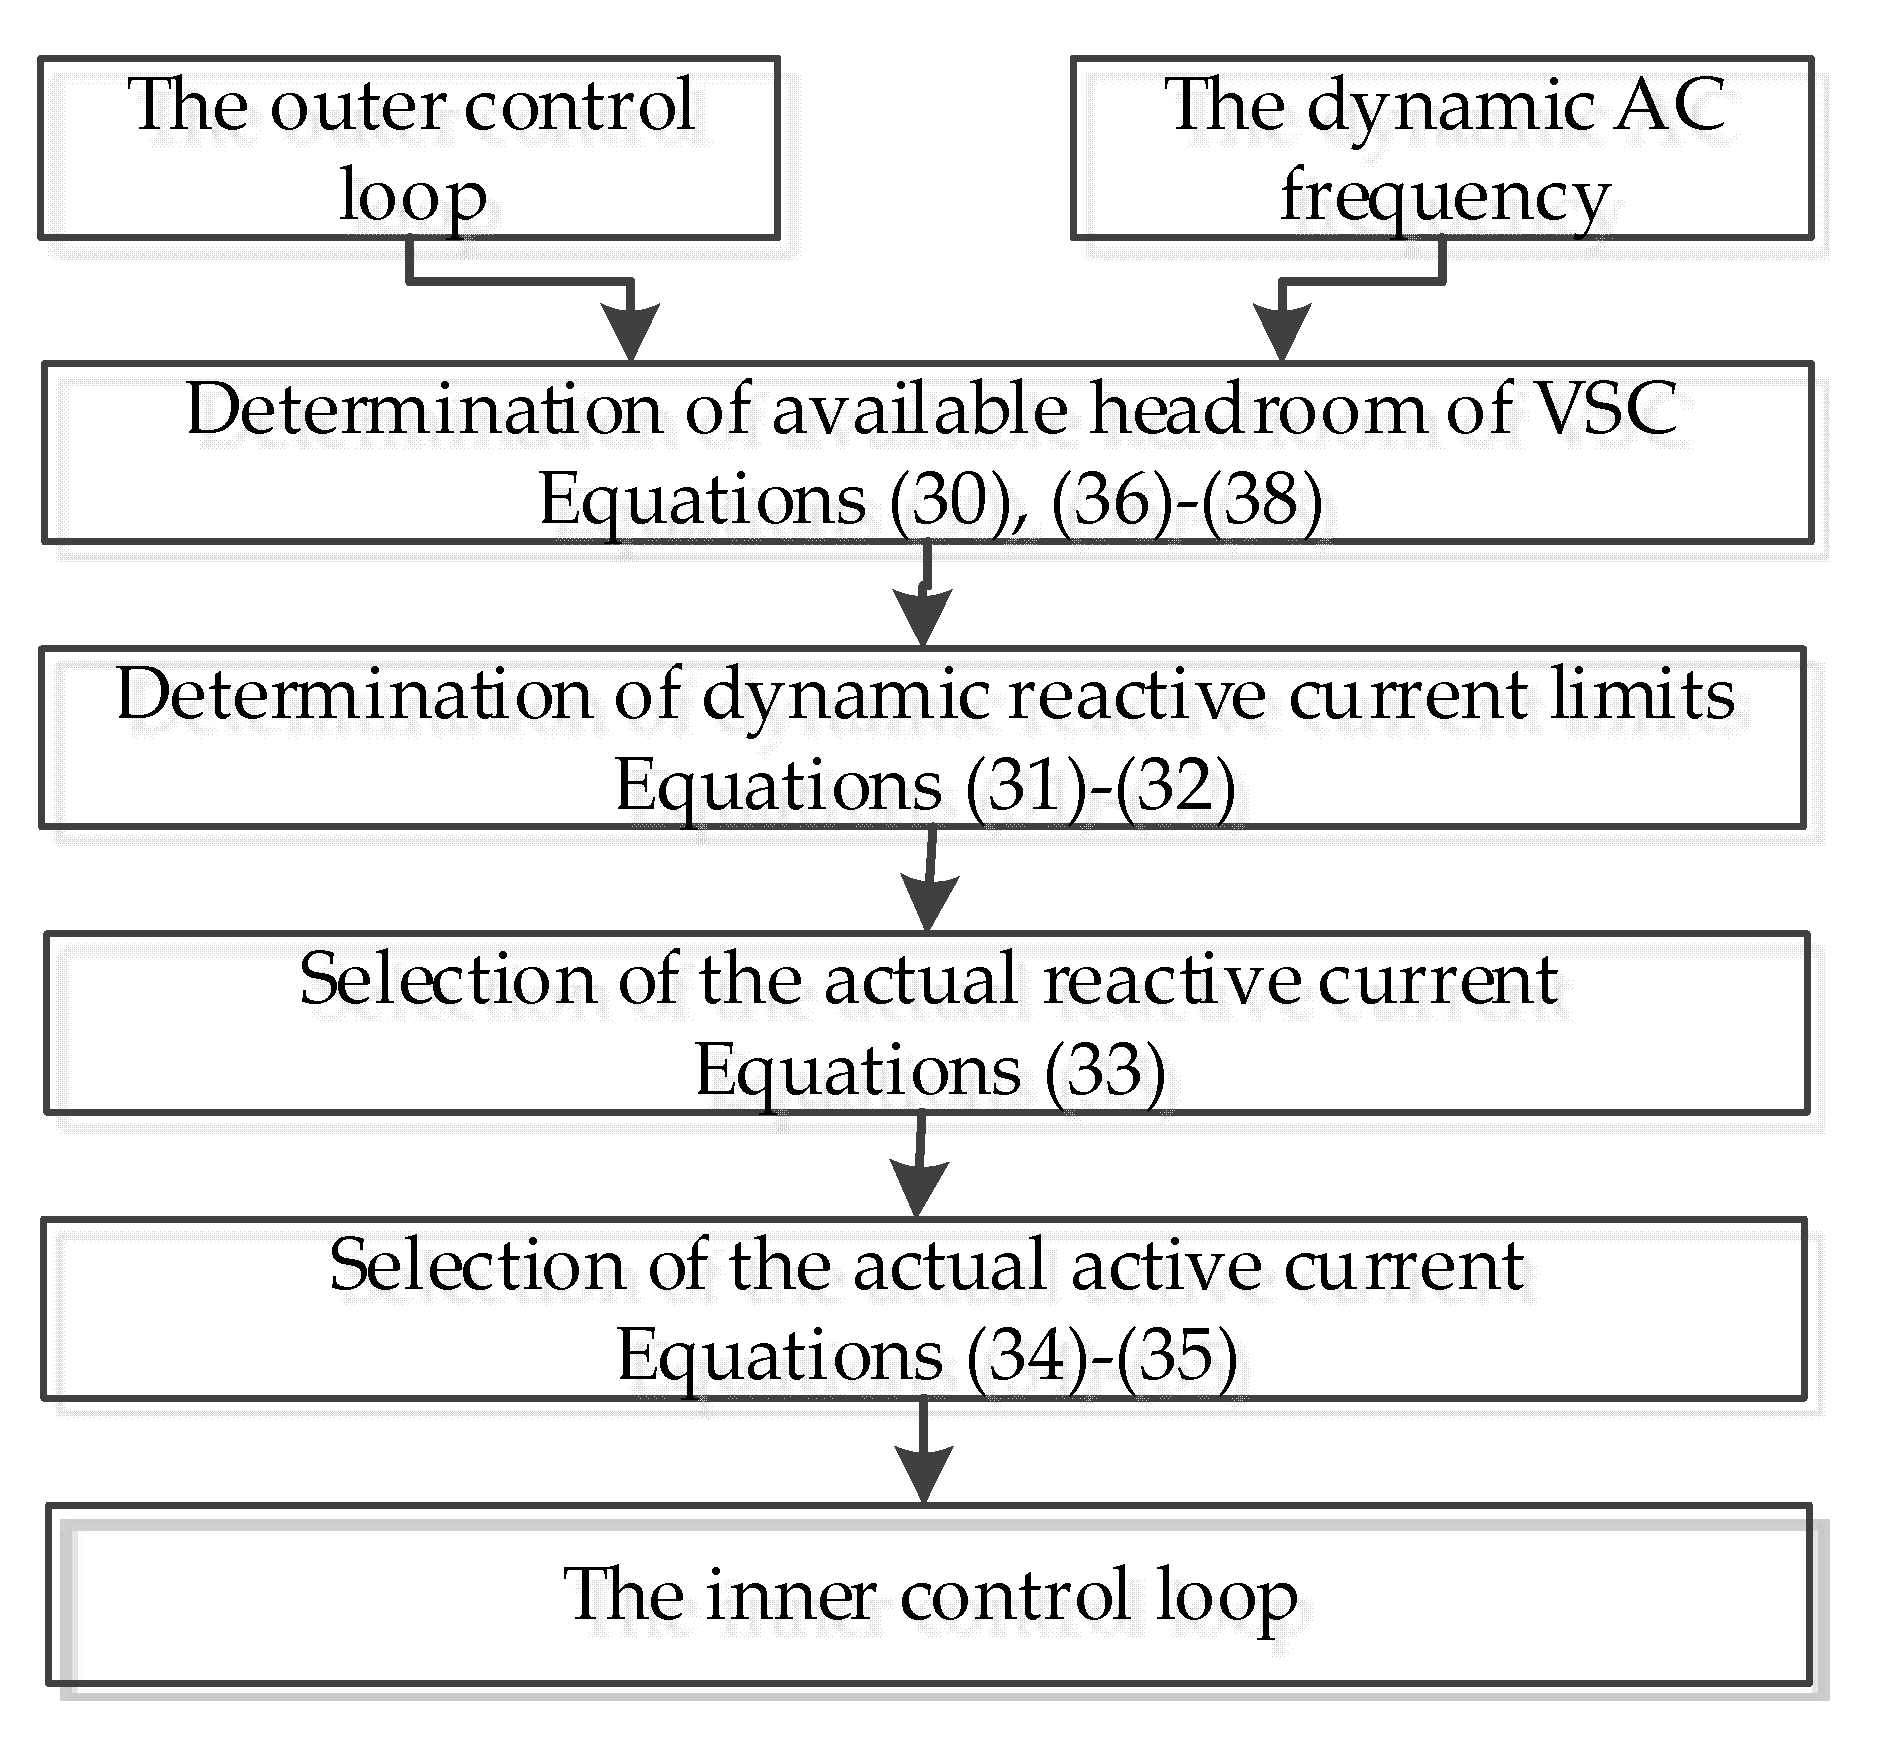
The flow chart algorithm of this proposed dynamic reactive power booster based on available headroom of VSC is shown in
Figure 15.
It is worth noting that with pre-fixed values of current limits, the reference reactive current must be lower than 1.12
irated, as discussed in
Section 3.4. In contrast, with the proposed dynamic reactive power booster, the reference reactive current can reach up to
ilim (here it is chosen as 1.5
irated). The dynamic reactive power booster automatically generates the limits according to the realistic dynamics condition of the system.
3.6. Feasibility Analysis of the Proposed Dynamic Reactive Power Applied to the Multi-VSC-HVDC System
It is important to mention that with the proposed dynamic reactive power booster, the reference active current is dynamically regulated according to the change of the frequency in order to realize maximum voltage support. Therefore, it is necessary to evaluate the AC network response when applying this proposed method. It is possible to further reduce the suppled active power to increase the available headroom of VSC for reactive power support if the frequency of the system is still within the permitted lower limit. Thus, the frequency is not worse when applying the proposed control method.
Furthermore, since the required active power of load deceases during AC voltage drops, the supplied active power of VSC can be reduced. Hence, available headroom of VSC for reactive power can significantly increase. Moreover, the inertia energy in the AC network can help to maintain the frequency within a reasonable limit. Consequently, this dynamic reactive power booster will not lead to larger deviation of the frequency nor cause instability of frequency.
Since this adaptive control scheme does not require a communication system, it can individually work locally and automatically but still globally support the problem of voltage stability. In addition, this approach does not change the specific control strategies applied to VSC-HVDC in normal conditions, it only modifies the existing control schemes by adding a so-called dynamic reactive power booster, as shown in
Figure 15.
4. Simulation Results and Discussion
In this section, several time domain simulations with different test cases will be implemented in order to realize the effective performance of the proposed method. In addition, investigation of small signal stability will be analyzed to study the effects of the adaptive control approach on small signal stability of the system. The more realistic study network shown in
Figure 1 is built and simulated in PSCAD/EMTDC. The parameters of the system are listed in the Appendix, in
Table A1,
Table A2,
Table A3,
Table A4,
Table A5,
Table A6,
Table A7 and
Table A8.
4.1. Investigation of Small Signal Stability
In order to investigate the effects of the adaptive control method on the stability of the system, it is necessary to first linearize the nonlinear models such as WECS, AC sub-grids, and VSC-HVDC including the adaptive control before analysis. The small signal model of the hybrid AC-DC system is taken from [
16] and forms a state model with the 110th order. The parameters of the system are listed in
Appendix C. In normal operation, one of its objectives is to transfer a total of 18 GW from offshore wind power parks in the north to load centers in the south. The total load of the system is 24 GW, and the rest of the demand is supplied by synchronous generators. It is assumed that small disturbances occur when a pulse change is applied to
Pref of the converter 1. Different control strategies applied for VSC, including the master-slave, the DC voltage droop control, and AC voltage control, are studied.
The state equations of the system in
Figure 1 can be properly written in matrix form as in (39), and the output of the system is defined as in Equation (40):
Linearizing the state equations of the system, including the proposed method around the steady-state operating point, the small-signal model of the system can be defined as follows:
where
,
and
, and where the subscript “s” denotes the steady-state values and matrix
A,
B,
C,
D are defined as:
;
;
;
. Based on matrix
A,
B,
C,
D, the eigenvalues of the system can be calculated. The characteristic equation of
A is defined as:
where
I is an identity matrix of appropriate dimensions and λ is the system eigenvalues of the matrix A.
As VSC systems are extremely fast-response power electronic devices, therefore, their control parameters must be appropriately chosen in a great effort to improve the stability of the system. The eigenvalue analysis is performed to study the impact of the control parameters on the stability. The majority of the eigenvalues are associated with VSC subsystems, as shown in
Figure 16a. Some dominant eigenvalues in per-unit with respect to 50 Hz are listed in
Table 1.
Figure 16c describes the change of direction of the eigenvalues with the change of the gain of the DC voltage controller
Kpa. The gain of the DC voltage controller in the outer loop
Kpa is increased from 3 to 30. It can be seen in
Figure 16c that the higher
Kpa will result in higher frequency oscillations in transients as well as a decrease the margin of the stability. It is also noted that when
Kpa is larger than 52, there are some eigenvalues moving into the right side of the plane, making the system unstable.
In order to see the influence of the DC voltage control method on the stability, an eigenvalue analysis of the performance of the two control schemes was carried out. The first control scheme is the master-slave DC voltage control (only one VSC connected to node 1 control DC voltage), and the other method is the DC voltage droop control. It is shown in
Figure 16d that the magnitude of eigenvalues in the imaginary axis increases in the second scheme, while the magnitude of eigenvalues in the real axis decreases only slightly. This means that the stability margin of the system in the second control method is better than that of the first method. Additionally, with the DC voltage droop control, the reliability of the system is improved. In conclusion, the second strategy performs fast, with very low overshot, and it is superior to the first strategy.
The disturbance is seen as a 10% decrease of the AC voltage at the PCC 4. On the condition of other system parameters remaining unchanged, the gain of the AC voltage controller
Kpa is increased from K
0 to 50 K
0 (
Kpa = 2.6 × 10
−4). It is shown in
Figure 17 that when the gain of the AC voltage controller increases, some eigenvalues will move close to the imaginary axis. Therefore, the stability margin of the system will be reduced. When
Kpa = 60 K
0 (equal to 0.0157), some eigenvalues are at the right side of the imaginary axis, thus the system would be unstable, as shown in
Figure 17b.
4.2. Verification of the Proposed Dynamic Reactive Power Booster in Voltage Support
Case study: Three-phase-to-ground fault at the transmission line between bus 12 and bus 13.
A three-phase-to-ground fault at the transmission line between bus 12 and bus 13 is applied at a time of 20 s and is cleared by CB1 and CB2 0.1 s later. A reclosure is carried out at 20.7 s. This case study is performed in order to investigate one of the most stressed faults causing the deep drop of AC voltage.
The initial operating conditions of the system are assumed as follows:
The aggregated synchronous generators generate 0.85 p.u. active power to the transmission grid.
The terminal voltage magnitudes of generators are set as 1.05 p.u.
The aggregated wind farms supply 0.8 p.u. active power rating to the system.
The VSC-HVDC transfers 0.8 p.u. active power to the AC network.
The maximum current of VSC is set at 1.5 times the nominated current.
The conventional method is operated according to the point “C” control scheme, as shown in
Figure 13.
The AC transmission lines 10–13 and 11–13 reach near limits on transferring power.
The induction motor represented for dynamic loads is connected to bus 13.
It is noted that voltage stability problems are closely related to load characteristics that rely on the characteristics of load and operating induction motors and are heavily sensitive to varied voltages. Thus, induction motors are typically used for voltage stability analysis.
Simulation results show the comparison between the proposed dynamic power booster approach and the conventional control method operating at point C, as seen in
Figure 13.
Figure 18 shows the transients of the system in case of a three-phase-to-ground fault occurring at the AC transmission link from bus 12 to bus 13. It is seen in
Figure 18a that the voltage at bus 13 drops to nearly zero after the fault happens. The rotor speed of the induction motor decreases because of the mismatch between the electromagnetic torque and the mechanical torque, as shown in
Figure 18c. It is noted that the capacity of the VSC connected to node 13 will reduce significantly when the AC voltage at bus 13 drops.
Figure 18e shows the dynamics of the active power supplied by the VSC connecting bus 13 with different control strategies.
Figure 18f demonstrates the effective reactive power support of the VSC thanks to the dynamic reactive power booster. It is realized that with the proposed dynamic reactive power booster, the reference reactive current limit is varied automatically, according the dynamics of the system frequency. It can be seen that the system frequency is in the range of its limits, as shown in
Figure 18d. Consequently, utilization of the VSC’s capacity is implemented to maximum AC voltage support, while at the same time ensuring the AC frequency within a permitted range. Hence, this control scheme can achieve both key objectives, as (1) improvement of the voltage stability based on available headroom of its VSC and (2) keeping the angle stability in reasonable consideration.
When the fault is cleared at a time of 20.1 s, the voltage begins to bounce back. It is obviously seen that in comparison with the conventional control method, the voltage recovery is better than with the proposed adaptive control method. Hence, the maximum reactive power support of the VSC can be achieved while ensuring not to make the system frequency worse. As a result, the dynamic reactive power booster scheme provides the best voltage recovery and prevents speed decrease of the induction motor, as shown in
Figure 18a,c.
4.3. Realization of the Proposed Control Method Following Faults
In order to realize the proposed control method following faults on the AC and DC sides and outages of VSCs, the following cases are simulated and analyzed:
Case 1: An outage of the generator 2
Case 2: An outage of the AC line 12 in the AC network
Case 3: An outage of the DC line 37
Case 4: An outage of the VSC 1
In simulation, the droop control scheme is applied for VSC-HVDC networks. VSC1, VSC2, and VSC3 systems are planned to transfer total offshore wind, 18 GW, in the north to VSC4, VSC5, VSC6, and VSC7. The reactive power control is set to zero. The control system of three aggregated offshore wind farms is used to extract wind energy under the MPPT scheme.
Figure 19 depicts the dynamics behavior of the system when a trip of generator 2 happens at time of 25 s. The dynamics of the system when a trip of AC line 12 occurs at a time of 25 s is shown in
Figure 20. It is seen that penetration of these trips into the DC grid is very small. From these simulation results, it is also shown that the VSC-HVDC acts as a network firewall against cascading disturbances happening in AC sides. This is achieved thanks to automatic reduction of current and power in the event of faults. It is also noted that in these cases, the dynamic reactive power booster is not activated because the actual reactive current still does not reach the dynamic limit value.
Figure 21 shows the transients of the system when a trip of DC line 37 happens at a time of 25 s, while
Figure 22 shows the transients when an outage of VSC
1 occurs by opening the AC-side breaker. It is seen that DC voltage first reduces in contrast to AC voltage at node 1 increasing due to a lack of active power from VSC
1. Then, DC voltages fully recover thanks to the droop control scheme. Oscillations are observed for all DC bus voltages.
5. Conclusions
In this work, the proposed adaptive control of a multi-VSC-HVDC network to realize maximum voltage support capacity of VSC while ensuring not to make the system frequency worse during severe faults was presented. As a consequence, the enhancement of the voltage stability by the VSC-HVDC network can be obtained. A VSC-HVDC link integrated into the AC system model has been developed based on the electric power transmission grid in south Germany. Several test cases, especially one of the most stressed faults: a three-phase short-circuit in the AC network, were simulated to verify the effective performance of the proposed dynamic reactive power booster scheme. Therefore, the proposed control method makes a contribution to improve the voltage stability of the system in comparison with the traditional control method. It was shown that the automatic utilization of the VSC capacity based on its available headroom for supplying the reactive power is especially essential during serious AC voltage falls to enhance the stability of the system. Furthermore, once the voltage recovery is achieved, the actual reactive current returns to the normal value quickly and the adaptive controller releases the control margin to the active current. After that, the operation of the VSC tracks back to the original operation point, and the output active and reactive power of VSC come back to the planed nominal values, as in the previous schedule. Nevertheless, once the severe fault happens, the output active power of VSC reduces while ensuring this reduction does not make the system frequency lower than the minimum acceptable value. Hence, the output reactive power of VSC increases to support voltage under voltage drops. Therefore, the proposed adaptive control method does not impose further problems involving the frequency stability of the system. Last but not least, the dynamic reactive power booster applied to the multi-VSC-HVDC system can work locally but also support global problems of the AC system integrated to the multi-VSC-HVDC system.


