Abstract
China recently implemented a “Green Mine” policy focused on promoting the filling method, aiming to mitigate the environmental impacts of underground mining; nevertheless, quantitative inventories have rarely been provided to support or negate such promotion, especially from a life-cycle perspective. Accordingly, this paper proposes a bottom-up model for estimating life-cycle greenhouse gas (GHG) emissions from underground metal mines using either filling or caving methods. Two filling-based (Luohe and Longtangyan) and two caving-based (Maogong and Xiaowanggou) iron mines were studied; their direct GHG emissions were 0.576, 0.278, 2.130, and 1.425 tons of carbon dioxide equivalent per kiloton-extracted ore (t CO2 eq/kt), respectively. When indirect GHG emissions were considered, the results increased to 17.386, 15.211, 5.554, and 5.602 t CO2 eq/kt, respectively. In contrast to popular belief, such results demonstrate that promoting the filling method can potentially raise the overall GHG emissions. Although filling-based projects generate less direct GHG emissions, the emissions are transferred to upstream sectors, especially the cement and power sectors. The additional electricity consumption in the haulage and backfilling stages is primarily responsible for the greater GHG emissions occurring in filling-based projects. Some mitigation approaches are suggested, such as backfilling the subsidence pit, using industrial waste as cementing materials, employing energy-efficient pumps, and further developing hauling systems.
1. Introduction
China has been the largest greenhouse gas (GHG) emitter for more than 15 years [1]. To mitigate global climate change, China has implemented numerous policies to conserve energy and reduce GHG emissions in different industrial sectors [2,3,4]. “Green Mine” is a mandatory policy recently released by China’s Ministry of Natural Resources (MNR), which aims to mitigate the environmental impact of the mining sector. In this policy, the filling method, rather than open-stope or caving methods, is promoted in China’s underground mines [5].
In the existing literature, the filling method is regarded as a cleaner method for extracting metal deposits, owing to the preservation of the ground surface and the associated vegetation [6,7]. In contrast, underground caving leads to large-scale surface subsidence [8]; this means that the vegetation on the ground surface will be destroyed. Moreover, the land occupation for storing waste rocks and tailings further deteriorates such destruction. Such drawbacks restrict the application of caving methods in China [9,10]. However, quantitative assessments have rarely been proposed to test the differences in the environmental impacts between caving-based and filling-based mines. Moreover, a unified model for obtaining such an inventory is also absent. Therefore, this paper proposes a bottom-up model for estimating the lifecycle GHG emissions generated in projects by either the caving or filling method. To test the impacts of China’s promotion policy regarding the filling method on the climate, four underground iron mines (two using the caving method and two using the filling method) are studied.
The mining sector contributes more than 700 billion dollars to China’s gross domestic product, but its energy consumption and GHG emissions have raised public concerns [11]. Some studies have considered the GHG emissions in China’s metal mining sector [12,13,14]. Gan and Griffin [15] employed a life-cycle assessment (LCA) approach to estimate the energy consumption and GHG emissions of iron ore mining and processing in China. Nilsson et al. [16] reviewed the literature regarding the GHG emissions of copper and zinc ore excavation, and introduced some pathways for mitigating GHG emissions, such as developing mining technology and equipment, and increasing the share of recycled metals in the supply chain. Shao et al. [17] estimated the GHG emissions from China’s mining sector and five sub-sectors from 1999 to 2013. Farjana et al. [18] divided aluminum production into bauxite mining, alumina production, smelting, and ingot casting, and estimated China’s GHG emissions in each of these four stages. Recent studies have emphasized the estimation of national or regional GHG emissions from the mining sector based on data sourced from economic reports or government statistics. Such top-down approaches are more appropriate for macro-policy design, rather than for a detailed analysis of a specific underground project.
The literature review also indicates that in the conventional estimations of GHG emissions, only the emissions from fossil fuels, industrial explosives, and electricity in the mining sector are considered. Nevertheless, in addition to these GHG emission sources, carbon sink losses and cement should also be considered in the life-cycle analysis.
Underground caving leads to large-scale surface subsidence [19], and eliminates the carbon sink of vegetation on the ground surface. Although no surface subsidence or associated carbon sink loss occurs in filling-based projects, they require much more cement than caving-based methods, i.e., to backfill the underground void after excavation [20,21]. The GHG emissions of cement do not directly occur in the metal mining area, but both limestone extraction and clinker production generate GHG emissions [22,23]. Additionally, to ensure the consistency of the model, indirect GHG emissions from other sources (e.g., fossil fuels and industrial explosives) should also be involved.
Therefore, to test the difference in climate impact between caving-based and filling-based projects, this study employs an LCA to obtain detailed GHG emissions data, and proposes a bottom-up estimation model (Section 2) involving both direct and indirect emissions from fossil fuels, industrial explosives, electricity, cement, and carbon sink losses. Section 3 estimates the GHG emissions of the Luohe, Longtangyan, Maogong, and Xiwanggou iron mines using the proposed model, and discusses the implications regarding China’s promotion of the filling method. In Section 4, the conclusions regarding the proposed model and case study are summarized.
2. Materials and Methods
2.1. System Boundary Definition
Both caving-based and filling-based mines involve numerous mining operations, as well as associated energy and materials. In accordance with ISO 14040 [24], the system boundary of the LCA analysis is defined (Figure 1), and the life cycle of an underground project is divided into ventilation, drilling, blasting, loading, haulage, crushing, support and backfilling, and surface destruction. Fossil fuel, industrial explosives, electricity, cement, and carbon sink losses constitute the GHG emission sources. The GHG emissions of a mining project can be estimated by aggregating the contributions of each source in the various stages.
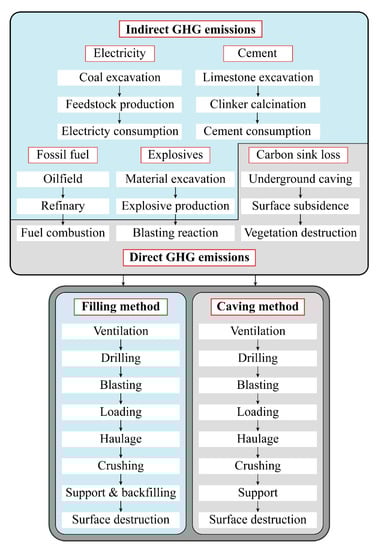
Figure 1.
System boundary of lifecycle underground mines employing the caving and filling methods.
The functional unit in this LCA analysis is 1 ton of CO2 equivalent per kiloton of excavated ore (t CO2 eq/kt ore) transported to the milling plants. The system boundary enables the modeling of GHG emissions for both caving-based and filling-based metal mines. An inventory analysis is initially conducted for the emission factors of the involved GHG sources.
2.2. Emission Factors of GHG Emission Sources
2.2.1. Fossil Fuel
The IPCC [25] has provided the default emission factors of CO2, CH4, and N2O from the combustion of different fossil fuels. Such data can be normalized to satisfy the requirement of the functional unit, according to the higher heating values (HHVs) [26] and global warming potential (GWP) [27]. The indirect GHG emission factors of fossil fuels can be derived from the literature regarding the GHG emissions in oil fields and refineries, such as [28,29]. Such emission factors are provided in Table 1.

Table 1.
Normalized GHG emission factors of fossil fuels.
2.2.2. Electricity
Electricity is a clean energy for metal mines. However, GHG will be emitted to generate electricity, especially in China, because coal-fired plants still play a predominant role in its power supply [32]. Table 2 lists the default GHG emission factors of electricity for different regional power systems, provided by China’s NDRC [33].
Table 2.
Baseline GHG emission factors of China’s regional power grid by NDRC.
2.2.3. Industrial Explosives
Industrial explosives are mixtures consisted of a blasting agent (e.g., ammonium nitrate, AN) and additives (e.g., diesel, wood flour, and emulsifier), and the GHG emission factors heavily depend on the share of each component (Table 3).
Table 3.
Some industrial explosives and normalized GHG emission factors.
The Brinkley-Wilson (B-W) approach is one of the most commonly cited approaches to calculate the GHG emission factors of industrial explosives [35]. The indirect GHG emissions of AN and diesel are considered in the proposed model. The indirect GHG emission factor of AN is obtained by referring to the literature regarding AN fertilizer production [36], and the diesel factor is shown in Table 1. Table 3 lists the GHG emission factors of some industrial explosives commonly utilized in China’s metal mines.
2.2.4. Cement
Filling-based mines consume a large quantity of cement to develop a stable filling body. Underground tunneling also requires cement to enhance the surrounding rocks, in both filling-based and caving-based projects. Cement is an indirect GHG emission source for underground mines. This approach, validated by the IPCC, enables estimations of the GHG emissions of clinker production [37]. Table 4 lists literature regarding GHG emissions of China’s cement sector.
Table 4.
GHG emission factor of cement produced in China. Reproduced with permission from Shen et al., Renewable & Sustainable Energy Reviews; published by Elsevier, 2014; Zhou et al., Energy; published by Elsevier, 2016; and Gao et al., Renewable & Sustainable Energy Reviews; published by Elsevier, 2017.
2.2.5. Carbon Sink Loss
A carbon sink of vegetation facilitates the mitigation of global climate change [41,42]. It can be quantitively represented by the net primary production (NPP) [43,44], according to the land use categorized by the IPCC [45], e.g., forestland, cropland, grassland, wetlands, settlements, and other land uses. Table 5 lists the NPPs of the land with different vegetations.
Table 5.
NPP of land with different vegetation. Reproduced with permission from Ji et al., Forest Ecosystems; published by Springer, 2020; and Li et al., Frontiers in Earth Science; published by Springer, 2020.
2.3. Bottom-Up Model for GHG Emissions
Herein a bottom-up model is proposed to estimate the life-cycle GHG emissions of extracted ore in the metal mines by different methods, by analytically relating the inputs and outputs involved in the LCA analysis. Besides the GHG emission factors listed, we involve engineering-based parameters as inputs, such as property of mining equipment (e.g., power, average consumption for fossil fuel), operating time, and predicted area of surface destruction.
2.3.1. Ventilation
Underground metal mines, both caving-based and filling-based, employ a fan system to bring freshness to working faces. GHG emissions ocurr due to the consumption of electricity by the fan system, which can be calculated by Equation (1):
where is the annual GHG emissions in the ventilation stage in the underground mine by method i; and are the GHG emission factors of electricity and lubricating oil, respectively; is the power of the ventilation equipment m, e.g., the fan system or the local fans; is the quantity of lubricating oil consumed by ventilation equipment m in unit time; is the annual operating time of ventilation equipment m.
2.3.2. Drilling
Drilling is required to make blasting holes for tunneling or ore excavating. Electricity-powered drills are preferred in underground metal mines to maintain the environment in working faces, but different designs and equipment are involved for different purposes. The GHG emissions due to electricity and lubricating oil consumed in the drilling stage can be estimated by Equation (2):
where is the annual GHG emissions in the drilling stage in the underground mine by method i; is the power of the underground drill m; is the quantity of lubricating oil consumed by the underground drills m in unit time; is the annual operating time of underground drill m.
2.3.3. Blasting
Industrial explosives are used in underground mines to break intact rock. Different industrial explosives and associated designs are implemented when tunneling and excavating ore. According to the consumption of industrial explosives, the GHG emissions in the blasting stage can be estimated by Equation (3):
where is the annual GHG emissions in the blasting stage in the underground mine by method i; is the GHG emission factor of industrial explosive m; is the annual consumption of industrial explosive m.
2.3.4. Loading
Loading equipment, such as the load-haul-dump (LDH) and the scraper, is utilized to collect and load broken ore into the hauling equipment. Because the LDH integrates ore collecting and hauling, its GHG emissions are calculated in the hauling stage. In addition, vibrating feeders are also deployed between different equipment or operations, such as at the exit of the draw shaft or in the ore transfer station. Equation (4) is proposed to estimate the GHG emissions in this stage:
where is the annual GHG emissions in the loading stage in the underground mine by method i; is the power of electricity-powered loading equipment m; is the quantity of the lubricating oil consumed by loading equipment m in unit time; is the annual operating time of loading equipment m.
2.3.5. Haulage
The haulage system of an underground mine can be categorized as working face hauling, underground hauling, underground-to-surface hoisting, and surface haulage. The load-haul-dump (LDH) is the most commonly utilized hauling equipment in the working face of both caving-based and filling-based underground mines. Trucks, electric locomotives, and belt conveyers are mainstream equipment in underground and surface haulage. Skip buckets or cages are utilized to lift the ore or waste rock from underground to surface. Even though electricity-powered equipment is preferred, diesel-powered equipment is sometimes involved. The GHG emissions due to fossil fuel, electricity, and lubricating oil consumed in the haulage stage can be predicted by Equation (5):
where is the annual GHG emissions in the haulage stage in the underground mine by method i; is the GHG emission factor of the diesel; is the power of electricity-powered hauling equipment m, e.g., electricity-powered LDHs, electric locomotives, belt conveyers, and skip buckets; is the quantity of diesel consumed by diesel-powered hauling equipment n in unit time, e.g., diesel-powered LDHs and trucks; is the quantity of lubricating oil consumed by hauling equipment m or n in unit time; and are the annual operating times of either the electricity-powered or the diesel-powered hauling equipment, respectively; is the annual operating time of hauling equipment m or n; .
2.3.6. Crushing
Due to the requirement of the block size by the hauling or loading equipment, crushing equipment is deployed in underground mines. The GHG emissions in the crushing stage primarily come from electricity consumption, which can be calculated by Equation (6):
where is the annual GHG emissions in the crushing stage in the underground mine by method i; is the power of crusher m, e.g., jaw crusher or gyratory crusher; is the quantity of lubricating oil consumed by crusher m in unit time; is the annual operating time of crusher m.
2.3.7. Support and Backfilling
Cement is used in both caving-based and filling-based metal mines to support the rock around tunnels and accesses. Filling-based projects require additional cement to enhance the stability of the filling bodies. Cement use in metal mines leads to indirect GHG emissions. Electricity is also consumed in the support and backfilling stage to power the associated equipment, such as a blender and mortar pump. Equation (7) can estimate GHG emissions in this stage:
where is the annual GHG emissions in the support and backfilling stage in the underground mine by method i; is the GHG emission factor of the cement; is the annual consumption of cement for purpose m; e.g., supporting tunnels or backfilling underground void; is the power of the equipment m involved in the support and backfilling stage; is the annual operating time of equipment m.
2.3.8. Surface Destruction
In caving-based metal mines, underground excavation leads to large-scale surface subsidence. Some robust approaches have been proposed to predict the boundary of the subsidence area [48,49,50,51]. The land occupation for dumping waste rocks and tailings, which takes place in both caving-based and filling-based projects, can be obtained from design or in situ investigation. The GHG emissions due to carbon sink loss can be estimated by Equation (8):
where is the annual GHG emissions due to carbon sink variation in the underground mine by method i; is the conversion coefficient from net primary production to GHG emissions; and are the net primary production of the vegetation on the original and eventual ground surface, respectively; is the accumulative area of land whose use changed due to underground mining.
Therefore, the GHG emissions in an underground metal mine employing either the caving or the filling method can be estimated by accumulating the results by Equations (1) to (8):
where is the GHG emission in an underground metal mine by method i; is the GHG emissions in the mining stage j involved in the underground metal mine by method i. The proposed model can obtain detailed emission data from each GHG source in varying mining stages. This means that it contributes to uncovering differences in climate impact due to employment of either the filling or the caving method. The unit GHG emissions thus can be estimated in accordance with the result by Equation (9) and the annual production in a mining project.
Additionally, the limitations of the proposed model should be discussed. This model is valid to estimate the GHG emissions occurred in the operations involved in the system boundary. More operations are also required in the underground metal mines, such as lighting, road construction. It thus can be expected that the GHG emissions take place in-situ is likely to be higher than the predicted by the proposed model.
3. Case Study
3.1. Inputs
To test the climate impact of China’s promotion policy for the filling method, four underground iron mines in China were considered, including two caving-based (i.e., Luohe and Longtangyan) and two caving-based (i.e., Maogong and Xiaowanggou) mines. Basic information regarding these mines is summarized in Table 6.
Table 6.
Basic information of the Luohe, Longtangyan, Maogong, and Xiaowanggou mines.
Table 6 shows that the production capacity of Luohe is similar to that of Maogong, whereas Longtangyan’s capacity is similar to Xiaowanggou’s. Notably, both filling and caving methods are applicable for these four projects. The Maogong and Xiaowanggou mines employ the caving method, owing to a preference for a higher cost efficiency [52]. As surface subsidence is forbidden in Luohe and Longtangyan, they utilize the filling method. The sources of the data for estimating GHG emissions should be noted. The emission factors for each GHG source have been provided in Table 1, Table 2, Table 3, Table 4 and Table 5. We collected the designs currently implemented in the Luohe, Longtangyan, Maogong, and Xiaowanggou iron mines, so as to determine the equipment involved in each project, as well as the associated engineering-based inputs required by the bottom-up model to estimate the life-cycle GHG emissions. It was expected that the engineering-based results from the bottom-up model could explicitly identify the underlying drivers of GHG emissions from the projects with the different mining methods.
3.2. Results
The GHG emission factors listed in Table 1, Table 2, Table 3, Table 4 and Table 5 and the inputs derived from the implemented designs in the Luohe, Longtangyan, Maogong, and Xiaowanggou iron mines enable the estimation of their GHG emissions. The GHG emissions of each involved case and the associated distributions are illustrated in Figure 2 and Figure 3, respectively.
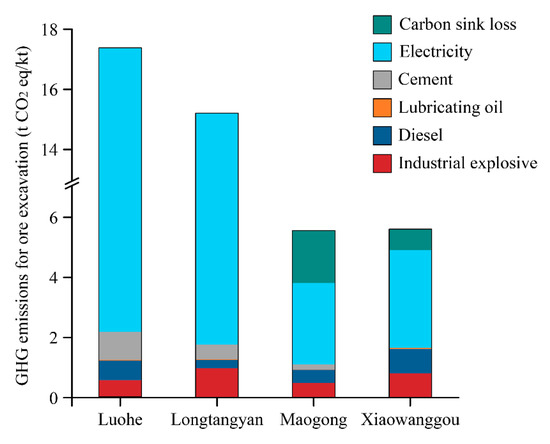
Figure 2.
GHG emissions in the Luohe, Longtangyan, Maogong, and Xiaowanggou iron mines.
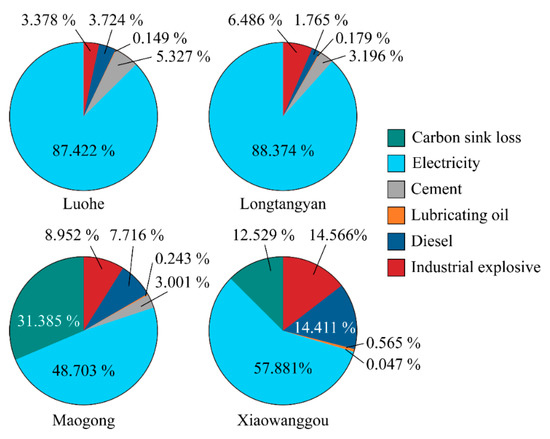
Figure 3.
Distribution of GHG emissions in the Luohe, Longtangyan, Maogong, and Xiaowanggou iron mines.
Figure 2 shows that the GHG emissions for excavating a unit quantity of ore in Luohe (17.386 t CO2 eq/kt) and Longtangyan (15.211 t CO2 eq/kt) are much higher than those in Maogong (5.554 t CO2 eq/kt) and Xiaowanggou (5.602 t CO2 eq/kt). This indicates that the mining method, rather than the production capacity, is responsible for the differences in the GHG emissions between projects. The GHG emission distributions in caving-based and filling-based projects, as illustrated in Figure 3, provide additional details regarding these differences. Figure 3 shows that electricity consumption dominates the GHG emissions in both caving-based and filling-based projects, but its share in the filling-based mines (87.422% and 88.374% in the Luohe and Longtangyan iron mines, respectively) is much higher than in caving-based mines (48.703% and 57.881% in the Maogong and Xiaowanggou iron mines, respectively). Notably, the electricity consumption values are 18.890, 16.708, 2.441, and 2.926 MWh/kt in the Luohe, Longtangyan, Maogong, and Xiaowanggou iron mines, respectively, but their associated GHG emissions are 15.199, 13.443, 2.705, and 3.243 t CO2 eq/kt, respectively. The lower GHG emission factor of the electricity in Anhui (Table 3), where the Luohe and Longtangyan iron mines are located, reduces their GHG emissions. Cement is another contributor to the higher GHG emissions in the filling-based cases; the contributions are 0.926, 0.456, 0.167, and 0.003 t CO2 eq/kt in the Luohe, Longtangyan, Maogong, and Xiaowanggou iron mines, respectively. The Luohe and Longtangyan iron mines require 57.877 and 30.387 t of cement to excavate 1000 t of iron ore, whereas those values are 10.415 and 0.166 t/kt in the Maogong and Xiaowanggou iron mines, respectively. The additional cement required in the filling-based cases is primarily used for filling in voids after deposit excavation. This indicates that using low-carbon cementing materials is a robust approach to mitigating GHG emissions in filling-based projects.
In addition, the carbon sink losses in caving-based projects raises their GHG emissions. These emissions in the Maogong and Xiaowanggou mines are 1.743 and 0.702 t CO2 eq/kt, respectively, whose shares of the total GHG emissions are 31.385% and 12.529%, respectively. This indicates that surface subsidence control and timely reclamation of subsidence pits can mitigate the GHG emissions in caving-based projects. Notably, only the consumption of industrial explosives and diesel and carbon sink losses lead to direct GHG emissions. Thus, it is expected that the GHG emissions in filling-based projects will be lower than those in caving-based projects if only direct GHG emissions are considered in the estimation. The results of such an estimation are shown in Figure 4.
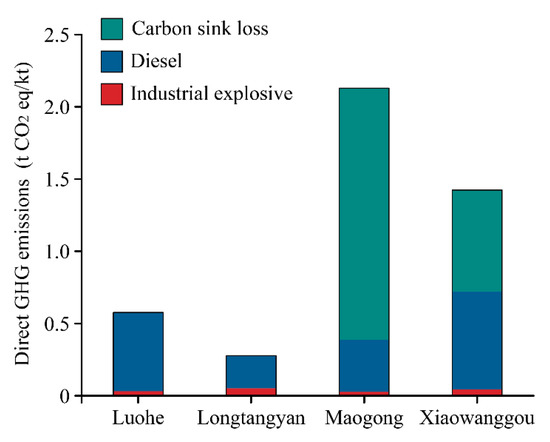
Figure 4.
Direct GHG emissions for ore excavation in the Luohe, Longtangyan, Maogong, and Xiaowanggou iron mines.
The direct GHG emissions illustrated in Figure 4 arise from industrial explosive blasting, diesel combustion, and carbon sink losses directly occurring in the mining areas of the studied cases. This means that neither the GHG emissions from indirect sources (e.g., electricity, cement, and lubricating oil) nor the indirect GHG emissions from producing industrial explosives and diesel are involved in the results illustrated in Figure 4. Figure 4 shows that the direct GHG emissions from caving-based projects (2.130 and 1.425 t CO2 eq/kt in Maogong and Xiaowanggou, respectively) are higher than those from filling-based projects (0.576 and 0.278 t CO2 eq/kt in Luohe and Longtangyan, respectively). The results illustrated in Figure 3 and Figure 4 indicate that China’s promotion policy regarding the filling method contributes to mitigating the direct GHG emissions occurring in the mining areas; however, this mitigation works by transferring GHG emissions to the suppliers of energy and materials, such as power plants and cement plants.
Considering that filling-based cases require much more electricity than caving-based cases, we analyzed the electricity consumption in each mining stage, and the associated distributions are illustrated in Figure 5 and Figure 6, respectively.
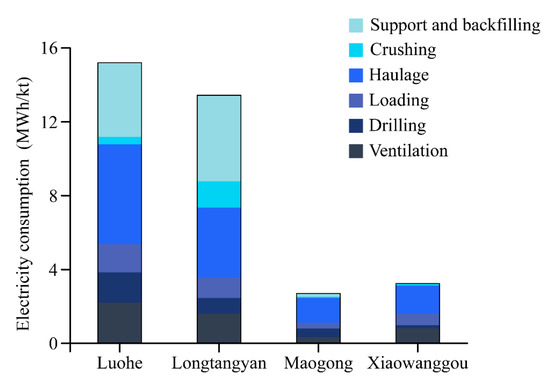
Figure 5.
Electricity consumption in the Luohe, Longtangyan, Maogong, and Xiaowanggou iron mines.
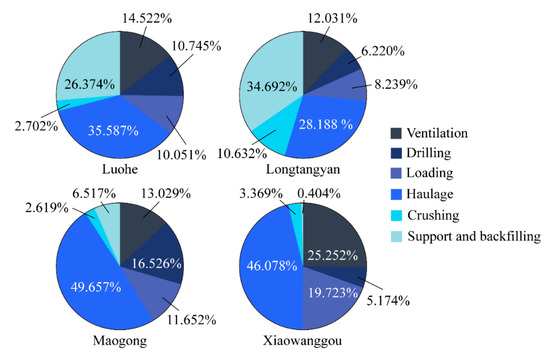
Figure 6.
Distribution of electricity consumption in the Luohe, Longtangyan, Maogong, Xiaowanggou iron mines.
Figure 5 shows that the haulage stage and the support and backfilling stage are the primary contributors to the higher electricity consumption in filling-based projects (i.e., the Luohe and Longtangyan iron mines) relative to caving-based projects (i.e., the Maogong and Xiaowanggou iron mines). The consumption values of electricity in the haulage stage are 5.409, 3.789, 1.343, and 1.494 kWh/t for the Luohe, Longtangyan, Maogong, and Xiaowanggou iron mines, respectively, with shares of the total emissions of 35.587%, 28.188%, 49.657%, and 46.078%, respectively. The higher efficiency that the hauling equipment presents in the caving-based cases accounts for this phenomenon. For instance, the Luohe iron mine has a production capacity similar to that of Maogong, but its larger load-haul-dump machines (LHDs) (type: Sandvik LH514E, bucket volume: 6 m3) present a lower efficiency (400 kt/a) than the smaller LHDs in Maogong (type: CY-4), whose bucket volume and efficiency are 4 m3 and 675 kt/a, respectively. Coincidentally, the efficiency of the LHDs in the Xiaowanggou iron mine (type: Scooptram EST3.5, bucket volume: 2.3 m3, efficiency: 320 kt/a) is also higher than that of the LHDs in Longtangyan (bucket volume: 2 m3, hauling capacity: 200 kt/a). The developed hauling system accounts for this phenomenon, for instance, the preparation ratio in Luohe, Longtangyan, Maogong, and Xiaowanggou iron mines are 2.55, 2.33, 8, and 4.43 m/kt. This indicates that a reduction in GHG emissions in filling-based projects can be expected if the efficiency of the hauling equipment can be improved. Moreover, further developing the efficiency of the hauling equipment can also help to mitigate GHG emissions in caving-based projects, as the hauling stage dominates their electricity consumption (Figure 6). In contrast, the support and backfilling stage constitutes 26.374% and 34.692% of the total electricity consumption in the Luohe and Longtangyan iron mines, respectively (Figure 6). Such values in the Maogong and Xiaowanggou mines are 6.517% and 0.404% (Figure 6), respectively. The additional consumption of electricity in the filling-based projects is primarily utilized to power pumps to either transport or dewater the filling slurry. Such phenomena indicate that approaches for conserving the energy consumed by pumps can also mitigate GHG emissions in filling-based projects.
3.3. Discussion and Implications
The filling method has been promoted by China’s Green Mine policy, which was implemented in 2020. Owing to China’s target responsibility system, it can be expected that the share of filling-based projects in China’s mineral supply will significantly increase in the following decade.
The results from the case studies of Luohe, Longtangyan, Maogong, and Xiaowanggou show that filling-based projects generate less direct GHG emissions than those based on caving, indicating that the aforementioned promotion helps to mitigate GHG emissions that occur directly in the mining sector. However, when indirect GHG emissions are considered, the GHG emissions in filling-based cases present a more notable increase, and exceed the results of the caving-based cases. This reveals that the mitigation of GHG emissions in filling-based projects works by transferring the emissions upstream to cement and power plants. This means that China’s promotion policy potentially raises the overall GHG emissions of its domestically extracted mineral products.
Moreover, the GHG emissions owing to the carbon sink losses occurring in the subsidence areas in Maogong and Xiaowanggou are likely to be lower than those in the predictions illustrated in Figure 3, owing to the involvement of certain assumptions in the estimation. First, the surface subsidence, as well as the associated vegetation destruction, is assumed to occur immediately after the underground caving is implemented. However, surface subsidence is a progressive process that lasts for a long period of time (Figure 7). Another assumption is that no carbon sink will occur once surface subsidence has occurred. Although surface subsidence destroys the forest on the ground surface, the recovery of herbaceous plants has been observed in the subsidence area of the Xiaowanggou iron mine (Figure 5). Therefore, the carbon sink loss prediction illustrated in Figure 3 is greater than the actual carbon sink losses in the Maogong and Xiaowanggou iron mines.
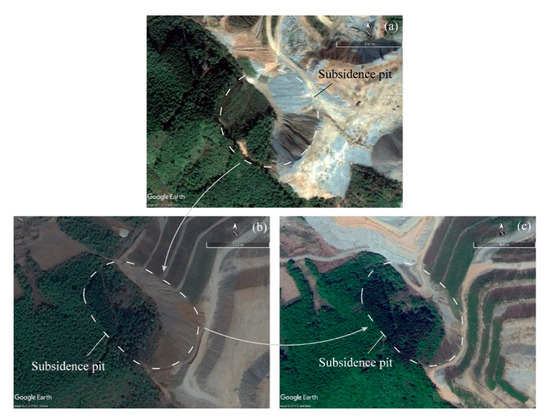
Figure 7.
Subsidence pit owing to underground caving, observed in the Xiaowanggou iron mine by Google Earth satellite images (41.39 °N, 123.63 °E); (a) Subsidence pit after vertical caving, observed on 1 October 2012.; (b) Extended subsidence pit owing to progressive caving of surrounding rocks, observed on 25 April 2014.; (c) Extended subsidence pit owing to progressive caving of surrounding rocks, observed on 8 May 2017.
In view of the above, as promoting the filling method will potentially raise the GHG emissions of China’s domestically extracted mineral products, mandatory promotion is not yet suitable for China, especially under a target for a carbon peak before 2030. However, such a promotion can be expected to eventually contribute to mitigating the overall GHG emissions in the mining sector if the GHG emission factor of China’s power supply maintains the decreasing trend presented in the past decade.
Additionally, further suggestions aimed at mitigating GHG emissions in underground metal mines can be provided. Although existing literature has proposed numerous policies or technologies, such as taxing GHG emissions [53], carbon cap and trading [54], developing efficiency in diesel engines [55], and increasing the share of renewable energy in the power supply [16], the case studies suggest more elaborate mitigation approaches to these projects. For example, backfilling of the subsidence pit is suggested for caving-based cases, so as to prevent the subsequent extension of surface subsidence after vertical caving. Such prevention has been validated in the Hemushan and Gongchanling iron mines [56]. Moreover, three approaches, i.e., using industrial wastes (such as fly ash or alkali-activated slag [57,58]) as cementing materials to reduce the consumption of cement in the backfilling stage, employing energy-efficient pumps, and further developing hauling systems, especially LHDs, are recommended for filling-based projects to mitigate their GHG emissions.
The uncertainty of this study should be clarified. Uncertainty primarily exists in the modelling for GHG emission estimation. The proposed model is a static input-output model, which means all input, e.g., emission factor of GHG sources and mining equipment, are assumed to be constant. However, these parameters are likely to varies along with the employment of GHG-abatement technologies [59] and the advance of power plants and oil refineries. The dynamic analysis, especially considering the potential of underground metal mines to mitigate GHG emissions, can be applied to deal with this uncertainty. Another uncertainty source is the variation of backfilling materials. The filling-based cases involved (i.e., Luohe and Longtangyan) use cemented materials, and plenty of electricity is consumed to produce, transport, and dewater the backfilling slurry. Besides the cemented materials, dry materials (e.g., waste rocks and tailings) is an alternative option for filling-based projects, although they are rarely used. This uncertainty can be significant, and detailed analysis is still required in the future, to provide comprehensive insight for policy decision.
Finally, the contributions of this study should be addressed. Theoretically, this study provides a unified model for obtaining an engineering-based inventory of the GHG emissions generated in underground metal mines by either the caving or filling method. Such an inventory is valid not only for designing macro-policy, but also for guiding mining projects to implement carbon-abatement technologies, or other actions for GHG emission mitigation or carbon intensity reduction.
4. Conclusions
The filling method is regarded as a cleaner approach for underground metal mines, and has been promoted in China. However, quantitative assessment for supporting such a promotion are rare. To conduct such an assessment, this study proposes a bottom-up model for estimating GHG emissions from caving-based or filling-based projects. The GHG emissions of the Luohe, Longtangyan, Maogong, and Xiaowanggou iron mines are estimated accordingly.
In contrast to popular belief, the results regarding GHG emissions from the case studies show that filling-based projects (17.386 and 15.211 t CO2 eq/kt in Luohe and Longtangyan, respectively) generate more GHG emissions to produce unit mineral products than the caving-based projects (5.554 and 5.602 t CO2 eq/kt in Maogong and Xiaowanggou, respectively) from a life-cycle perspective. Although the direct GHG emissions of filling-based projects are lower, the higher indirect values indicate that the emissions are transferred upstream to the cement and power sectors. This means that promoting the filling method is not a climate-beneficial decision, as such promotion will raise the life-cycle GHG emissions of China’s domestically extracted mineral products.
Additionally, some approaches for GHG emission mitigation have been suggested, such as backfilling subsidence pits for caving-based projects, using industrial waste as cementing materials, and employing energy-efficient pumps for the filling-based.
Author Contributions
Conceptualization, Y.L. and G.R.; methodology, Y.L. and C.Z.; software, Y.L.; validation, Y.L. and C.Z.; formal analysis, C.Z.; investigation, Y.H. (Yaxuan Han); resources, Y.L. and Y.H. (Yaxuan Han); data curation, Y.L. and Y.H. (Yingying Huang); writing—original draft preparation, Y.L. and Y.H. (Yingying Huang); writing—review and editing, Y.L.; visualization, Z.X.; supervision, G.R.; project administration, G.R.; funding acquisition, Y.L. and G.R. All authors have read and agreed to the published version of the manuscript.
Funding
This research was funded by China’s National Key R&D Program, grant number 2018YFC0808405 and 2018YFC0604401; National Natural Science Foundation of China, grant number 51774220 and 51534003; and Fundamental Research Funds for the Central Universities, grant number 2020IVA083.
Institutional Review Board Statement
Not applicable.
Informed Consent Statement
Not applicable.
Data Availability Statement
The data presented in this study are available on request from the corresponding author. The data are not publicly available due to request by the involved cases.
Acknowledgments
Not applicable.
Conflicts of Interest
The authors declare no conflict of interest.
References
- Guan, D.; Peters, G.P.; Weber, C.L.; Hubacek, K. Journey to world top emitter: An analysis of the driving forces of China’s recent CO2 emissions surge. Geophys. Res. Lett. 2009, 36, 1–5. [Google Scholar] [CrossRef]
- Yin, J.N.; Huang, G.H.; Xie, Y.L.; An, Y.K. Carbon-subsidized inter-regional electric power system planning under cost-risk tradeoff and uncertainty: A case study of Inner Mongolia, China. Renew. Sustain. Energy Rev. 2021, 135, 110439. [Google Scholar] [CrossRef]
- Wang, J.; Zhong, H.; Yang, Z.; Wang, M.; Kammen, D.M.; Liu, Z.; Ma, Z.; Xia, Q.; Kang, C. Exploring the trade-offs between electric heating policy and carbon mitigation in China. Nat. Commun. 2020, 11, 1–11. [Google Scholar] [CrossRef]
- Zhou, J.; Huo, X.; Jin, B.; Yu, X. The efficiency of carbon trading market in China: Evidence from variance ratio tests. Environ. Sci. Pollut. Res. 2019, 26, 14362–14372. [Google Scholar] [CrossRef]
- Ministry of Natural Resources. Notification of the Index of the Evaluation Systems for Green Mines and the Requirements for the Evaluation and Promotion of Green Mine by Third Party. 2020. Available online: http://gi.mnr.gov.cn/202006/t20200601_2521979.html (accessed on 1 June 2020).
- Yin, S.; Shao, Y.; Wu, A.; Wang, H.; Liu, X.; Wang, Y. A systematic review of paste technology in metal mines for cleaner production in China. J. Clean. Prod. 2020, 247, 119590. [Google Scholar] [CrossRef]
- Liu, Y.; Liu, Z.; Li, K.; Deng, S.; Dong, L. A cleaner mining method for waste tailings as paste materials to goafs. Geofluids 2020, 2020, 8857290. [Google Scholar] [CrossRef]
- Parmar, H.; Yarahmadi Bafghi, A.; Najafi, M. Impact of ground surface subsidence due to underground mining on surface infrastructure: The case of the Anomaly No. 12 Sechahun, Iran. Environ. Earth Sci. 2019, 78, 1–14. [Google Scholar] [CrossRef]
- Li, W.X.; Wen, L.; Liu, X.M. Ground movements caused by deep underground mining in Guan-Zhuang iron mine, Luzhong, China. Int. J. Appl. Earth Obs. Geoinf. 2010, 12, 175–182. [Google Scholar] [CrossRef]
- Deng, Y.; Chen, C.; Xia, K.; Yang, K.; Sun, C.; Zheng, X. Investigation on the characteristics of overlying strata caving in the Chengchao Iron Mine, China. Environ. Earth Sci. 2018, 77, 362. [Google Scholar] [CrossRef]
- National Bureau of Statistic. The Profits of Industrial Enterprises above Designated Size Fell by 3.3 Percent in 2019. 2020. Available online: http://www.stats.gov.cn/tjsj/zxfb/202002/t20200203_1724853.html (accessed on 3 February 2020).
- Liu, Y.; Ren, F.; Ding, H. Impact analysis of carbon prices on metal mining projects by block-based estimation model: Implications for cleaner production. J. Clean. Prod. 2019, 229, 695–705. [Google Scholar] [CrossRef]
- Zhang, Z.C.; Fei, R.L. Illuminating the efficiency of CO2 emissions in China’s mining sector: Evidence from meta-frontier Malmquist index models. Environ. Sci. Pollut. Res. 2020, 28, 1823–1836. [Google Scholar] [CrossRef]
- Wang, M.; Feng, C. Decoupling economic growth from carbon dioxide emissions in China’s metal industrial sectors: A technological and efficiency perspective. Sci. Total Environ. 2019, 691, 1173–1181. [Google Scholar] [CrossRef]
- Gan, Y.; Griffin, W.M. Analysis of life-cycle GHG emissions for iron ore mining and processing in China-Uncertainty and trends. Resour. Policy 2018, 58, 90–96. [Google Scholar] [CrossRef]
- Nilsson, A.E.; Aragones, M.M.; Torralvo, F.A.; Dunon, V.; Angel, H.; Komnitsas, K.; Willquist, K. A review of the carbon footprint of Cu and Zn production from primary and secondary sources. Minerals 2017, 7, 168. [Google Scholar] [CrossRef]
- Shao, S.; Liu, J.; Geng, Y.; Miao, Z.; Yang, Y. Uncovering driving factors of carbon emissions from China’s mining sector. Appl. Energy 2016, 166, 220–238. [Google Scholar] [CrossRef]
- Farjana, S.H.; Huda, N.; Mahmud, M.A.P. Impacts of aluminum production: A cradle to gate investigation using life-cycle assessment. Sci. Total Environ. 2019, 663, 958–970. [Google Scholar] [CrossRef]
- Xia, K.; Chen, C.; Deng, Y.; Xiao, G.; Zheng, Y.; Liu, X.; Fu, H.; Song, X.; Chen, L. In situ monitoring and analysis of the mining-induced deep ground movement in a metal mine. Int. J. Rock Mech. Min. Sci. 2018, 109, 32–51. [Google Scholar] [CrossRef]
- Justs, J.; Wyrzykowski, M.; Winnefeld, F.; Bajare, D.; Lura, P. Influence of superabsorbent polymers on hydration of cement pastes with low water-to-binder ratio: A calorimetry study. J. Therm. Anal. Calorim. 2014, 115, 425–432. [Google Scholar] [CrossRef]
- Yilmaz, E.; Belem, T.; Bussière, B.; Mbonimpa, M.; Benzaazoua, M. Curing time effect on consolidation behaviour of cemented paste backfill containing different cement types and contents. Constr. Build. Mater. 2015, 75, 99–111. [Google Scholar] [CrossRef]
- Liu, Z.; Guan, D.; Wei, W.; Davis, S.J.; Ciais, P.; Bai, J.; Peng, S.; Zhang, Q.; Hubacek, K.; Marland, G.; et al. Reduced carbon emission estimates from fossil fuel combustion and cement production in China. Nature 2015, 524, 335–338. [Google Scholar] [CrossRef]
- Costa, F.N.; Ribeiro, D.V. Reduction in CO2 emissions during production of cement, with partial replacement of traditional raw materials by civil construction waste (CCW). J. Clean. Prod. 2020, 276, 123302. [Google Scholar] [CrossRef]
- International Organization for Standardization. Environmental Management—Life Cycle Assessment: Principles and Framework (ISO 14040); International Organization for Standardization: Geneva, Switzerland, 2006. [Google Scholar]
- Intergovernmental Panel on Climate Change. 2006 IPCC Guidelines for National Greenhouse Gas Inventories; Intergovernmental Panel on Climate Change: Kanagawa, Japan, 2006; Chapter 3 Mobile Combustion; Volume 2. [Google Scholar]
- Argonne National Laboratory. The Greenhouse Gases, Regulated Emissions, and Energy Use in Transportation Model, GREET 1.8d.1; Argonne National Laboratory: Argonne, IL, USA, 2010. Available online: http://greet.es.anl.gov (accessed on 14 December 2010).
- Stocker, T.F.; Qin, D.H.; Plattner, G.K.; Alexander, L.V.; Allen, S.K.; Bindoff, N.L.; Breon, F.M.; Church, J.A.; Cubasch, U.; Emori, S.; et al. Technical Summary in Climate Change 2013: The Physical Science Basis; Cambridge University Press: Cambridge, UK; New York, NY, USA, 2013. [Google Scholar] [CrossRef]
- Masnadi, M.S.; El-Houjeiri, H.M.; Schunack, D.; Li, Y.; Roberts, S.O.; Przesmitzki, S.; Brandt, A.R.; Wang, M. Well-to-refinery emissions and net-energy analysis of China’s crude-oil supply. Nat. Energy 2018, 3, 220–226. [Google Scholar] [CrossRef]
- Abdul-Manan, A.F.N.; Arfaj, A.; Babiker, H. Oil refining in a CO2 constrained world: Effects of carbon pricing on refineries globally. Energy 2017, 121, 264–275. [Google Scholar] [CrossRef]
- Ozgen, S.; Caserini, S. Methane emissions from small residential wood combustion appliances: Experimental emission factors and warming potential. Atmos. Environ. 2018, 189, 164–173. [Google Scholar] [CrossRef]
- Huang, Y.; Yi, Q.; Wei, G.Q.; Kang, J.X.; Li, W.Y.; Feng, J.; Xie, K.C. Energy use, greenhouse gases emission and cost effectiveness of an integrated high- and low-temperature Fisher-Tropsch synthesis plant from a lifecycle viewpoint. Appl. Energy 2018, 228, 1009–1019. [Google Scholar] [CrossRef]
- Chen, H.; Tang, B.J.; Liao, H.; Wei, Y.M. A multi-period power generation planning model incorporating the non-carbon external costs: A case study of China. Appl. Energy 2016, 183, 1333–1345. [Google Scholar] [CrossRef]
- National Development and Reform Commission. Baseline Emission Factor of China’s Regional Power Grid Applied in Carbon-Mitigation Projects. 2018. Available online: http://www.mee.gov.cn/ywgz/ydqhbh/wsqtkz/201812/P020181220579925103092.pdf (accessed on 20 December 2018).
- United Nations Framework Convention on Climate Change: Development Mechanism Executive Board. Methodological Tool: Tool to Calculate the Emission Factor for an Electricity System; United Nations Framework Convention on Climate Change: Development Mechanism Executive Board: New York, NY, USA, 2012. [Google Scholar]
- Pepekin, V.I.; Gubin, S.A. Heat of explosion of commercial and brisant high explosives. Combust. Explos. Shock Waves 2007, 43, 212–218. [Google Scholar] [CrossRef]
- Zhang, W.F.; Dou, Z.X.; He, P.; Ju, X.T.; Powlson, D.; Chadwick, D.; Norse, D.; Lu, Y.L.; Zhang, Y.; Wu, L.; et al. New technologies reduce greenhouse gas emissions from nitrogenous fertilizer in China. Proc. Natl. Acad. Sci. USA 2013, 110, 8375–8380. [Google Scholar] [CrossRef] [PubMed]
- Intergovernmental Panel on Climate Change. 2006 IPCC Guidelines for National Greenhouse Gas Inventories; Intergovernmental Panel on Climate Change: Kanagawa, Japan, 2006; Chapter 2 Mineral industry; Volume 3. [Google Scholar]
- Shen, L.; Gao, T.; Zhao, J.; Wang, L.; Wang, L.; Liu, L.; Chen, F.; Xue, J. Factory-level measurements on CO2 emission factors of cement production in China. Renew. Sustain. Energy Rev. 2014, 34, 337–349. [Google Scholar] [CrossRef]
- Zhou, W.; Jiang, D.; Chen, D.; Griffy-Brown, C.; Jin, Y.; Zhu, B. Capturing CO2 from cement plants: A priority for reducing CO2 emissions in China. Energy 2016, 106, 464–474. [Google Scholar] [CrossRef]
- Gao, T.; Shen, L.; Shen, M.; Liu, L.; Chen, F.; Gao, L. Evolution and projection of CO2 emissions for China’s cement industry from 1980 to 2020. Renew. Sustain. Energy Rev. 2017, 74, 522–537. [Google Scholar] [CrossRef]
- Cox, P.M.; Betts, R.A.; Jones, C.D.; Spall, S.A.; Totterdell, I.J. Acceleration of global warming due to carbon-cycle feedbacks in a coupled climate model. Nature 2000, 408, 184–187. [Google Scholar] [CrossRef]
- Hubau, W.; Lewis, S.L.; Phillips, O.L.; Affum-Baffoe, K.; Beeckman, H.; Cuní-Sanchez, A.; Daniels, A.K.; Ewango, C.E.N.; Fauset, S.; Mukinzi, J.M.; et al. Asynchronous carbon sink saturation in African and Amazonian tropical forests. Nature 2020, 579, 80–87. [Google Scholar] [CrossRef] [PubMed]
- Nemani, R.R.; Keeling, C.D.; Hashimoto, H.; Jolly, W.M.; Piper, S.C.; Tucker, C.J.; Myneni, R.B.; Running, S.W. Climate-driven increases in global terrestrial net primary production from 1982 to 1999. Science 2003, 300, 1560–1563. [Google Scholar] [CrossRef]
- Ciais, P.; Reichstein, M.; Viovy, N.; Granier, A.; Ogée, J.; Allard, V.; Aubinet, M.; Buchmann, N.; Bernhofer, C.; Carrara, A.; et al. Europe-wide reduction in primary productivity caused by the heat and drought in 2003. Nature 2005, 437, 529–533. [Google Scholar] [CrossRef] [PubMed]
- Intergovernmental Panel on Climate Change. 2006 IPCC Guidelines for National Greenhouse Gas Inventories; Intergovernmental Panel on Climate Change: Kanagawa, Japan, 2006; Chapter 3 Consistent Representation of Lands; Volume 4. [Google Scholar]
- Ji, Y.; Zhou, G.; Luo, T.; Dan, Y.; Zhou, L.; Lv, X. Variation of net primary productivity and its drivers in China’s forests during 2000-2018. For. Ecosyst. 2020, 7, 15. [Google Scholar] [CrossRef]
- Li, J.G.; Wang, Y.; Liu, L.L. Responses of the Terrestrial Ecosystem Productivity to Droughts in China. Front. Earth Sci. 2020, 8, 59. [Google Scholar] [CrossRef]
- Laubscher, D.H. Cave mining—The state of the art. J. S. Afr. I. Min. Metall. 1994, 94, 279–293. [Google Scholar]
- Brady, B.H.G.; Brown, E.T. Rock Mechanics for Underground Mining; Springer: Dordrecht, The Netherlands, 2004. [Google Scholar]
- Woo, K.S.; Eberhardt, E.; Elmo, D.; Stead, D. Empirical investigation and characterization of surface subsidence related to block cave mining. Int. J. Rock Mech. Min. Sci. 2013, 61, 31–42. [Google Scholar] [CrossRef]
- Hamdi, P.; Stead, D.; Elmo, D.; Toyra, J. Use of an integrated finite/discrete element method-discrete fracture network approach to characterize surface subsidence associated with sub-level caving. Int. J. Rock Mech. Min. Sci. 2018, 103, 55–67. [Google Scholar] [CrossRef]
- Hurtado, J.P.; Diaz, N.; Acuna, E.I.; Fernandez, J. Shock losses characterization of ventilation circuits for block caving production levels. Tunn. Undergr. Sp. Technol. 2014, 41, 88–94. [Google Scholar] [CrossRef]
- Watabe, A.; Leaver, J.; Ishida, H.; Shafiei, E. Impact of low emissions vehicles on reducing greenhouse gas emissions in Japan. Energy Policy 2019, 130, 227–242. [Google Scholar] [CrossRef]
- Lin, B.; Luan, R. Are government subsidies effective in improving innovation efficiency? Based on the research of China’s wind power industry. Sci. Total Environ. 2020, 710, 136339. [Google Scholar] [CrossRef] [PubMed]
- US Department of Energy. Industrial Technologies Program: Mining Industry Energy Bandwidth Study; US Department of Energy: Washington, DC, USA, 2007. [Google Scholar]
- Ding, H.; Chen, S.; Chang, S.; Li, G.; Zhou, L. Prediction of Surface Subsidence Extension due to Underground Caving: A Case Study of Hemushan Iron Mine in China. Math. Probl. Eng. 2020, 2020, 5086049. [Google Scholar] [CrossRef]
- Chindaprasirt, P.; Jaturapitakkul, C.; Sinsiri, T. Effect of fly ash fineness on compressive strength and pore size of blended cement paste. Cem. Concr. Compos. 2005, 27, 425–428. [Google Scholar] [CrossRef]
- Collins, F.; Sanjayan, J.G. Effect of pore size distribution on drying shrinkage of alkali-activated slag concrete. Cem. Concr. Res. 2000, 30, 1401–1406. [Google Scholar] [CrossRef]
- National Development and Reform Commission. The National Promotion Catalog of Key Energy Conservation and Low-Carbon Technologies (Section of Energy Conservation), 2017 ed.; National Development and Reform Commission: Beijing, China, 2017. [Google Scholar]


Publisher’s Note: MDPI stays neutral with regard to jurisdictional claims in published maps and institutional affiliations. |
© 2021 by the authors. Licensee MDPI, Basel, Switzerland. This article is an open access article distributed under the terms and conditions of the Creative Commons Attribution (CC BY) license (https://creativecommons.org/licenses/by/4.0/).