Article

Parametric Study of Pt/C-Catalysed Hydrothermal Decarboxylation of Butyric Acid as a Potential Route for Biopropane Production

1
Energy and Bioproducts Research Institute, College of Engineering and Physical Sciences, Aston University, Birmingham B4 7ET, UK
2
Sustainable Fuels, SHV Energy, 2132 JL Hoofddorp, The Netherlands
3
Department of Chemical Engineering and Applied Chemistry, College of Engineering and Physical Sciences, Aston University, Birmingham B4 7ET, UK
*
Author to whom correspondence should be addressed.
Energies 2021, 14(11), 3316; https://doi.org/10.3390/en14113316
Submission received: 26 April 2021 / Revised: 24 May 2021 / Accepted: 31 May 2021 / Published: 5 June 2021
(This article belongs to the Section A4: Bio-Energy)

Abstract

:
Sustainable fuel-range hydrocarbons can be produced via the catalytic decarboxylation of biomass-derived carboxylic acids without the need for hydrogen addition. In this present study, 5 wt% platinum on carbon (Pt/C) has been found to be an effective catalyst for hydrothermally decarboxylating butyric acid in order to produce mainly propane and carbon dioxide. However, optimisation of the reaction conditions is required to minimise secondary reactions and increase hydrocarbon selectivity towards propane. To do this, reactions using the catalyst with varying parameters such as reaction temperatures, residence times, feedstock loading and bulk catalyst loading were carried out in a batch reactor. The highest yield of propane obtained was 47 wt% (close to the theoretical decarboxylation yield of 50 wt% on butyric acid basis), corresponding to a 96% hydrocarbon selectivity towards propane. The results showed that the optimum parameters to produce the highest yield of propane, from the range investigated, were 0.5 g butyric acid (0.57 M aqueous solution), 1.0 g Pt/C (50 mg Pt content) at 300 °C for 1 h. The reusability of the catalyst was also investigated, which showed little or no loss of catalytic activity after four cycles. This work has shown that Pt/C is a suitable and potentially hydrothermally stable heterogeneous catalyst for making biopropane, a major component of bioLPG, from aqueous butyric acid solutions, which can be sourced from bio-derived feedstocks via acetone-butanol-ethanol (ABE) fermentation.

1. Introduction

There is a growing interest in the production of sustainable hydrocarbons from renewable bio-derived feedstocks (e.g., woody biomass, energy crops, vegetable oils, animal fats and other organic wastes and residues) for use as fuels and chemical feedstocks [1,2], proposed as a route to defossilisation of carbon-based chemicals and the energy sector. Essentially, the near-term target is to produce hydrocarbons from biomass that can be used as direct replacement for those derived from fossil fuels. Different biomass-derived feedstocks are currently being targeted for hydrocarbon production including fats and oils [3], sugars and sugar-derived intermediates such as furans, furfural, 5-hydromethylfufural, alcohols and carboxylic acids [1,4], bio-oil from biomass pyrolysis and bio-crude from hydrothermal liquefaction of biomass [5]. Chemical products that are directly derived from biomass contain oxygen, and various routes are being explored to convert these oxygen-rich feedstocks into hydrocarbons. Production of hydrocarbons from these feedstocks mainly involves hydrodeoxygenation (HDO), which relies heavily of external expensive molecular hydrogen supply [5,6]. However, there are great benefits in making bio-derived hydrocarbons that can be used as industrial feedstocks for the production of a variety of chemical products that are currently made from fossil-derived hydrocarbons such as fuel-range alkanes [3,7]; alkenes used as chemical feedstocks [1]; and benzene, toluene and xylenes (BTX) for pharmaceuticals, household goods and fuel additives [4].
Hydrotreatment process has been established as a catalytic method that uses hydrogen to convert the glycerol and the fatty acids backbones of triglycerides to produce propane and green hydrocarbon fuels [8]. These chemical transformations form the basis for the Hydrotreated Vegetable Oil (HVO) and Hydroprocessed Ester and Fatty Acids (HEFA) to commercially make renewable diesel, sustainable aviation fuel (SAF) and biopropane [8,9]. The major drawback associated with these processes are the high H2 consumption, a large proportion of which is converted to water as opposed to being incorporated into the desired hydrocarbon product. At present, H2 is costly and is primarily produced from steam reforming of natural gas and not readily available in large quantities from renewable resources (e.g., via electrolysis).
Long-chain fatty acids (LCFAs) and volatile fatty acids (VFAs) have been identified as potential biomass-derived feedstocks for the production of both liquid and gaseous hydrocarbons via a range of chemistries [10,11]. LCFAs can be obtained from the hydrolysis of lipids (vegetable oils and animal fats), while VFAs can be obtained from biomass via fermentation or catalytic oxidation. The production of fatty acids from biomass involves the use of water as reaction medium (during fermentation or catalytic oxidation) or reactant (during hydrolysis). Therefore, obtaining pure fatty acids from aqueous media/broth would involve the application of separation technologies [12,13], such as solvent extraction and/or distillation, which adds to process costs—usually amounting to up to 40% of production costs [12,14]. Hence, if the destination of the fatty acids is as feedstock for hydrocarbons, processing them in aqueous (hydrothermal) environments may offer economic advantage.
With carboxylic acids, conversion to alkanes involve simpler chemistries that also avoid or minimise the use of expensive hydrogen [15]. For example, catalytic deoxygenation is an alternative method to HDO that can be employed to remove the oxygen from carboxylic acids via two reaction pathways: decarbonylation and decarboxylation. Decarbonylation removes the oxygen atoms in the form of CO and H2O and an unsaturated hydrocarbon molecule (n-alkene) is also produced, as shown in Equation (1) [10].
R–CH2–CH2–COOH → R–CH = CH2 + CO + H2O
Hence, to obtain saturated hydrocarbons would require further hydrogenation.
Decarboxylation removes the oxygen atoms from the fatty acids in the form of CO2, and therefore no H2 is required. The removal of the oxygen via CO2 leads to a hydrocarbon molecule (n-alkane) being produced (Equation (2)) [10].
R–CH2–CH2–COOH→R–CH2–CH3 + CO2
The decarboxylation route is preferred as the addition of hydrogen is not required to produce hydrocarbons and also the CO2 co-product does not inhibit catalyst like CO produced via decarbonylation [11]. Furthermore, catalytic deoxygenation of fatty acids in hydrothermal conditions has been reported with high feedstock conversions and high alkane selectivity [16,17,18]. Fu, Lu and Savage [18] investigated the decarboxylation of palmitic acid with noble metal catalyst (Pt/C and Pd/C) and found that the hydrocarbon selectivity towards pentadecane was more than 90% with no added H2 required. A further study by Savage and co-workers [10] investigated the decarboxylation of stearic, palmitic, and lauric acid and found hydrocarbon selectivity of more than 90% to n-alkanes. Through these studies, it was shown that Pd and Pt catalysts were effective for decarboxylating different fatty acids under hydrothermal conditions [10,15,18]. The direct formation of alkanes from these reactions showed that water can participate as a reactant in the reaction [10,15,18]. Therefore, it has been postulated that the hydrothermal deoxygenation mechanism involved the initial decarbonylation to form CO, which would produce hydrogen, via water-gas shift reaction, for the in-situ hydrogenation step to obtain alkanes [19,20]. Non-noble metals such as Mo2C, W2C, Mo/SiO2 have also been used for LCFA decarboxylation, but these suffered rapid deactivation, leading to lowered feedstock conversion and hydrocarbon selectivity mostly due to carbon deposition [6,19].
Short-chain carboxylic acids (VFAs) can similarly undergo decarboxylation to produce light alkane or alkene gases that can be used as fuels or chemical feedstock. Goshima et al. [1] reported the formation of propylene from butyric acid in the presence of zeolite catalysts. However, for energy application, C1–C4 light alkanes are of commercial importance as clean-burning fuels (especially, methane, propane and butane in liquefied or compressed fuel gases) [21] or for the hydrogen production via steam reforming (methane) [22]. There is a growing interest in the production of liquefied petroleum gases (LPG) from biomass-derived feedstocks. The so-called bio-LPG (mixture of propane and butane) has several significant advantages over the already low-carbon fossil alternative as a potential fuel for the decarbonisation of off-grid energy needs both in developed and developing countries [21].
Among the biomass-derived VFAs, butyric acid is a feedstock of interest in making propane via decarboxylation. Butyric acid can be produced in large quantities from biomass via the modification of the well-known acetone–butanol–ethanol (ABE) fermentation process using Clostridium tyrobutyricum and similar bacteria [12,13]. However, due to process limitations, the concentration of butyric acid in the fermentation broth is deliberately kept low, leading to high extraction and purification costs [13]. Hence, processing butyric acid in water may present a good economic advantage by avoiding the expensive dewatering step, but instead water is used as a reaction medium for the relevant organic chemical reactions [19]. Yeh, Linic and Savage [23] used a flow reactor to investigate the Pt-catalysed decarboxylation of butyric acid under hydrothermal conditions of 350 °C and 207 bar. Using 0.2 M butyric acid solution at a flow rate of 45 L min−1, the authors found that Pt/C catalyst deactivated over a 24 h period on stream due to a combination of poisoning, coking and pore structure collapse [23]. However, the use of a fixed set of reaction conditions to test catalyst deactivation may not be sufficient to understand the reasons for its occurrence. Besides, for large-scale processing, higher concentrations of butyric acid would be required and the response of the catalyst to different feedstock concentrations and processing conditions, particularly temperature, is worthy of investigation. Therefore, it is important to carry out more fundamental parametric studies for reaction optimisation towards reducing catalyst deactivation and to generate useful data for efficient process design. This could also aid the design and application of cheaper catalysts to replace the highly expensive noble metals.
Therefore, in this present work, a systematic experimental approach has been adopted to investigate a range of parameters that influence the hydrothermal decarboxylation of butyric acid in the presence of 5 wt% Pt/C catalyst. To do this, the effects of catalyst loading, butyric acid concentration, temperature and reaction time have been studied using a batch reactor. The novelty of this present work was to evaluate the results obtained in order to identify the optimum process conditions and catalyst use for propane production. The reusability of the catalyst over four cycles was also tested under a set of experimental conditions. This work can provide benchmark data for the design and application of cheaper catalysts for this process.

2. Materials and Methods

2.1. Materials

All materials were used as received. The 5 wt% platinum on carbon (Pt/C, with a confirmed 4.9 wt% Pt metal content) was purchased from Sigma Aldrich, Gillingham, Dorset, UK. Acros Organics’ n-butyric acid (+99%) was purchased from Fisher Scientific, Leicester, UK. Deionised water was obtained in-house using a Milli-Q Advantage A10 Water Purification System. Tedlar bags (1 L) obtained from Restek, Saunderton, UK were used for product gas collection after each experiment for offline analysis.

2.2. Methodology

2.2.1. Batch Reactor Procedure

In this present study, catalytic decarboxylation tests were carried out in a 75 mL capacity Hastelloy-C batch reactor obtained from Parr Instruments Co. Inc. Moline, Illinois, USA. The reactor has maximum operating conditions of 600 °C and 45 MPa for the temperature and pressure, respectively.
In each experiment, the deionised water and butyric acid were weighed out in a beaker and loaded into the reactor, followed by addition of known amounts of the Pt/C catalyst. The total liquid loading was approximately 10–11 g for all experiments. The experimental design was planned to enable the evaluation of the main process parameters such as temperature, feedstock loading, catalyst loading and reaction time as shown in Table 1.
Once loaded, the reactor was sealed, gently purged with nitrogen for 5 min and thereafter pressurised to 5 bar with the same nitrogen (the nitrogen was used to ensure adequate pressure reading after experiments and to standardise the gas analysis). The reactor was then placed into an electric heating jacket fitted with a temperature controller and heated to the desired temperature at a heating rate of approximately 10 °C min−1. At the end of each run, the reactor was removed from the heating jacket and quickly cooled using an industrial cooling fan, bringing the reactor temperature to ambient under 30 min.
Initial reproducibility tests were carried out for the first few experiments in triplicate, followed by analysis of reaction products. The results from the analysis showed a standard deviation of less than 2%, and therefore the subsequent experiments were only undertaken once. Nevertheless, the analysis of the reaction products was carried out in duplicate in all cases.

2.2.2. Product Analysis

Figure 1 shows a simplified analysis scheme for the reaction products. After cooling, the reactor pressure and temperature were noted before gas product collection using the 1 L Tedlar bags. The reactor was then opened, and the liquid and solid contents (mainly catalyst) were collected by rinsing with distilled water. This slurry was then filtered to separate the solid residue (including catalyst) from the aqueous phase.

2.2.3. Reaction Products Analyses

The oven temperature programme and analytical procedure have been published previously [24]. The gas product was analysed using a Shimadzu GC-2014 gas by manual injection of 1 mL of each sample using a gas-tight syringe. The temperature of the injector was 60 °C. The GC has two detectors: a thermal conductivity detector (TCD) and a flame ionisation detector (FID). Both detectors were held at 220 °C during the analysis. The column oven was initially held at 80 °C, and ramped at 10 °C min−1 to 180 °C and then held at 180 °C for 3 min, with a total analysis time of 13 min. The permanent gases: hydrogen, nitrogen, oxygen and carbon monoxide were separated on a 2 mm in diameter by 2 m length 60–80 mesh molecular sieve column, fitted to a thermal conductivity detector (TCD) for quantification. The hydrocarbon gases and CO2 were separated on a 2 mm in diameter by 2 m in length Hayesep 80–100 mesh column, and then quantified using a flame ionisation detector (FID) for the hydrocarbons and the TCD for CO2.
The volume percentage of each gas obtained from the GC was used to calculate the respective mass yield using the Ideal Gas Equation, following Equations (3)–(8):
Partial   fraction   of   each   component , P i = y i × P T
y i = volume (molar) fraction of component i;
P T = reactor pressure after cooling.
Mass   of   gas   component ,   m i = ( P i × V × M i R T )
where, Pi (Pa); V is reactor headspace (m3); Mi is relative molecular mass of gas component i (g/mol); R is general gas constant (8.314 J mol−1 K−1) and T is reactor ambient temperature after cooling (K).
Total   gas   yield   ( % ) = ( m i ) m   b u t y r i c   a c i d   f e e d × 100  
Given that decarboxylation of carboxylic acids produces CO2 and hydrocarbons, the hydrocarbon selectivity towards propane as the target product was evaluated for the possibility of secondary reactions, e.g., cracking.
Propane   hydrocarbon   selectivity   ( % ) = mass   yield   of   propane Total   mass   yield   of   hydrocarbon   gases
After gas sampling and analysis, the reactor was opened to recover the aqueous and solid residues, using a known volume of water. The mixture was then filtered under vacuum using Whatman grade 4 qualitative filter papers in order to separate the solid residue from the aqueous phase, which was consistently clear and colourless. Acid-base back-titration of aliquots of the aqueous phase was carried out to determine butyric acid conversion after each test [25]. In the procedure, 25 mL of freshly prepared 0.1 M NaOH solution was added to 10 mL of aqueous phase product and titrated with standard 0.1 M HCl standard solution (Fisher Scientific, UK) using phenolphthalein indicator. A blank titration was carried out by adding 25 mL of the 0.1 M NaOH to 10 mL of deionised water and titrating against the HCl.
Mass   of   unconverted   butyric   acid ,   m u b = ( S B ) × M × V × 88.11 10 , 000
S = volume of 0.1 M HCl used in titration (mL),
B = volume of 0.1 M HCl used in blank titration (mL),
M = concentration of HCl (mol/L),
V = volume of aqueous phase collected (mL), and
88.11 = molecular mass of butyric acid (g/mol).
Butyric   acid   conversion   ( % ) = m   b u t y r i c   a c i d   f e e d m ub m   b u t y r i c   a c i d   f e e d × 100
Each recovered solid residue (comprising used catalyst and any formed char) was dried to a constant weight at 105 °C in a vacuum oven for 2 h.

2.2.4. Catalyst Characterisation

X-ray diffraction (XRD) analysis of the recovered and dried solid residues, as well as the fresh ‘as-received’ catalyst, was performed on a Bruker D8 Advance diffractometer using Cu Kα1,2 radiation (40 mA and 40 kV, 0.02 mm Ni Kβ filter and 2.5° Soller slits, scanning from 5 to 105°). The solid residues were top-loaded into PMMA specimen holders and the diffractograms were collected in the Bragg–Brentano geometry with a step scan of 0.02° (1 s per step). Assignment of peaks was based on the International Centre for Diffraction Data‘s (ICDD) Powder Diffraction File-2 2012 (PDF-2 2012) and Inorganic Crystal Structure databases ICSD. Using the Scherrer equation with a Gaussian fit and shape factor of 0.9, the particle sizes were estimated on the basis of the full width at half maximum (FWHM) of the platinum metallic reflection [26].

3. Results

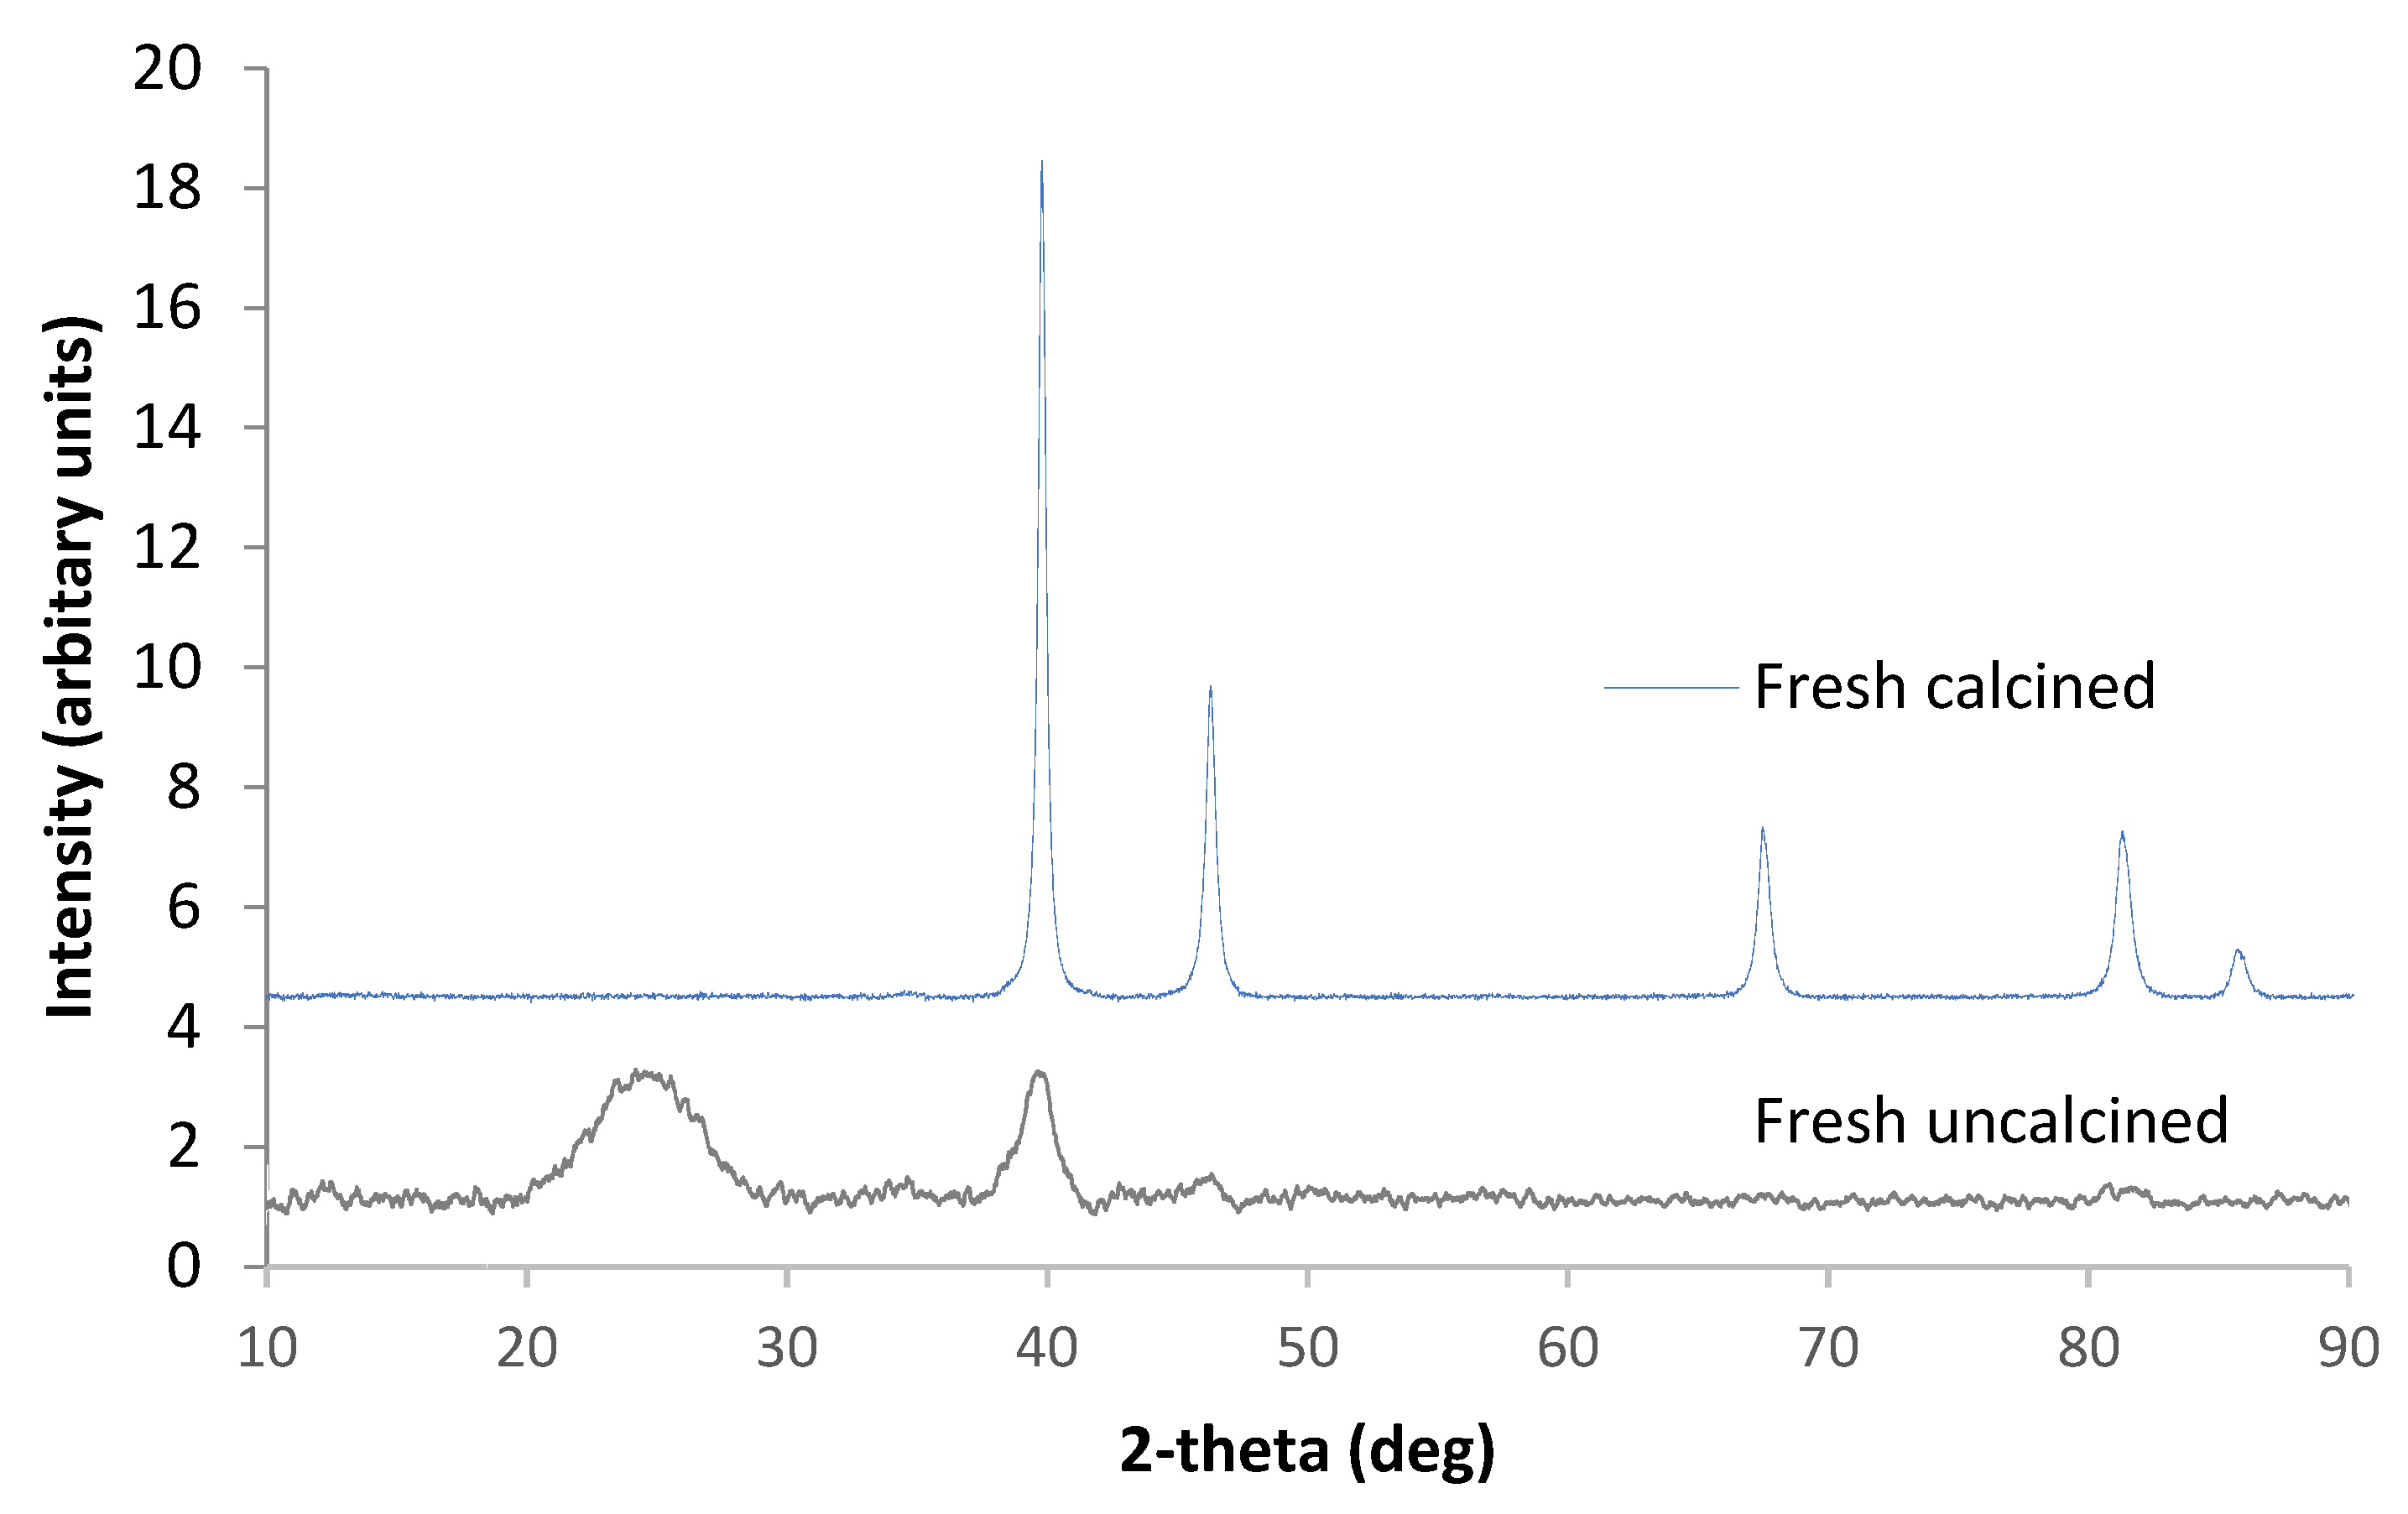
3.1. Catalyst Characterisation

The catalysts were firstly characterised using XRD. The fresh catalyst (1.02 g) was also calcined to verify the phase of Pt and its content in the bulk catalyst [27]. Calcination was undertaken at 500 °C for 2 h in duplicate. After calcination, only 0.0597 g of solid was recovered, which amounted to 5.85 wt%. During calcination of the bulk catalyst, the carbon support was burned off and the metallic Pt possibly oxidised to PtO and/or PtO2. In theory, the oxidation of all the Pt in the catalyst to PtO2 would leave a mass of 5.82 wt% after carbon burn-off. Therefore, the 5.85 wt% (standard deviation < 2%) solid obtained from the calcination gave a close confirmation of the 5 wt% loading of metallic Pt in the fresh catalyst. The fresh uncalcined catalyst is compared to the fresh calcined catalyst, as shown in Figure 2. The Pt and carbon peaks are shown at 2θ = 39.6° and 26.6°, respectively. The platinum oxide peaks for the calcined catalyst showed a slight shift to the right and significantly higher intensity than the uncalcined catalyst. In addition, Figure 2 revealed that other peaks at 2θ = 67°, 81° and 85° became prominent, which corresponded to Pt3O4 phase in the database, confirming the oxidation of the Pt via calcination. No carbon peaks were observed for the calcined catalyst due to carbon burn-off during calcination.
The crystallite size of the catalysts was calculated using the Scherrer equation (Equation (9)):
τ = K λ β   cos θ
Shape factor K = 0.9.
Wavelength of the X-ray radiation, λ = 1.5406.
The full width at half max, β, and the Bragg angle, θ, were obtained from the XRD spectra.
The Scherrer equation shows the crystallite size of the Pt in the bulk catalyst as 49.1 nm and the calcined catalyst to be 239.7 nm, possibly due to agglomeration of the formed Pt oxide particles following carbon burn-off.
Nitrogen adsorption/desorption porosimetry was carried out and used to calculate the Brunauer-Emmett-Teller (BET) surface area, pore volume and pore size distribution of the as-received 5 wt% Pt/C catalyst. Sample measurements were carried out at 77.4 K after they had been dried under nitrogen at 150 °C for 6 h. The instrument used was a Micromeritics Tristar 3000 system (Micromeritics, Norcross, GA, USA). The nitrogen adsorption and desorption isotherms obtained are shown in Figure 3. The surface area was calculated from data points in the 0.05 to 0.95 p/po region, the pore volume was obtained at p/po of 0.99 and the Barrett–Joyner–Halenda method was used to determine the pore size distribution. The obtained catalyst surface area, pore volume and pore diameter were 493.72 m2/g, 0.317 cm3/g and 1.195 nm, respectively.

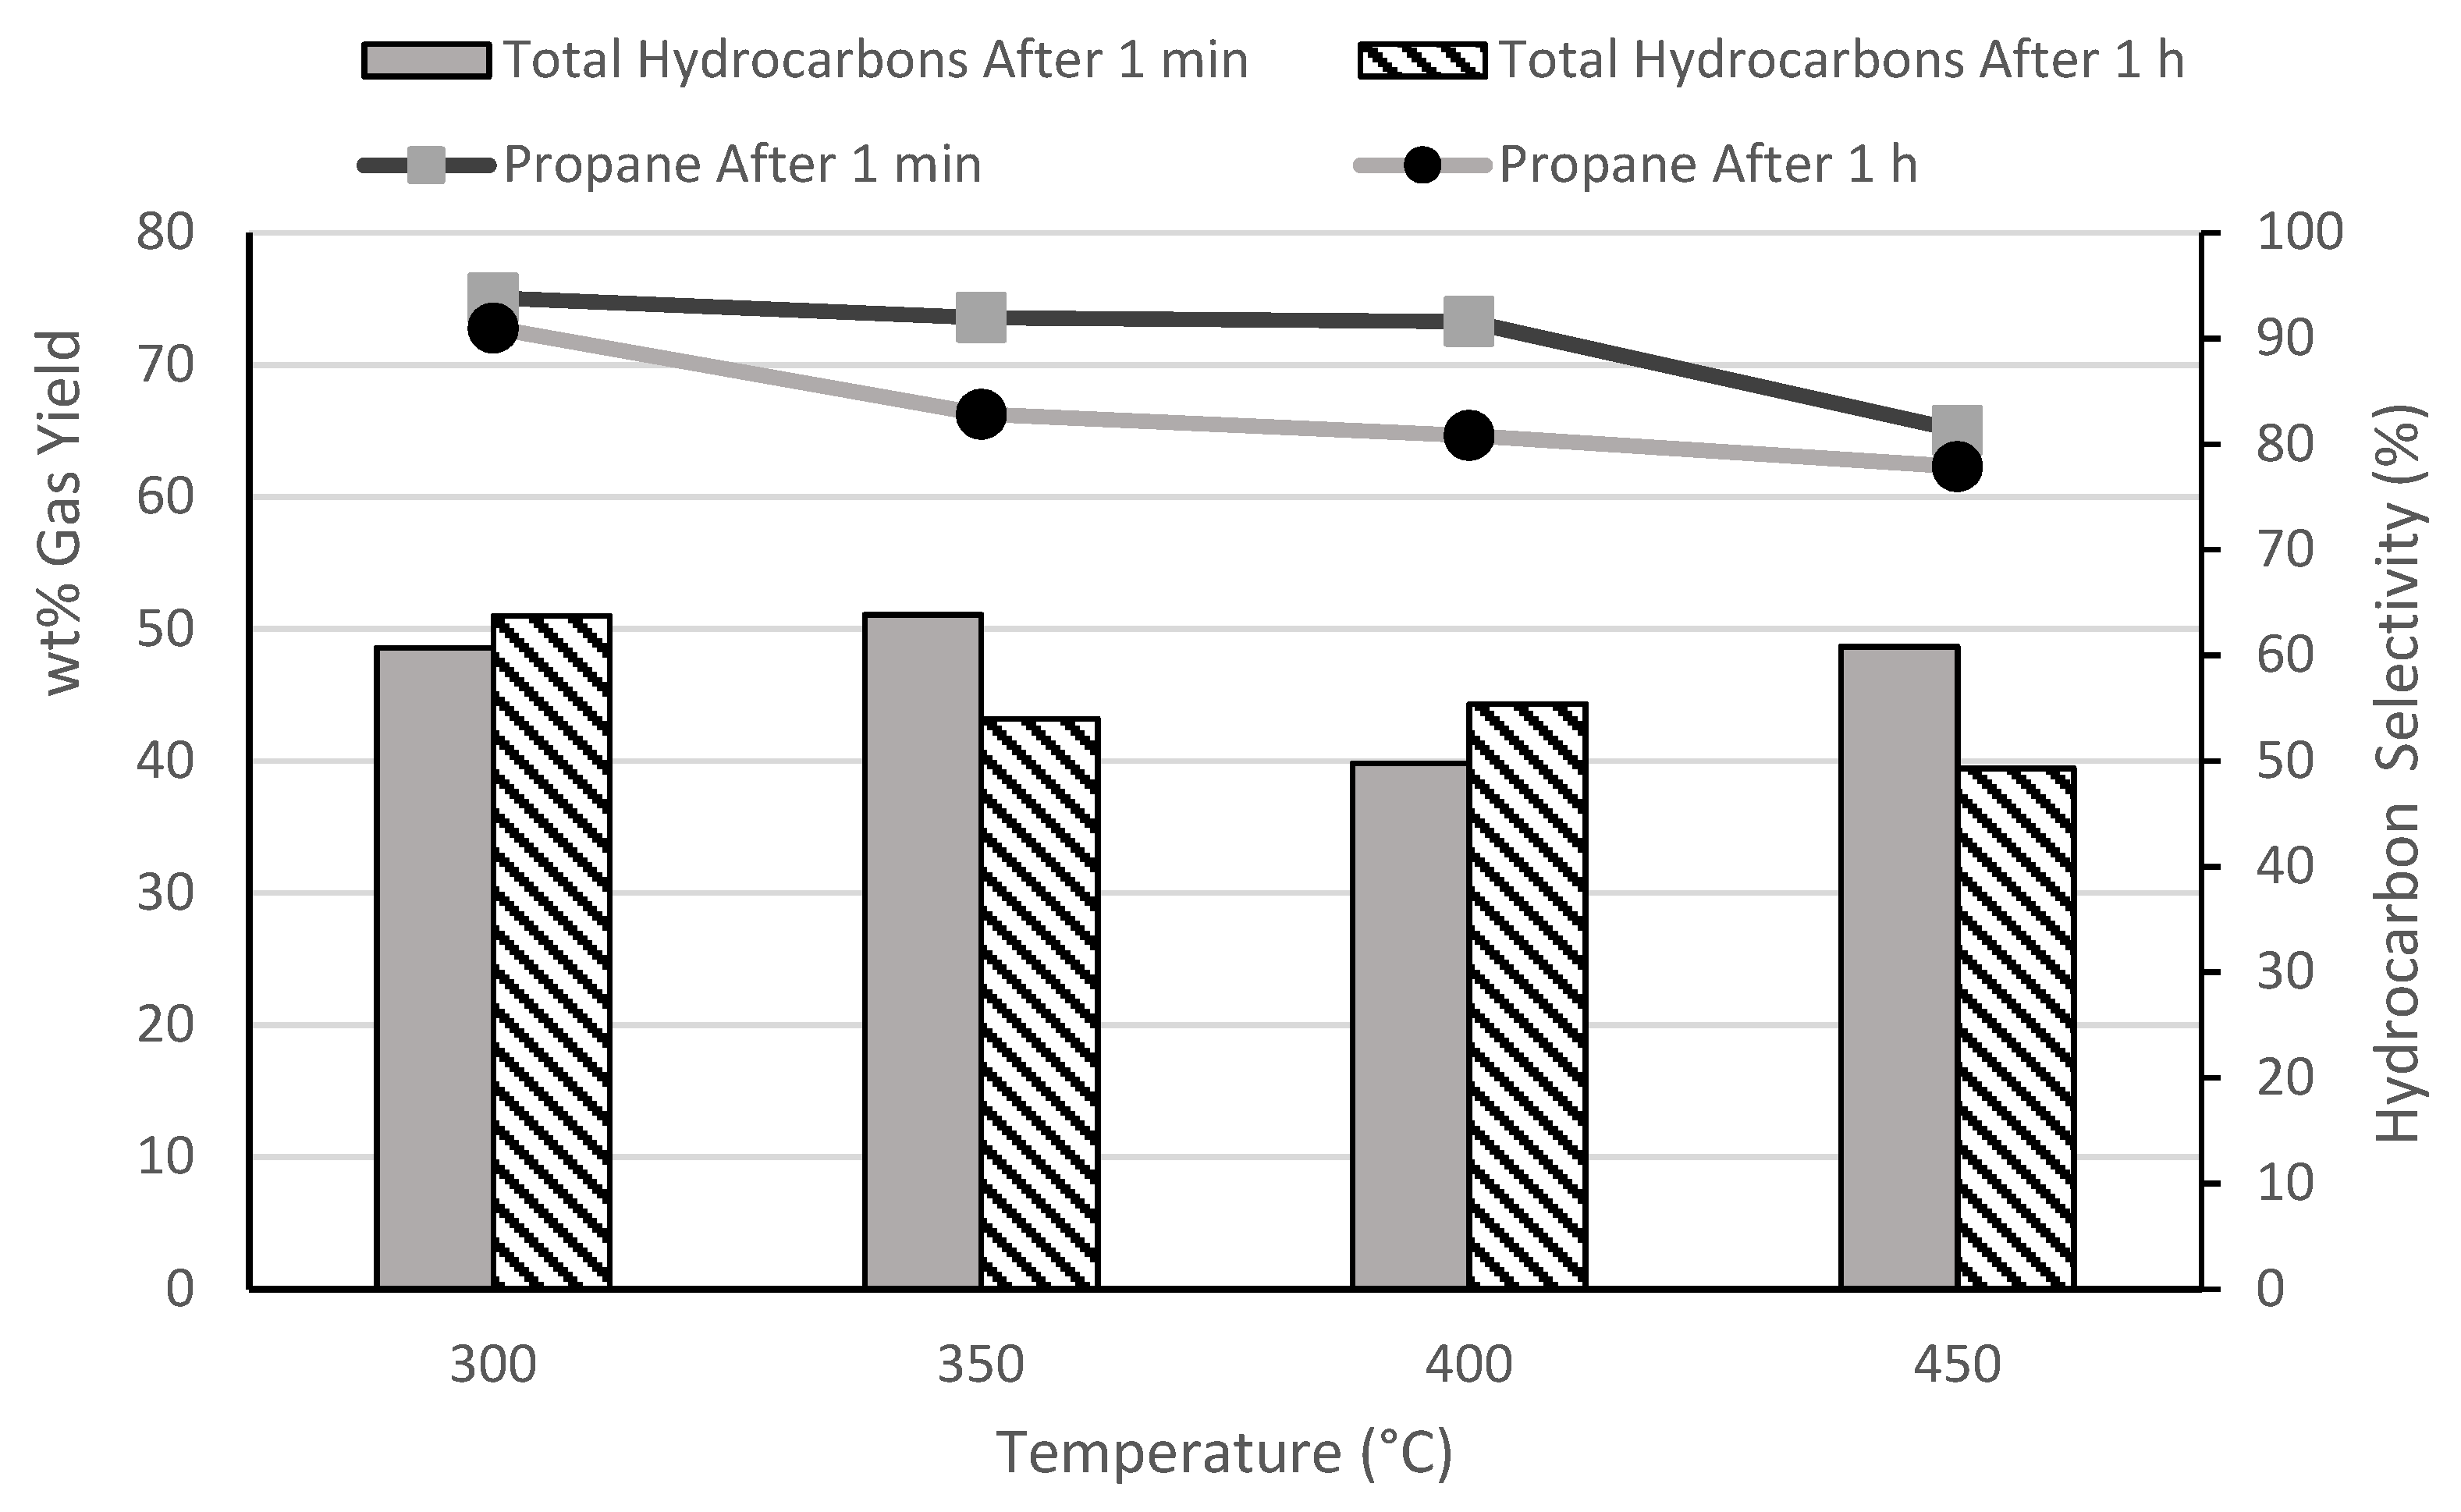
3.2. Effect of Temperature

Initial experiments were carried out to investigate the decarboxylation of butyric acid and yields of products at varying temperatures including 300 °C, 350 °C, 400 °C and 450 °C. Each test involved 0.5 g (0.57 M) of butyric acid and 1.0 g of Pt/C (50 mg of Pt). The experiment was kept at the set reaction temperature for 1 min and also for 1 h. Table 2 shows the main gas products produced from the reaction at different temperatures—propane and CO2, with small yields of methane, ethane and butane. The results from the initial investigation at reaction time of 1 min, showed that the yield of propane was highest at 350 °C. Higher temperatures led to increase in butyric acid conversion but also led to the formation of other hydrocarbon gases such as methane and ethane, due to increased cracking of the main propane product. When the residence time was increased to 1 h, the lower temperature of 300 °C produced the highest yield of propane, even though conversions were >99% in all cases. Again, the increase in temperature at the extended reaction time of 1 h seemed to promote secondary cracking reactions, leading to increased yields of methane and ethane, with methane yield reaching 6.1 wt% at 450 °C.
The total hydrocarbons produced from the reactions are shown in Figure 4, along with the percentage selectivity towards propane. The lower temperatures of 300 °C and 350 °C gave the highest yields of hydrocarbons and also corresponded to the highest hydrocarbon selectivity to propane. The results obtained at lower temperatures (<350 °C) were comparable to those of Yeh, Linic and Savage [23], even with the much higher feed concentrations used in this present study. From the comparison between the two residence times at the different temperatures, it was decided that further reactions would be carried out at the lower temperature of 300 °C as less energy would be required to reach this temperature and less cracking of the gas product occurred at the lower temperature as shown in Table 2.

3.3. Active Catalyst Surface

Thus far, the Pt catalyst has been used as received in the Pt/C form. This was reduced using 5 bar hydrogen inside the batch reactor and then the butyric acid was added under the hydrogen atmosphere to compare the reduced catalyst against the fresh catalyst. Table 3 shows the percentage conversion, hydrocarbons and gas yields of the unreduced and reduced Pt catalyst using 0.5 g butyric acid (0.57 M) and 0.5 g of catalyst (25 mg of Pt and 27.1 mg Pt) at 300 °C with a 1 h reaction time. The percentage butyric acid converted did not differ for the two reduced and fresh catalysts. However, the actual propane yield was higher for the unreduced catalyst as shown in Table 3. Hence, further tests were carried out using the fresh ‘as received’ catalyst for cost savings by avoiding the use of hydrogen for catalyst reduction.

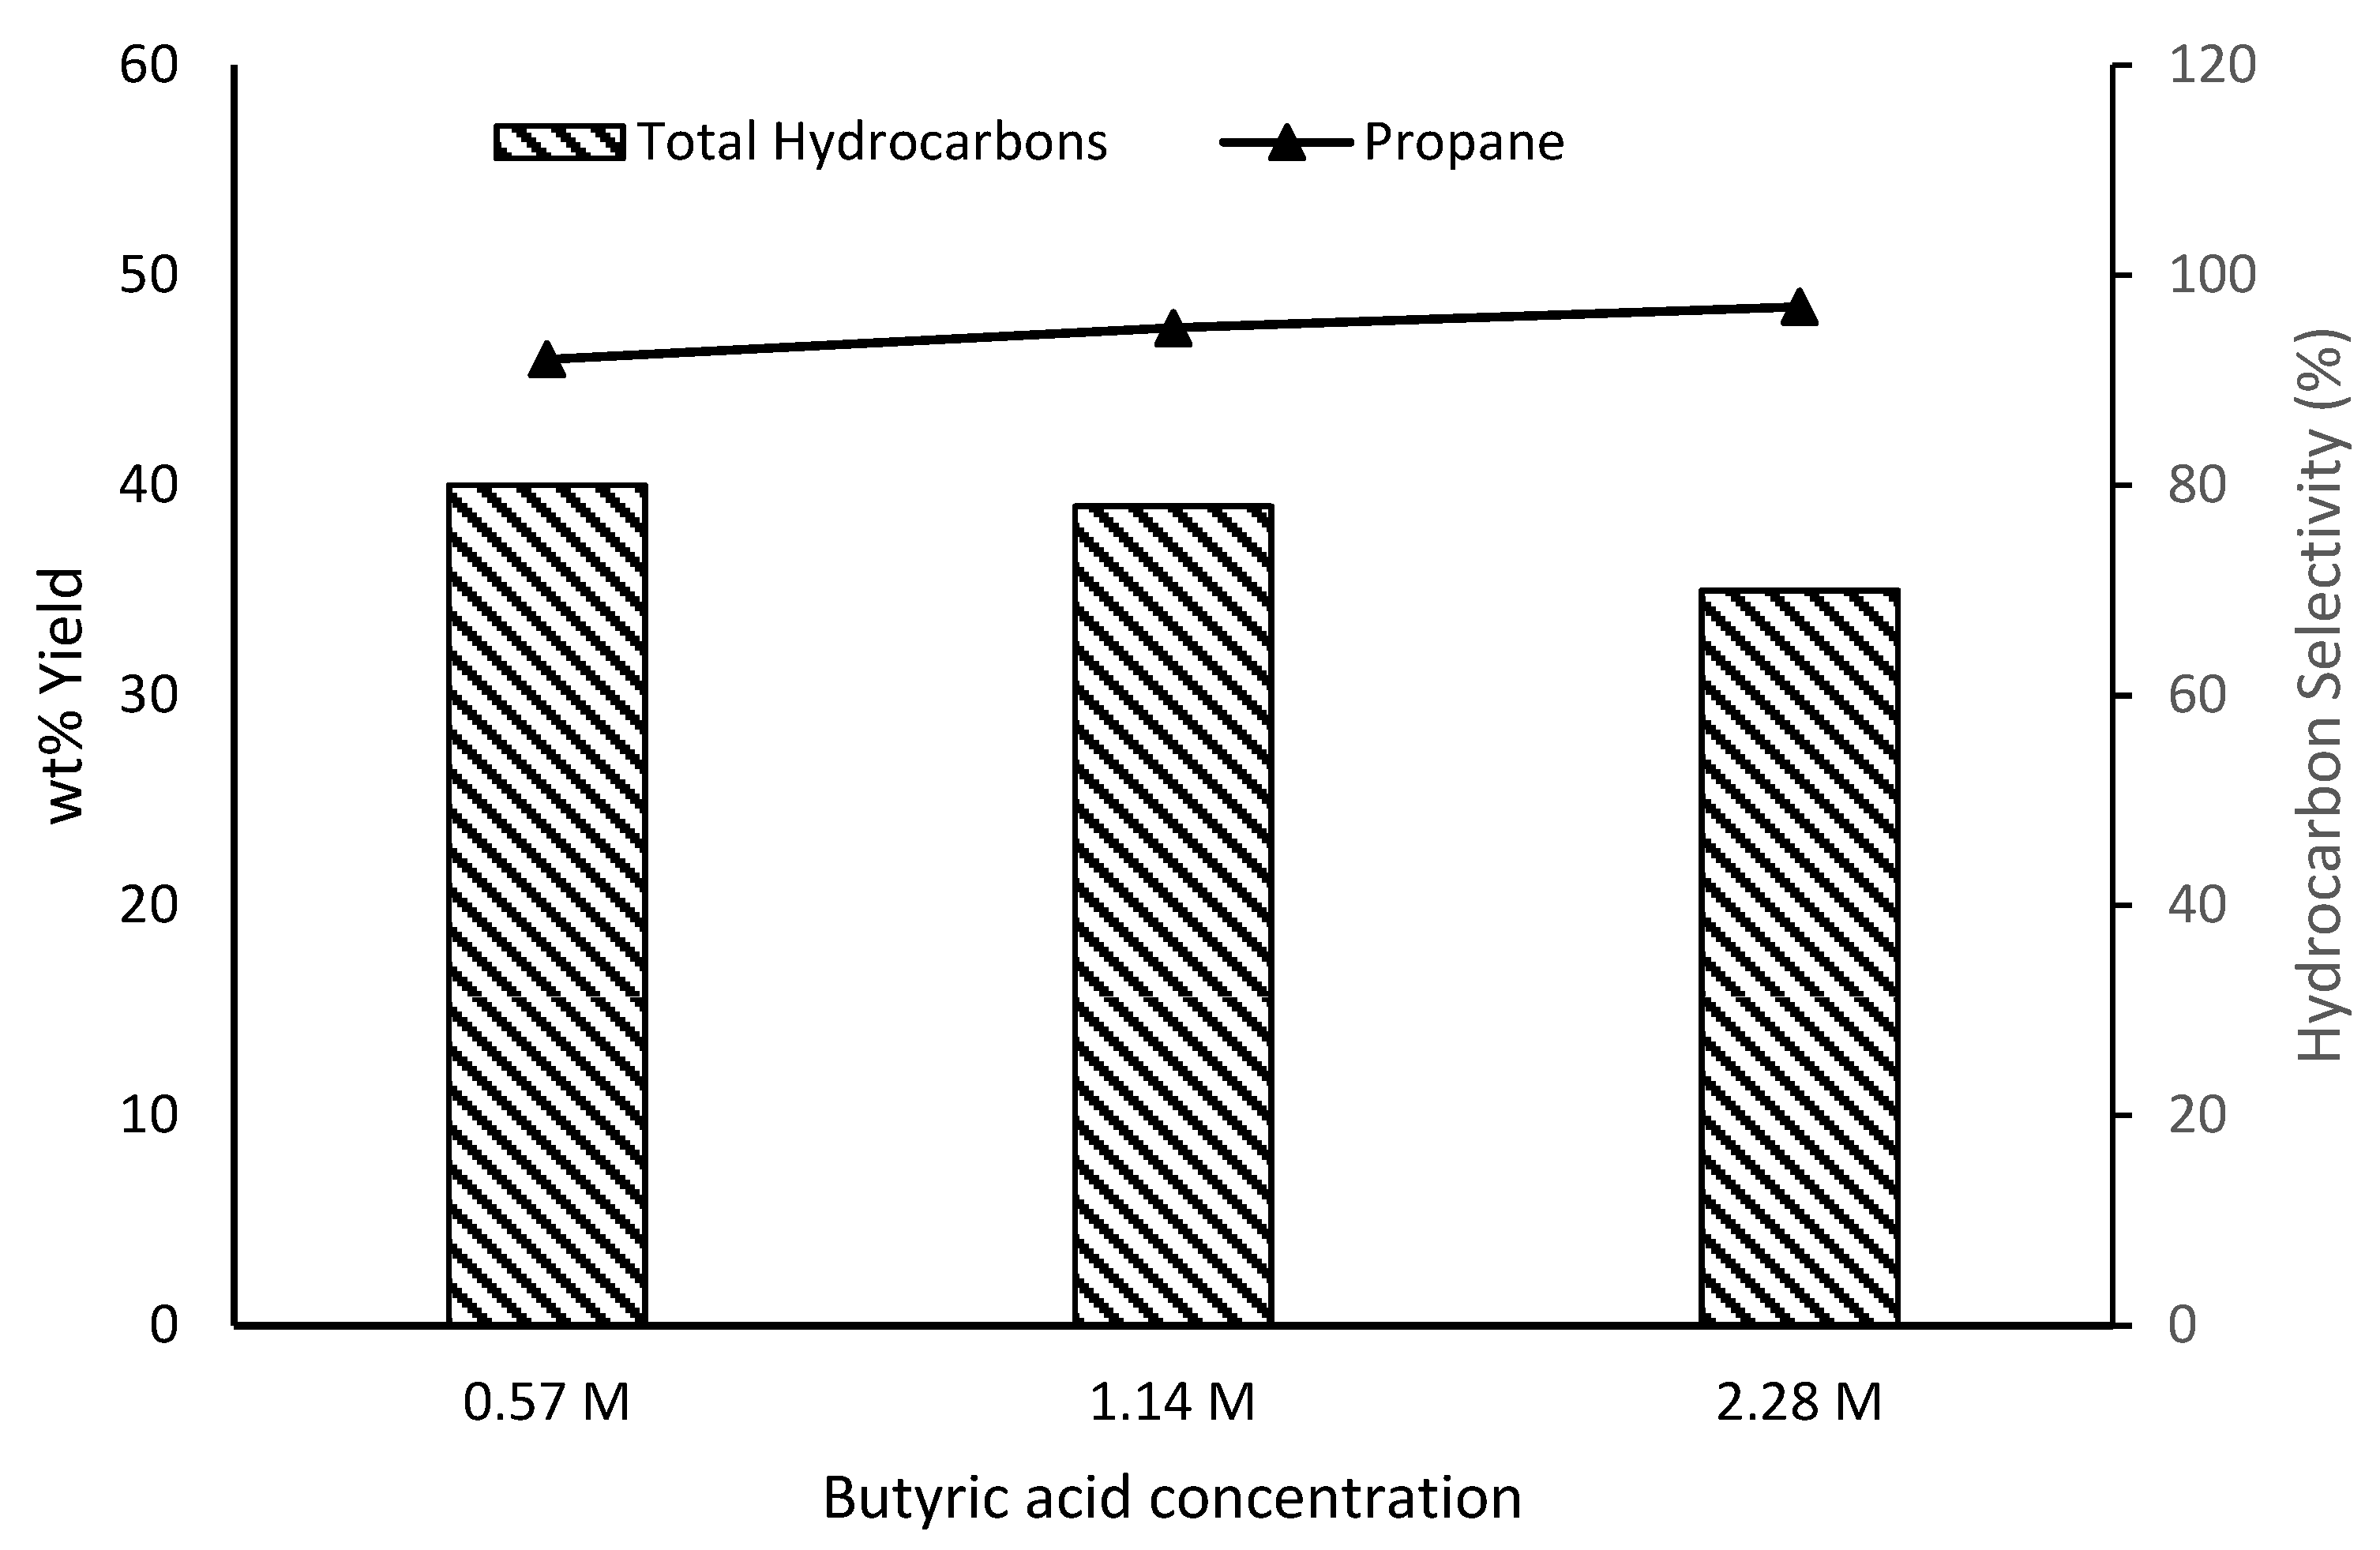
3.4. Effect of Butyric Acid Loading

The effect of varying the butyric acid concentrations was then investigated by altering the loading to 0.5 g, 1.0 g and 2.0 g of butyric acid (0.57 M, 1.14 M and 2.28 M) with 1.0 g of Pt/C (50 mg Pt) at 300 °C and held for 1 h. Table 4 shows the % conversion and yields of the gases produced using the three different butyric acid concentrations. The conversion of the butyric acid was highest at 0.5 g loading (0.57 M). The percentage conversion decreased with the increasing butyric acid concentrations, suggesting overloading of the catalyst active sites, and possibly leading to catalyst deactivating.
Figure 5 shows the total hydrocarbons and propane hydrocarbon selectivity of the three different butyric acid loadings/concentrations. Results showed that there was little difference in the total hydrocarbon yields between the 0.57 M and 1.14 M concentrations of butyric acid, whereas increasing the butyric acid concentration to 2.28 M led to a 12.5% reduction in hydrocarbon yields for the same catalyst loading. For propane selectivity among the hydrocarbon gas products, the use of 0.57 M of butyric acid instead of 1.14 M made little difference. From these results, it was decided that 1.0 g (1.14 M) of butyric acid would be used in further experiments.

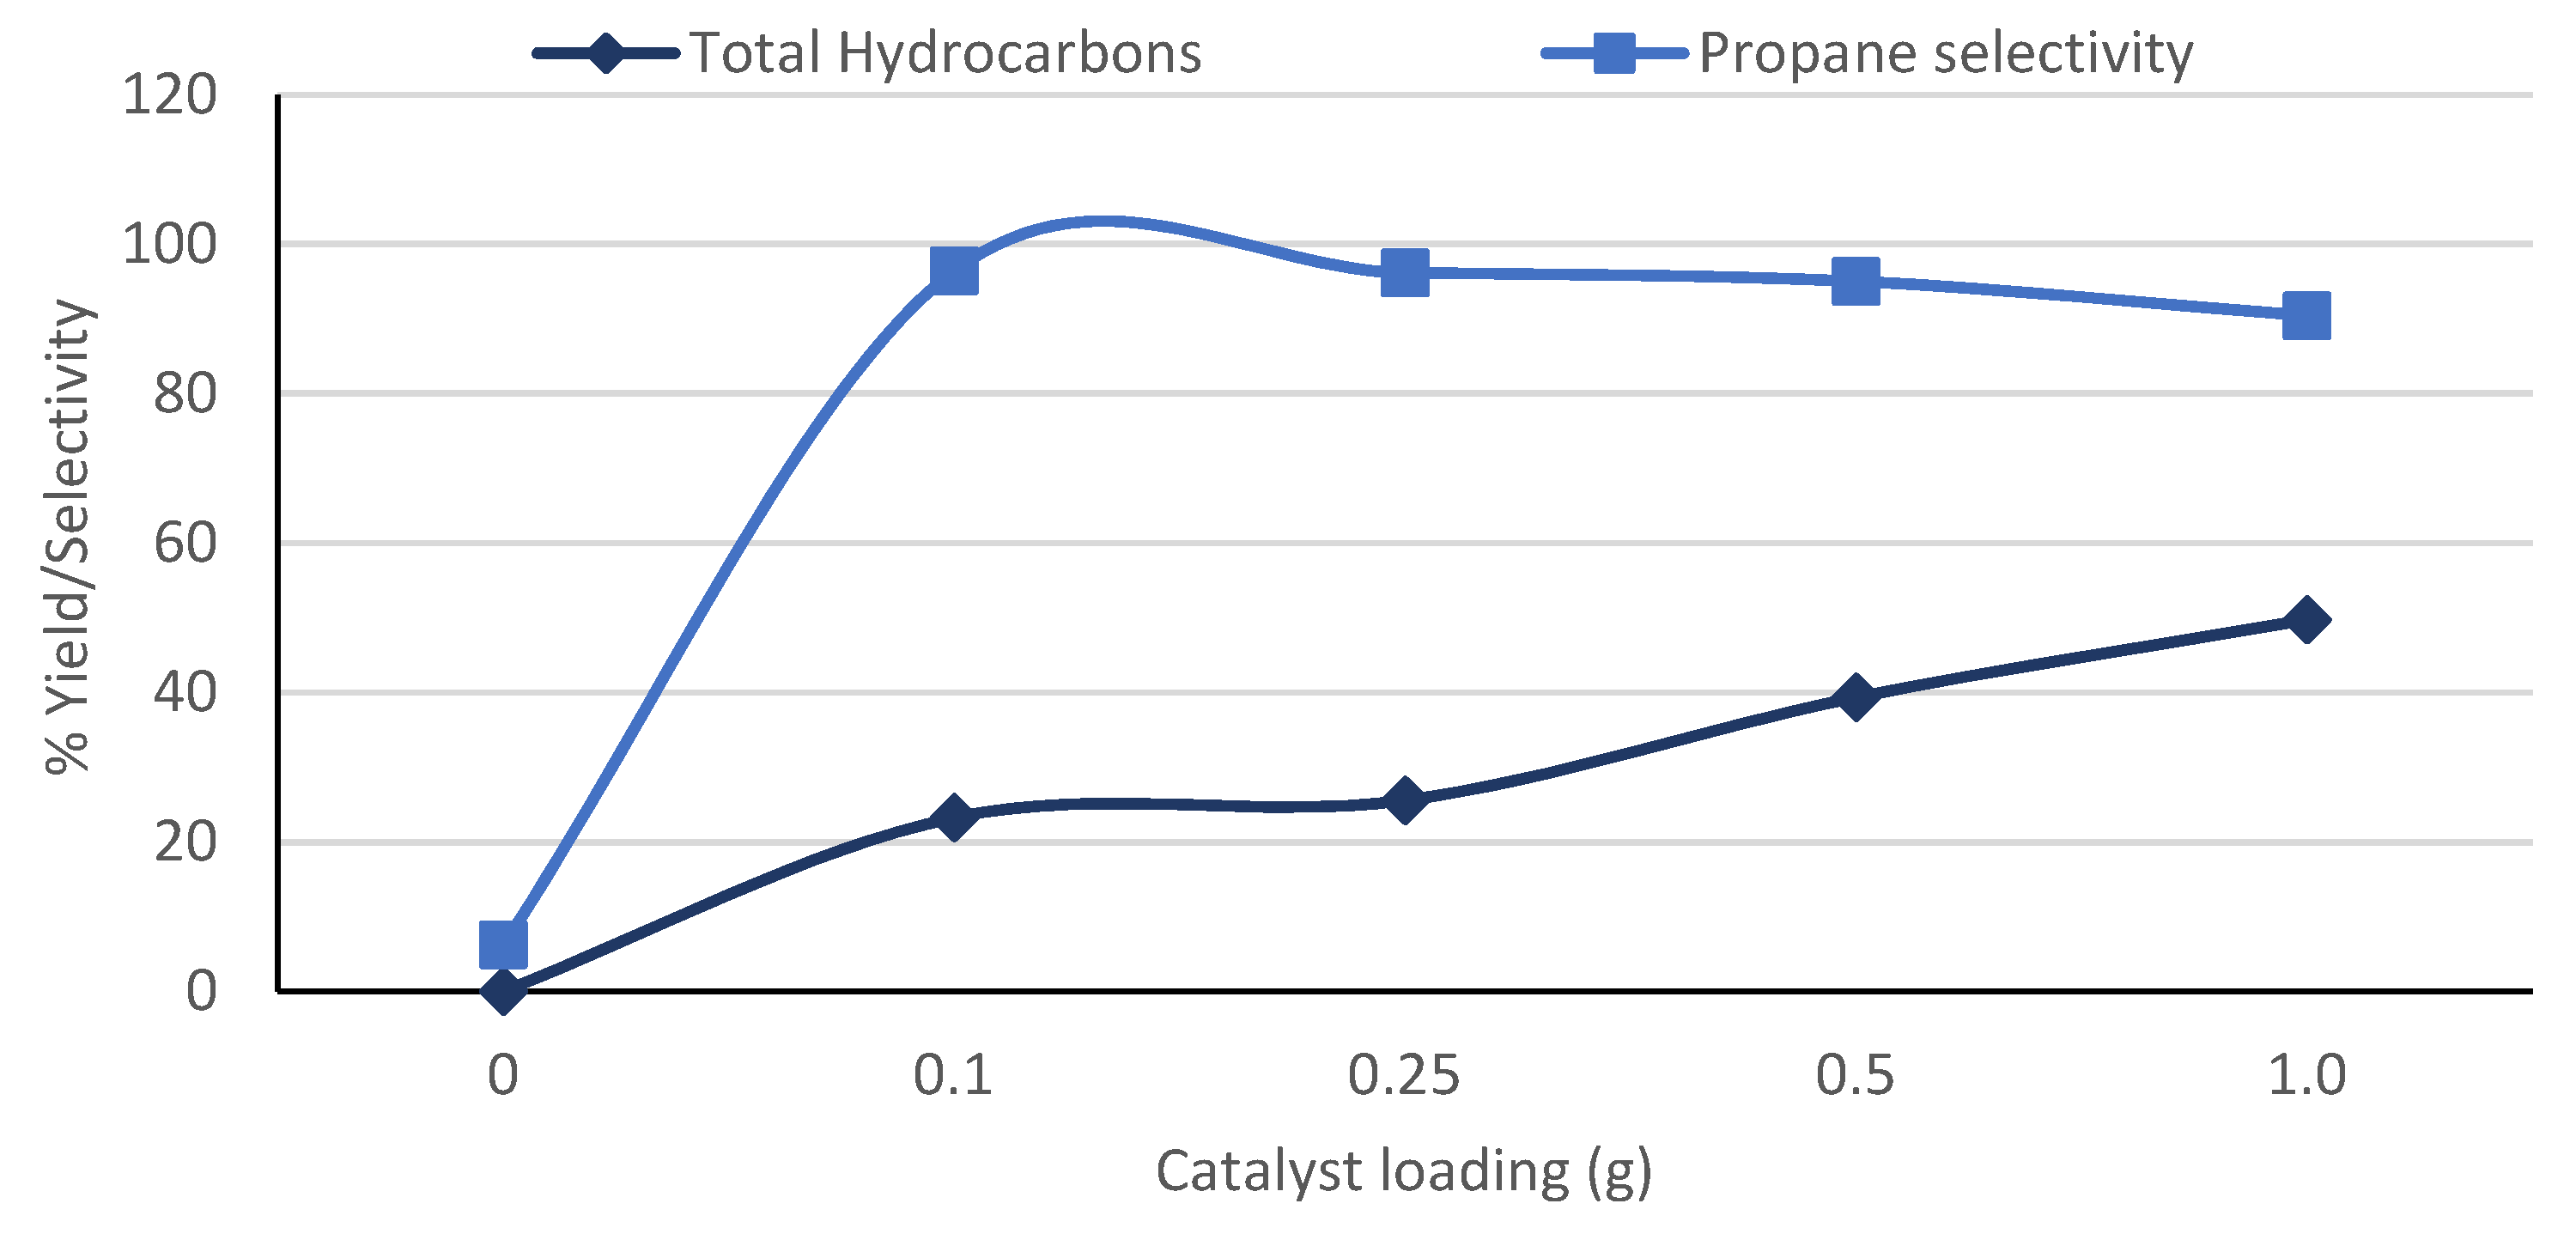
3.5. Effect of Catalyst Loading

The effect of varying the catalyst loading was investigated with 0.10 g, 0.25 g, 0.50 g and 1.00 g of Pt/C (corresponding to 5 mg, 12.5 mg, 25 mg and 50 mg of Pt, respectively) with 1 g of butyric acid (1.14 M) loading at 300 °C, with a reaction time of 1 h. In addition, one set of experiment was also carried out without the Pt/C catalyst. Table 5 shows butyric acid conversion and gas yields. Butyric acid conversion increased significantly and continued to increase with increasing amount of added Pt/C catalyst; however, there was little difference in the amount of butyric acid converted using 0.50 g and 1.00 g of catalyst. Clearly, the propane yield increased with increasing catalyst loading, which confirmed the effect of Pt/C in catalysing the decarboxylation of carboxylic acids [10,15,18,19].
Figure 6 shows the total hydrocarbon yields and hydrocarbon selectivity to propane from the different catalyst loadings. Yields of hydrocarbon increased with increasing amount of Pt/C used as did the yield of propane. However, the selectivity to propane began to decrease above Pt/C loading of 0.5 g, possibly due to increased cracking of propane at higher catalyst loadings. This was corroborated by the increased yields of methane and ethane in the gas products at higher catalyst loadings.

3.6. Effect of Reaction Time with Lower Pt/C Loading

Following the results from effect of catalyst loading, further tests were undertaken to investigate the effect of low catalyst loadings at longer reaction times on the conversion of butyric acid. These tests were carried out by varying the residence time, 1, 4 and 7 h, with 1.0 g butyric acid (1.14 M) at 300 °C with 0.10 g (5 mg Pt) and 0.25 g (12.5 mg Pt) of Pt/C.
Table 6 shows the conversion of the butyric acid and gas yields from the 3 reaction times for both 0.1 g and 0.25 g of Pt/C. The table shows that more butyric acid was converted with the higher catalyst loading (0.25 g). For 0.1 g of catalyst, the amount of butyric acid converted increased with the increasing reaction time, whereas for 0.25 g of catalyst, there was little difference in the conversion of the butyric acid at the three different reaction times. However, the amount of butyric acid converted was consistently higher with 0.25 g Pt/C than when using 0.10 g of the catalyst.
Figure 7 shows the % total hydrocarbons and selectivity to propane. The total hydrocarbons produced and the percentage yield of propane increase with increasing residence time. However, the selectivity to propane was unaffected by the residence time. From these results, it was clear that extended reaction times beyond 4 h did not make much difference to butyric acid conversion and product yields. Nevertheless, the results also confirmed the effect of increasing catalyst loading on the decarboxylation process as previously discussed in Section 3.5.

3.7. Catalyst Reuse

Section 3.1 showed that calcination of the fresh Pt/C catalyst led to the burn-off of the carbon support, and therefore it became clear that calcination was not appropriate for immediate regeneration of catalysts on carbon supports. However, the reuse of catalysts is important to lower processing costs, especially for expensive platinum-based catalysts. In addition, tests carried out at 300 °C and 1 h reaction time gave high conversion of butyric acid, high yields of propane and no char formation. Hence, the reusability of the Pt/C catalyst recovered under this condition was investigated in a total of four cycles. For each cycle, the recovered catalyst was simply dried at 105 °C for 2 h and reused (without calcination). Each experiment involved 1.14 M butyric acid concentration and 1.0 g of Pt/C catalyst.
Table 7 shows the % conversion and gas yields of the runs using the fresh and reused catalysts. For the uncalcined catalyst, there was a reduction in the % of butyric acid converted, which then increased for the consecutive two runs involving the reuse of the same catalyst. Smaller yields of propane resulted from using the recovered catalyst compared with the fresh catalyst, but these differences were marginal. In addition, more CO2 was produced with the reused catalyst in comparison to the fresh catalyst.
Figure 8 shows the % total hydrocarbons and propane selectivity from the tests where the catalyst was reused. For the recovered catalyst, the total hydrocarbons produced was only slightly lower than that of the fresh catalyst. The selectivity to propane was largely unaffected by the reuse of the catalyst. Potential leaching of the Pt into the aqueous phase was investigated using inductively coupled plasma-optical emission spectrometry (ICP-OES). The 3 aqueous residual samples tested gave an average of 0.035 ppm, which was lower than the 0.037 ppm obtained from the nitric acid blank. The results showed no Pt present in the aqueous phase, indicating that the Pt metal in the Pt/C was hydrothermally stable under the conditions of the tests carried out in this present work. Overall, the results from these experiments showed that the catalyst could be used at least four times with similar results. However, further work is required to establish the deactivation potential of this catalyst over extended reaction cycles, preferably in a flow system.
After processing, the catalysts were again characterised using XRD and are shown in Figure 9. The Pt and carbon peaks are shown at 2θ = 39.6 and 26.6°, respectively. The Pt peaks for the recovered catalysts seemed to give higher intensities than the fresh catalyst. The reason for this may be due to the loss of carbon during the reaction or when sampling the reaction solid residues. Clearly, the carbon peak intensity was lower when the recovered catalyst was used compared to the fresh catalyst, possibly due to the exposed Pt phase. This may be explained by pore collapse within the carbon support as reported by Yeh, Linic and Savage [23]. The rather exposed Pt phase may be responsible for the observed increased formation of CO2 from carbon support oxidation.
Using the Scherrer equation showed the crystallite size of the Pt in the fresh and recovered catalyst to be 49.1 nm and 59.2 nm, respectively. The similarity between the crystallite size of the two samples of catalyst showed that there were little changes in the Pt phase, even after four cycles. In addition, the sharp peak at 2θ = 26.5 in the fourth-cycle reused catalyst indicated the presence of graphite when matched on the ICDD’s PDF-2 2012 and ICSD database. This suggested that the carbon could be morphing into graphite with longer exposure to heat and pressure.

4. Conclusions

The work reported here has involved detailed parametric studies of the catalytic decarboxylation of butyric to produce high yields of propane. The highest propane yield was obtained using 0.5 g (0.57 M) of butyric acid and 1 g of Pt/C (50 mg Pt) at 300 °C and 350 °C and 1 min reaction time at temperature. However, under these conditions, butyric acid conversions were 85% and 90%, respectively. Results also showed that to achieve butyric acid conversion of >99%, a longer reaction time (at least 1 h) was needed. With extended reaction time and increasing temperatures, the hydrocarbon selectivity towards propane began to decrease due to increased secondary reactions, especially cracking, which led to increased formation of methane and ethane. Therefore, 300 °C and 1 h residence time were found as optimum conditions for butyric acid conversion and highest hydrocarbon selectivity to propane in the batch reactor used in this work.
Used Pt/C catalyst was dried and reused for a minimum of 4 cycles, without significant loss of activity, even with high butyric acid loading of 1.14 M concentration (1.0 g).
XRD characterisation of the Pt/C catalyst demonstrated that there was little difference between the Pt content of the fresh catalyst and the recovered catalysts after four cycles. However, after the fourth cycle, a slight increase in Pt crystallite size and lowering of carbon peak intensity were observed. Therefore, further tests using the lower temperature conditions of 300 °C in a flow system is required for future work. Re-using the catalyst appeared to affect the morphology of the carbon and results in graphite being formed.

Author Contributions

I.R. contributions included investigation, methodology design, validation, visualisation, and draft paper writing. K.E.S. contributed to project administration, methodology design, validation and paper writing (review and editing). J.A.O. contribution included conceptualisation, funding acquisition, methodology design, supervision, project administration, visualisation and paper writing (review and editing). All authors have read and agreed to the published version of the manuscript.

Funding

The authors thank EPSRC, BBSRC and UK Supergen Bioenergy Hub (EP/S000771/1) who co-funded and supported this research. The funding from SHV Energy, The Netherlands, is also gratefully acknowledged.

Data Availability Statement

All data files generated in Aston will be stored in academics’ secure home folder (H:\ drive) and backed up to the Aston University Central Backup system each night. The backups are kept on tape for a period of up to 2 months. Active research data will be stored in Aston’s recommended unlimited data Box https://aston.account.box.com/login (accessed on 22 May 2021), which is GDPR compliant https://www.box.com/en-gb/gdpr (accessed on 22 May 2021).

Acknowledgments

Authors gratefully acknowledge the help of research and technical colleagues, J. C. Manayil and M. Islam, during XRD analysis.

Conflicts of Interest

Keith Simons, a co-author of the paper, works for SHV Energy (project co-funder) and was involved in design of the study and the decision to publish the results.

References

  1. Goshima, T.; Ikeda, K.; Fukudome, K.; Mizuta, K.; Mitsuyoshi, S.; Tsutsui, T. Conversion of Biomass-Derived Oxygen-Containing Intermediates into Chemical Raw Materials with Zeolite. AMM 2014, 625, 298–305. [Google Scholar] [CrossRef]
  2. De, S.; Saha, B.; Luque, R. Hydrodeoxygenation processes: Advances on catalytic transformations of biomass-derived platform chemicals into hydrocarbon fuels. Bioresour. Technol. 2015, 178, 108–118. [Google Scholar] [CrossRef] [PubMed] [Green Version]
  3. Morgan, T.; Santillan-Jimenez, E.; Harman-Ware, A.E.; Ji, Y.; Grubb, D.; Crocker, M. Catalytic deoxygenation of triglycerides to hydrocarbons over supported nickel catalysts. Chem. Eng. J. 2012, 189, 346−355. [Google Scholar] [CrossRef]
  4. Ni, L.; Xin, J.; Jiang, K.; Chen, L.; Yan, D.; Lu, X.; Zhang, S. One-step conversion of biomass-derived furanics into aromatics by Brønsted acid ionic liquids at room temperature. ACS Sustain. Chem. Eng. 2018, 6, 2541−2551. [Google Scholar] [CrossRef]
  5. Shi, Y.; Xing, E.; Wu, K.; Wang, J.; Yang, M.; Wu, Y. Recent progress on upgrading of bio-oil to hydrocarbons over metal/zeolite bifunctional catalysts. Catal. Sci. Technol. 2017, 7, 2385–2415. [Google Scholar] [CrossRef]
  6. Hollak, S.A.W.; Gosselink, R.W.; van Es, D.S.; Bitter, J.H. Comparison of tungsten and molybdenum carbide catalysts for the hydrodeoxygenation of oleic acid. ACS Catal. 2013, 3, 2837−2844. [Google Scholar] [CrossRef]
  7. Sotelo-Boyas, R.; Liu, Y.; Minowa, T. Renewable diesel production from the hydrotreating of rapeseed oil with Pt/Zeolite and NiMo/Al2O3 catalysts. Ind. Eng. Chem. Res. 2011, 50, 2791−2799. [Google Scholar] [CrossRef]
  8. Liu, Y.; Sotelo-Boyás, R.; Murata, K.; Minowa, T.; Sakanishi, K. Hydrotreatment of Vegetable Oils to Produce Bio-Hydrogenated Diesel and Liquefied Petroleum Gas Fuel over Catalysts Containing Sulfided Ni–Mo and Solid Acids. Energy Fuels 2011, 25, 4675–4685. [Google Scholar] [CrossRef]
  9. Johnson, E. Process technologies and projects for BioLPG. Energies 2019, 12, 250. [Google Scholar] [CrossRef] [Green Version]
  10. Fu, J.; Lu, X.; Savage, P.E. Hydrothermal decarboxylation and hydrogenation of fatty acids over Pt/C. ChemSusChem 2011, 4, 481–486. [Google Scholar] [CrossRef] [Green Version]
  11. Immer, J.G.; Lamb, H.H. Fed-Batch Catalytic deoxygenation of free fatty acids. Energy Fuels 2010, 24, 5291–5299. [Google Scholar] [CrossRef]
  12. López-Garzón, C.S.; Straathof, A.J. Recovery of carboxylic acids produced by fermentation. Biotechnol. Adv. 2014, 32, 873–904. [Google Scholar] [CrossRef] [PubMed]
  13. Peterson, E.C.; Daugulis, A.J. Demonstration of in situ product recovery of butyric acid via CO2-facilitated pH swings and medium development in two-phase partitioning bioreactors. Biotechnol. Bioeng. 2014, 111, 537–544. [Google Scholar] [CrossRef] [PubMed]
  14. Chun, J.; Choi, O.; Sang, B.-I. Enhanced extraction of butyric acid under high-pressure CO2 conditions to integrate chemical catalysis for value-added chemicals and biofuels. Biotechnol. Biofuels 2018, 11, 119–126. [Google Scholar] [CrossRef]
  15. Hossain, M.Z.; Chowdhury, M.B.I.; Jhawar, A.K.; Xu, W.Z.; Biesinger, M.C.; Charpentier, P.A. Continuous hydrothermal decarboxylation of fatty acids and their derivatives into liquid hydrocarbons using Mo/Al2O3 catalyst. ACS Omega 2018, 3, 7046–7060. [Google Scholar] [CrossRef] [Green Version]
  16. Santillan-Jimenez, E.; Crocker, M. Catalytic deoxygenation of fatty acids and their derivatives to hydrocarbon fuels via decarboxylation/decarbonylation. J. Chem. Technol. Biotechnol. 2012, 87, 1041–1050. [Google Scholar] [CrossRef]
  17. Chen, L.; Zhu, Y.; Zheng, H.; Zhang, C.; Zhang, B.; Li, Y. Aqueous-phase hydrodeoxygenation of carboxylic acids to alcohols or alkanes over supported Ru catalysts. J. Mol. Catal. A Chem. 2011, 351, 217–227. [Google Scholar] [CrossRef]
  18. Fu, J.; Lu, X.; Savage, P.E. Catalytic hydrothermal deoxygenation of palmitic acid. Energy Environ. Sci. 2010, 3, 311–317. [Google Scholar] [CrossRef]
  19. Hossain, M.Z.; Chowdhury, M.B.I.; Jhawar, A.K.; Xu, W.Z.; Charpentier, P.A. Continuous low-pressure decarboxylation of fatty acids to fuel-range hydrocarbons with in situ hydrogen production. Fuel 2018, 212, 470–478. [Google Scholar] [CrossRef]
  20. Yeh, T.M.; Hockstad, R.L.; Linic, S.; Savage, P.E. Hydrothermal decarboxylation of unsaturated fatty acids over PtSnx/C catalysts. Fuel 2015, 156, 219–224. [Google Scholar] [CrossRef]
  21. WPLGA. Bio-LPG Charter of Benefits. 2021. Available online: https://www.wlpga.org/wp-content/uploads/2021/03/BioLPG-Charter-of-Benefits.pdf (accessed on 22 May 2021).
  22. Antonini, C.; Treyer, K.; Streb, A.; van der Spek, M.; Bauer, C.; Mazzotti, M. Hydrogen production from natural gas and biomethane with carbon capture and storage—A techno-environmental analysis. Sustain. Energy Fuels 2020, 4, 2967–2986. [Google Scholar] [CrossRef] [Green Version]
  23. Yeh, T.; Linic, S.; Savage, P.E. Deactivation of Pt catalysts during hydrothermal decarboxylation of butyric acid. ACS Sustain. Chem. Eng. 2014, 2, 2399–2406. [Google Scholar] [CrossRef]
  24. Borges, A.C.P.; Onwudili, J.A.; Andrade, H.M.C.; Alves, C.T.; Ingram, A.; Vieira de Melo, S.A.B.; Torres, E.A. Catlaytic supercritical water gasification of eucalyptus wood chips in a batch reactor. Fuel 2019, 255, 115804–115812. [Google Scholar] [CrossRef]
  25. Euopean Economic Community. Commission Regulation (EEC) No 2568/91 of 11 July 1991 on the Characteristics of Olive Oil and Olive-Residue Oil and on the Relevant Methods of Analysis; European Union: Brussels, Belgium, 1991. [Google Scholar]
  26. Taylor, M.J.; Beaumont, S.K.; Islam, M.J.; Tsatsos, S.; Parlett, C.A.M.; Issacs, M.A.; Kyriakou, G. Atom efficient PtCu bimetallic catalysts and ultra dilute alloys for the selective hydrogenation of furfural. Appl. Catal. B Environ. 2021, 284, 119737–119746. [Google Scholar] [CrossRef]
  27. ASTM. D3174-12(2018)e1. Standard Test Method for Ash in the Analysis Sample of Coal and Coke from Coal; ASTM International: West Conshohocken, PA, USA, 2018. [Google Scholar]
Figure 1. Product analysis scheme (XRD: x-ray diffractometer; GC/TCD/FID: gas chromatograph fitted with thermal conductivity detector and flame ionisation detector).
Energies 14 03316 g001
Figure 2. XRD spectra of the fresh uncalcined and fresh calcined Pt/C.
Energies 14 03316 g002
Figure 3. Nitrogen adsorption and desorption isotherms of the fresh Pt/C catalyst.
Energies 14 03316 g003
Figure 4. Effect of temperature at 1 min and 1 h residence time (0.5 g butyric acid; 10 mL water and 1.0 g Pt/C (50 mg Pt metal content)).
Energies 14 03316 g004
Figure 5. Effect of butyric acid loading with 0.5 g Pt/C at 300 °C after 1 h reaction time.
Energies 14 03316 g005
Figure 6. Effect of bulk Pt/C catalyst loading with 1.0 g butyric acid (1.14 M) at 300 °C after 1 h reaction time.
Energies 14 03316 g006
Figure 7. Effect of residence times (h) with 0.10 g and 0.25 g of bulk Pt/C with 1.0 g (1.14 M) butyric acid at 300 °C.
Energies 14 03316 g007
Figure 8. Reusability of catalyst with a 1:1 mass ratio of butyric acid to bulk Pt/C at 300 °C for 1 h.
Energies 14 03316 g008
Figure 9. XRD spectra of fresh and used catalysts from one run after calcination and after three runs uncalcined.
Energies 14 03316 g009
Table 1. Experimental parameters.
Temperature (°C)Residence Time Butyric Acid Loading (g)Catalyst Loading (g)
3000 min0.50.10
3501 h10.25
4004 h20.50
4507 h-1.00
Table 2. Effect of temperature on the butyric acid conversion and gas yields from reaction times of 0 and 1 h.
Temperature (°C)
Reaction TimeConversion/
Component Yields
300350400450
1 minConversion (%)859094100
Hydrogen (%)0.170.260.240.5
Methane (%)0.30.80.74.9
Ethane (%)2.42.92.43.5
Propane (%)45.647.036.539.5
Butane (%)0.10.10.10.1
CO2 (%)36.138.954.558.2
1 hConversion (%)1009999100
Hydrogen (%)0.150.150.450.58
Methane (%)1.03.05.06.1
Ethane (%)3.44.22.92.0
Propane (%)46.435.835.830.7
Butane (%)0.10.10.10.1
CO2 (%)49.155.554.057.3
Table 3. Effect of catalyst reduction on the butyric acid conversion and gas product yields.
Catalyst Type
Conversion/
Component Yields
UnreducedReduced
Conversion (%)10099
Methane (%)0.60.4
Ethane (%)2.31.3
Propane (%)37.331.9
Butane (%)0.10.1
CO2 (%)67.569.6
Total hydrocarbons 40.439.9
Propane hydrocarbon selectivity 92.294.2
Table 4. Effect of butyric acid loading on butyric acid conversion and gas product yields.
Butyric Acid Loading (g)
Conversion/
Component Yields
0.5 (0.57 M)1.0 (1.14 M)2.0 (2.28 M)
Conversion (%)1008573
Methane (%)0.60.20.1
Ethane (%)2.31.50.9
Propane (%)37.337.433.9
Butane (%)0.10.10.1
CO2 (%)67.545.738.1
Table 5. Effect of catalyst loading on the conversion of butyric acid and gas yields after 1 h reaction time.
Catalyst Loading (g)
Conversion/
Component Yields
None0.10.250.51.0
Conversion (%)233668587
Methane (%)0.00.10.10.20.8
Ethane (%)0.00.60.71.53.8
Propane (%)0.022.424.637.445.0
Butane (%)0.00.00.00.10.1
CO2 (%)2.710.140.045.736.8
Table 6. Effect of residence time on butyric acid conversion and gas yields using 0.1 g and 0.25 g Pt/C catalyst.
Residence Time (h)
Catalyst
Loading
Conversion/
Components Yields
147
0.1 g Pt/CConversion (%)335355
Methane (%)0.10.10.1
Ethane (%)0.60.81
Propane (%)22.430.932
Butane (%)000
CO2 (%)10.120.821.9
0.25 g Pt/CConversion (%)666565
Methane (%)0.10.10.2
Ethane (%)0.711.2
Propane (%)24.632.635.2
Butane (%)000
CO2 (%)4031.328.6
Table 7. Effect of catalyst reuse on butyric acid conversion and gas yields.
Catalyst Reuse
Conversion/
Component Yields
FreshUncalcined 1Uncalcined 2Uncalcined 3
Conversion (%)78869295
Methane (%)0.30.30.30.2
Ethane (%)1.71.51.81.5
Propane (%)41.239.539.135.4
Butane (%)0.10.10.10.1
CO2 (%)34.744.650.957.1
Publisher’s Note: MDPI stays neutral with regard to jurisdictional claims in published maps and institutional affiliations.

