Article

Modeling and Analysis of the Power Conditioning Circuit for an Electromagnetic Human Walking-Induced Energy Harvester

1
Department of Process Control, Faculty of Mechanical Engineering and Robotics, AGH University of Science and Technology, al. Mickiewicza 30, 30-059 Kraków, Poland
2
Department of Robotics and Mechatronics, Faculty of Mechanical Engineering and Robotics, AGH University of Science and Technology, al. Mickiewicza 30, 30-059 Kraków, Poland
*
Author to whom correspondence should be addressed.
Energies 2021, 14(12), 3367; https://doi.org/10.3390/en14123367
Submission received: 10 May 2021 / Revised: 31 May 2021 / Accepted: 7 June 2021 / Published: 8 June 2021

Abstract

:
Among the various alternative energy sources, harvesting energy from the movement of the human body has emerged as a promising technology. The interaction between the energy harvesting structure and the power conditioning circuit is nonlinear in nature, which makes selecting the appropriate design parameters a complex task. In this work, we present an electromagnetic energy harvesting system suitable for recovering energy from the movement of the lower limb joints during walking. The system under study is modeled and simulated, considering three different scenarios in which the energy source is the hip, knee, and ankle joint. The power generated by the energy harvester is estimated from kinematic data collected from an experimental gait study on a selected participant. State-space representation and Recurrence plots (RPs) are used to study the dynamical system’s behavior resulting from the interaction between the electromagnetic structure and the power conditioning circuit. The maximum power obtained through the simulation considering a constant walking speed of 4.5 km/h lays in the range of 1.4 mW (ankle joint) to 90 mW (knee joint) without implementing a multiplier gear.

1. Introduction

In recent years, as a result of the wide usage of small-scale electronic devices, the requirement for portable and efficient energy sources has been increasing. The energy demanded by portable electronic devices is conventionally supplied by batteries. However, the energy stored in the batteries is limited, which leads to the need to recharge it after a limited period of operation or eventually replace it [1]. This fact entails an important limitation for portable electronic devices, mainly when the user performs fieldwork and cannot guarantee the supply of electrical energy. As a consequence of this situation, alternative methods for supplying portable electronic devices are explored. Energy harvesting from human body motion has become a promising technology for powering portable electronic devices [2]. Numerous investigations have estimated the energy associated with the motion of the joints of the human body during daily activities [3].
Among the daily activities performed by an average person, walking is one of the most engaging activities to recover energy. During walking, lower limb muscles perform positive and negative work to accelerate and decelerate the movements. These movements have been widely studied, and researchers know well the angular displacements, velocities, and accelerations of each joint during walking. Numerous walking-based energy harvesters have been designed, employing mainly electromagnetic, electrostatic, and piezoelectric transducers [4]. Donelan et al. [5] developed an energy harvester consisting of an orthopedic knee brace. The knee joint drives a gear train in the proposed device, transmitting the knee extension movement at adequate speeds to a DC brushless motor. The motor serves as a generator producing an average of 5 watts of electricity. Liu et al. [6] proposed a rotational energy harvester consisting of a permanent magnet rotor and a set of coils embedded in a fixed housing. This device does not implement any complex transmission mechanism and produces a maximum output power of 10.4 mW at a driving frequency of 8 Hz and a load resistance of 100 Ω. Furthermore, Lin et al. [7] proposed a rotating energy harvester with a rotor made of neodymium iron and a stator consisting of permanent magnets. This energy harvester obtained a maximum measured output voltage of 1.92 V and a power density of 0.92 mW/cm3.
Conventionally, an energy harvesting system consists of three components: a harvester structure that usually generates an alternating current according to selected phenomena; a power conditioning circuit that rectifies and modulates the output voltage; and the electric load. The impedance characteristic of the power conditioning circuit influences the performance of the energy harvester structure [8]. However, the interaction between these components is not considered in most of the energy harvesting devices found in the literature [9]. Among the different power conditioning circuits, classical switching regulators have the advantage of not suffering low inherent efficiency as linear regulators do. The interaction between the energy harvesting structure and the power conditioning circuit is nonlinear in nature, which makes selecting the appropriate design parameters a complex task. To approach this issue, many studies have investigated the effect of the power conditioning circuit on the power generated by energy harvesting devices, assuming that the impedance of the electrical circuit has a constant value that depends on the circuit components and the PWM duty cycle [10,11]. Although the circuit equivalent resistance concept offers a simple approach for predicting the output power of the energy harvesting system, this approach ignores the nonlinearities that the power conditioning circuit adds to the system.
Understanding the interaction between the energy harvester structure and power conditioning is crucial for developing an energy harvesting system. However, up to now, little has been reported on modeling energy harvesting devices where nonlinearities associated with the power conditioning circuit are taken into account. Therefore, this paper aims to model and analyze the performance of an electromagnetic energy harvesting system suitable for harvesting energy while walking, in which the nonlinearities originated by the switching converter are considered. The numerical modeling of the power conditioning circuit is used to predict the harvested power. Within the model, the energy harvesting structure is attached to the human lower limb. The performance of the energy harvesting structure is evaluated and compared, considering the various joints of the lower limb. The location and configuration of the attached electromagnetic transducer are shown in Figure 1a. There is scattered information on the amount of energy collected from the hip, knee, and ankle joints obtained by different research groups using devices of different parameters in the literature. The novelty of the conducted experimental study consists of acquiring the kinematic data of the lower limb joints by conducting an experimental gait study and using the collected data to predict and analyze the system’s dynamic response by implementing state-space averaging representation and applying recurrence plots (RPs) and RQA methods. Likewise, an analysis of the influence of the duty cycle and the load resistance was carried out in order to estimate the maximum energy captured by the system. In the research carried out, the application of the recurrence analysis seems to be natural due to the cyclic character of the analyzed system motion. Moreover, it provides the possibility of analyzing the system dynamic properties on the basis of measured time histories of system responses only.

2. System Description and Modeling

The structure of the comprehensive system consisting of an electromagnetic energy harvester and the power conditioning circuit is shown in Figure 1b. For this application, the chosen electromagnetic transducer is a translational device of a tubular shape composed of permanent magnets that move inside a set of air coils. The kinetic energy associated with the angular motion of the lower limb joints is transformed into electrical energy because of the principle of electromagnetic induction.
The output voltage of the electromagnetic transducer is rectified, amplified, and smoothed before being supplied to the electrical load by the implementation of a power interface conditioning circuit. The role of the power conditioning circuit is to bring the output voltage to the desired level by adjusting the duty cycle of the switching converter. However, adding an extra impedance to the system influences the performance of the comprehensive system. Since the interaction between the energy harvesting structure and the power conditioning circuit has a nonlinear character, the system is modeled through the state-space averaging method.

2.1. Electromechanical Modeling

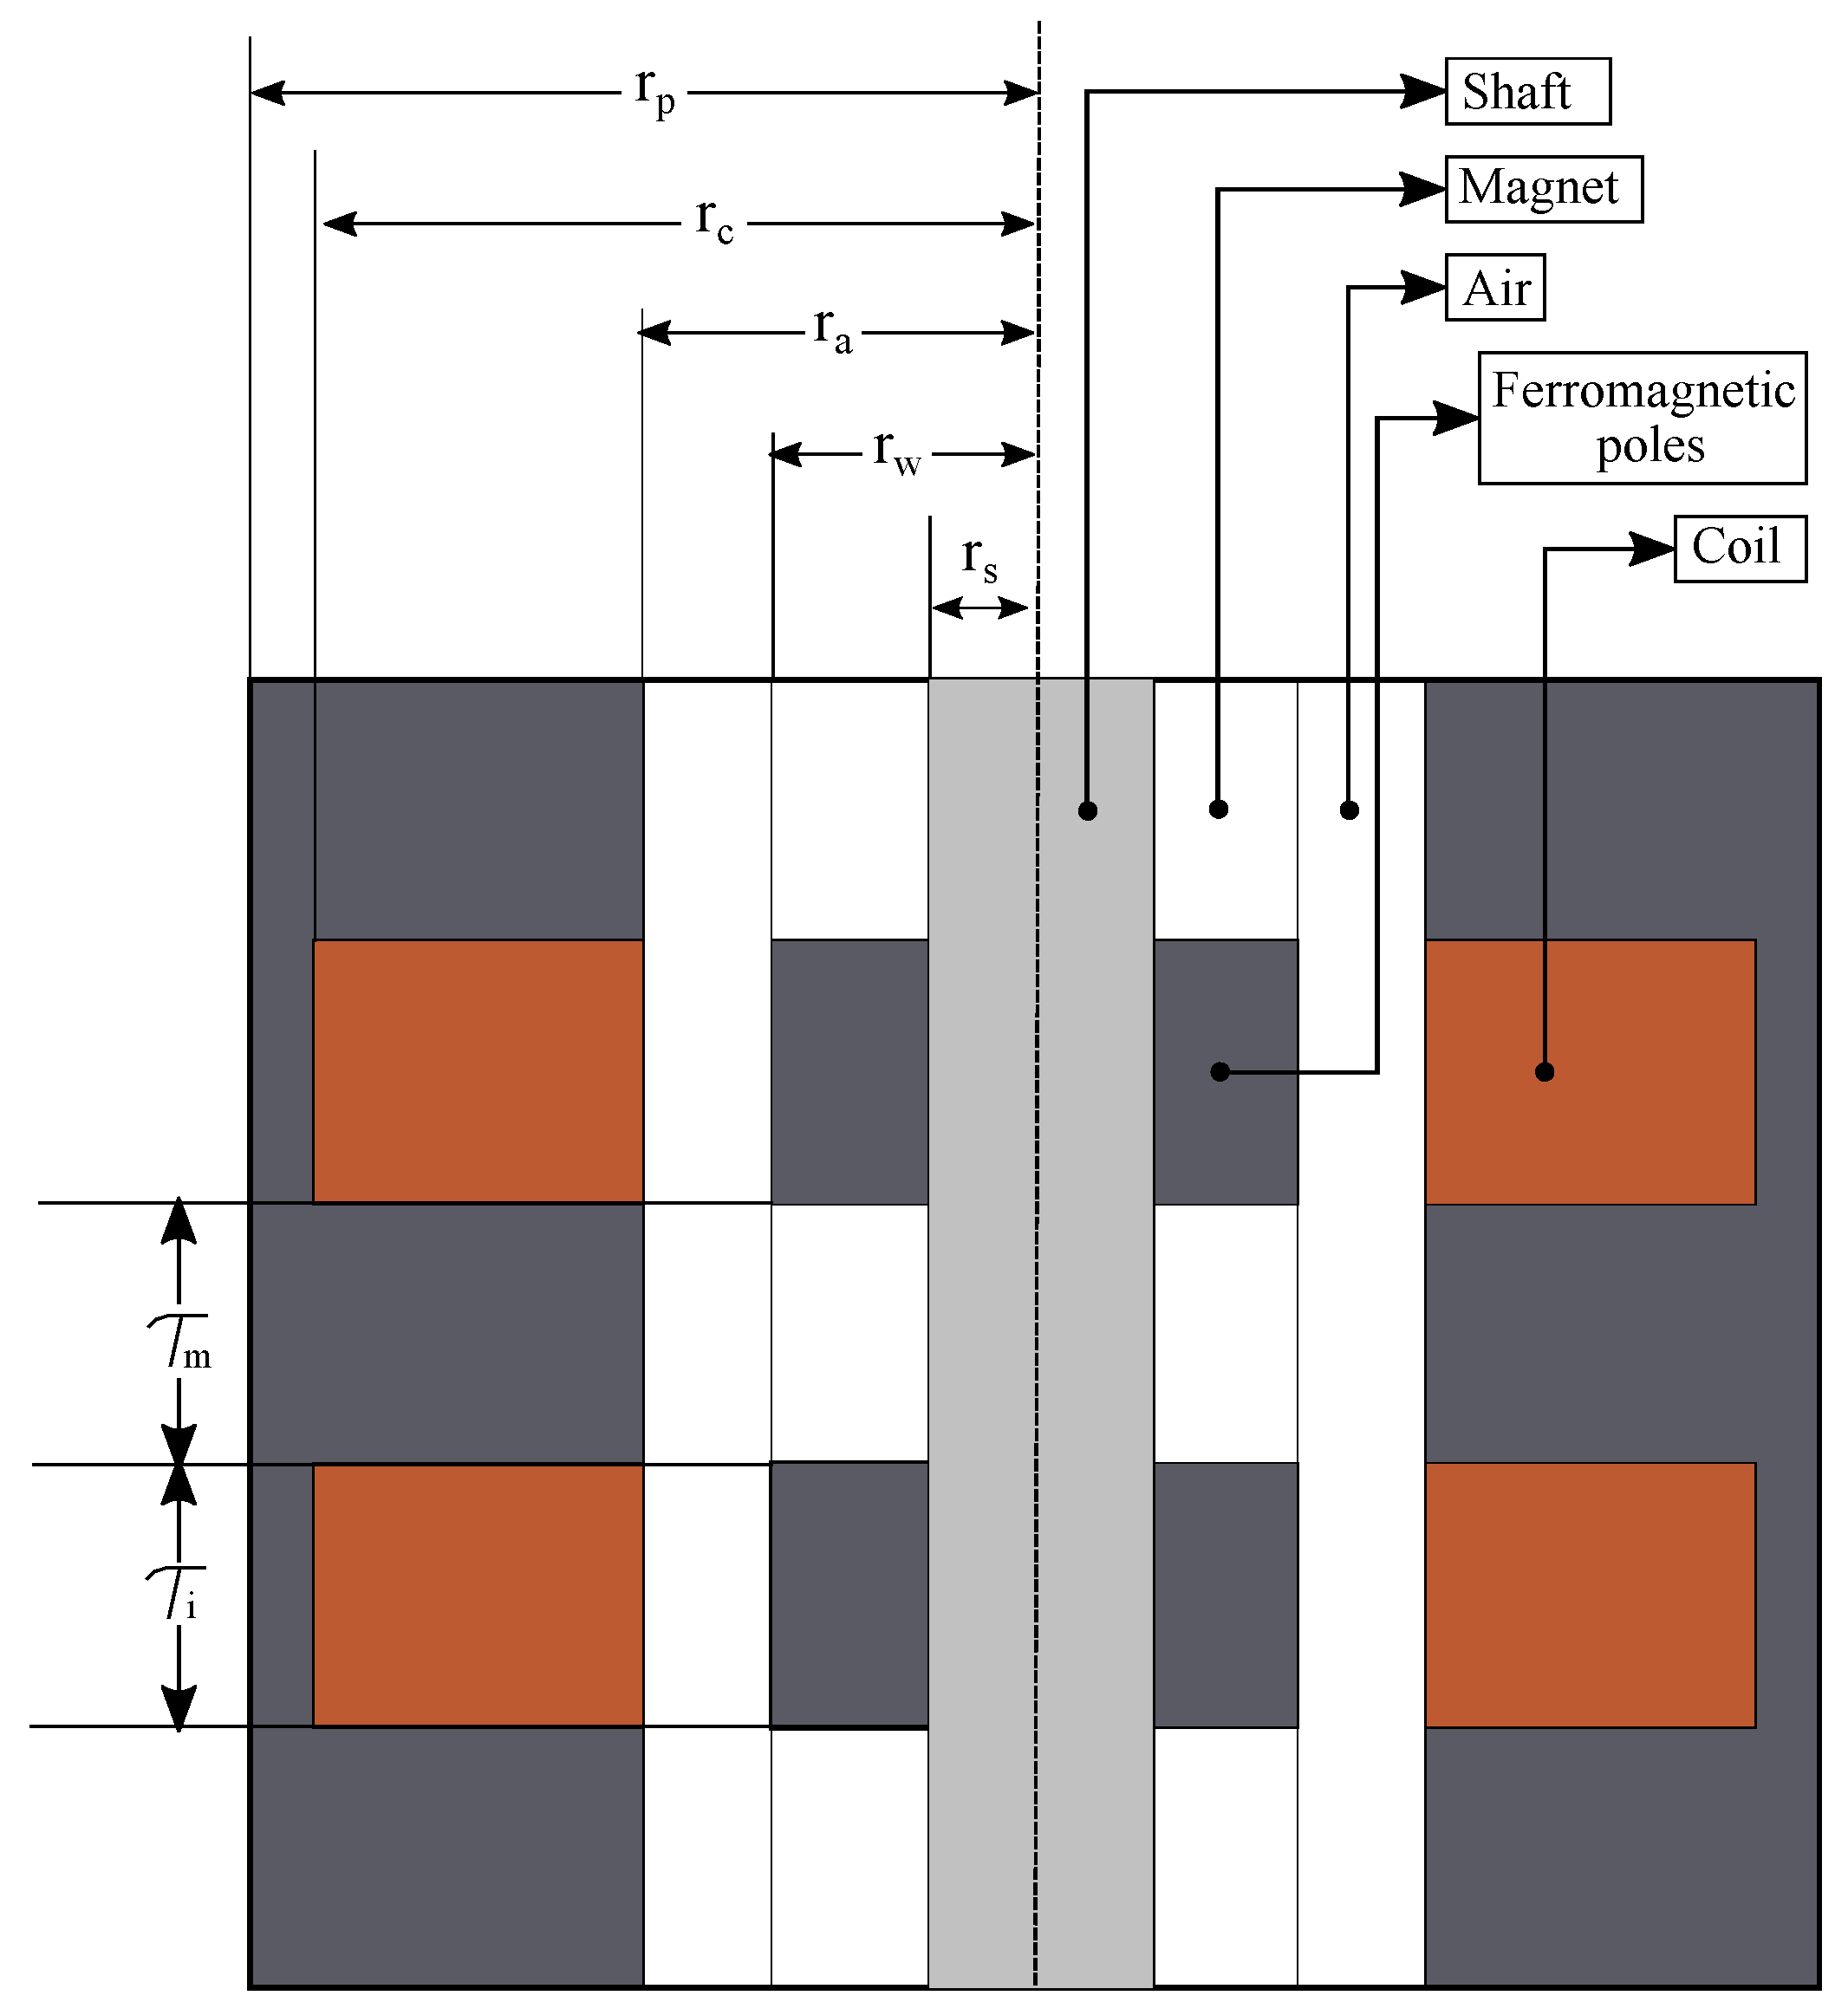
An electromagnetic harvester is basically an electromagnetic motor that, instead of producing a movement according to a supply voltage, generates electrical power from a given motion while providing a resistive force. The implemented electromagnetic transducer consists of a series of air coils localized inside the stator and a series of permanent magnets with a ring shape mounted on a moving shaft. Figure 2 depicts the structure of the energy harvester with its notation. This configuration can be found in regenerative braking for automotive applications [12,13], vibration reduction for buildings [14], and energy extraction from ocean waves [15].
The magnetic flux inside the linear transducer is produced by the permanent magnets located on the device shaft, according to the expression:
ϕ = B · d A
where B is the magnetic field vector and A is a vector area.
According to Faraday’s Law, the voltage induced at the terminals of the generator coils is proportional to the rate at which the magnetic flux changes over time. If the magnetic flux is time dependent on the x-axis direction, the flux can be derived with respect to time, and the induced voltage is expressed by:
V = ϕ x d x d t
The open-circuit voltage induced in the generator coils is obtained by applying Faraday’s law to a single coil and assuming that the magnetic flux has a sinusoidal shape:
V = 2 π ϕ cos π p x d x d t
where the term p refers to the pole pitch of the translator.
The mathematical expression that accompanies the velocity in (3) is known as the EMF transducer constant, and it is expressed in volts seconds per meter (Vs/m) in SI units. We usually use the letter K v to refer to this constant. Since the magnetic flux depends on the permanent magnet point operation, the magnitude of the expression for K v ( x ) depends finally on the geometric arrangement of the permanent magnets, the coils, and the magnetic properties of the materials that constitute the machine. An analytical expression for the magnitude of the EMF linear machine constant can be found in [16] where the lumped equivalent magnetic circuit method. The amplitude of the EMF transducer constant is given by the expression:
K v = N 2 π r w 2 r s 2 B r τ m τ m τ i + μ r τ i r w 2 r s 2 1 2 r s 2 r w 2 r s 2 ln r w r s + τ i + τ m μ 0 μ F e r p 2 r c 2 + 2 μ 0 τ i ln r c r w
where N is the number of turn coils, B r is the remanent magnetic field of the permanent magnets, μ r is the recoil permeability, μ 0 is the permeability of free space, and μ F e is the relative permeability of the ferromagnetic material.

2.2. Power Conditioning Circuit Modeling

The power conditioning circuit is used to rectify the voltage induced at the terminals of the transducer coils and bring the load voltage to an appropriate level. The electronic circuit under study is depicted in Figure 3. It includes three subsystems: the electromagnetic device, the rectifier circuit, and the switching converter. The electromagnetic device is represented by an AC voltage source, the amplitude and frequency of which depend on the input movement of the translator. Additionally to the voltage source, an inductance coil and a resistor are connected in series representing the impedance of the transducer. The rectifier circuit consists of an arrangement of four diodes with neglected internal resistance and a capacitor for smoothing the signal. The last subsystem is a fixed duty cycle buck-boost converter, which increases or decreases the rectifier voltage according to the duty cycle of a switching element. The output voltage resulting from this configuration has an opposite polarity to the rectifier voltage.
A PWM signal is responsible for setting the switch stage, changing the operation of the circuit, and regulating the output voltage. When the switch is closed during the time interval d t 1 , the buck-boost converter constitutes the circuit presented in Figure 3a. In contrast, when the switch is open during the time interval d t 2 , the circuit assumes the form of Figure 3b. Each circuit may be described as a set of differential equations with four state variables: the inductor current, the rectifier voltage, the buck-boost inductor current, and the capacitor voltage.
By using the PWM duty cycle D and the switching frequency f w , the time intervals of each stage are defined by the expressions [17]:
ON stage:
Δ T O N = D 1 f w
OFF stage:
Δ T O F F = ( 1 D ) 1 f w
Applying Kirchhoff laws, the dynamic behavior of the electronic circuit when the switch is on is described by the following state-space equations:
d i s ( t ) d t = R f L f i s ( t ) 1 L f V f ( t ) + 1 L f V s ( t ) d V f ( t ) d t = 1 C f i s ( t ) s i g n ( V f ( t ) ) C f i o ( t ) d i o ( t ) d t = s i g n ( V f ( t ) ) L o V f ( t ) d V o ( t ) d t = 1 R o C o V o ( t )
Otherwise, when the switch is off, the dynamic behavior is given by the following state-space equations:
d i s ( t ) d t = R f L f i s ( t ) 1 L f V f ( t ) + 1 L f V s ( t ) d V f ( t ) d t = 1 C f i s ( t ) d i o ( t ) d t = λ L o V o ( t ) d V o ( t ) d t = 1 R o C o V o ( t ) λ 1 C o i o ( t )
where the term λ is a binary term which value depends on the state of the diode, according to the expression:
λ = 1 : i o 0 0 : i o < 0
Finally, assuming that the switching frequency is sufficiently high, we can apply the state-space averaging method. The idea behind this approach is that the global effect of one period can be obtained by weighted summing the contribution of each of the stages of the switching converter [18]. This method describes the circuit’s low-frequency behavior (with average currents and voltages) [19]. Multiplying (7) times the duty cycle D and (8) times the expression ( 1 D ) , we obtain the average state-space representation of the proposed power conditioning circuit:
d d t i s V f i o V o = R f L f 1 L f 0 0 1 C f 0 D s i g n ( V f ) C f 0 0 D s i g n ( V f ) L o 0 λ ( 1 D ) L o 0 0 λ ( 1 D ) C o 1 R o C o i s V f i o V o + 1 L f 0 0 0 V
In the case of a standard buck-boost converter in continuous current mode, the output voltage varies according to the PWM duty cycle following the expression below:
V o u t p u t = D ( 1 D ) V i n p u t
In the implemented circuit, this expression still works. However, the input voltage to the converter is the voltage output of the bridge rectifier, and the PWM duty cycle influences its value. The influence of the PWM duty cycle on the voltage rectifier makes the model complex, which makes the relation between the generated voltage by the electromagnetic transducer and the load voltage does not have a linear expression as in the case of a standard buck-boost converter.

3. Data Collecting and Methods

3.1. Gait Parameter Measurement

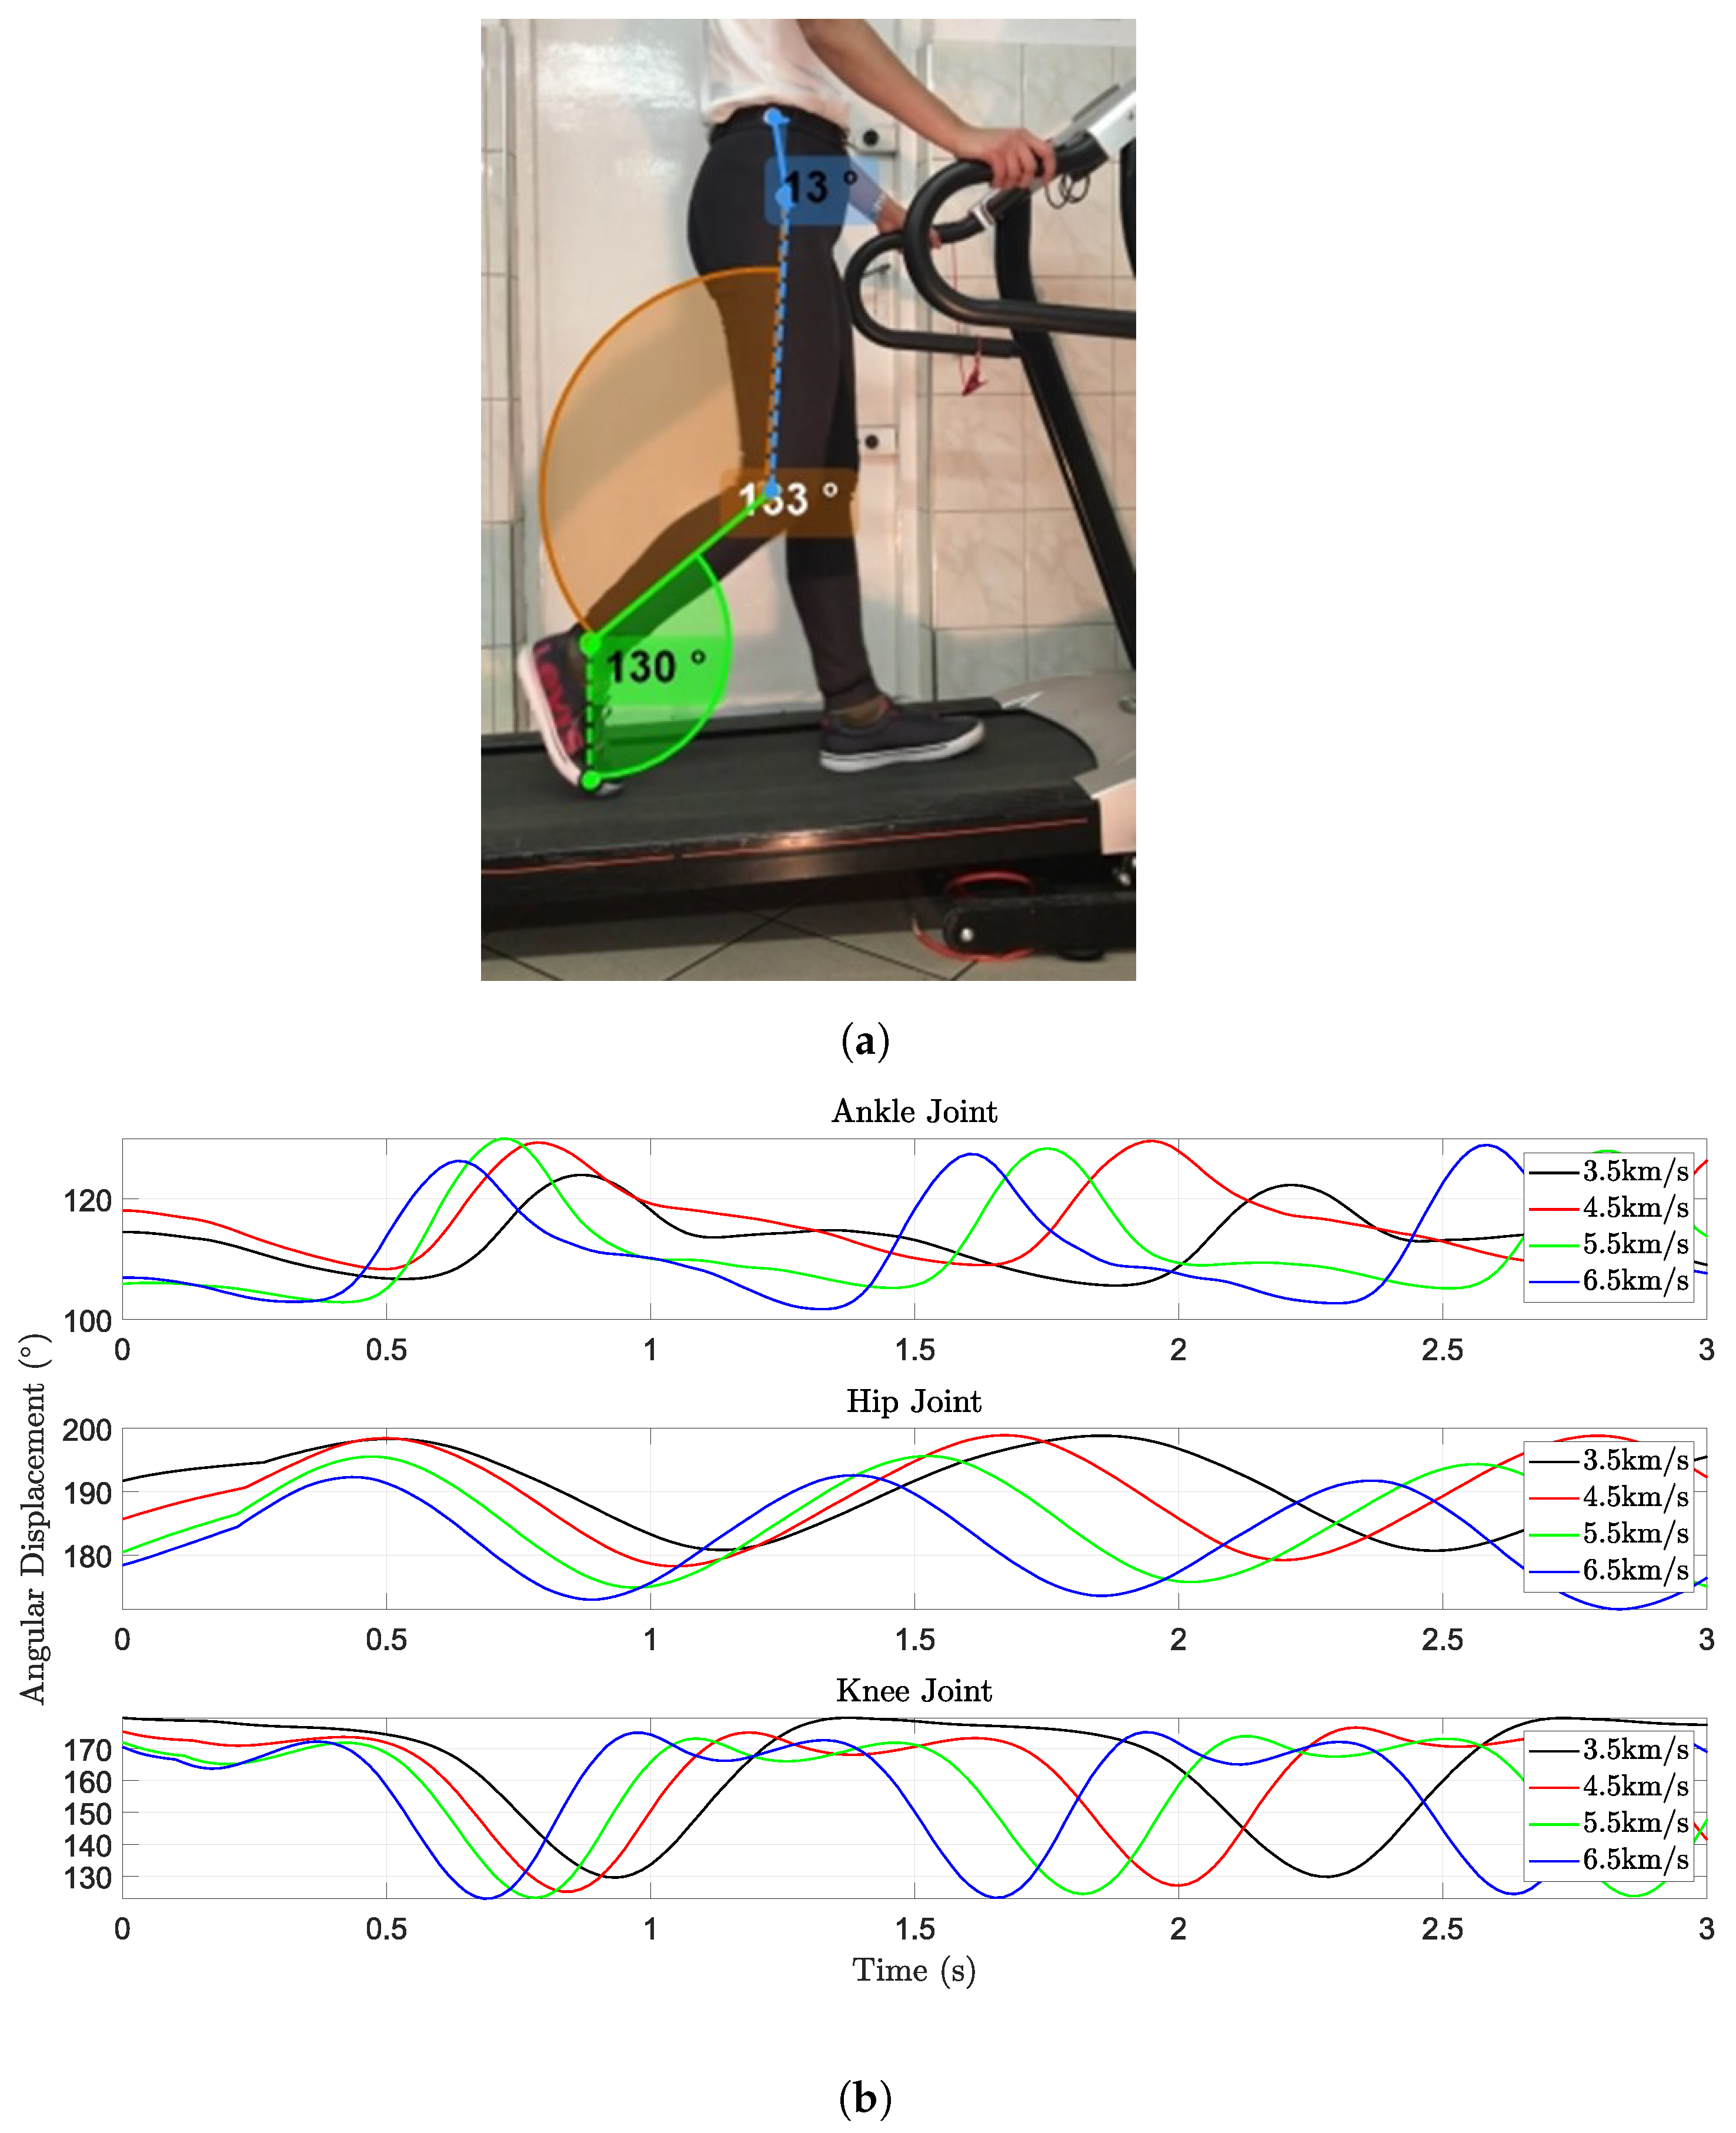
A human walking experiment was conducted to obtain the hip, knee, and ankle joint rotational movements used as an input to the modeled energy harvesting system. One young, healthy female subject participated in this study. Four markers were mounted on the participant to signalize the position of the lower limb joints on the sagittal plane. The participant was asked to walk on a treadmill at different speeds ranging from 3.5 km/h to 6.5 km/h. The motion of the participant was recorded with a simple camera with 60 fps. We tracked the motion of the markers in the recorded video using Kinovea software, which is a tool that allows motion tracking by analyzing the frames that composed the video [20]. Finally, the data were smoothed using a moving average filter. The obtained data correspond to the angular displacement of each joint. The convention used for measuring the angles is shown in Figure 4a.
To characterize the input of the modeled energy harvesting system, we calculated the angular velocity by using a simple linear approximation. Furthermore, we smoothed the calculated data. With the use of the processed data, the transducer motion and the induced coil voltage were calculated.

3.2. Kinematic of the Energy Harvester

The rotational movement of the joints is transmitted to the electromagnetic transducer by directly attaching the device to the links that make up the joint, as shown in Figure 5.
The stator and translator relative displacements are calculated by relating the joint angular displacement and the distance from the joint to the point of connection with the transducer and using the cosine law:
x = L a 2 + L b 2 2 L a L b cos θ k
Taking the derivative of (12), we find an expression to correlate the linear velocity of the translator with the angular velocity:
x ˙ = θ ˙ k 2 L a L b sin θ k L a 2 + L b 2 2 L a L b cos θ k
where θ ˙ k is the angular velocity of the studied lower limb joint.

3.3. Recurrence Plot (RP) and Recurrence Quantification Analysis (RQA)

Recurrent behavior is typical for a variety of technical but also natural systems. Recurrences, understood as returning to the previously observed states, are observed in linear as well as nonlinear dynamical systems. The concept of recurrence goes back to 1890 when Henri Poincaré’s pioneering work [21] was published. A century later, based on the results of Poincaré’s research, a powerful method for visualization and analysis of recurrent properties was proposed [22]. The main idea of the method, known as the Recurrence Plot (RP) method, involves revealing instances when the system phase space trajectory visits roughly the same area in the phase space. In the literature, under the term of recurrence plot, a graphical representation of the two-dimensional recurrence matrix is known [23]. The elements of the recurrence matrix R are given by the expression:
R ( i , j ) = Θ ε x i x j
where N denotes the number of considered states x i , ε is the threshold distance, and Θ is the Heaviside function
Recurrence plot can also be understood as a graphical representation of the matrix R, in which ones are denoted by black dots and zeros by white points. Therefore, the matrix R can be expressed by:
R ( i , j ) = 1 : x i x j 0 : x i x j
where x i and y i are the points belonging to the neighborhood of radius ε , which are marked by black points on the RP.
Correctness of the estimated recurrence plot depends heavily on the proper selection of the values of threshold ε , the time delay τ , and the embedding dimension m. For the purposes of determining the reasonable value of time delay τ , the auto-correlation or mutual information function [23,24] can be used. The advantage of the mutual information function (MI) application consists of taking into account also nonlinear correlations.
In practice, the value of τ corresponding to the first minimum of the mutual information function is used. A sufficient embedding dimension m is usually established with the application of the false nearest neighbors method [25].
In order to provide the objective interpretation of the computed RPs, the Recurrence Quantification Analysis (RQA) [26,27] method is commonly used. The RQA measures aim at quantifying the number and duration of recurrences of a dynamical system represented by its state space trajectory. Definitions of the most popular RQA measures are discussed in detail in [23,26,27].

3.4. Simulation Setup

The electronic components that make up the power conditioning circuit are selected to ensure the good behavior of the output signal, which means to get a semi-stable signal with a short stabilization time. The induced voltage depends on the geometry and magnetic properties of the materials that constitute the electromagnetic transducer.
The analysis of the proposed energy harvester and power conditioning circuit system is carried out through dynamical simulation. The EMF transducer constant was calculated according to the geometric and magnetic parameters presented in Table 1.
The parameters corresponding to the power conditioning circuit are presented in Table 2. To define the value of the internal inductance and resistance of the transducer, we used the analytical expression found in [28].
The lengths ( L a , L b ) used for the calculation of the transducer motion, shown in Figure 5, were assumed to have a value of 0.2 m. For the simulation, as the input to the system, lower limb joint motion data collected at a speed of 4.5 km/h were used. The time response of the state-space averaging model under a fixed PWM duty cycle and the input voltage generated by the electromagnetic transducer were calculated using a code written in Matlab, where the Euler Method was employed.
Additionally, a sensitivity analysis consisting of running several simulations varying the PWM duty cycle and load resistance was performed. The obtained data were used for the purposes of plotting and localizing the maximum RMS power for each lower limb joint. Time histories of the considered state-space variable responses calculated for the ankle, knee, and hip joints while walking at constant speed were analyzed with the application of the RP method. Interpretation of the patterns visible on the obtained RPs was supported by the estimation of the RQA measures. Phase space of the considered system was reconstructed by delay embedding. For the purposes of consistency, in all computations, the threshold value ε = 0.1 and the F A N criterion were assumed. The smallest sufficient embedding dimension m was estimated with the application of the false nearest neighbors method. The time delay τ was defined by searching for the first minimum of the mutual information function.

4. Results and Discussion

In the course of the carried out research, the linear motion of the transducer, the generated voltage, the state-space variables associated with the power conditioning circuit, and the power consumed by the electrical load for each joint were calculated. Since the angular velocity and the frequency content influence the generated electric power, the analysis results carried out for each joint are presented separately.

4.1. Hip Joint

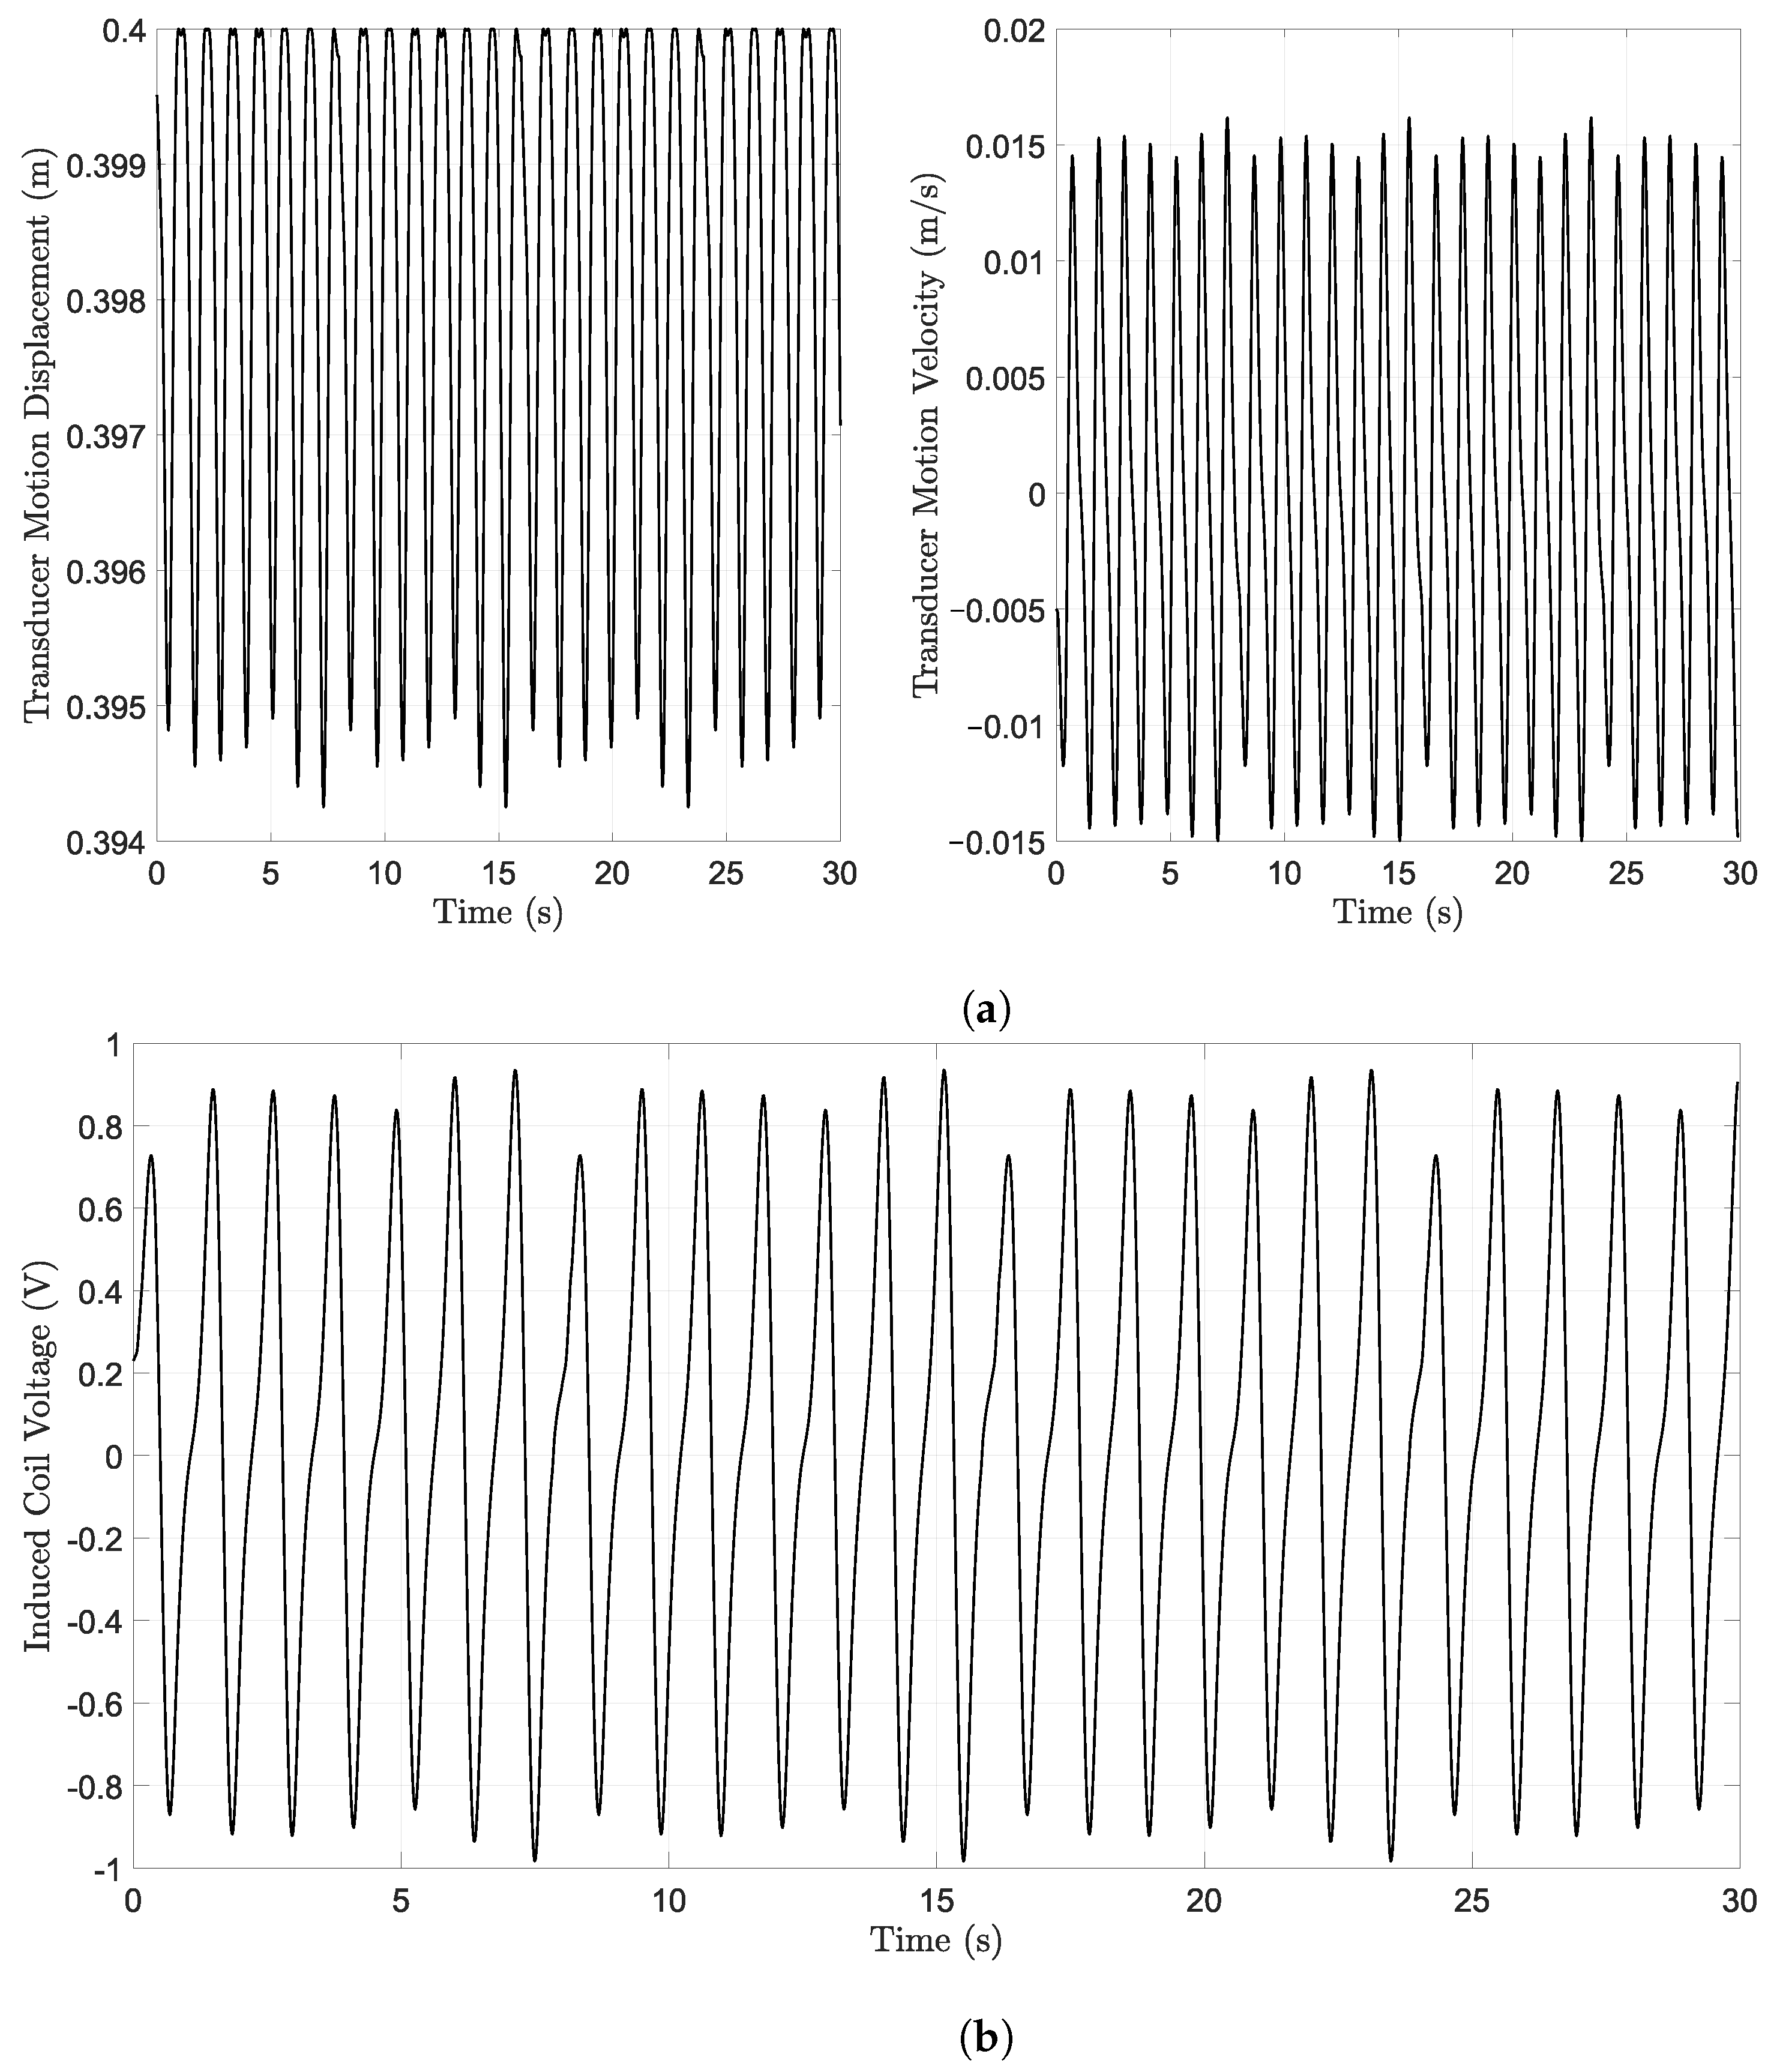
Figure 6a shows the resulting motion of the electromagnetic transducer attached to the hip joint. The linear displacement covers a reduced range of no more than 6 mm, and the maximum speed encountered is around 0.016 m/s. The induced coil voltage was computed according to (3) and (4) for the previously determined transducer motion. The time history of the induced coil voltage is presented in Figure 6b.
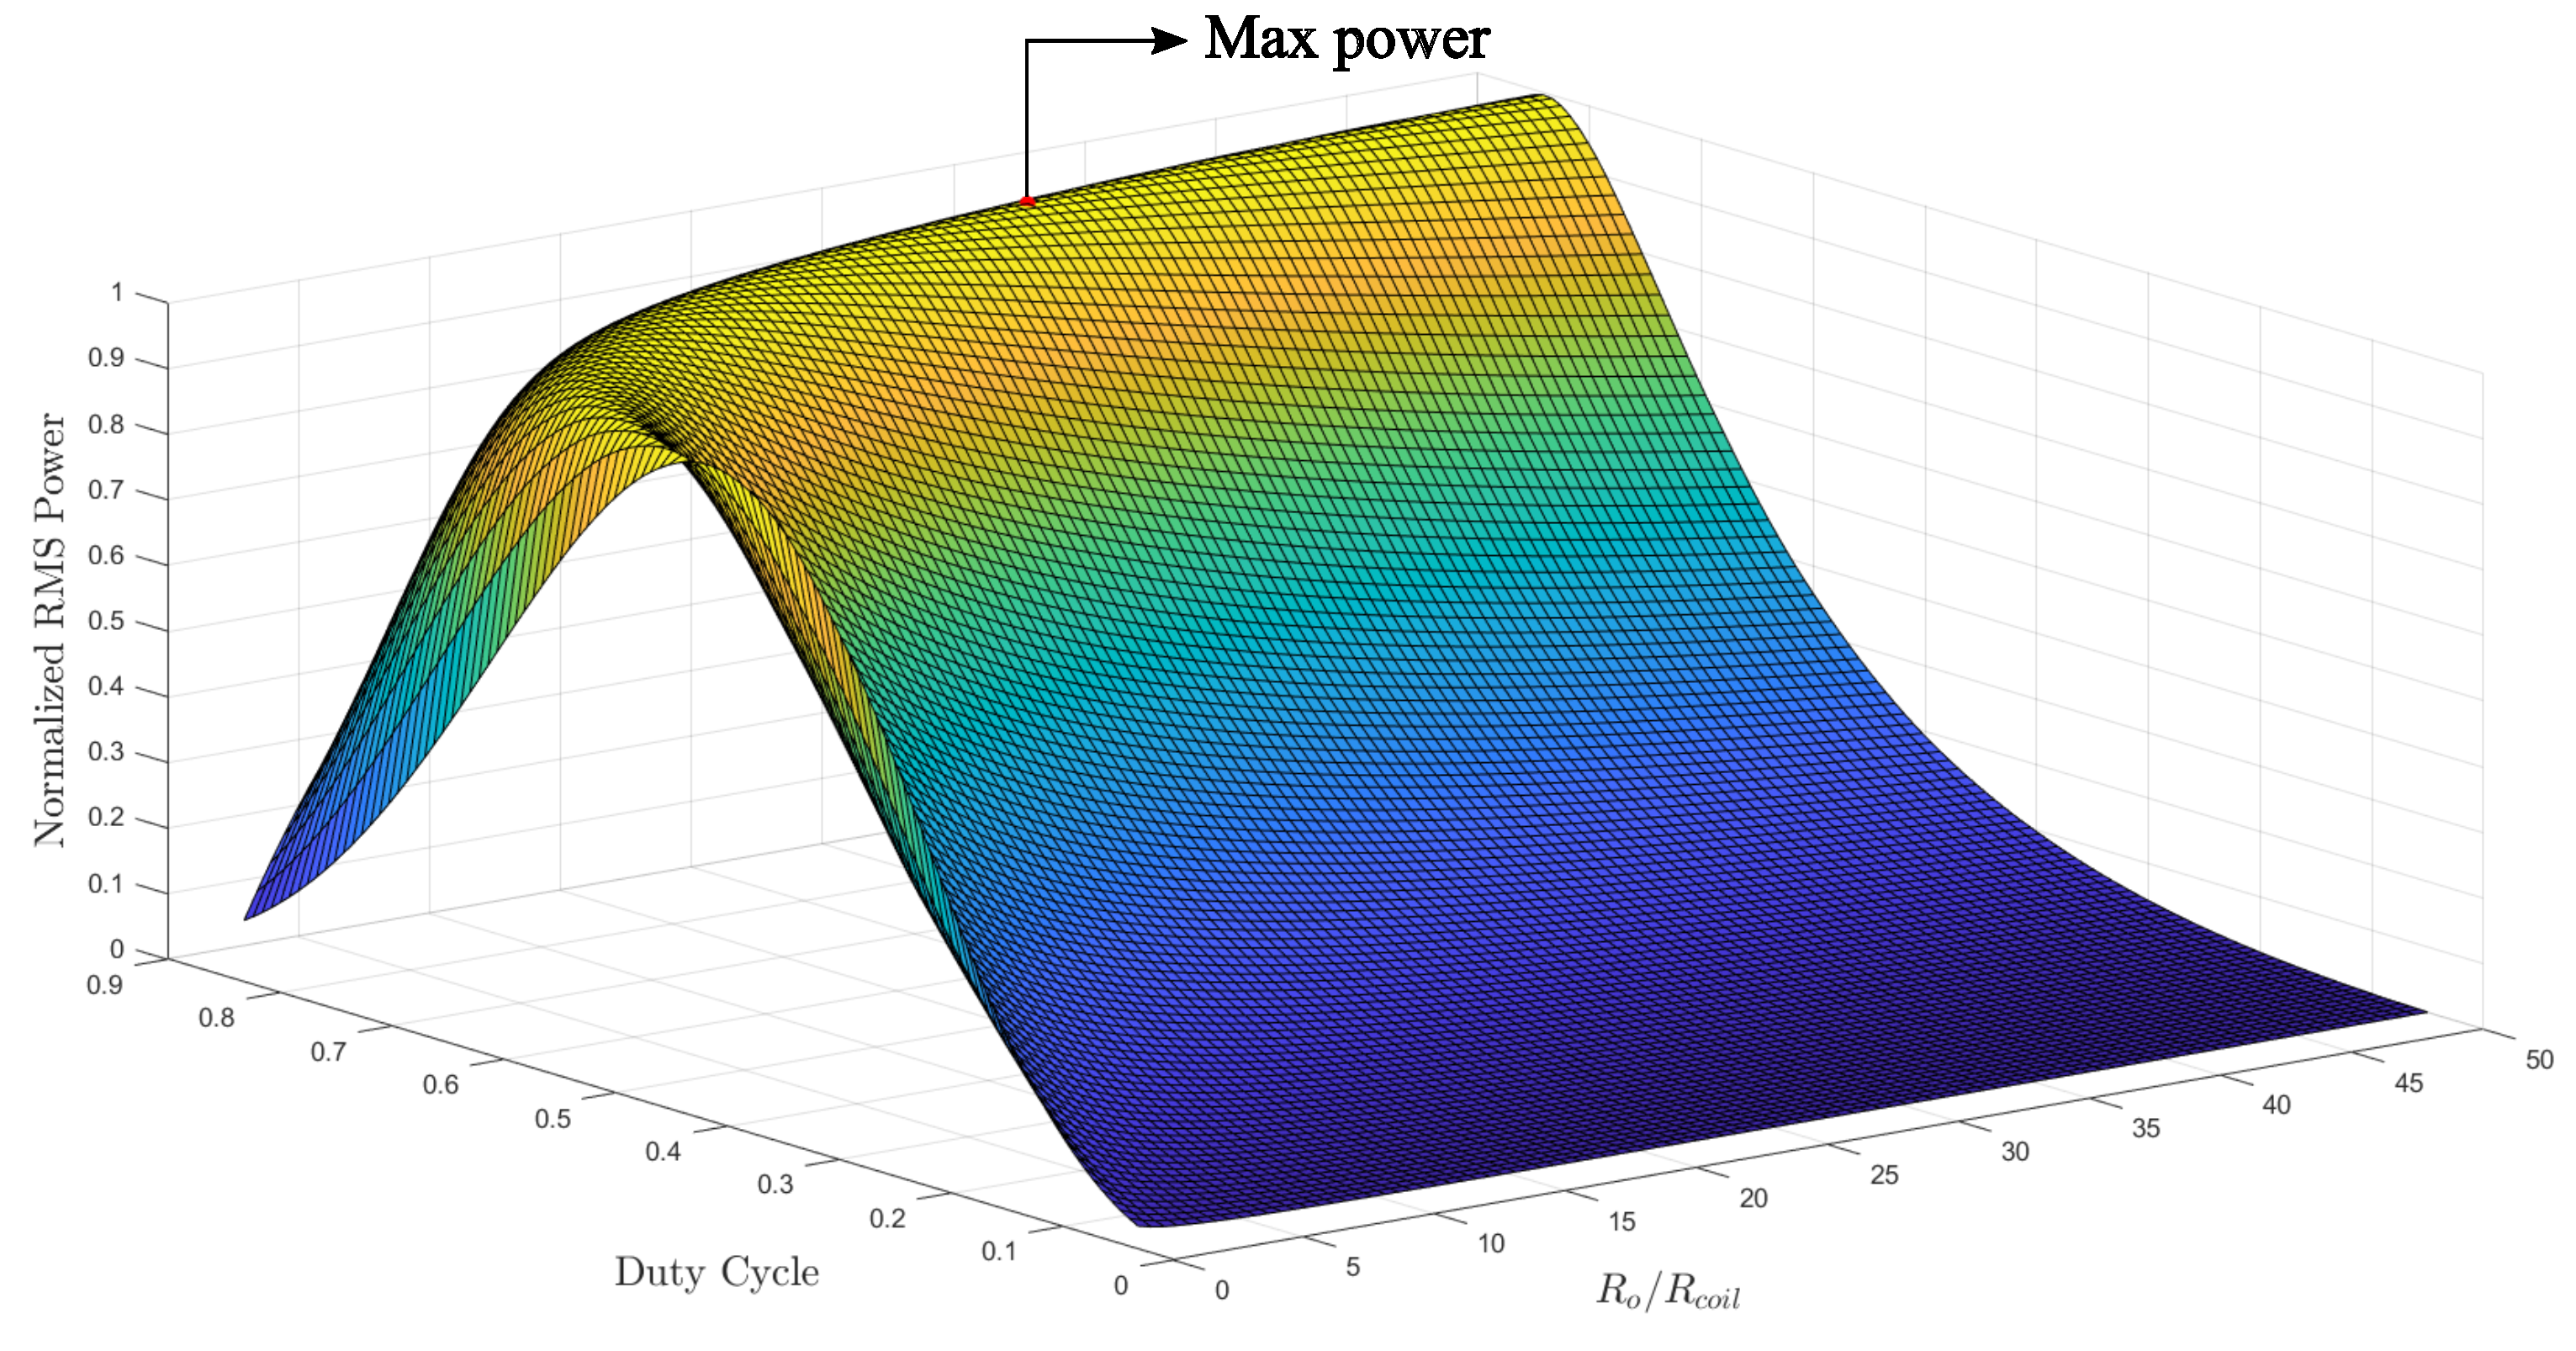
The RMS power for different duty cycle values and load resistance was determined using the induced coil voltage as input to the state-space averaging model of the system under study. Figure 7 illustrates the changes in the RMS voltage with respect to different PWM duty cycle and load resistance values. The maximum power was encountered at a duty cycle of 0.5 and load resistance of 1200 Ω.
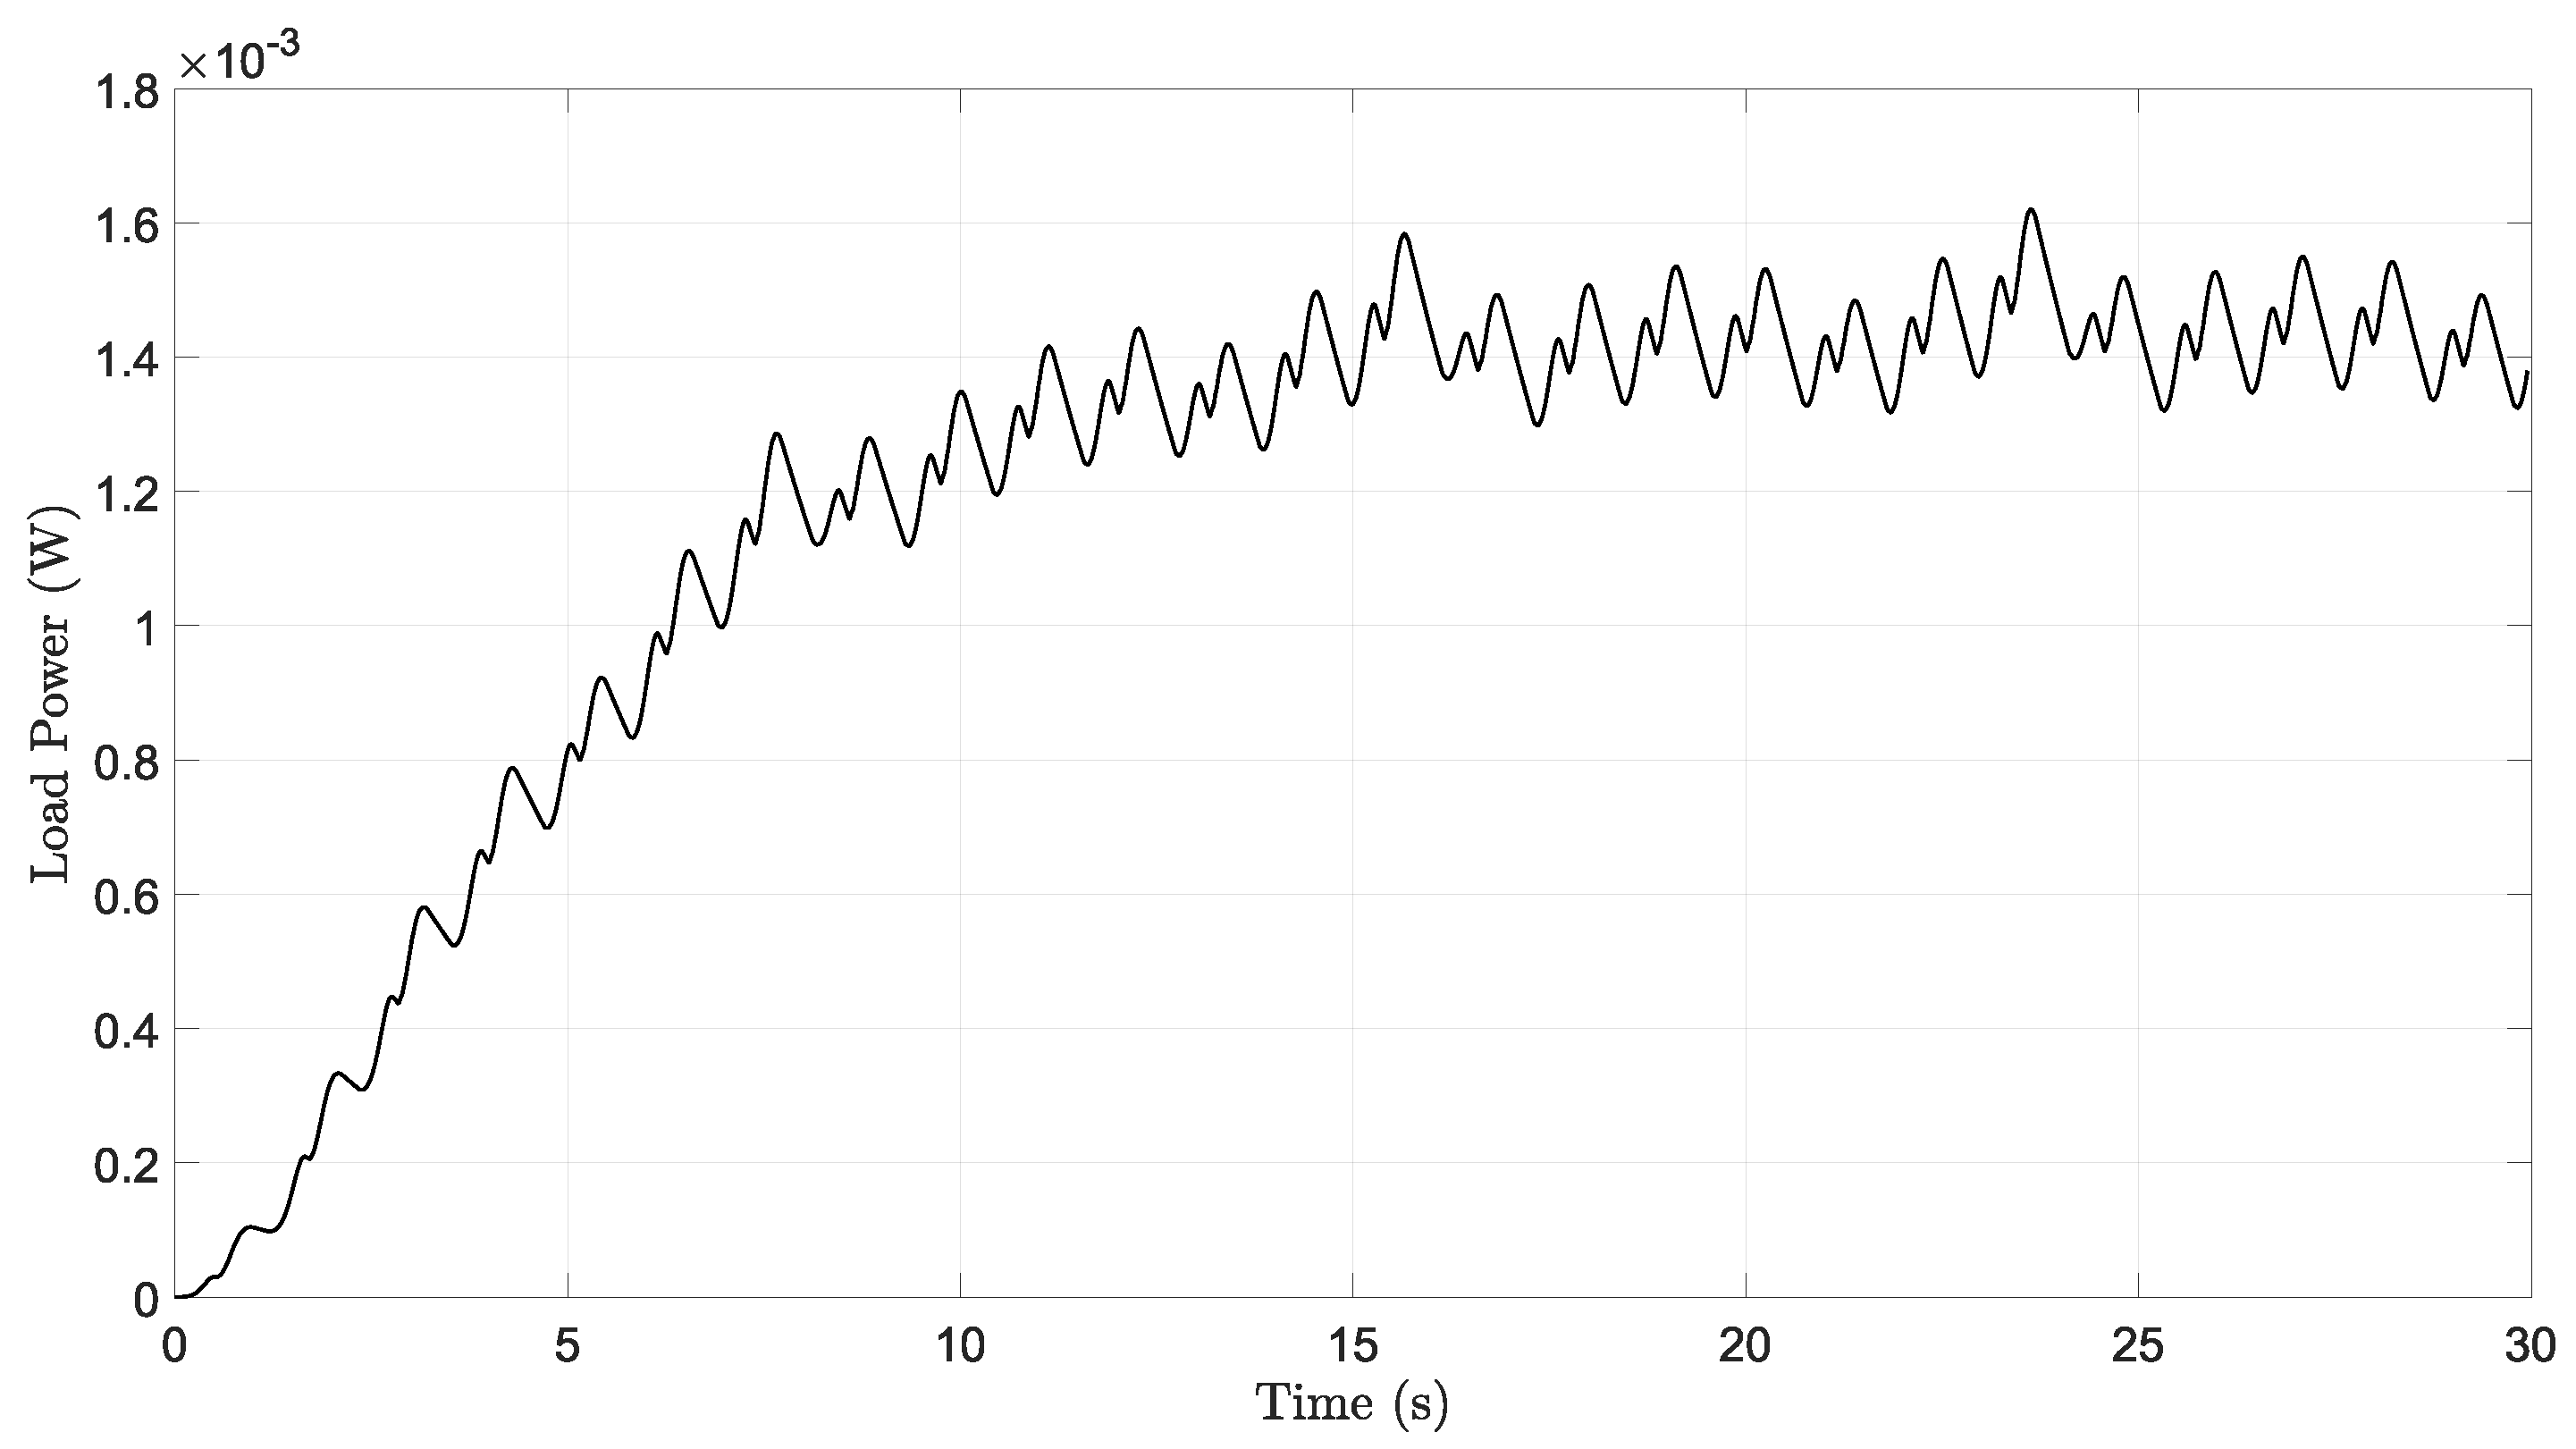
For further investigation, a PWM duty cycle of 0.8 and a load resistance of 750 Ω were selected. These parameters were chosen to ensure a proper output voltage with minimum variation and a short stabilization time. The time response of the state-space averaging model derived from the analyzed power conditioning circuit is presented in Figure 8, and the output power is presented in Figure 9. The stabilization time of the system is close to 20 s, and the generated power estimated is about 1.4 mW.
Recurrence plots of the considered physical quantities measured and calculated for the hip joint are presented in Figure 10. The RPs were estimated for 3500 samples measured in the steady-state.
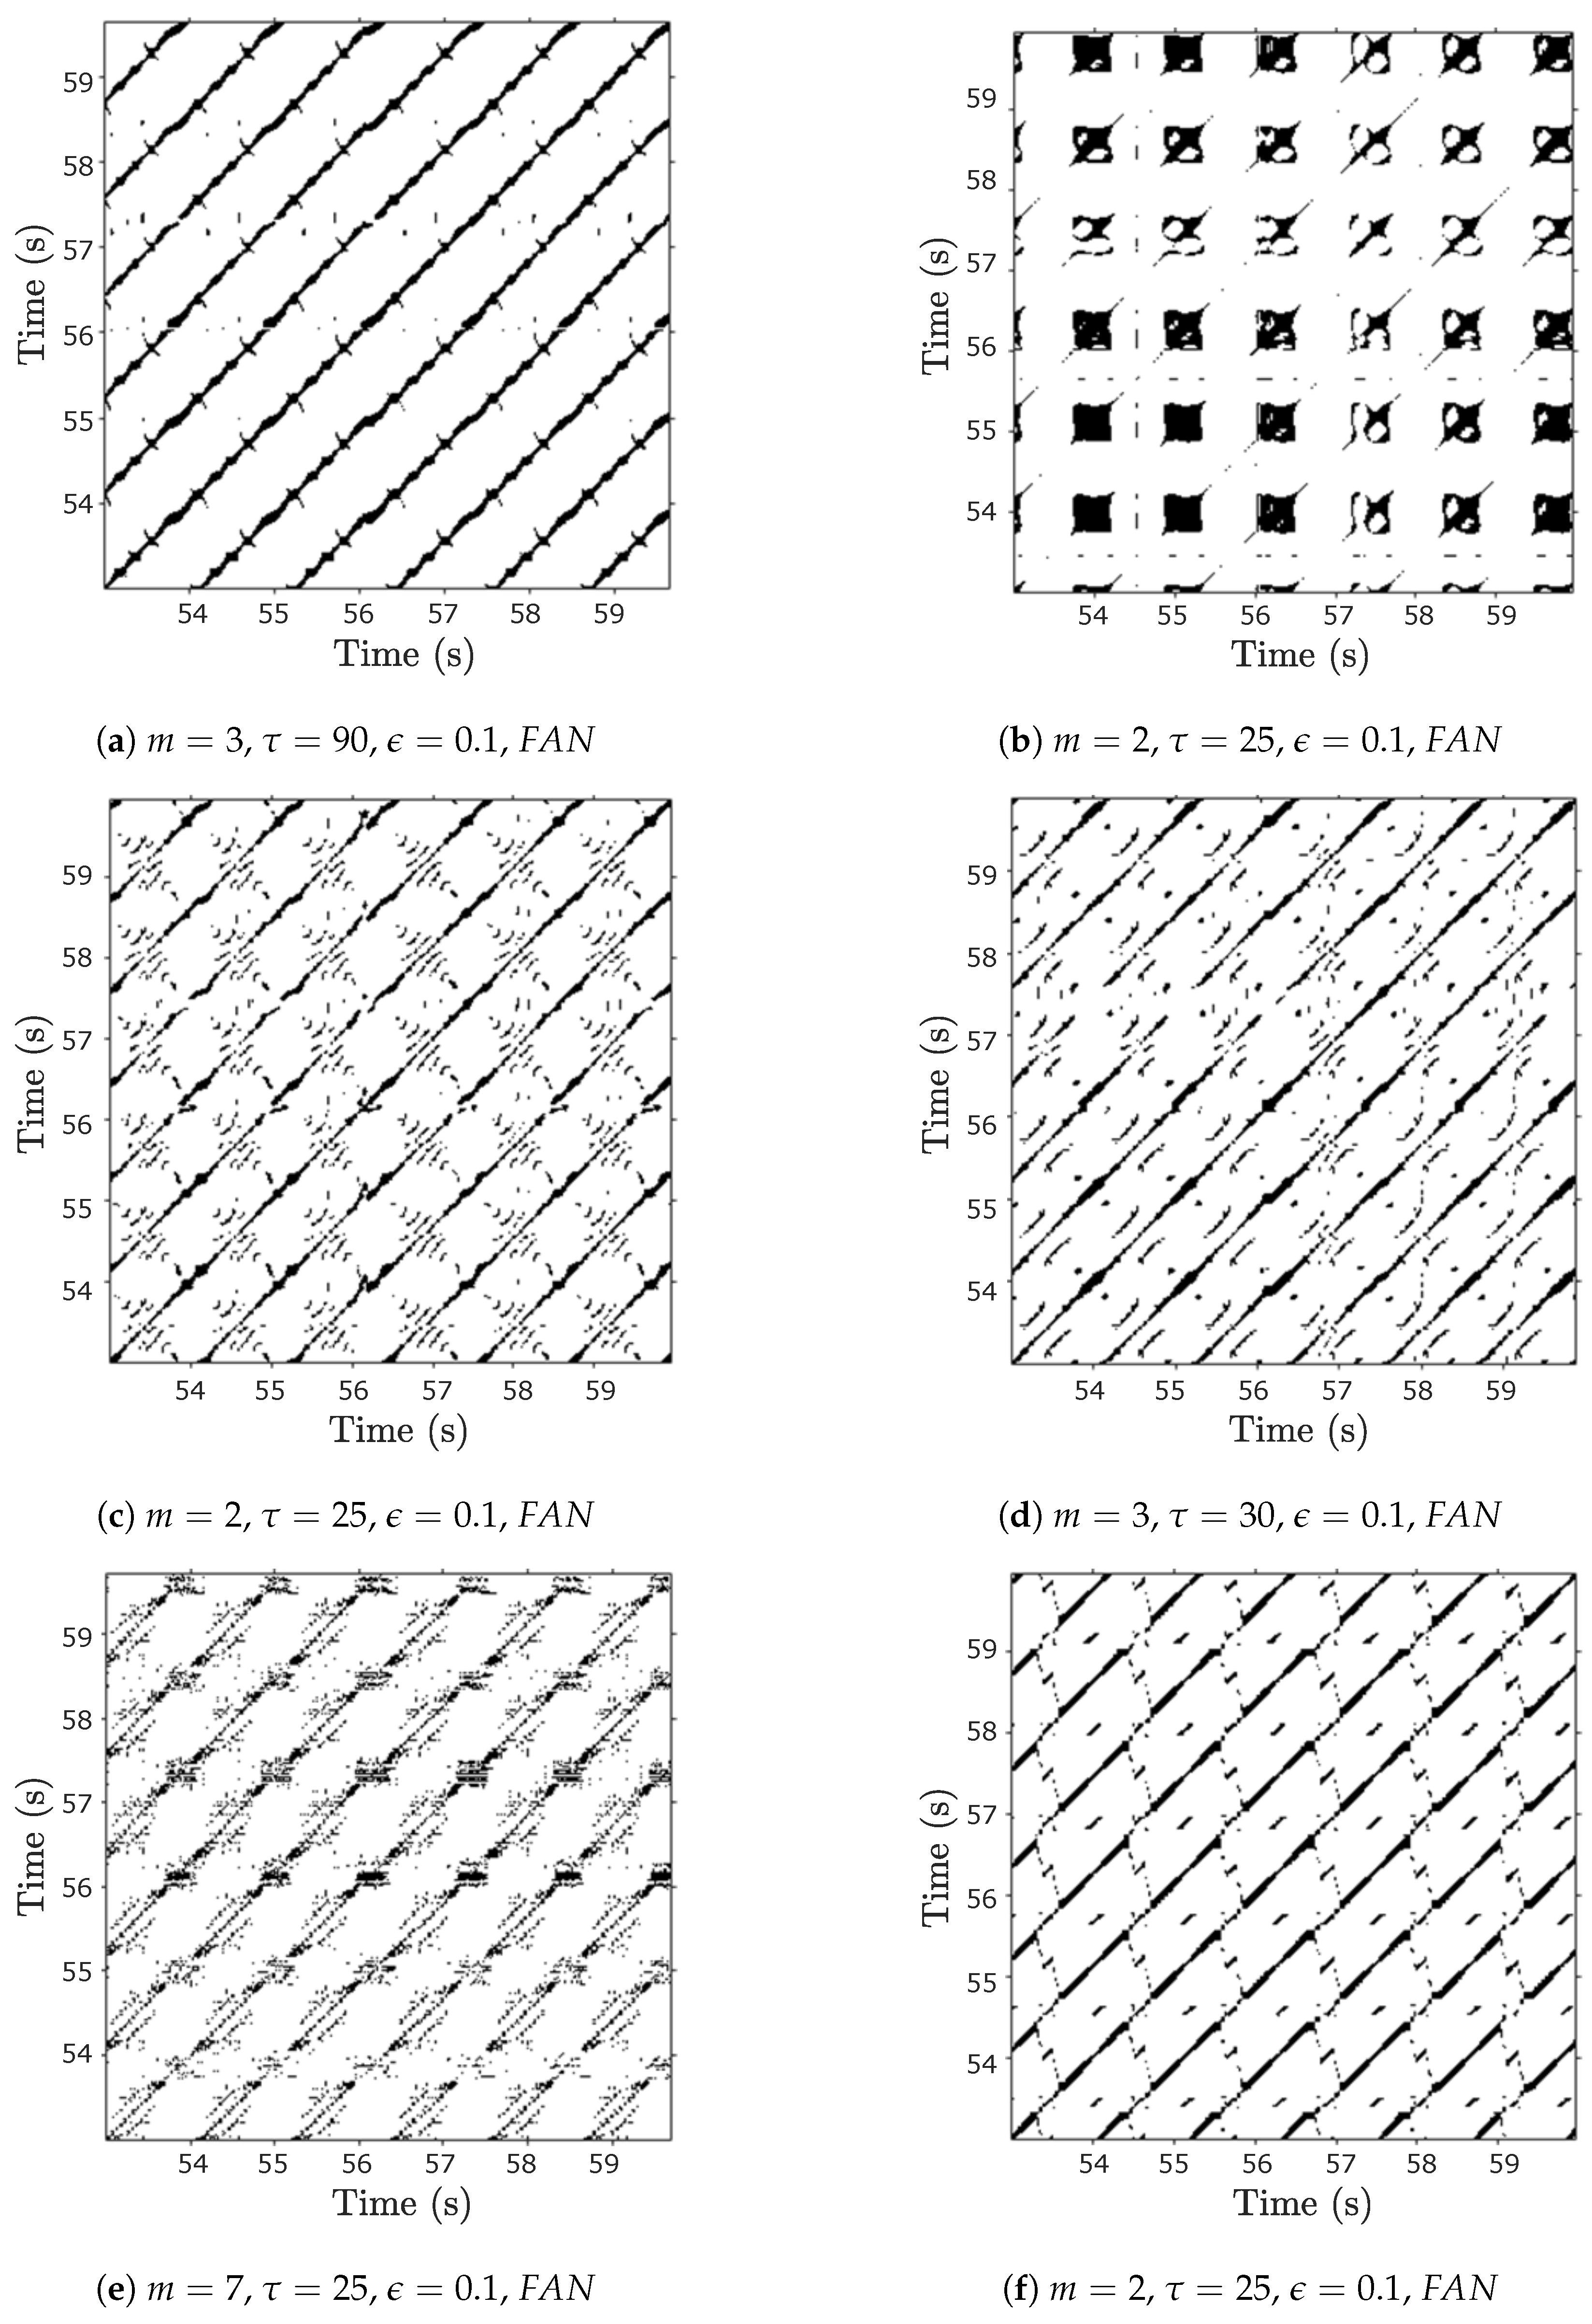
Long diagonal lines with visible disturbances on the estimated RPs indicate a regular or “almost” regular dynamic behavior of the considered system.

4.2. Knee Joint

The knee is the joint that dissipates the most energy throughout the gait cycle, so an energy harvester based on knee movement would assist the knee muscles while generating electrical energy. Additionally, the movement of this joint is characterized by greater values of angular velocity compared to the other joints. The motion of the electromagnetic transducer attached to the knee joint is shown in Figure 11a. The maximum velocity reached by the transducer is about 0.3 m/s, and the range of motion goes from 0.36 mm to 0.4 mm. Figure 11b shows the induced coil voltage. As expected, the voltage generated by this joint is the highest of all joints, reaching a maximum value of 20 V.
Figure 12 illustrates the changes in the RMS voltage with respect to different PWM duty cycles and load resistance values and shows the point of maximum power. It was observed that the system’s best performance occurs when the PWM duty cycle is close to 0.5, and the load resistance has a value of 120 Ω.
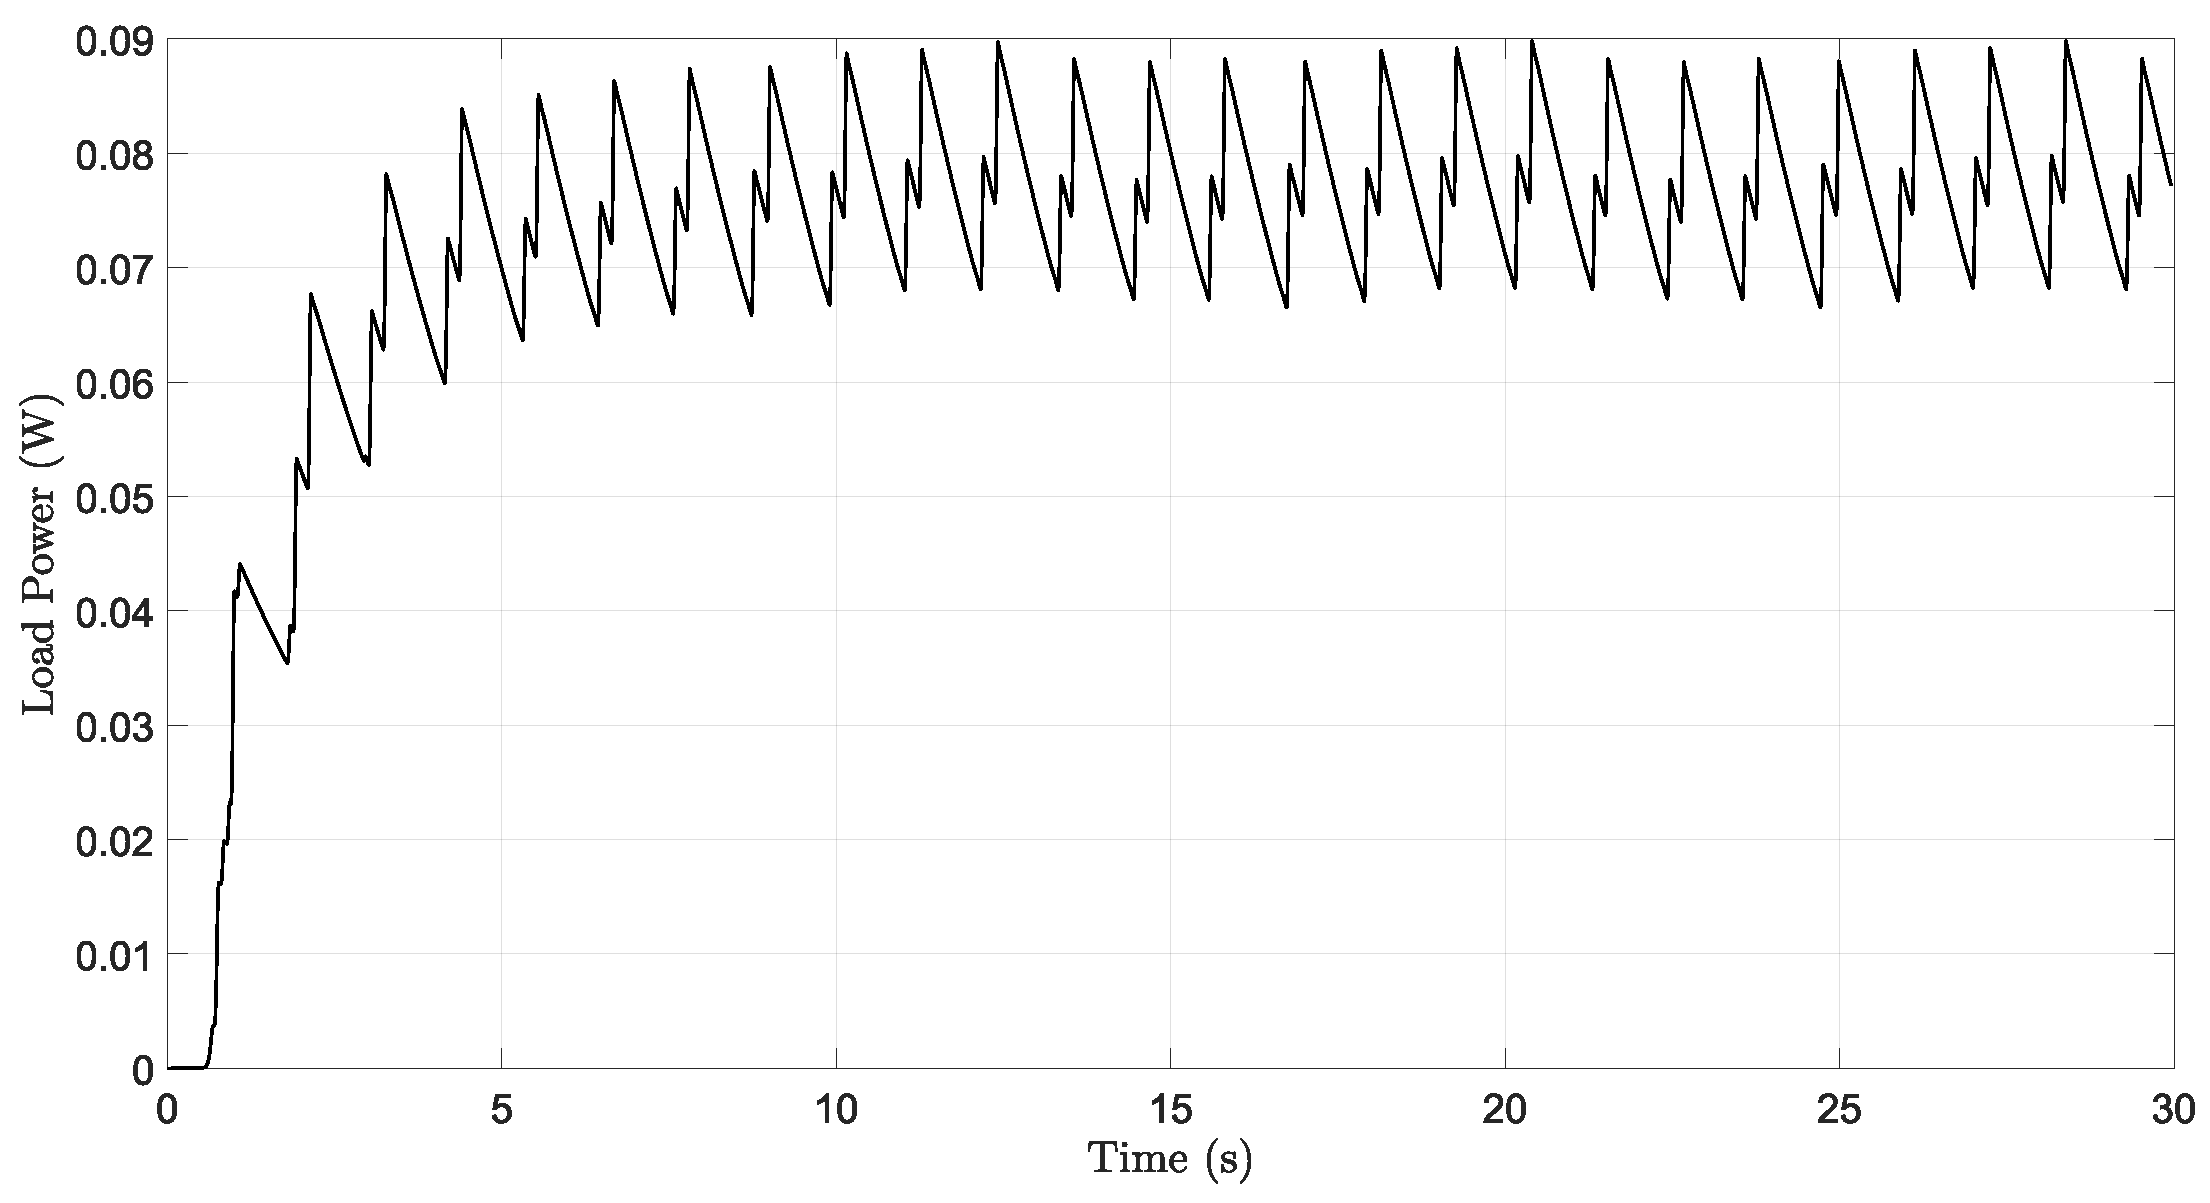
The dynamical system response computed using the state-space averaging model of the power conditioning circuit is presented in Figure 13. The selected PWM duty cycle and load resistance were 0.5 and 30 Ω, respectively. The obtained output power is presented in Figure 14. The stabilization time of the system is close to 20 s, and the generated power estimated is about 90 mW.
Figure 15 shows the time histories of the considered physical quantities measured and calculated on the knee joint and the corresponding recurrence plots estimated for 3500 samples.
On the obtained RPs, the diagonally oriented, periodic recurrent structures are visible. Long diagonal lines and checkerboard structures are characteristic of oscillating systems [29].

4.3. Ankle Joint

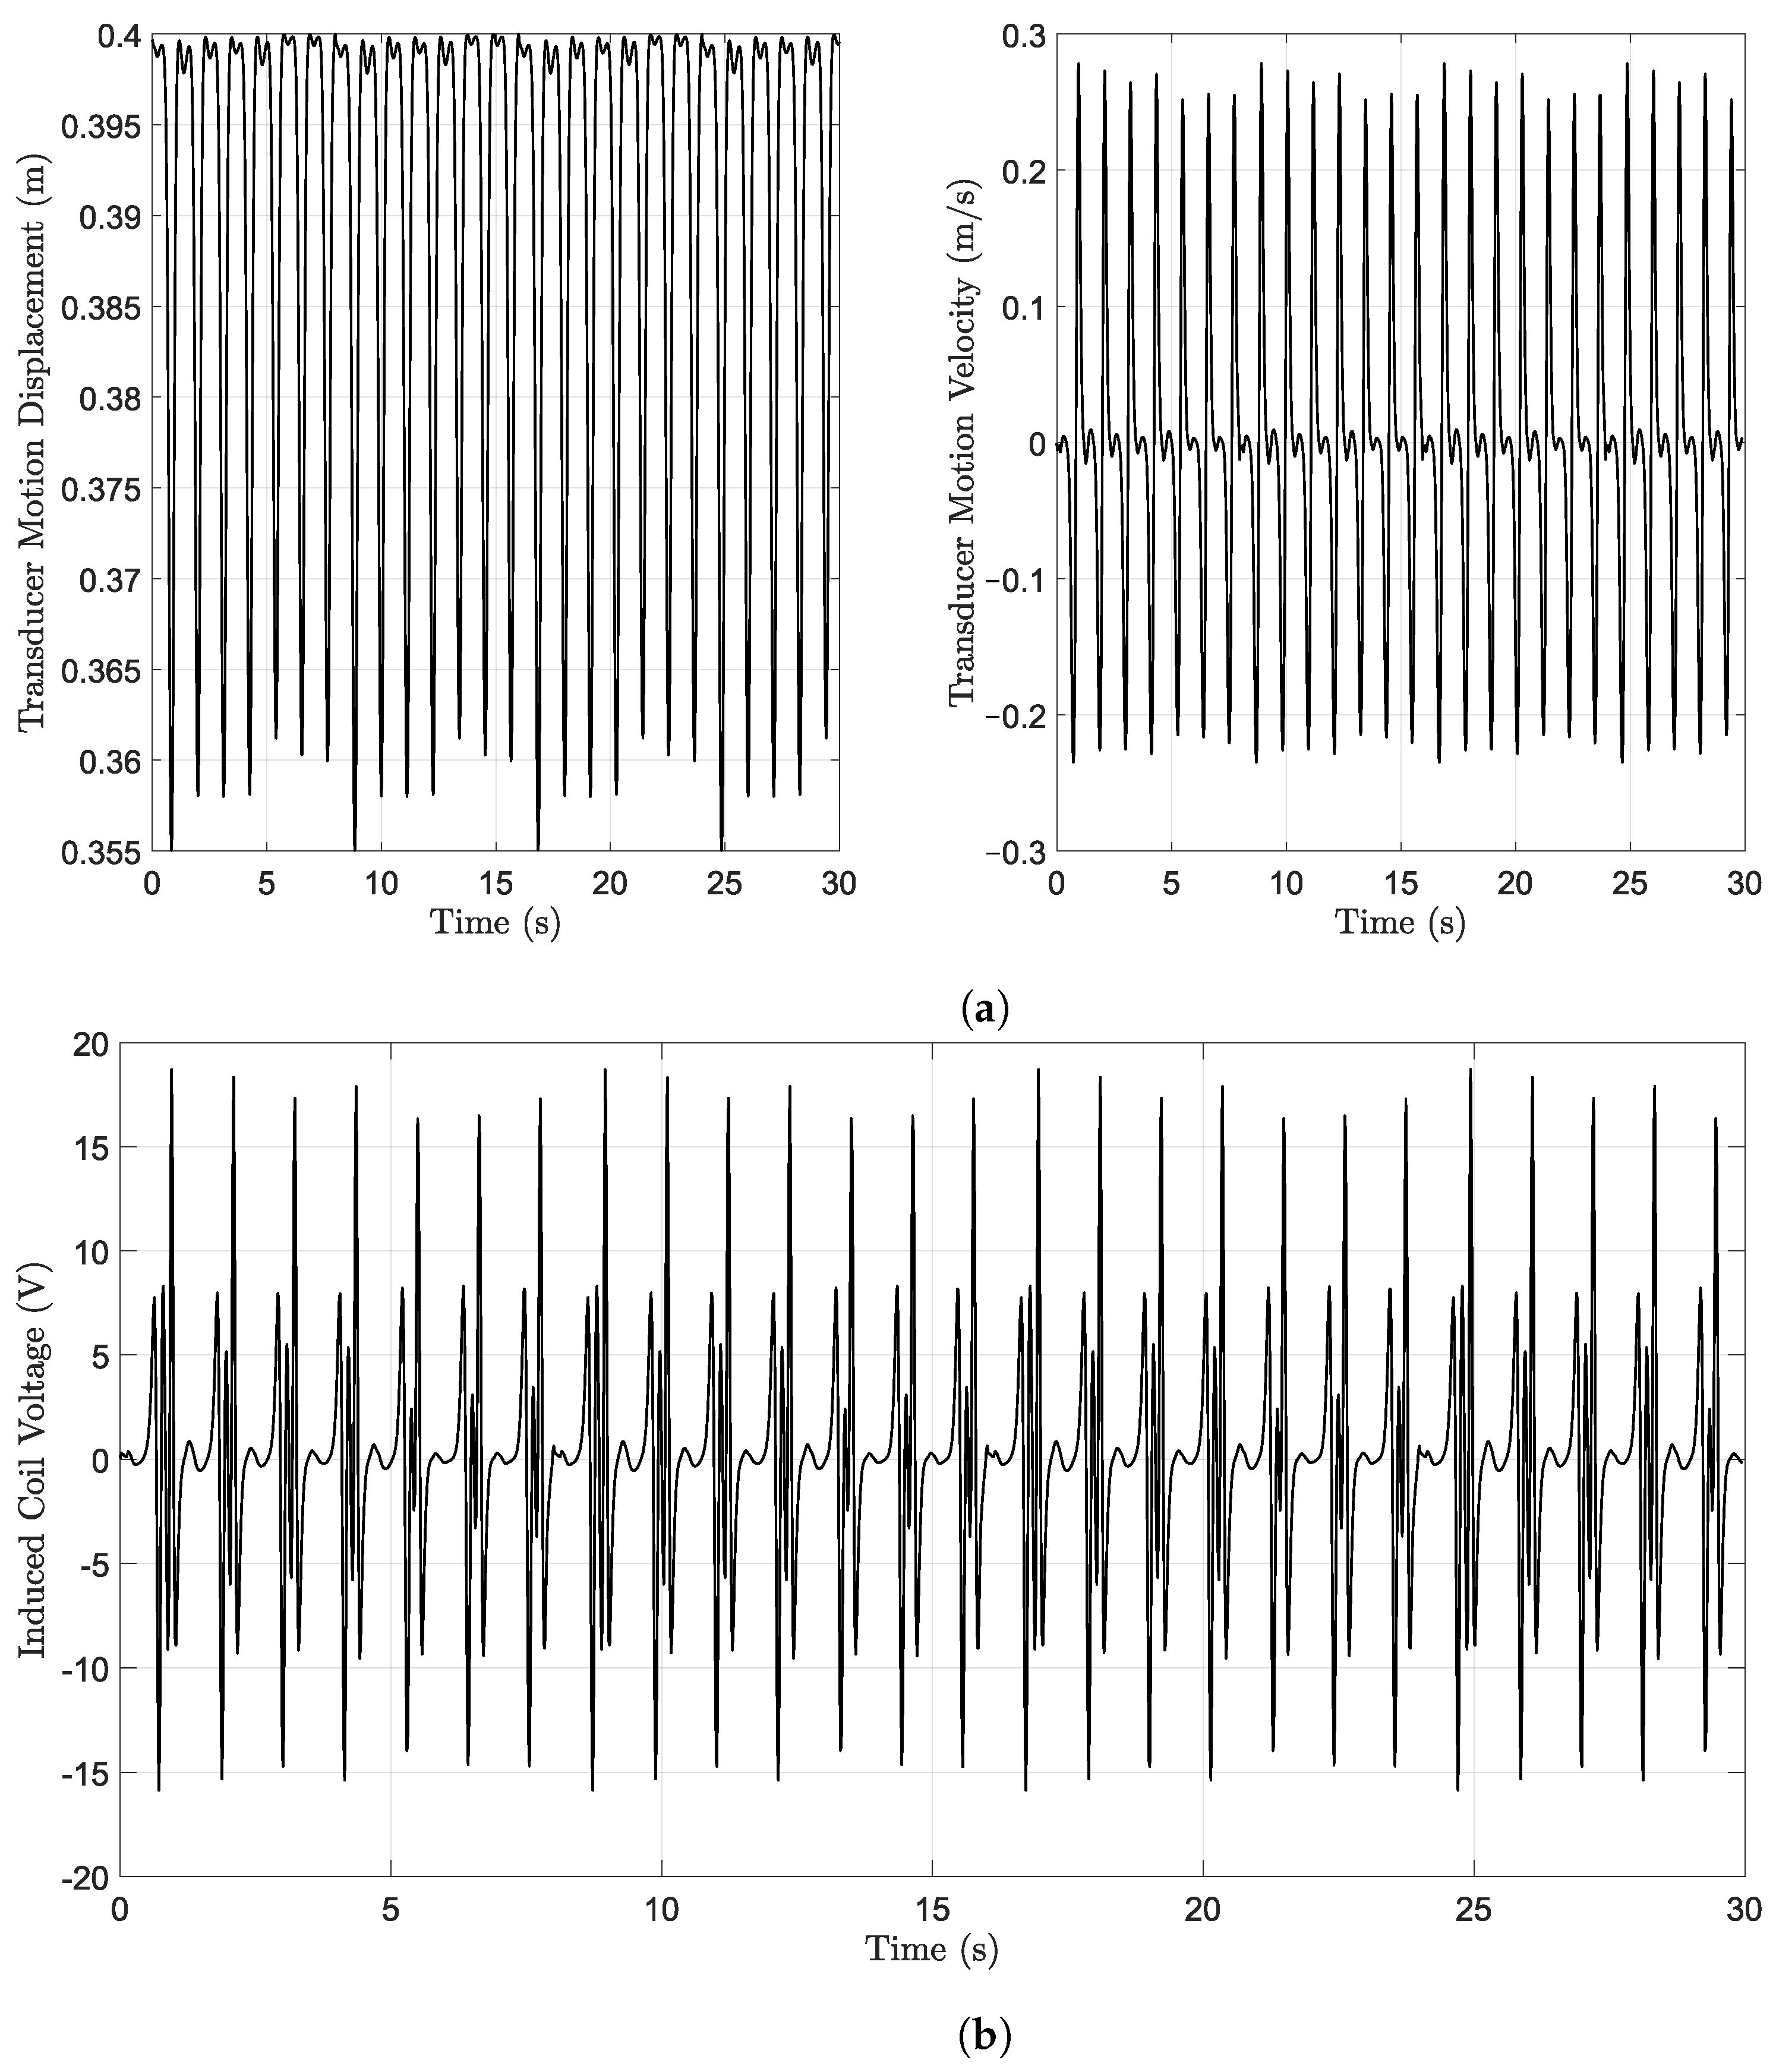
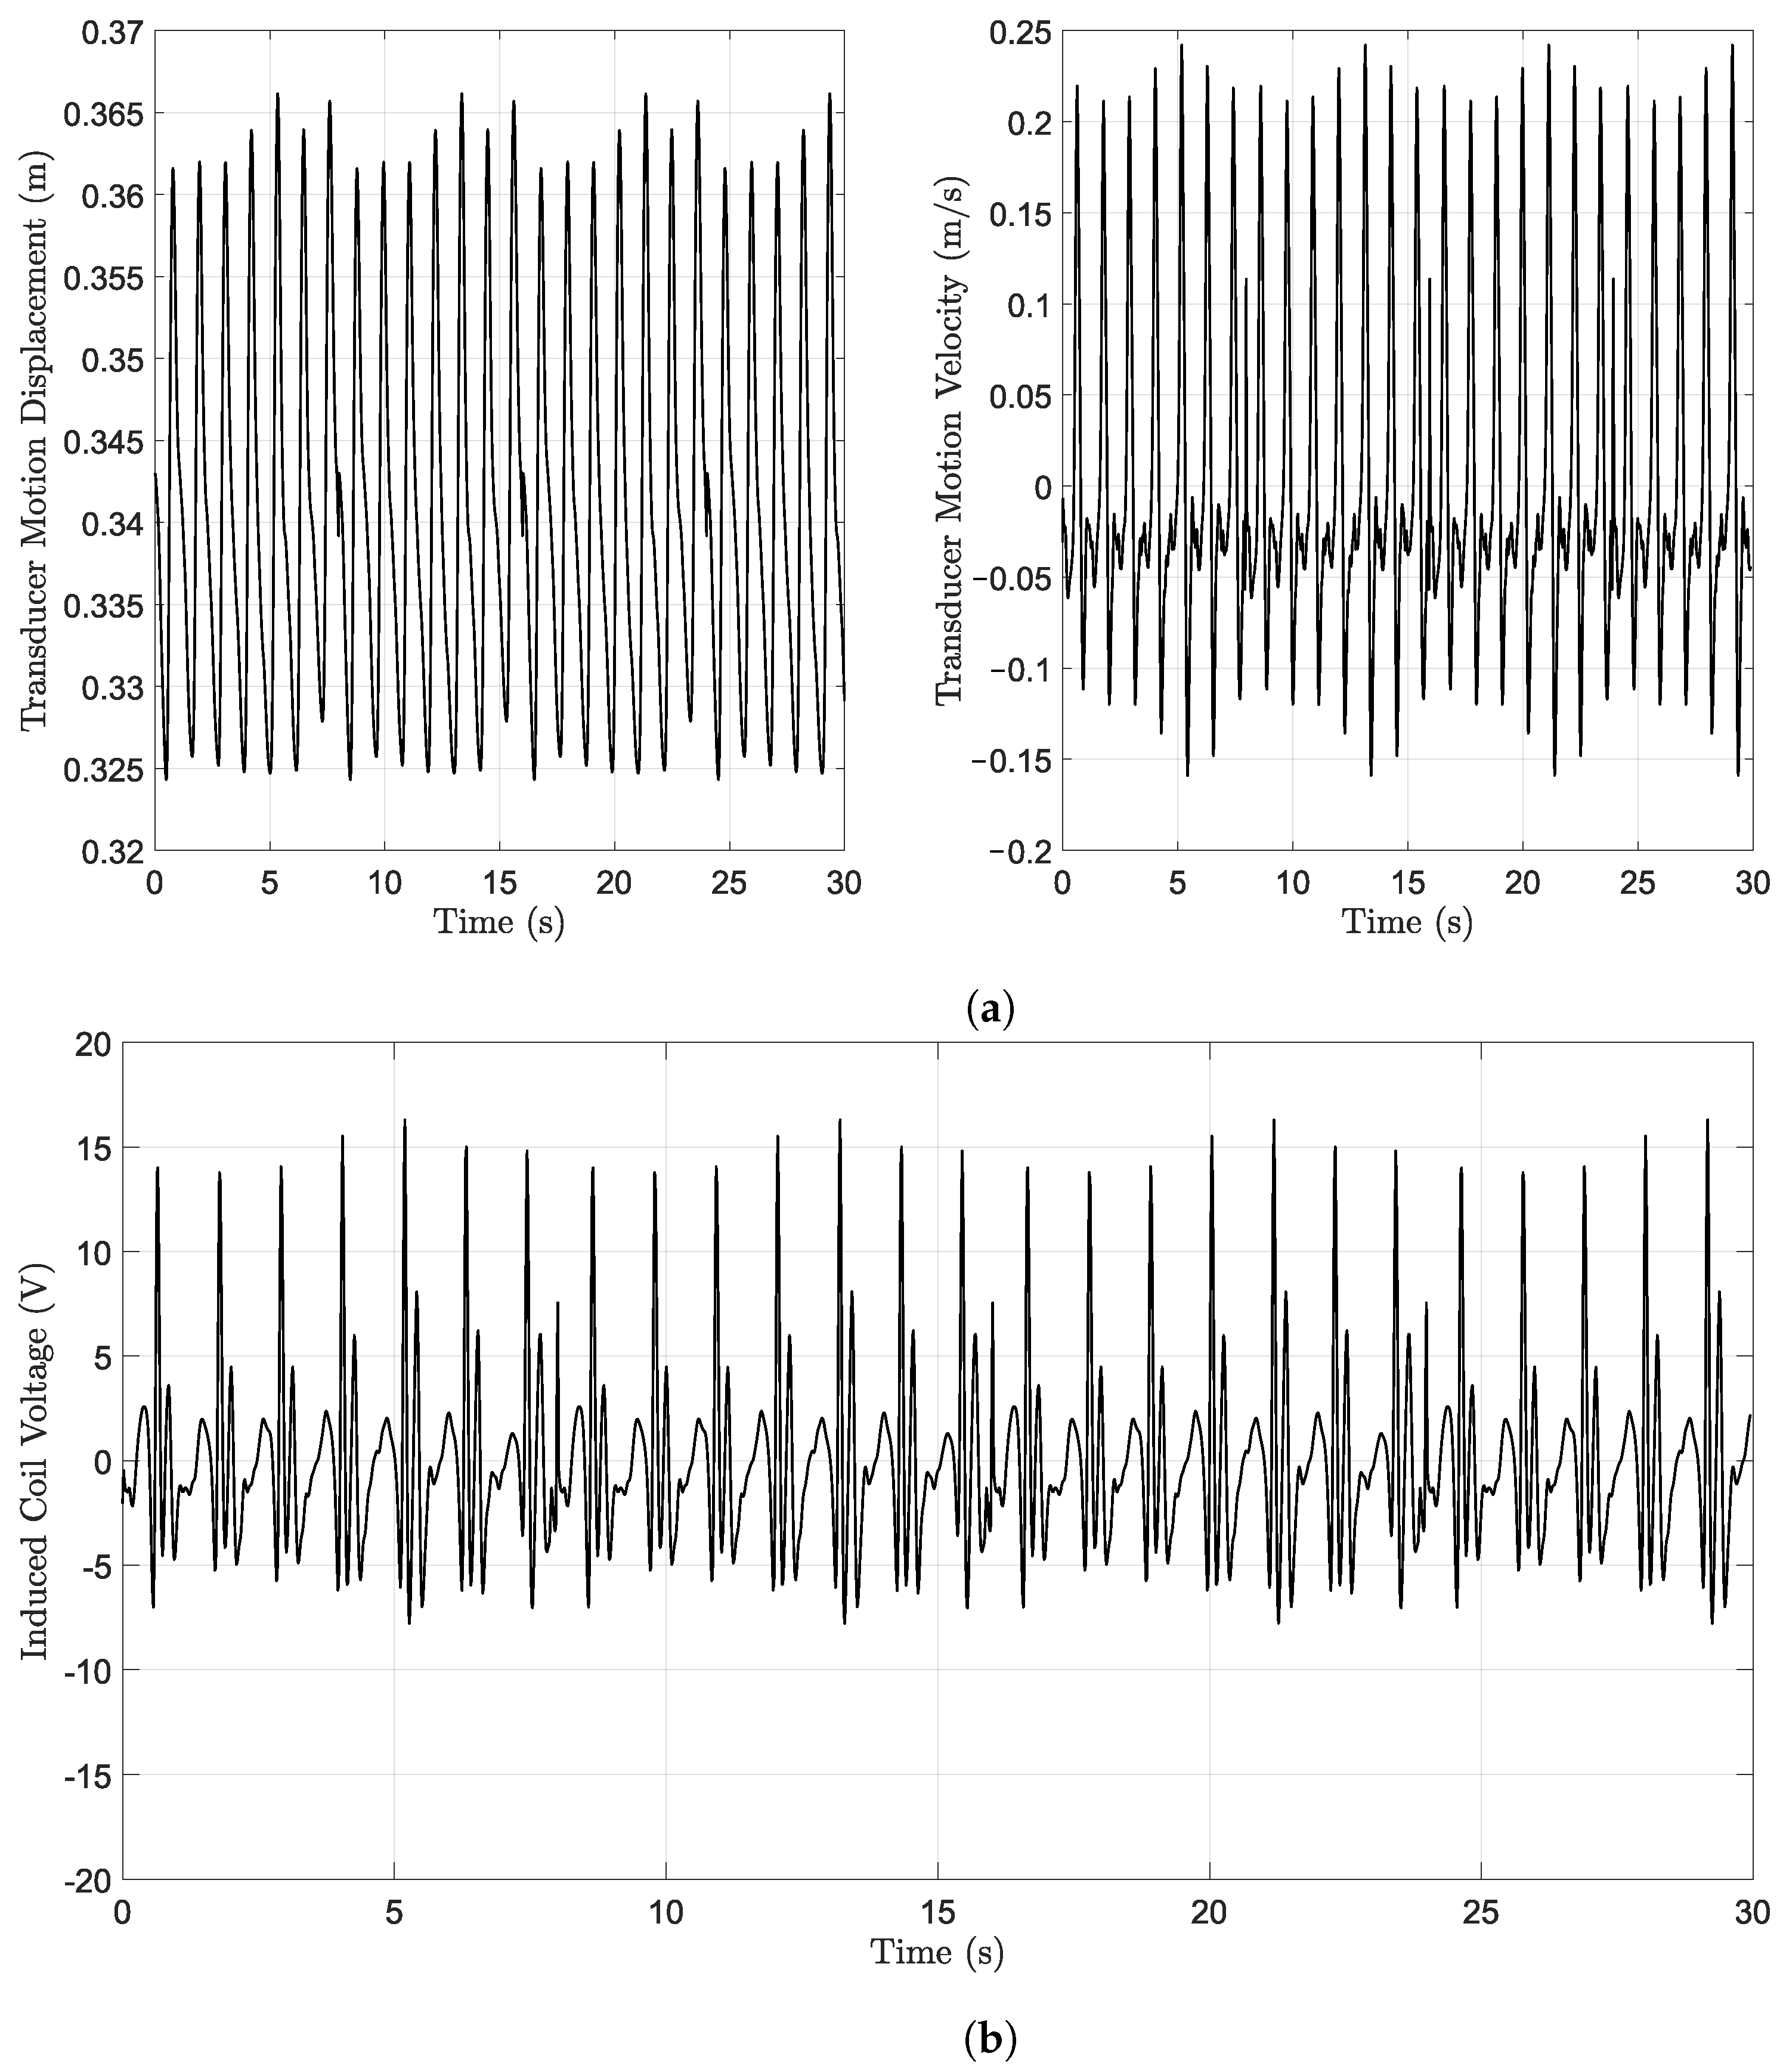
Figure 16a depicts the motion of the electromagnetic transducer driven by the ankle joint. The maximum velocity reached by the transducer is close to 0.25 m/s. The induced coil voltage of the transducer is shown in Figure 16b. The generated voltage contains peaks of power of around 15 V.
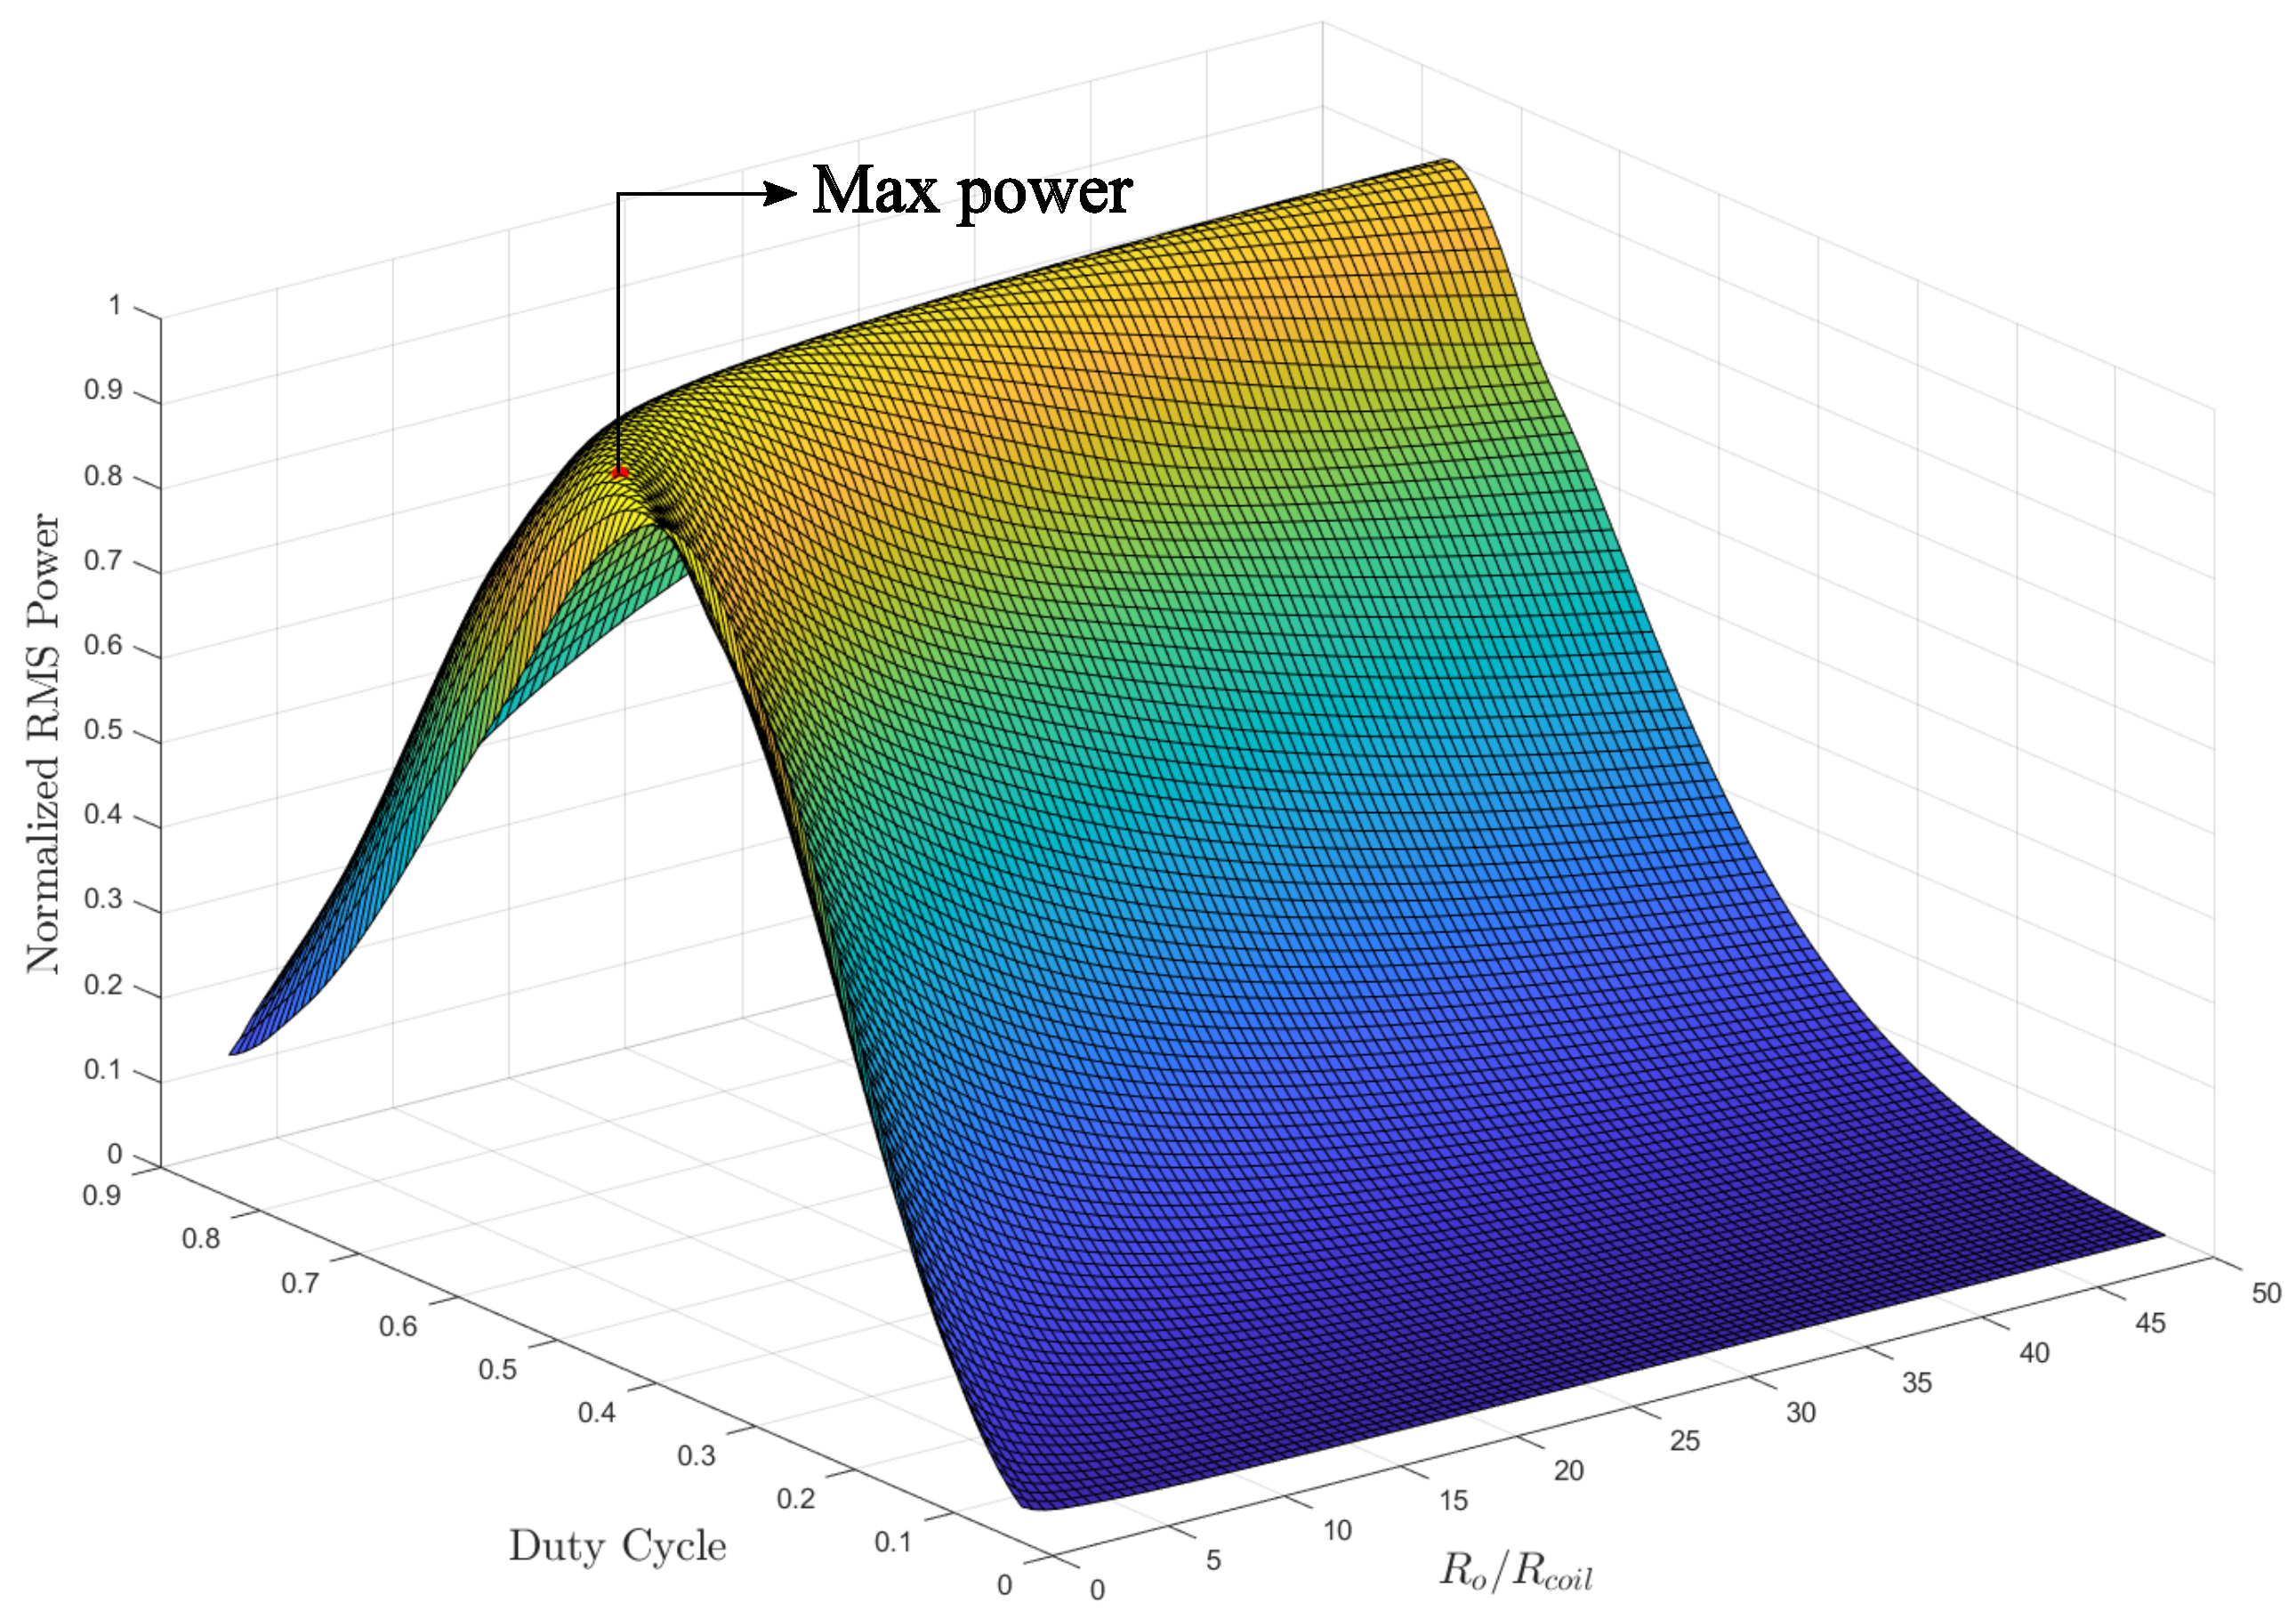
Figure 17 shows the RMS load voltage of the implemented energy harvesting system considering different PWM duty cycles and values of load resistance. The point of maximum RMS power is found when the PWM duty cycle is close to 0.5, and the load resistance is about 34 Ω.
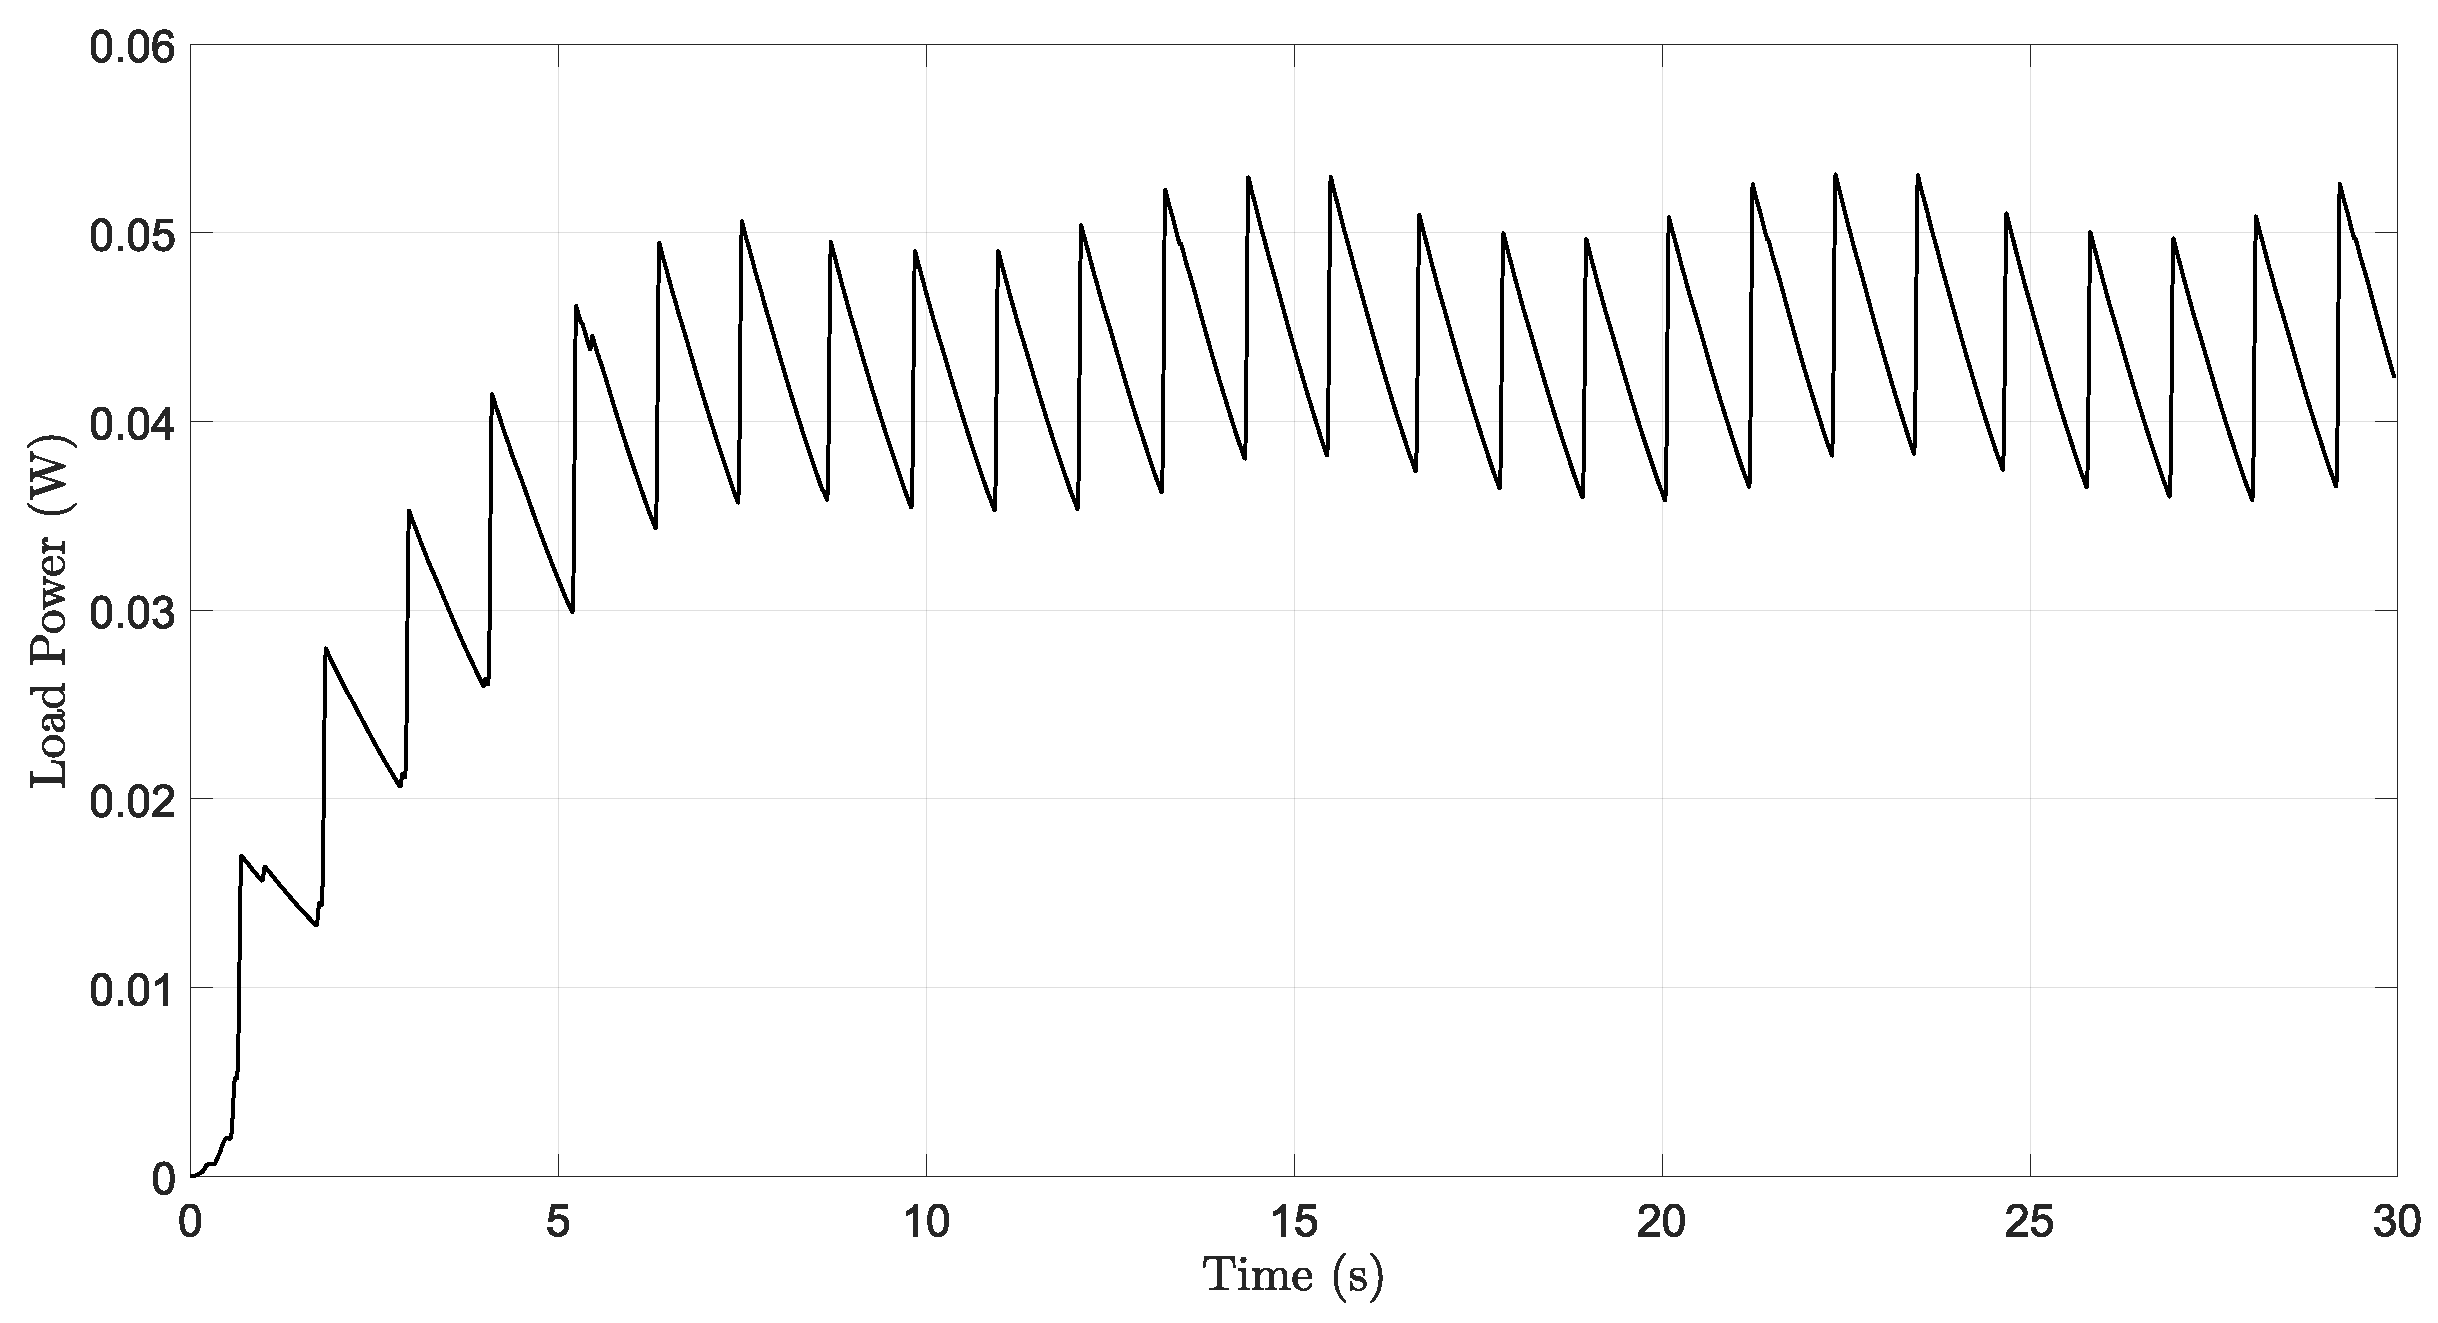
The PWM duty cycle and load resistance selected were 0.5 and 750 Ω, respectively. The time response of the state-space variables representing the modeled system is shown in Figure 18. Figure 19 shows the generated power. The load power finally has an average value of 0.045 W, and the stabilization time amounts to 12 s.
Recurrence plots estimated for the time histories of the considered physical quantities measured and calculated for the electromagnetic harvester attached to the ankle are depicted in Figure 20. As in the case of the other measurement points, the analysis was carried out for 3500 samples in the steady-state.
The estimated power delivered from the hip, knee, and ankle joints to the electrical load connected to the power conditioning circuit is characterized by oscillations, which were not smoothed by the circuit. However, the amplitude of the oscillations is small enough to consider the behavior of the power time history to be constant when the system reaches a steady-state.
The efficiency of the energy harvesting system is calculated by relating the load power, which is the power delivered from the energy harvester system and the power lost in the internal resistance of the transducer coils:
η = P l o a d P l o s t + P l o a d
where P l o s t is the power dissipated in the transducer internal resistance and P l o a d is the power load.
The estimated average efficiency of the device was 0.3. However, the energy dissipated due to the friction between the parts of the electromagnetic transducer, the internal resistance of the power conditioning circuit elements, and the power lost in the wires were not considered. The most common location for electromagnetic energy harvesters is the knee joint since its movement exhibits the highest velocities compared to the other lower limb joints. Most of the methods used are based on designing and mounting the device in the human body, contrary to the approach followed in this research. Table 3 presents a comparison of different technologies encountered in the literature:
It is difficult to compare the achievements of different researchers presented in the literature since they concern different locations of energy harvesting and devices of different structural parameters and operational conditions.

4.4. RQA Measures

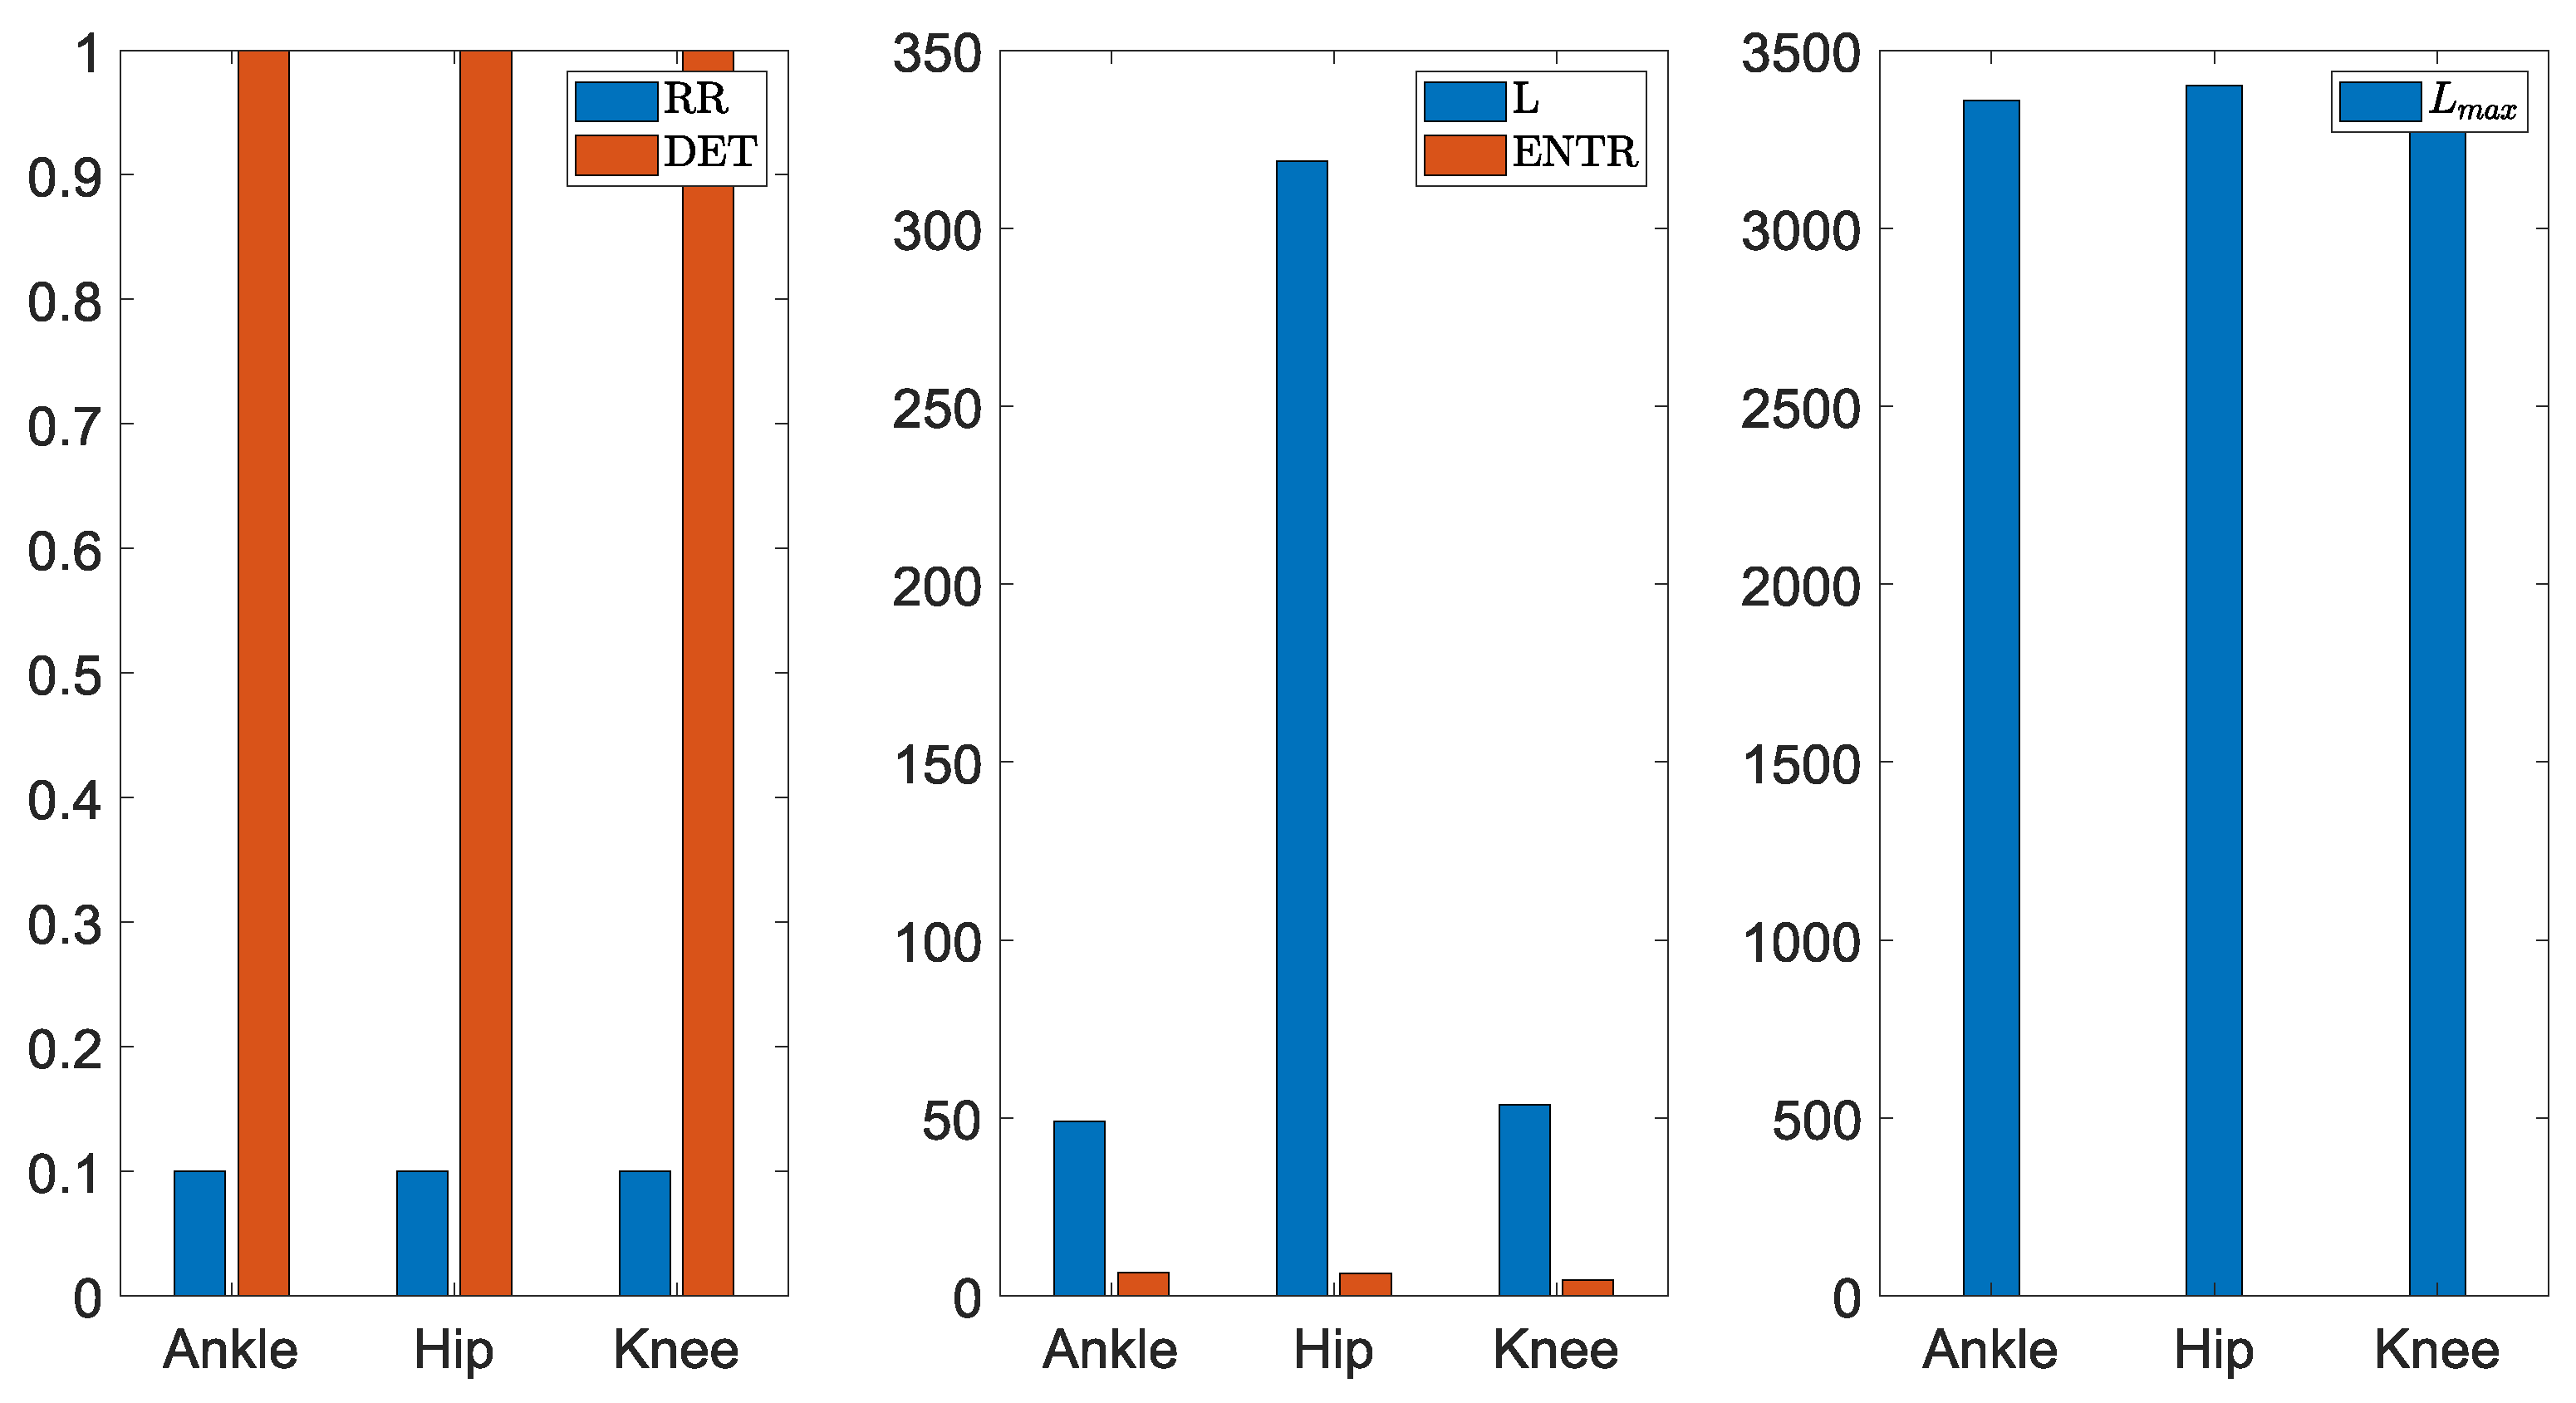
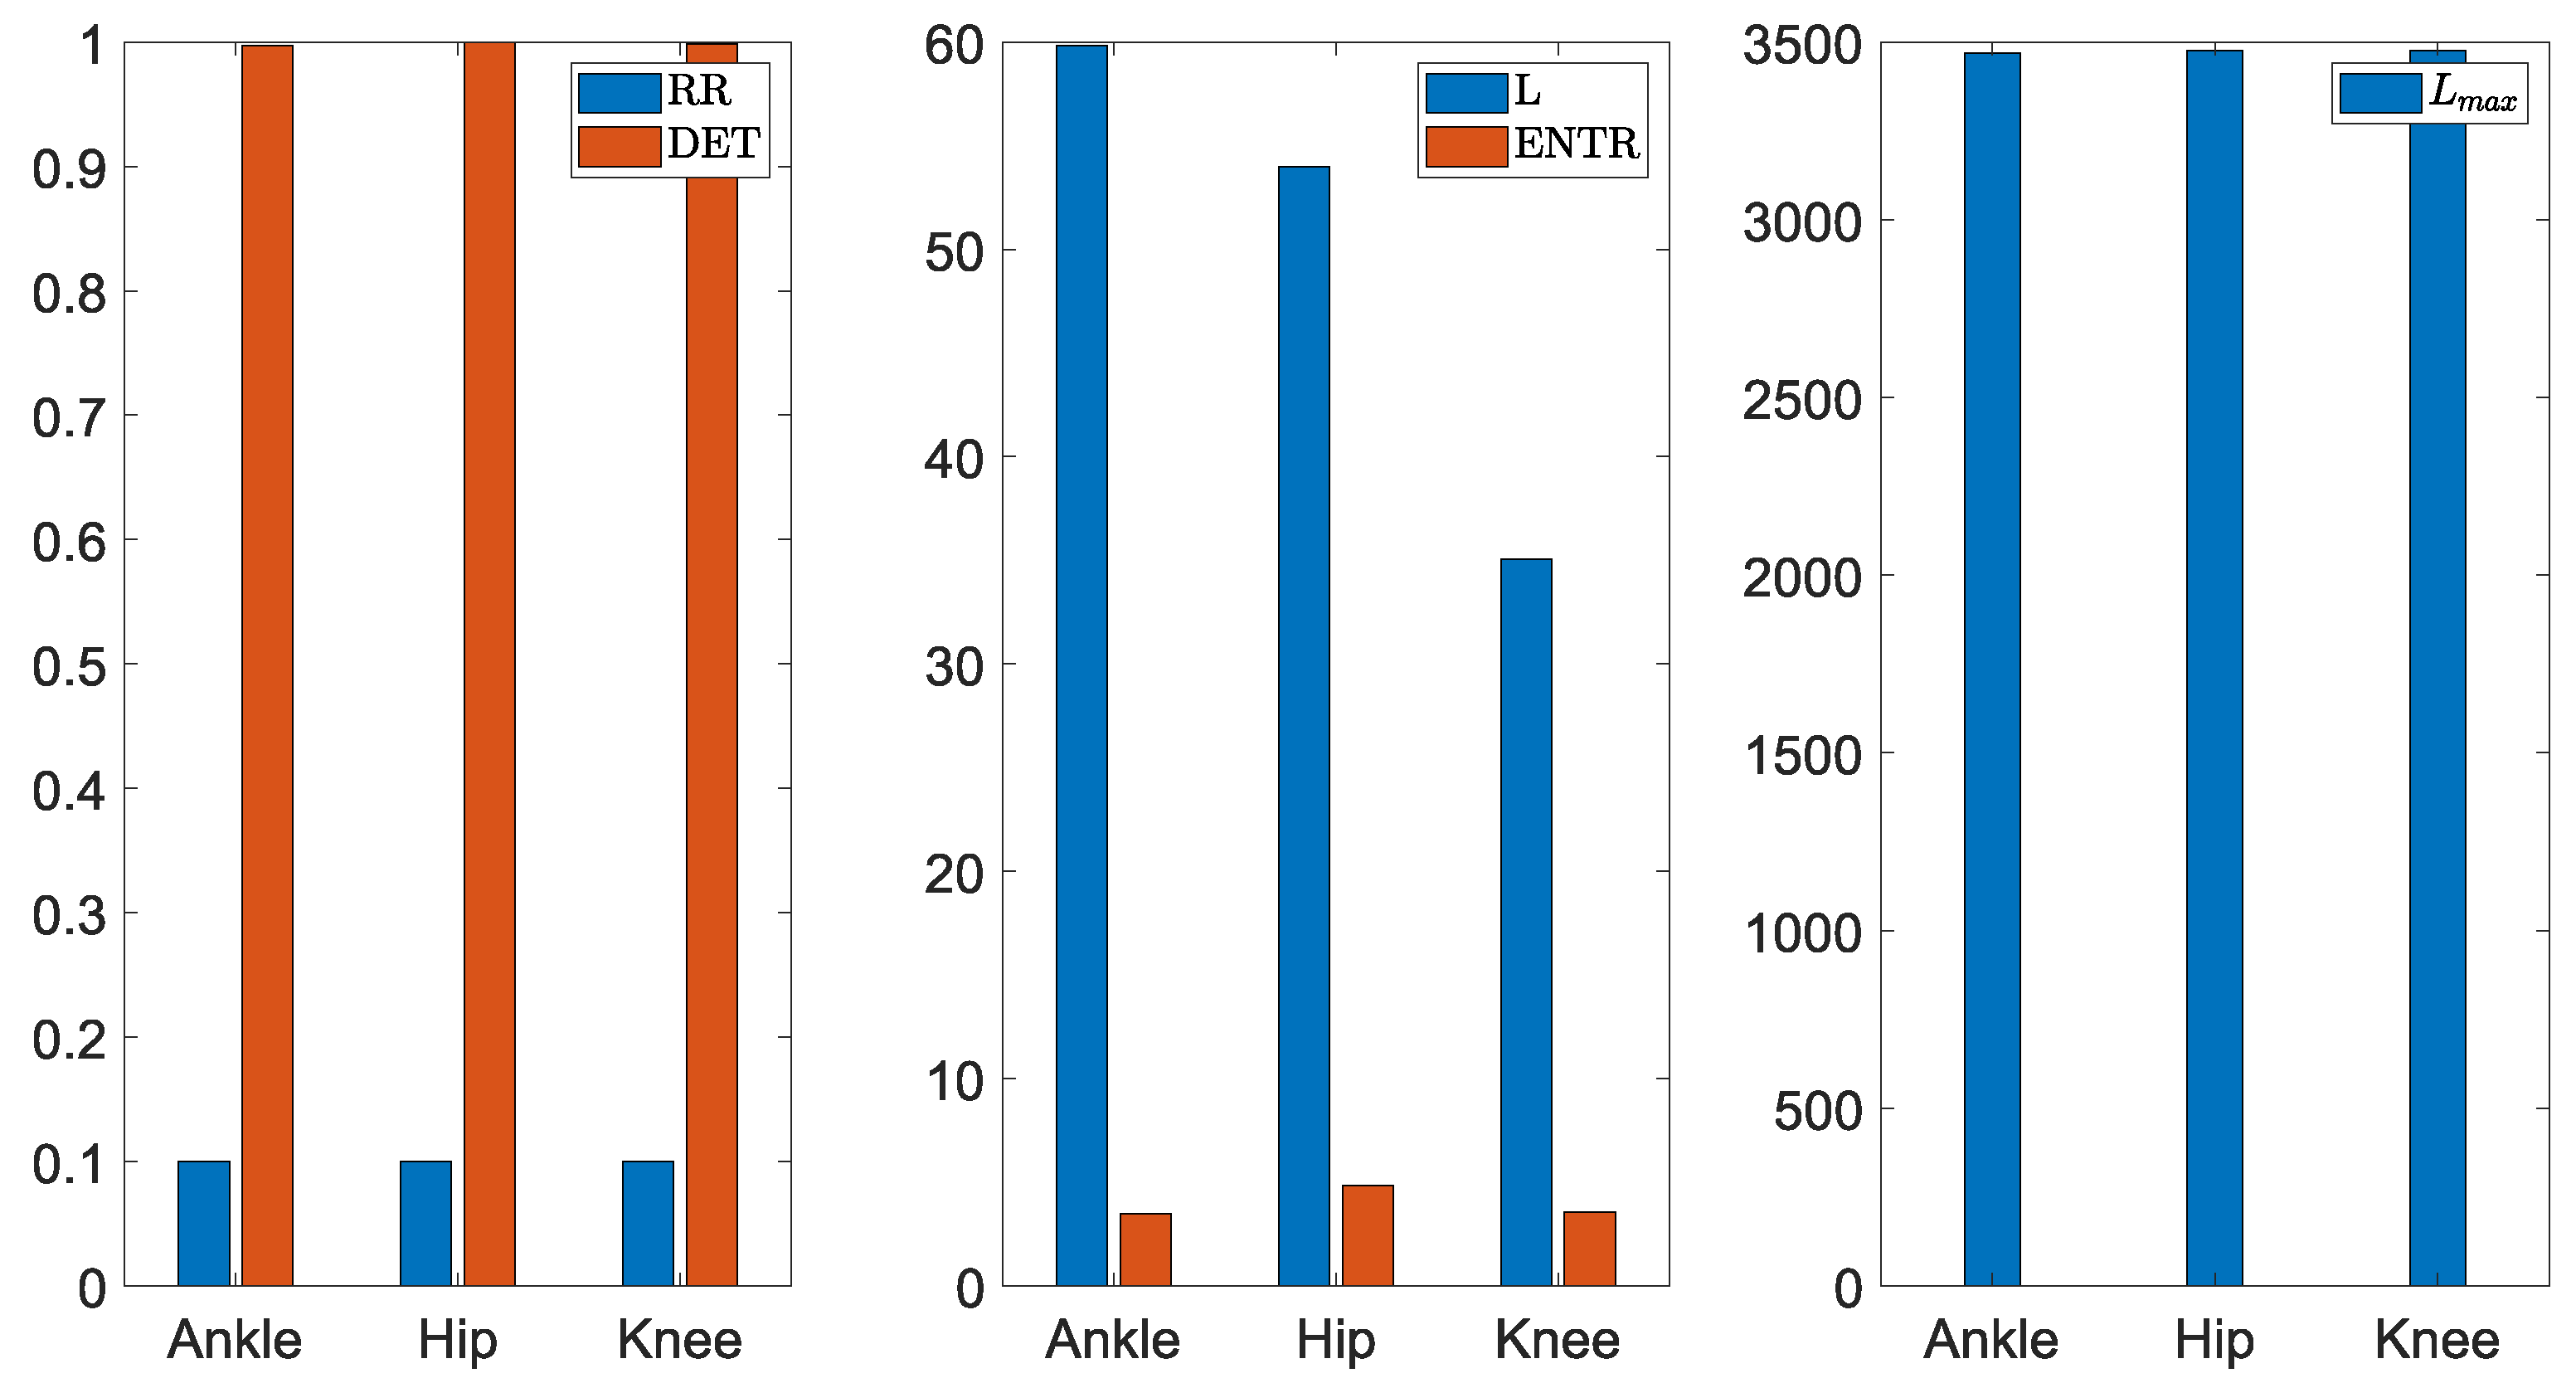
Estimated RPs provide valuable insights into the dynamics of the considered systems. However, in various practical applications, the interpretation of the patterns and structures presented within the recurrence plot can be difficult and, moreover, depend on the researcher’s intuition and experience. In order to overcome the subjectivity of interpretation, in the 1990s, Zbilut and Webber formulated five complexity measures based on diagonal structures in RPs called recurrence quantification analysis (RQA) [27]. Since not only diagonal but also vertical and horizontal elements are present in the RPs, additional measures have been proposed by Marwan et al. [35]. Contrary to the five “classical” RQA measures, the new measures are able to detect, e.g., chaos–chaos transitions [36] and chaos–order transitions [29]. In this paper, based on the computed recurrence plots, the “classical” RQA analysis (proposed by Zbilut and Webber) was carried out. Obtained results are gathered in Table 4. Computations were performed with the application of CRP Toolbox for MATLAB [37].
In order to compare and interpret the meaning of the values of the RQA measures determined for the considered lower limb joints, the graphical representation of the results obtained for the input ( R V ) and output ( L P ) signals has been provided (Figure 21 and Figure 22, respectively). As the result of F A N criterion selection, according to which all the columns of the R matrix have the same recurrence density [30], values of the R R measures obtained for the R V signals measured for all joints are equal (Figure 21).
The second considered measure— D E T —describes whether the system of interest is more likely to exhibit periodic behavior or chaotic processes. In the case of periodic signals, the diagonal lines visible on the recurrence plots are long (like in the case of the R V signals analyzed in this paper). Moreover, the estimated values of D E T measure for all the joints are equal up to the third decimal place. The periodic character of the analyzed R V signal, which is characterized by long diagonal lines on the RP, is also confirmed by the values of the L and L m a x measures, which describe the average diagonal line length (L) and the length of the longest diagonal within the entire RP ( L m a x ), respectively.
Values of the E N T R measure (Shannon entropy of the frequency distribution of the diagonal line lengths) reflect the complexity of the deterministic structure of the analyzed system. Since in the case of the considered R V signals, the E N T R values are small, they prove the low dynamic complexity of the considered system (periodic system behavior).
In the case of the L P output signal, as the result of F A N criterion selection, values of the R R measure obtained for all the joints are equal (Figure 22).
As in the case of the input signal, the estimated values of D E T measurements for all the joints, as well as the values of the L and L m a x measures, prove the periodic character of the analyzed L P signals. Values of the E N T R measure are small, proving the low dynamic complexity and periodic behavior of the considered L P signals.
To the best of our knowledge, the approach that follows in this study has been little implemented in other investigations. Real gait data from different joints were collected and used as an input mechanical variable for the energy harvesting device. A model was used to estimate the voltage induced by an electromagnetic energy harvesting device, considering each lower limb joint as a different energy source. In the paper, the authors compared the internal dynamic processes and system output quality for three different device locations: on the ankle, knee, and hip, respectively. The influence of the power conditioning circuit on the performance of the energy harvesting structure was studied by numerical simulation. Finally, a dynamic analysis of the system state variables was carried out, which allowed the detection of unwanted phenomena, such as chaos, unwanted oscillations, overshoots, and instability.

5. Conclusions

The paper presented the application of an electromagnetic transducer with its power conditioning circuit for harvesting energy from human walking. The proposed harvester structure makes it possible to transform the angular kinetic energy associated with the lower limb movement into electrical energy and deliver it to a low-power electronic device with a semi-stable output voltage level. An experimental study with a participant walking at constant speed was conducted to acquire real data of each of the lower limb joint movements. The interaction of the harvester structure and the power conditioning circuit was studied through the state-space averaging method. Its dynamic features were analyzed using recurrence plots and recurrence quantification analysis.
During the carried out research, satisfactory results have been obtained that demonstrate the viability of devices based on electromagnetic induction to collect energy from walking. The estimated harvesting power generated by the knee joint is large enough to power portable electronic devices up to 90 mW when the user is walking at a speed of 4.5 km/h. The same device mounted on a different lower limb joint generates considerably different electrical energy in the range of 1.4 mW to 90 mW without implementing multiplier gear. The stabilization time of the system is around 10 s to 15 s. Due to the sensitivity to changes in the dynamic behavior of the analyzed system, RP and RQA provide a valuable tool to quantify the analysis of different conditions and device configurations, as well as their influence on the periodic input–output waveforms, power output, and internal processes.
Further research on the control strategy of the power conditioning circuit would improve the performance of the device, which was considered to have a fixed PWM duty cycle in this study.

Author Contributions

Conceptualization, L.M.A. and M.I.; methodology, L.M.A. and J.I.; software, L.M.A. and J.I.; formal analysis, L.M.A., J.I. and M.I.; investigation, L.M.A.; data curation, L.M.A.; writing—original draft preparation, L.M.A.; writing—review and editing, L.M.A. and J.I.; visualization, L.M.A.; supervision, J.I. and M.I. All authors have read and agreed to the published version of the manuscript.

Funding

The paper publication fee was funded under subvention funds for the Faculty of Mechanical Engineering and Robotics and by the program “Excellence Initiative—Research University” for the AGH “University of Science and Technology”.

Institutional Review Board Statement

Not applicable.

Informed Consent Statement

Informed consent was obtained from all subjects involved in the study.

Acknowledgments

J.I. would like to thank for the financial support of the research from the POIR.04.01.04-00-0115/17 project.

Conflicts of Interest

The authors declare no conflict of interest.

References

  1. Khalid, S.; Raouf, I.; Khan, A.; Kim, N.; Kim, H.S. A Review of Human-Powered Energy Harvesting for Smart Electronics: Recent Progress and Challenges. Int. J. Precis. Eng. Manuf. Green Technol. 2019, 6, 821–851. [Google Scholar] [CrossRef]
  2. Choi, Y.M.; Lee, M.G.; Jeon, Y. Wearable biomechanical energy harvesting technologies. Energies 2017, 10, 1483. [Google Scholar] [CrossRef] [Green Version]
  3. Niu, P.; Chapman, P.; Riemer, R.; Zhang, X. Evaluation of motion and actuation methods for biomechanical energy harvesting. In Proceedings of the IEEE Annual Power Electronics Specialists Conference, Aachen, Germany, 20–25 June 2004; Volume 3, pp. 2100–2106. [Google Scholar] [CrossRef]
  4. Shi, H.; Liu, Z.; Mei, X. Overview of human walking induced energy harvesting technologies and its possibility for walking robotics. Energies 2019, 13, 86. [Google Scholar] [CrossRef] [Green Version]
  5. Donelan, J.M.; Li, Q.; Naing, V.; Hoffer, J.A.; Weber, D.J.; Kuo, A.D. Biomechanical energy harvesting: Generating electricity during walking with minimal user effort. Science 2008, 319, 807–810. [Google Scholar] [CrossRef] [PubMed]
  6. Liu, H.; Hou, C.; Lin, J.; Li, Y.; Shi, Q.; Chen, T.; Sun, L.; Lee, C. A non-resonant rotational electromagnetic energy harvester for low-frequency and irregular human motion. Appl. Phys. Lett. 2018, 113. [Google Scholar] [CrossRef] [Green Version]
  7. Lin, J.; Liu, H.; Chen, T.; Yang, Z.; Sun, L. A rotational wearable energy harvester for human motion. In Proceedings of the 2017 IEEE 17th International Conference on Nanotechnology, NANO 2017, Pittsburgh, PA, USA, 25–28 July 2017; pp. 22–25. [Google Scholar] [CrossRef]
  8. Cai, Q.l.; Zhu, S. Enhancing the performance of electromagnetic damper cum energy harvester using microcontroller: Concept and experiment validation. Mech. Syst. Signal Process. 2019, 134, 106339. [Google Scholar] [CrossRef]
  9. Hu, Y.; Xue, H.; Hu, T.; Hu, H. Nonlinear interface between the piezoelectric harvesting structure and the modulating circuit of an energy harvester with a real storage battery. IEEE Trans. Ultrason. Ferroelectr. Freq. Control 2008, 55, 148–159. [Google Scholar] [CrossRef] [PubMed]
  10. Lefeuvre, E.; Audigier, D.; Richard, C.; Guyomar, D. Buck-boost converter for sensorless power optimization of piezoelectric energy harvester. IEEE Trans. Power Electron. 2007, 22, 2018–2025. [Google Scholar] [CrossRef]
  11. Abouloifa, A.; Greyc, F.G. Nonlinear control of buck-boost AC/DC converters: Output voltage regulation & power factor correction. Proc. Am. Control Conf. 2004, 1, 168–173. [Google Scholar] [CrossRef]
  12. Tang, X.; Lin, T.; Zuo, L. Design and optimization of a tubular linear electromagnetic vibration energy harvester. IEEE/ASME Trans. Mechatron. 2014, 19, 615–622. [Google Scholar] [CrossRef]
  13. Duong, M.T.; Chun, Y.D.; Hong, D.K. Design of a high-performance 16-slot 8-pole electromagnetic shock absorber using a novel permanent magnet structure. Energies 2018, 11, 3352. [Google Scholar] [CrossRef] [Green Version]
  14. Zhu, S.; Shen, W.A.; Xu, Y.L. Linear electromagnetic devices for vibration damping and energy harvesting: Modeling and testing. Eng. Struct. 2012, 34, 198–212. [Google Scholar] [CrossRef] [Green Version]
  15. Eriksson, S. Design of permanent-magnet linear generators with constant-torque-angle control for wave power. Energies 2019, 12, 1312. [Google Scholar] [CrossRef] [Green Version]
  16. Asadi, E.; Ribeiro, R.; Behrad Khamesee, M.; Khajepour, A. A new adaptive hybrid electromagnetic damper: Modelling, optimization, and experiment. Smart Mater. Struct. 2015, 24, 75003. [Google Scholar] [CrossRef]
  17. Middlebrook, R.D.; Ćuk, S. A general unified approach to modelling switching-converter power stages. Int. J. Electron. 1977, 42, 521–550. [Google Scholar] [CrossRef]
  18. Krein, P.T.; Lesieutre, B.L.C.; Bentsman, J.; Bass, R.M.; Lesieutre, B.L.C. On the Use of Averaging for the Analysis of Power Electronic Systems. Comput. Eng. 1989, 5, 463–467. [Google Scholar] [CrossRef]
  19. Villalva, M.G.; Filho, E.R. Buck converter with variable input voltage for photovoltaic applications. In Proceedings of the Brazilian Power Electronics Conference, Blumenau, Brazil, 30 September–4 October 2007. [Google Scholar]
  20. Puig, A.; Escalona, C.; Padullés, J.; Busquets, A.; Padullés, X.; Marcos, D. Validity and reliability of the Kinovea program in obtaining angles and distances using coordinates in 4 perspectives. PLoS ONE 2019, 14, e2843847. [Google Scholar] [CrossRef]
  21. Poincaré, H. Sur le probléme des trois corps et les équations de la dynamique. Acta Math. 1890, 13. [Google Scholar] [CrossRef]
  22. Eckmann, J.P.; Oliffson Kamphorst, O.; Ruelle, D. Recurrence plots of dynamical systems. Erophycics Lett. 1987, 4, 973–977. [Google Scholar] [CrossRef] [Green Version]
  23. Marwan, N.; Carmen Romano, M.; Thiel, M.; Kurths, J. Recurrence plots for the analysis of complex systems. Phys. Rep. 2007, 438, 237–329. [Google Scholar] [CrossRef]
  24. Kantz, H.; Schreiber, T. Nonlinear Time Series Analysis; Cambridge University Press: Cambridge, UK, 2004; p. 388. [Google Scholar] [CrossRef]
  25. Cao, L. Practical method for determining the minimum embedding dimension of a scalar time series. Phys. D Nonlinear Phenom. 1997, 110, 43–50. [Google Scholar] [CrossRef]
  26. Zbilut, J.P.; Giuliani, A.; Webber, C.L., Jr. Recurrence quantification analysis and principal components in the detection of short complex signals. Phys. Lett. A 1998, 237, 131–135. [Google Scholar] [CrossRef] [Green Version]
  27. Zbilut, J.P.; Webber, C.L. Embeddings and delays as derived from quantification of recurrence plots. Phys. Lett. A 1992, 171, 199–203. [Google Scholar] [CrossRef]
  28. Wheeler, H.A. Inductance Formulas for Circular and Square Coils. Proc. IEEE 1982, 70, 1449–1450. [Google Scholar] [CrossRef]
  29. Webber, C.L.; Norbertt, M. Recurrence Quantification Analysis Theory and Best Practices-Understanding Complex Systems; Springer International Publishing: Cham, Switzerland, 2015. [Google Scholar] [CrossRef]
  30. Zhu, D.; Duarte-Rabelo, I.; Ayala-Garcia, I.N.; Somov, A. An electromagnetic in-shoe energy harvester using wave springs. In Proceedings of the 2018 IEEE Industrial Cyber-Physical Systems, ICPS 2018, St. Petersburg, Russia, 15–18 May 2018; pp. 659–663. [Google Scholar] [CrossRef]
  31. Niroomand, M.; Foroughi, H.R. A rotary electromagnetic microgenerator for energy harvesting from human motions. J. Appl. Res. Technol. 2016, 14, 259–267. [Google Scholar] [CrossRef] [Green Version]
  32. Wang, W.; Cao, J.; Zhang, N.; Lin, J.; Liao, W.H. Magnetic-spring based energy harvesting from human motions: Design, modeling and experiments. Energy Convers. Manag. 2017, 132, 189–197. [Google Scholar] [CrossRef]
  33. Halim, M.A.; Cho, H.; Park, J.Y. Design and experiment of a human-limb driven, frequency up-converted electromagnetic energy harvester. Energy Convers. Manag. 2015, 106, 393–404. [Google Scholar] [CrossRef]
  34. Saha, C.R.; O’Donnell, T.; Wang, N.; McCloskey, P. Electromagnetic generator for harvesting energy from human motion. Sens. Actuators A Phys. 2008, 147, 248–253. [Google Scholar] [CrossRef]
  35. Marwan, N.; Wessel, N.; Meyerfeldt, U.; Schirdewan, A.; Kurths, J. Recurrence-plot-based measures of complexity and their application to heart-rate-variability data. Phys. Rev. E 2002, 66. [Google Scholar] [CrossRef] [PubMed] [Green Version]
  36. Ngamga, E.J.; Nandi, A.; Ramaswamy, R.; Romano, M.C.; Thiel, M.; Kurths, J. Recurrences of strange attractors. Pramana J. Phys. 2008, 70, 1039–1045. [Google Scholar] [CrossRef]
  37. Marwan, N. Cross Recurrence Plot Toolbox for Matlab Reference Manual. Available online: https://tocsy.pik-potsdam.de/CRPtoolbox/ (accessed on 15 April 2021).
Figure 1. (a) Location of the electromagnetic transducer and estimated joints power throughout the gait cycle; (b) Scheme of the comprehensive system under study.
Energies 14 03367 g001
Figure 2. Notation used for the electromagnetic transducer.
Energies 14 03367 g002
Figure 3. Power conditioning circuit (a) on state switch ON and (b) on state switch off.
Energies 14 03367 g003
Figure 4. (a) Experimental gait study; (b) Lower limb joint angular displacement at different walking speeds.
Energies 14 03367 g004
Figure 5. Kinematic scheme of the electromagnetic transducer.
Energies 14 03367 g005
Figure 6. (a) Linear motion; and (b) Induced coil voltage of the hip-mounted electromagnetic transducer at a walking speed of 4.5 km/h.
Energies 14 03367 g006
Figure 7. RMS output power of the hip-mounted energy harvesting system with respect to the duty cycle and load resistance.
Energies 14 03367 g007
Figure 8. Time response of the state-space variables of the hip-mounted energy harvesting system.
Energies 14 03367 g008
Figure 9. Estimated load power of the hip-mounted energy harvesting system when walking at a speed of 4.5 km/h.
Energies 14 03367 g009
Figure 10. Recurrence plots obtained from the hip-mounted energy harvesting system quantities. (a) rotational velocity; (b) induced coil voltage; (c) transducer coil current; (d) rectifier voltage; (e) converter coil current; (f) load voltage.
Energies 14 03367 g010
Figure 11. (a) Linear motion; and (b) Induced coil voltage of the knee-mounted electromagnetic transducer at a walking speed of 4.5 km/h.
Energies 14 03367 g011
Figure 12. RMS output power of the knee-mounted energy harvesting system with respect to the duty cycle and load resistance.
Energies 14 03367 g012
Figure 13. Time response of the state-space variables of the knee-mounted energy harvesting system.
Energies 14 03367 g013
Figure 14. Estimated load power of the knee-mounted energy harvesting system when walking at a speed of 4.5 km/h.
Energies 14 03367 g014
Figure 15. Recurrence plots obtained from the knee-mounted energy harvesting system quantities. (a) rotational velocity; (b) induced coil voltage; (c) transducer coil current; (d) rectifier voltage; (e) converter coil current; (f) load voltage.
Energies 14 03367 g015
Figure 16. (a) Linear motion; and (b) Induced coil voltage of the hip-mounted electromagnetic transducer at a walking speed of 4.5 km/h.
Energies 14 03367 g016
Figure 17. RMS output power of the ankle-mounted energy harvesting system with respect to the duty cycle and load resistance.
Energies 14 03367 g017
Figure 18. Time response of the state-space variables of the ankle-mounted energy harvesting system.
Energies 14 03367 g018
Figure 19. Load power of the energy harvesting system mounted on the ankle joint.
Energies 14 03367 g019
Figure 20. Recurrence plots obtained from the ankle-mounted energy harvesting system quantities; (a) rotational velocity; (b) induced coil voltage; (c) transducer coil current; (d) rectifier voltage; (e) converter coil current; (f) load voltage.
Energies 14 03367 g020
Figure 21. Graphical representation of the RQA measures estimated for the R V (input) signal.
Energies 14 03367 g021
Figure 22. Graphical representation of the RQA measures estimated for the L P (output) signal.
Energies 14 03367 g022
Table 1. Dimensions and magnetic properties of the electromagnetic transducer.
SymbolValueDescription
τ m 10 mmMagnet Height
r s 3 mmShaft Radius
r w r s 8 mmMagnet Width
r a r w 1.5 mmAir Gap between stator and slider
τ i 10 mmTooth Height
r c r a 9.5 mmCoil Width
r p r c 3 mmStator Shell Thickness
d z 0.4 mmWire Diameter Width
B r e m 1.23 TRemanent Magnetic Flux Density
N593Turns Coils Width
n C 5Number of Coils
Table 2. Parameter values of the power conditioning circuit and electromagnetic transducer.
SymbolValueDescription
R f 42.7 ΩTransducer resistance
L f 286 mHTransducer inductance
C f 0.8 mFRectifier capacitance
L o 50 mHConverter inductance
C o 8.5 mFConverter capacitance
R o 750 ΩLoad resistance
Table 3. Comparison of electromagnetic technology used for harvesting energy from the human movement.
Output PowerLocationMethodsInputRef.
10.4 mWKnee jointMeasurement and simulation8 Hz[6]
0.2 mW/cm3Ankle jointMeasurement8 km/h[7]
1.6 mWShoesMeasurement [30]
416.6 μWAnkle jointMeasurement and simulation [31]
0.42 mWLegMeasurement and simulation [32]
0.84 mWHandMeasurement and simulation5 Hz[33]
2.46 mWBackMeasurement and Simulation [34]
1.4 mWHip jointSimulation4.5 km/h
90 mWKnee jointSimulation4.5 km/h
45 mWAnkle jointSimulation4.5 km/h
Table 4. Results of the carried out recurrence quantification analysis.
RRDETLLmaxENTR
Hip Joint
Rotational Joint Velocity ( R V )0.09970.9999318.805634006.2370
Transducer Induced Voltage ( T I V )0.09970.9999251.318334006.0501
Transducer Inductance Current ( S V 1 )0.09970.999871.106134004.9530
Rectifier Voltage ( S V 2 )0.09970.999766.280932004.8355
Converter Inductance Current ( S V 3 )0.09970.999127.786931003.9821
Load Voltage ( L V )0.09980.999753.970934754.8245
Load Power ( L P )0.09980.999753.991834754.8256
Knee Joint
Rotational Joint Velocity ( R V )0.09970.999653.639033204.4041
Transducer Induced Voltage ( T I V )0.09980.996726.713421214.0428
Transducer Inductance Current ( S V 1 )0.09980.998724.726621223.9134
Rectifier Voltage ( S V 2 )0.09970.998631.043825044.0277
Converter Inductance Current ( S V 3 )0.09970.84285.831733942.3226
Load Voltage ( L V )0.09980.998535.100834753.5716
Load Power ( L P )0.09980.998635.067934753.5702
Ankle Joint
Rotational Joint Velocity ( R V )0.09970.999549.058433604.5180
Transducer Induced Voltage ( T I V )0.09970.998932.525034404.1800
Transducer Inductance Current ( S V 1 )0.09970.998725.121419883.9726
Rectifier Voltage ( S V 2 )0.09970.999334.863334404.2629
Converter Inductance Current ( S V 3 )0.09990.88537.275934262.5351
Load Voltage ( L V )0.09970.997259.333634703.4533
Load Power ( L P )0.09970.997259.821734703.4741
Publisher’s Note: MDPI stays neutral with regard to jurisdictional claims in published maps and institutional affiliations.