
Modeling and Analysis of the Power Conditioning Circuit for an Electromagnetic Human Walking-Induced Energy Harvester


Abstract
:1. Introduction
2. System Description and Modeling
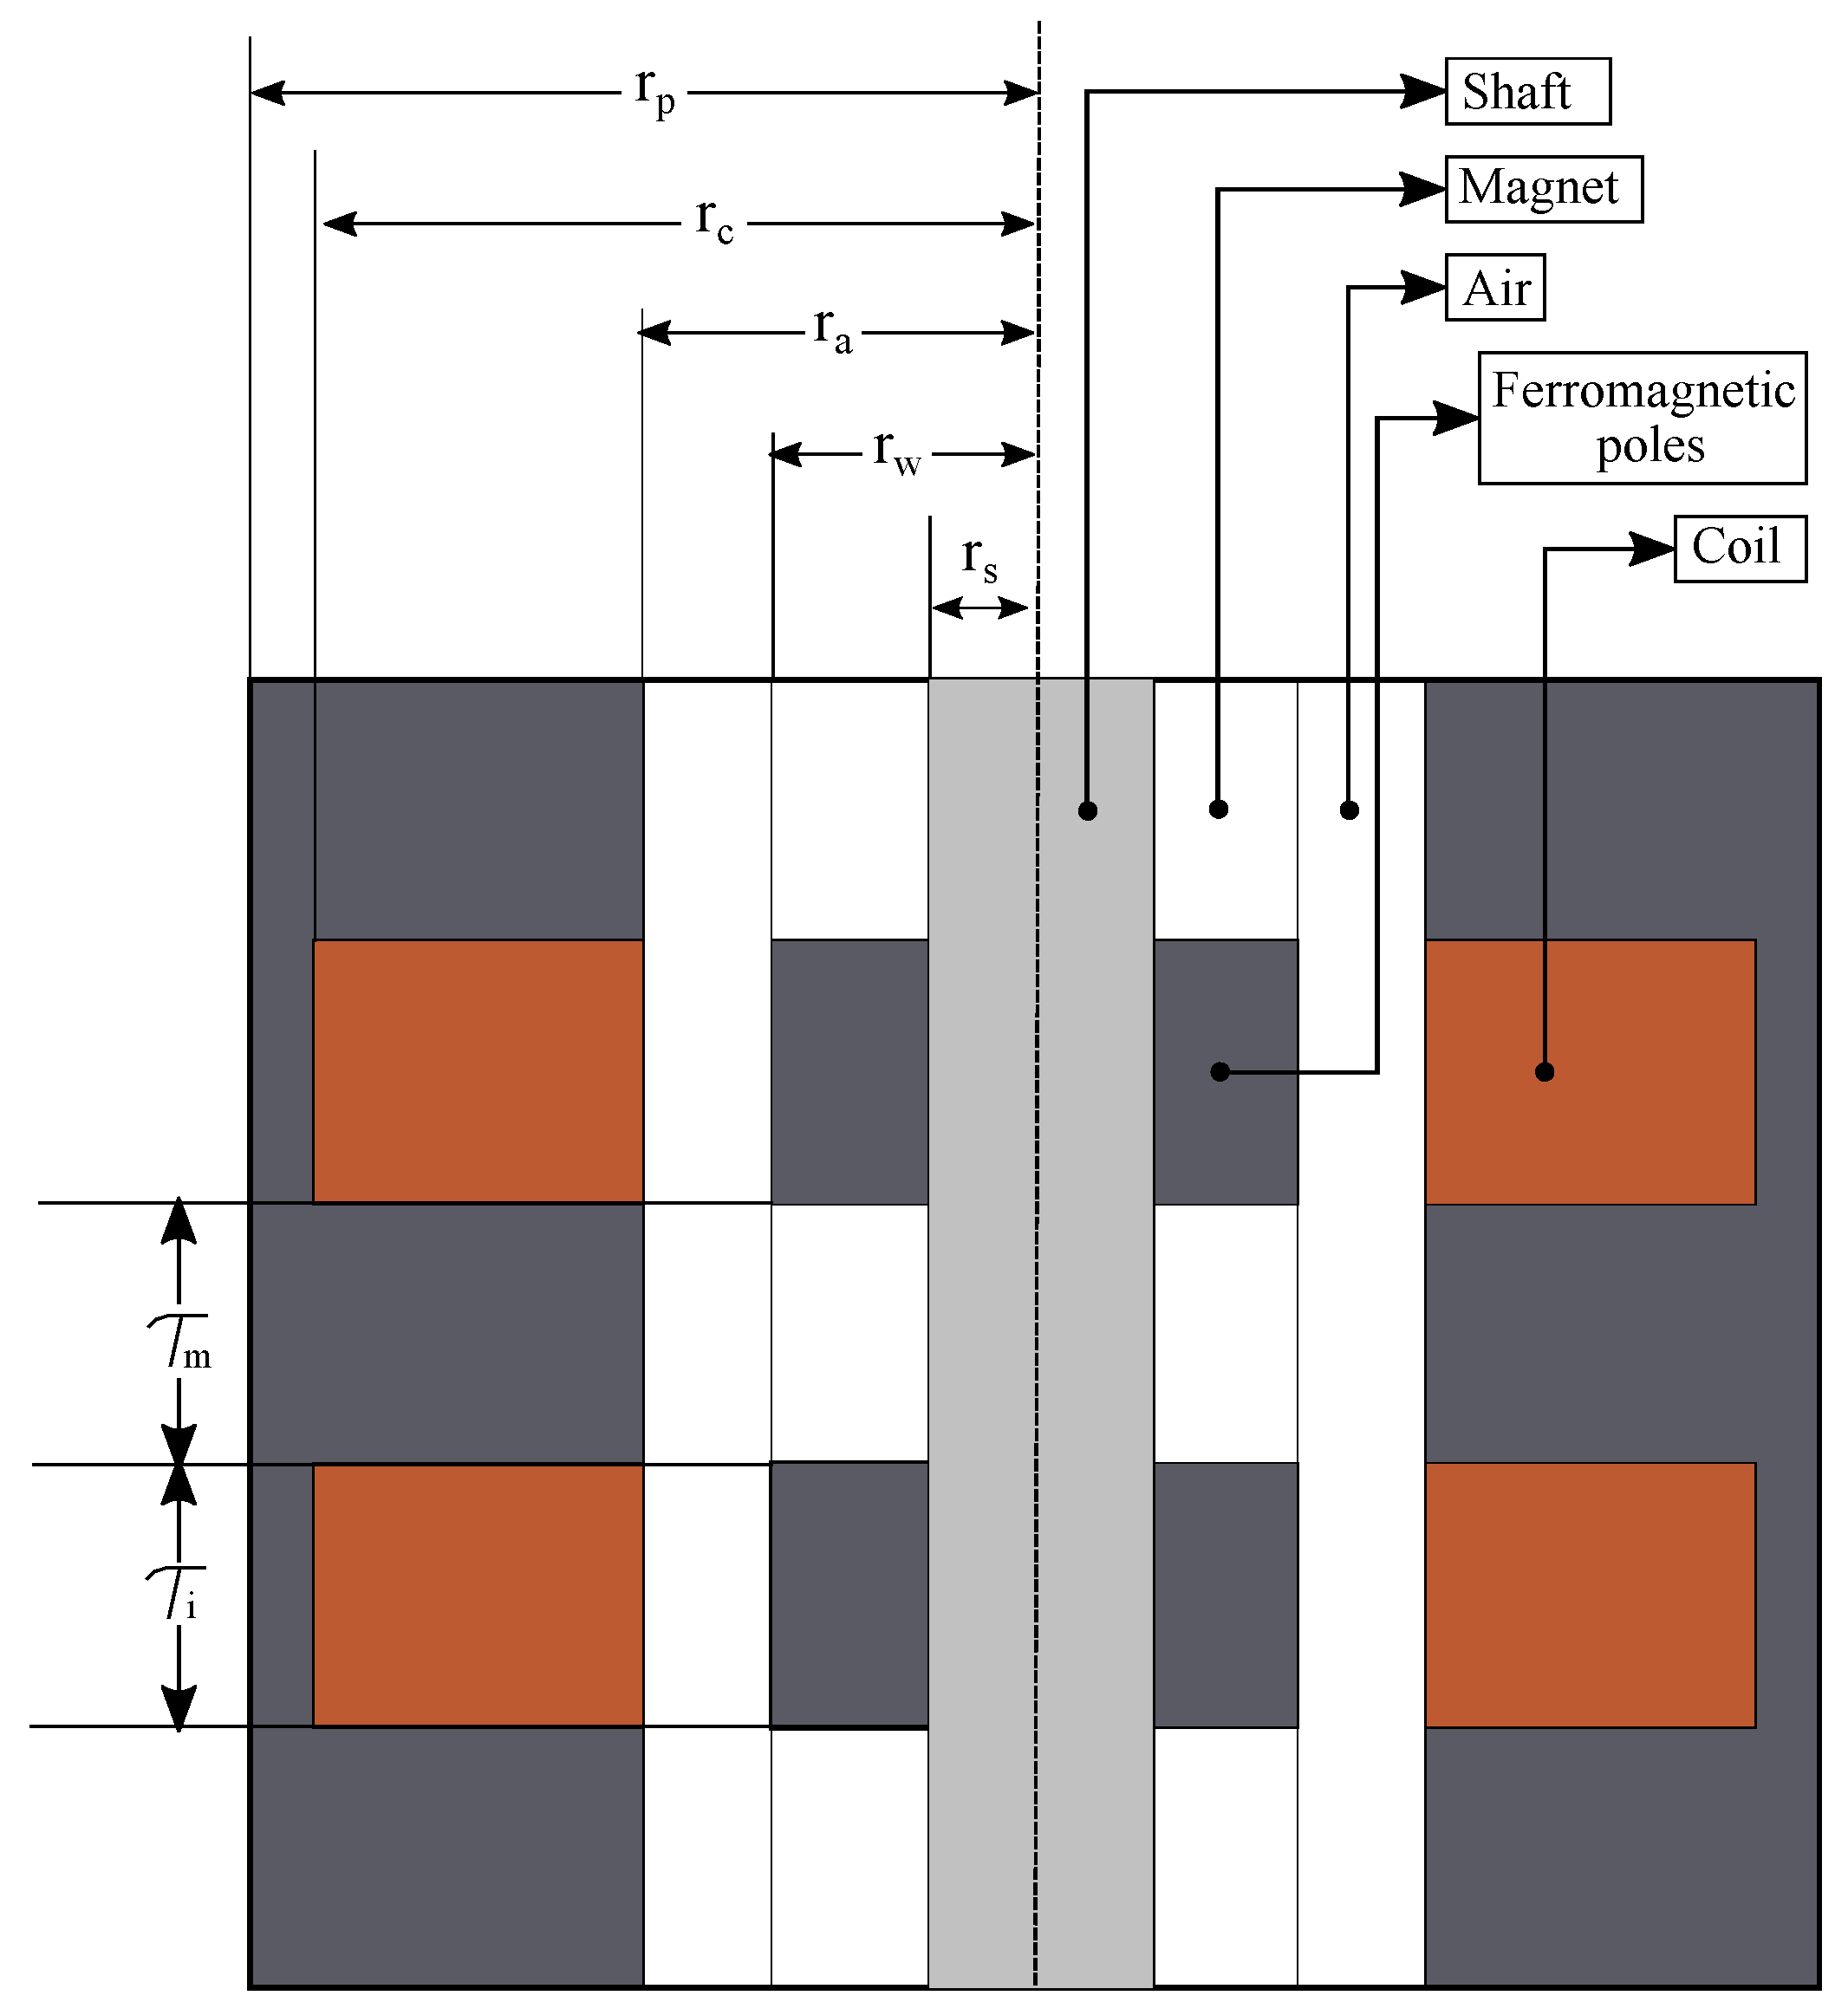
2.1. Electromechanical Modeling
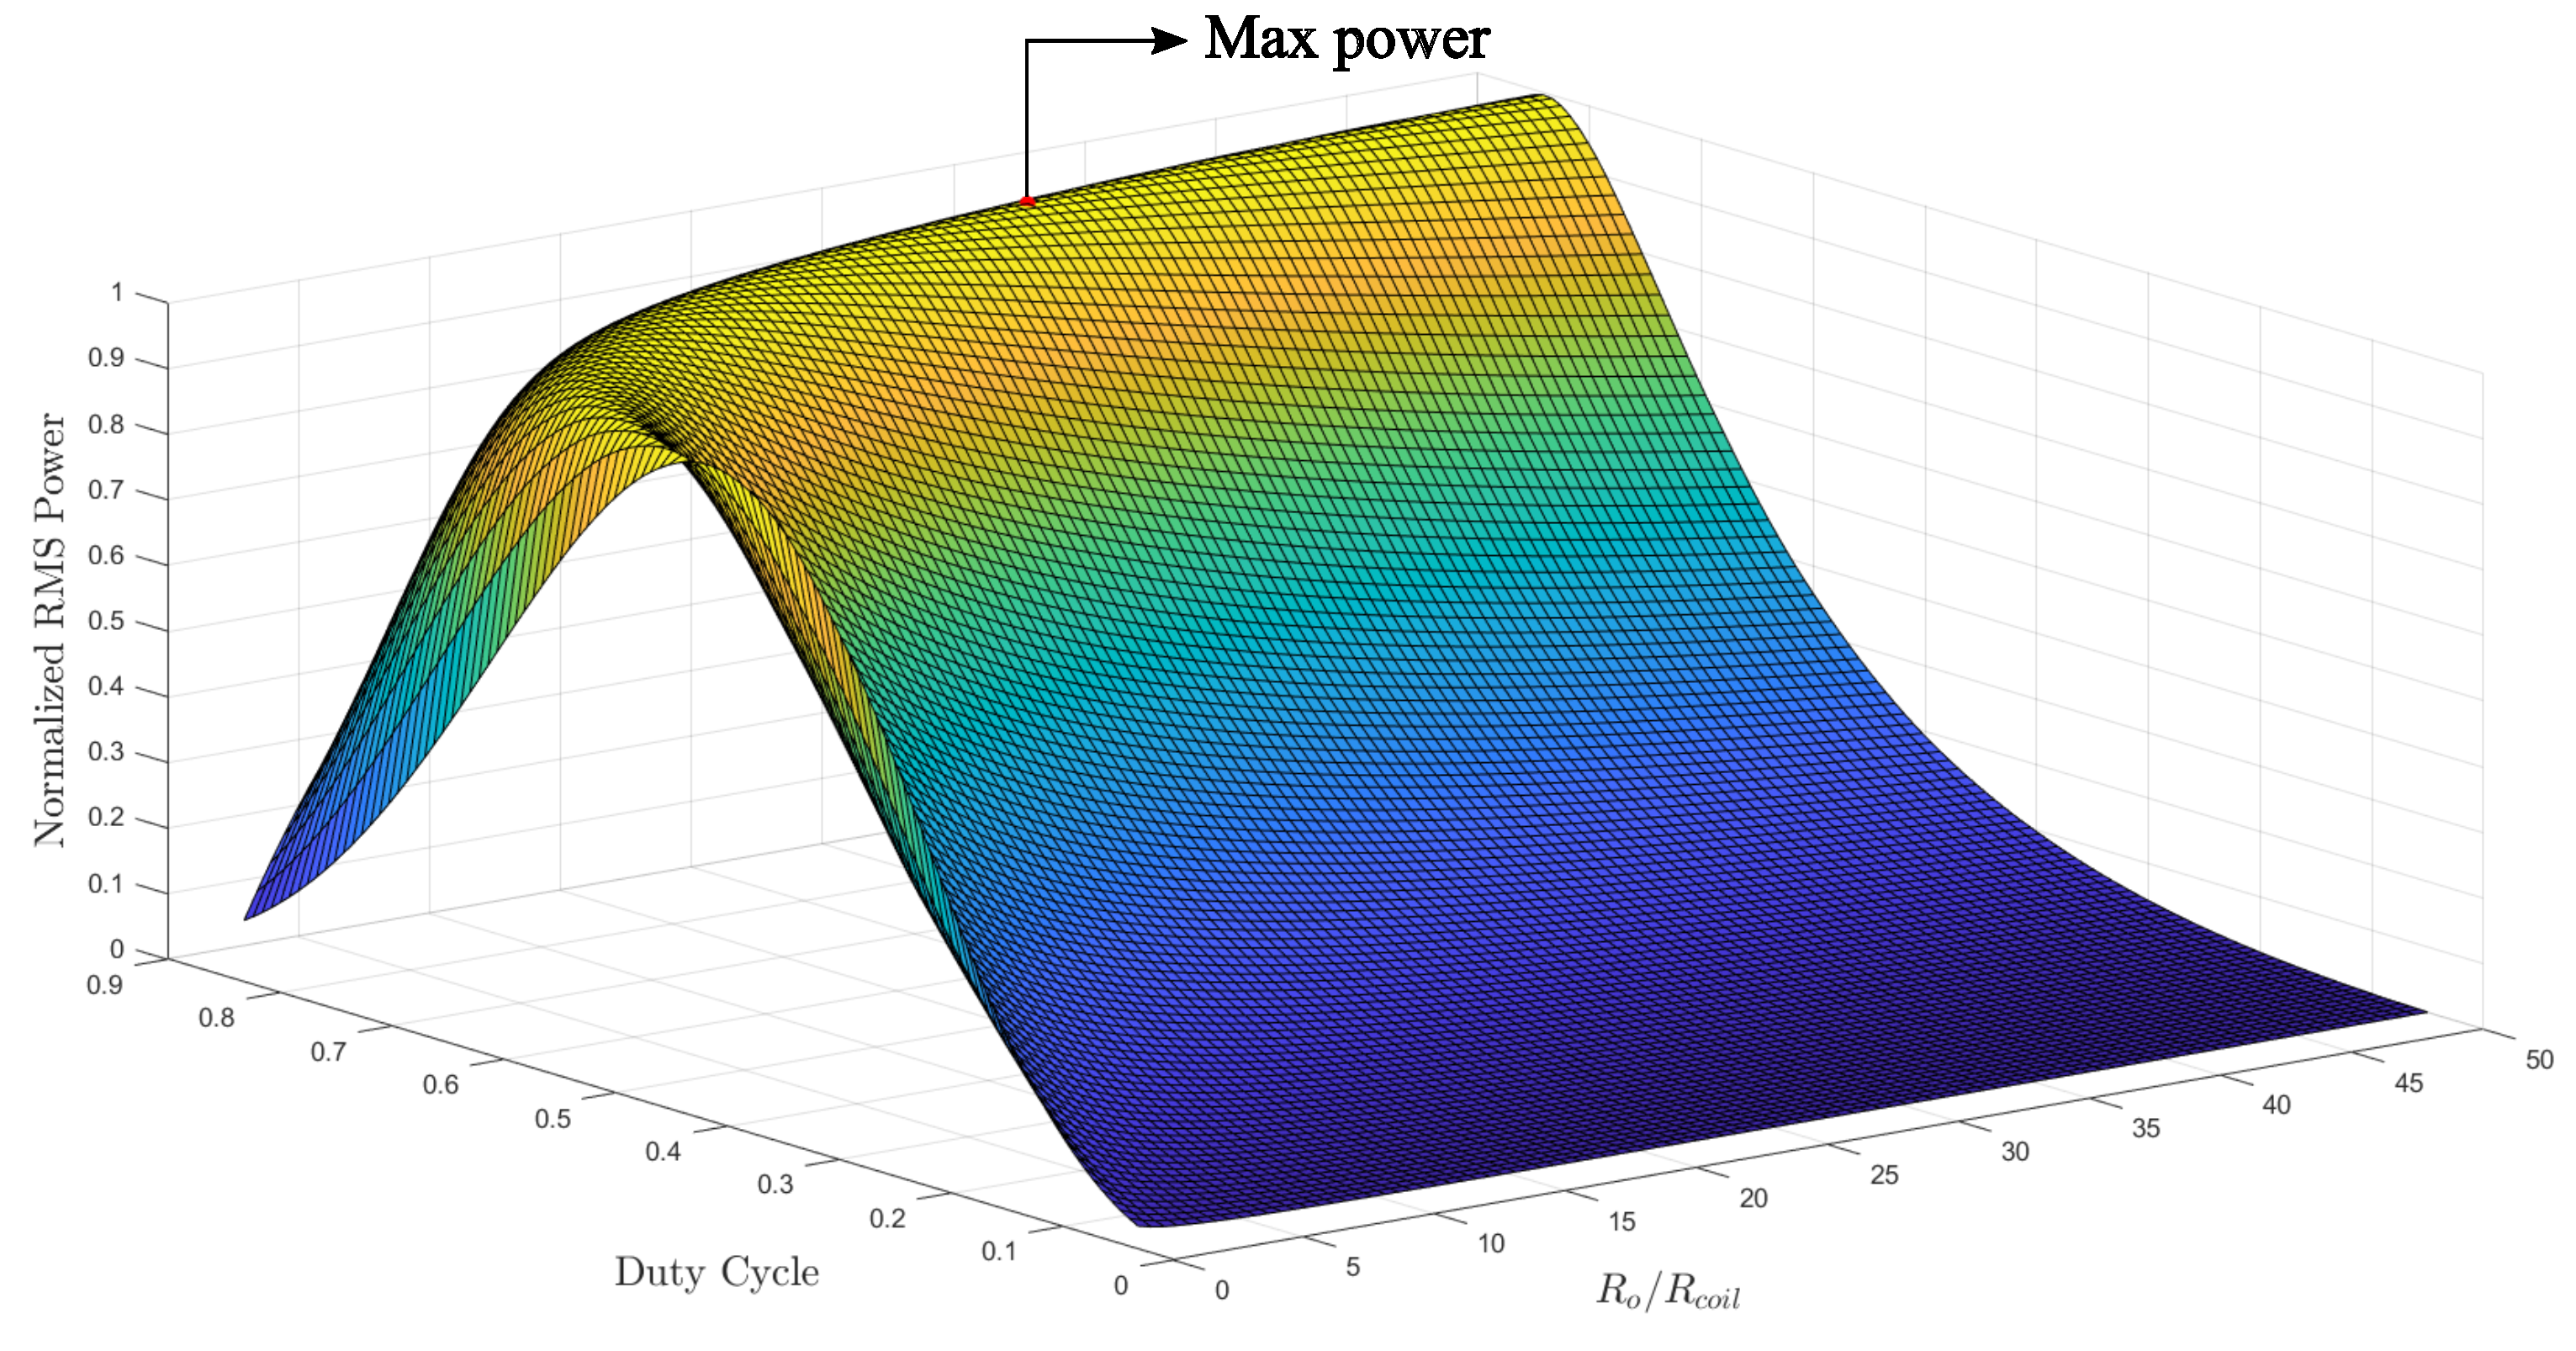
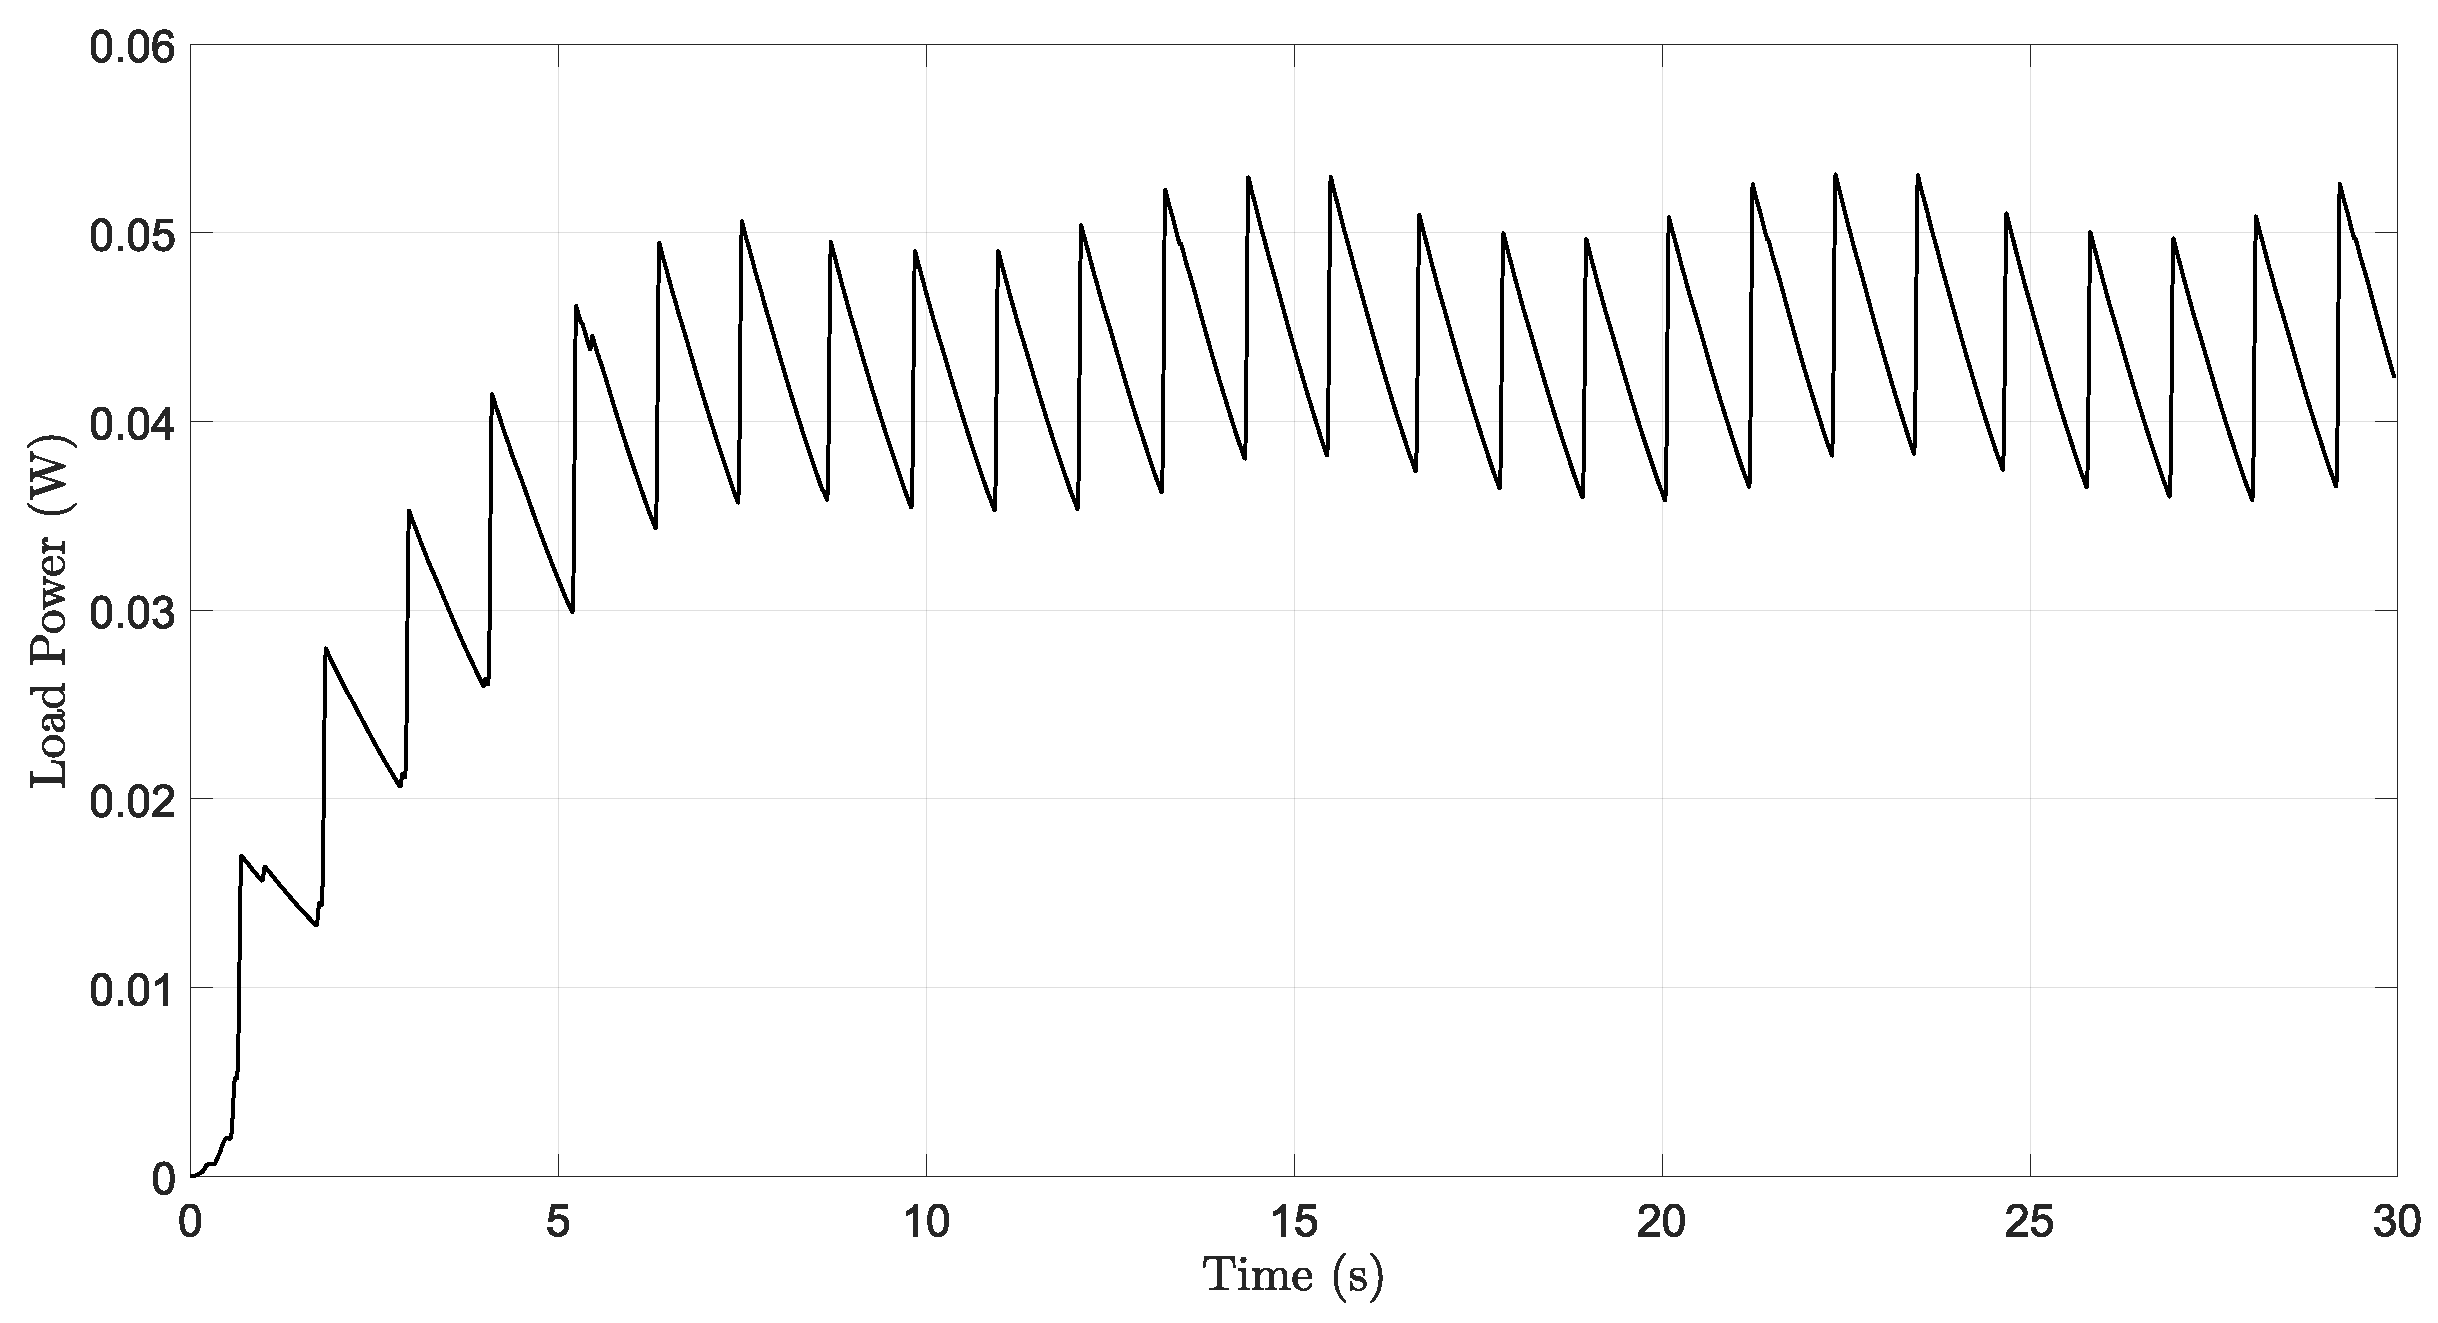
2.2. Power Conditioning Circuit Modeling
3. Data Collecting and Methods
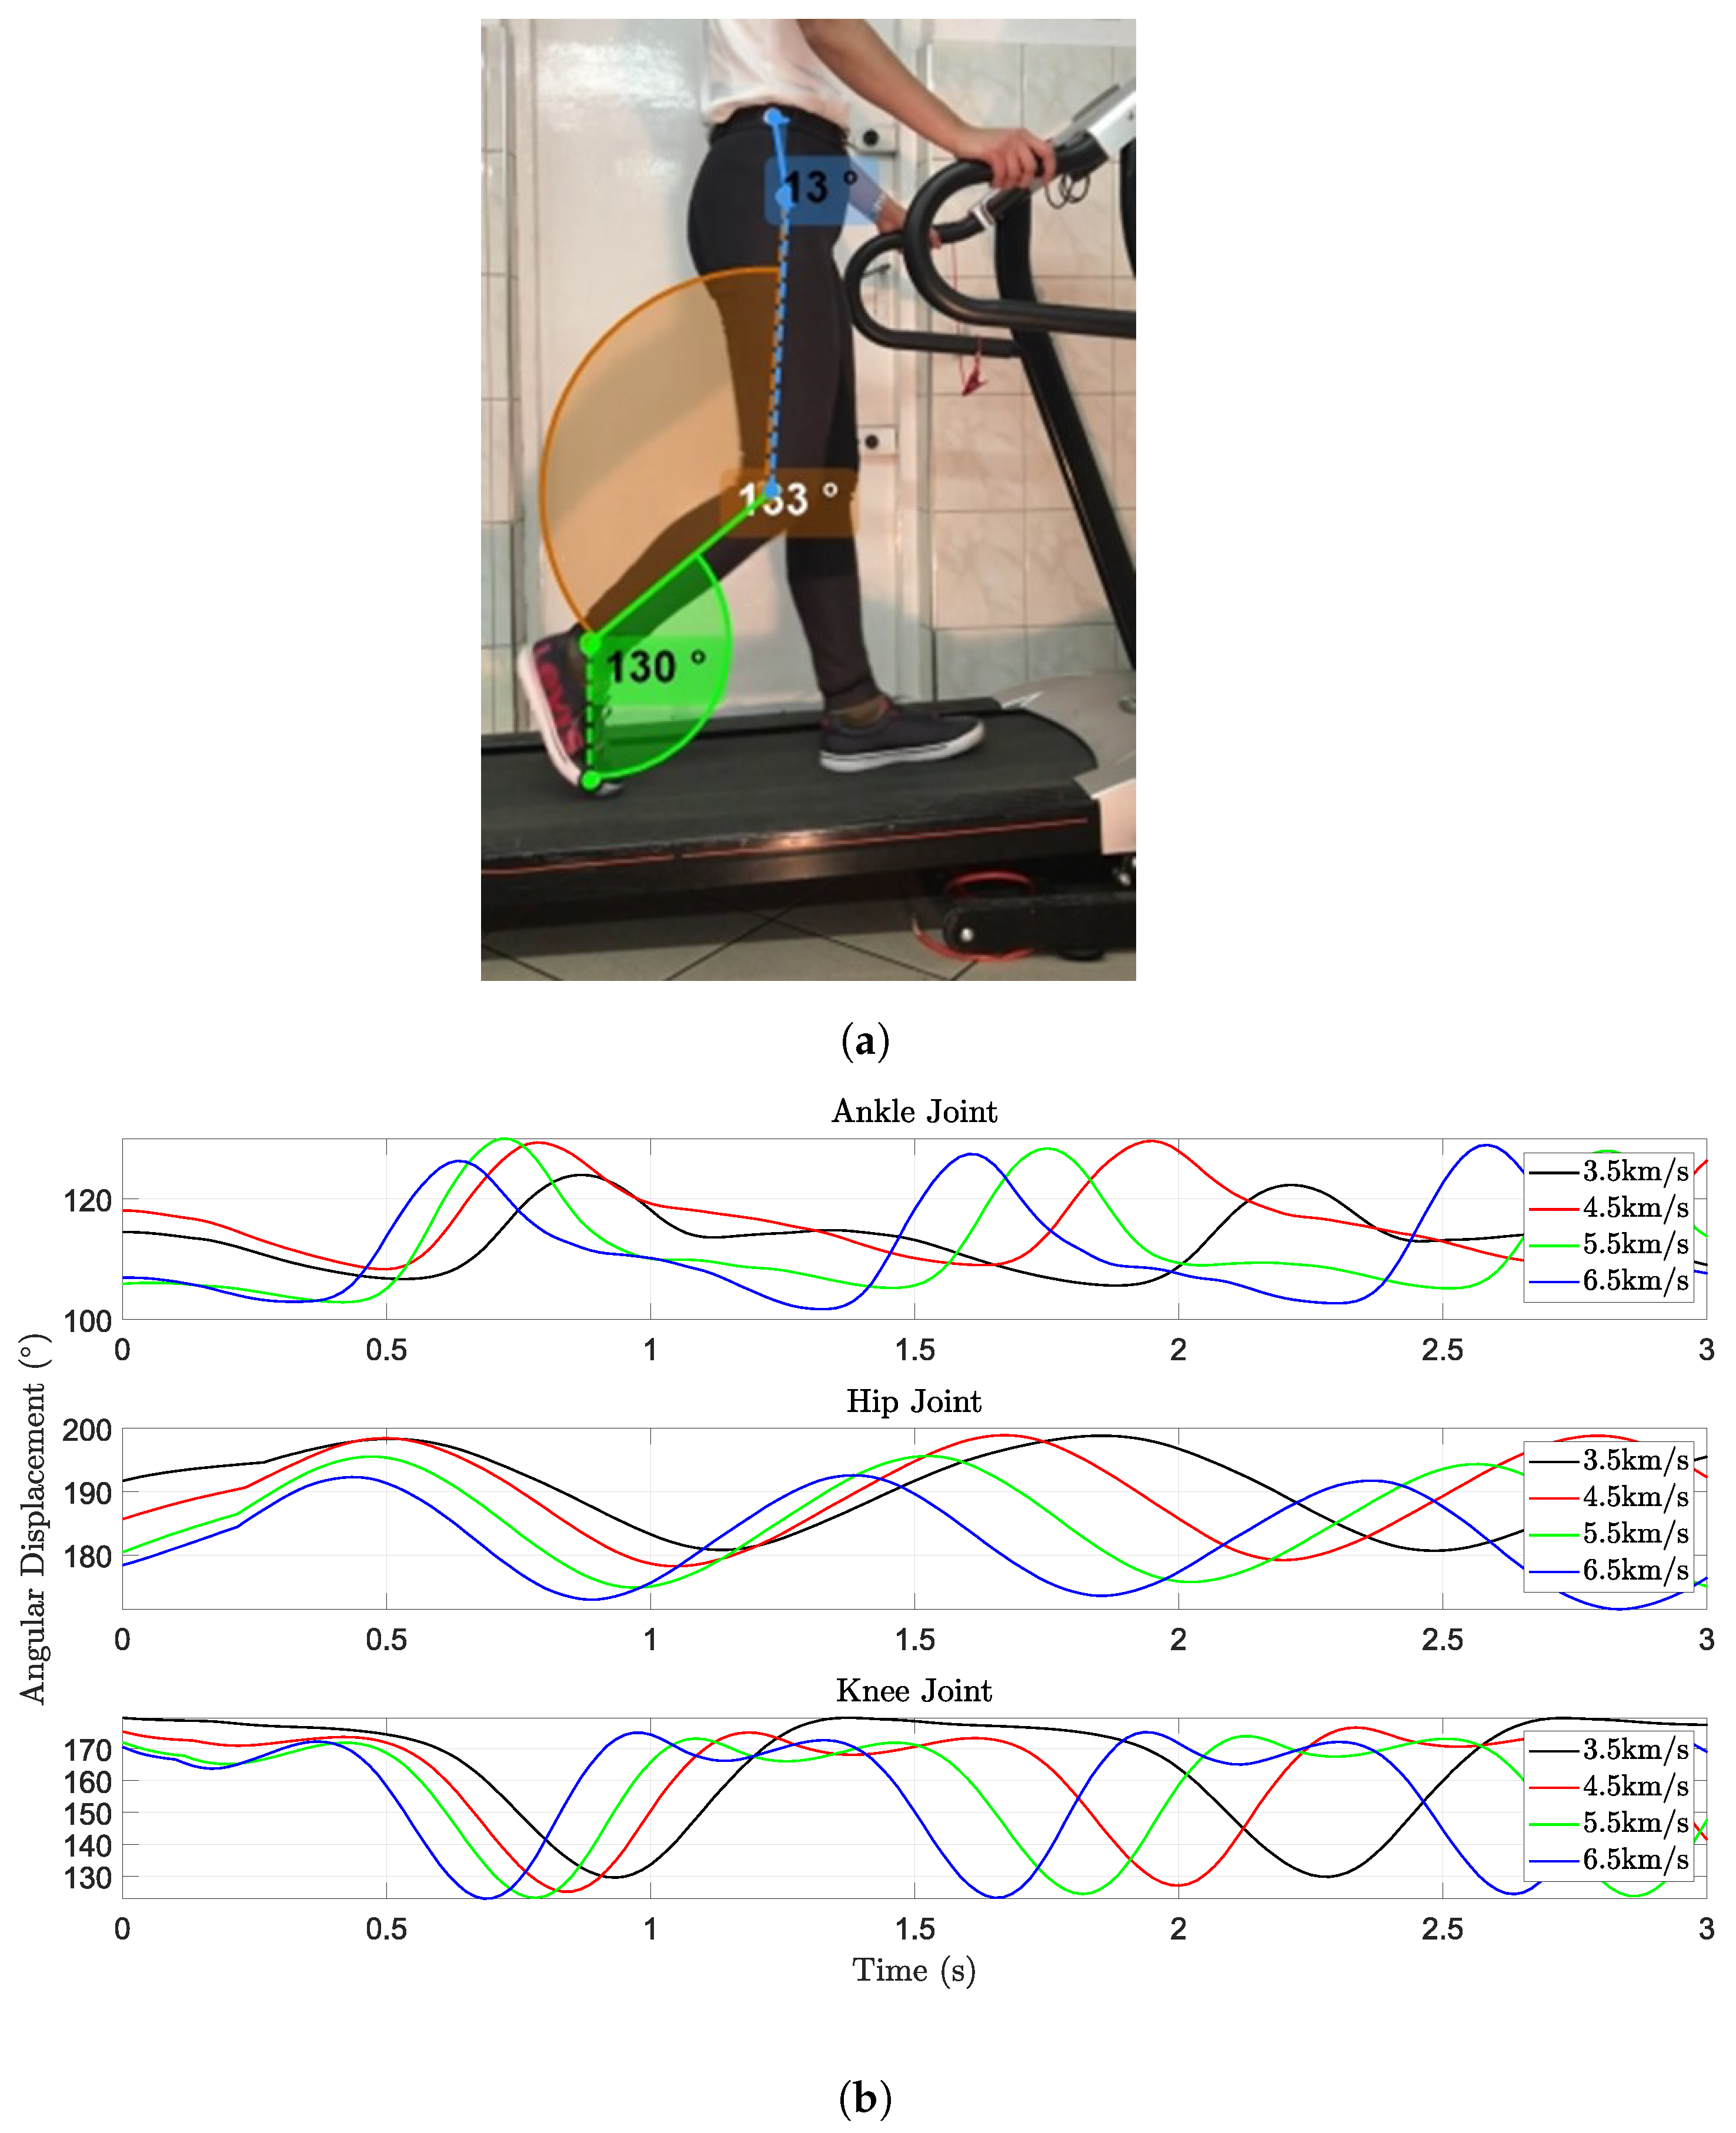
3.1. Gait Parameter Measurement
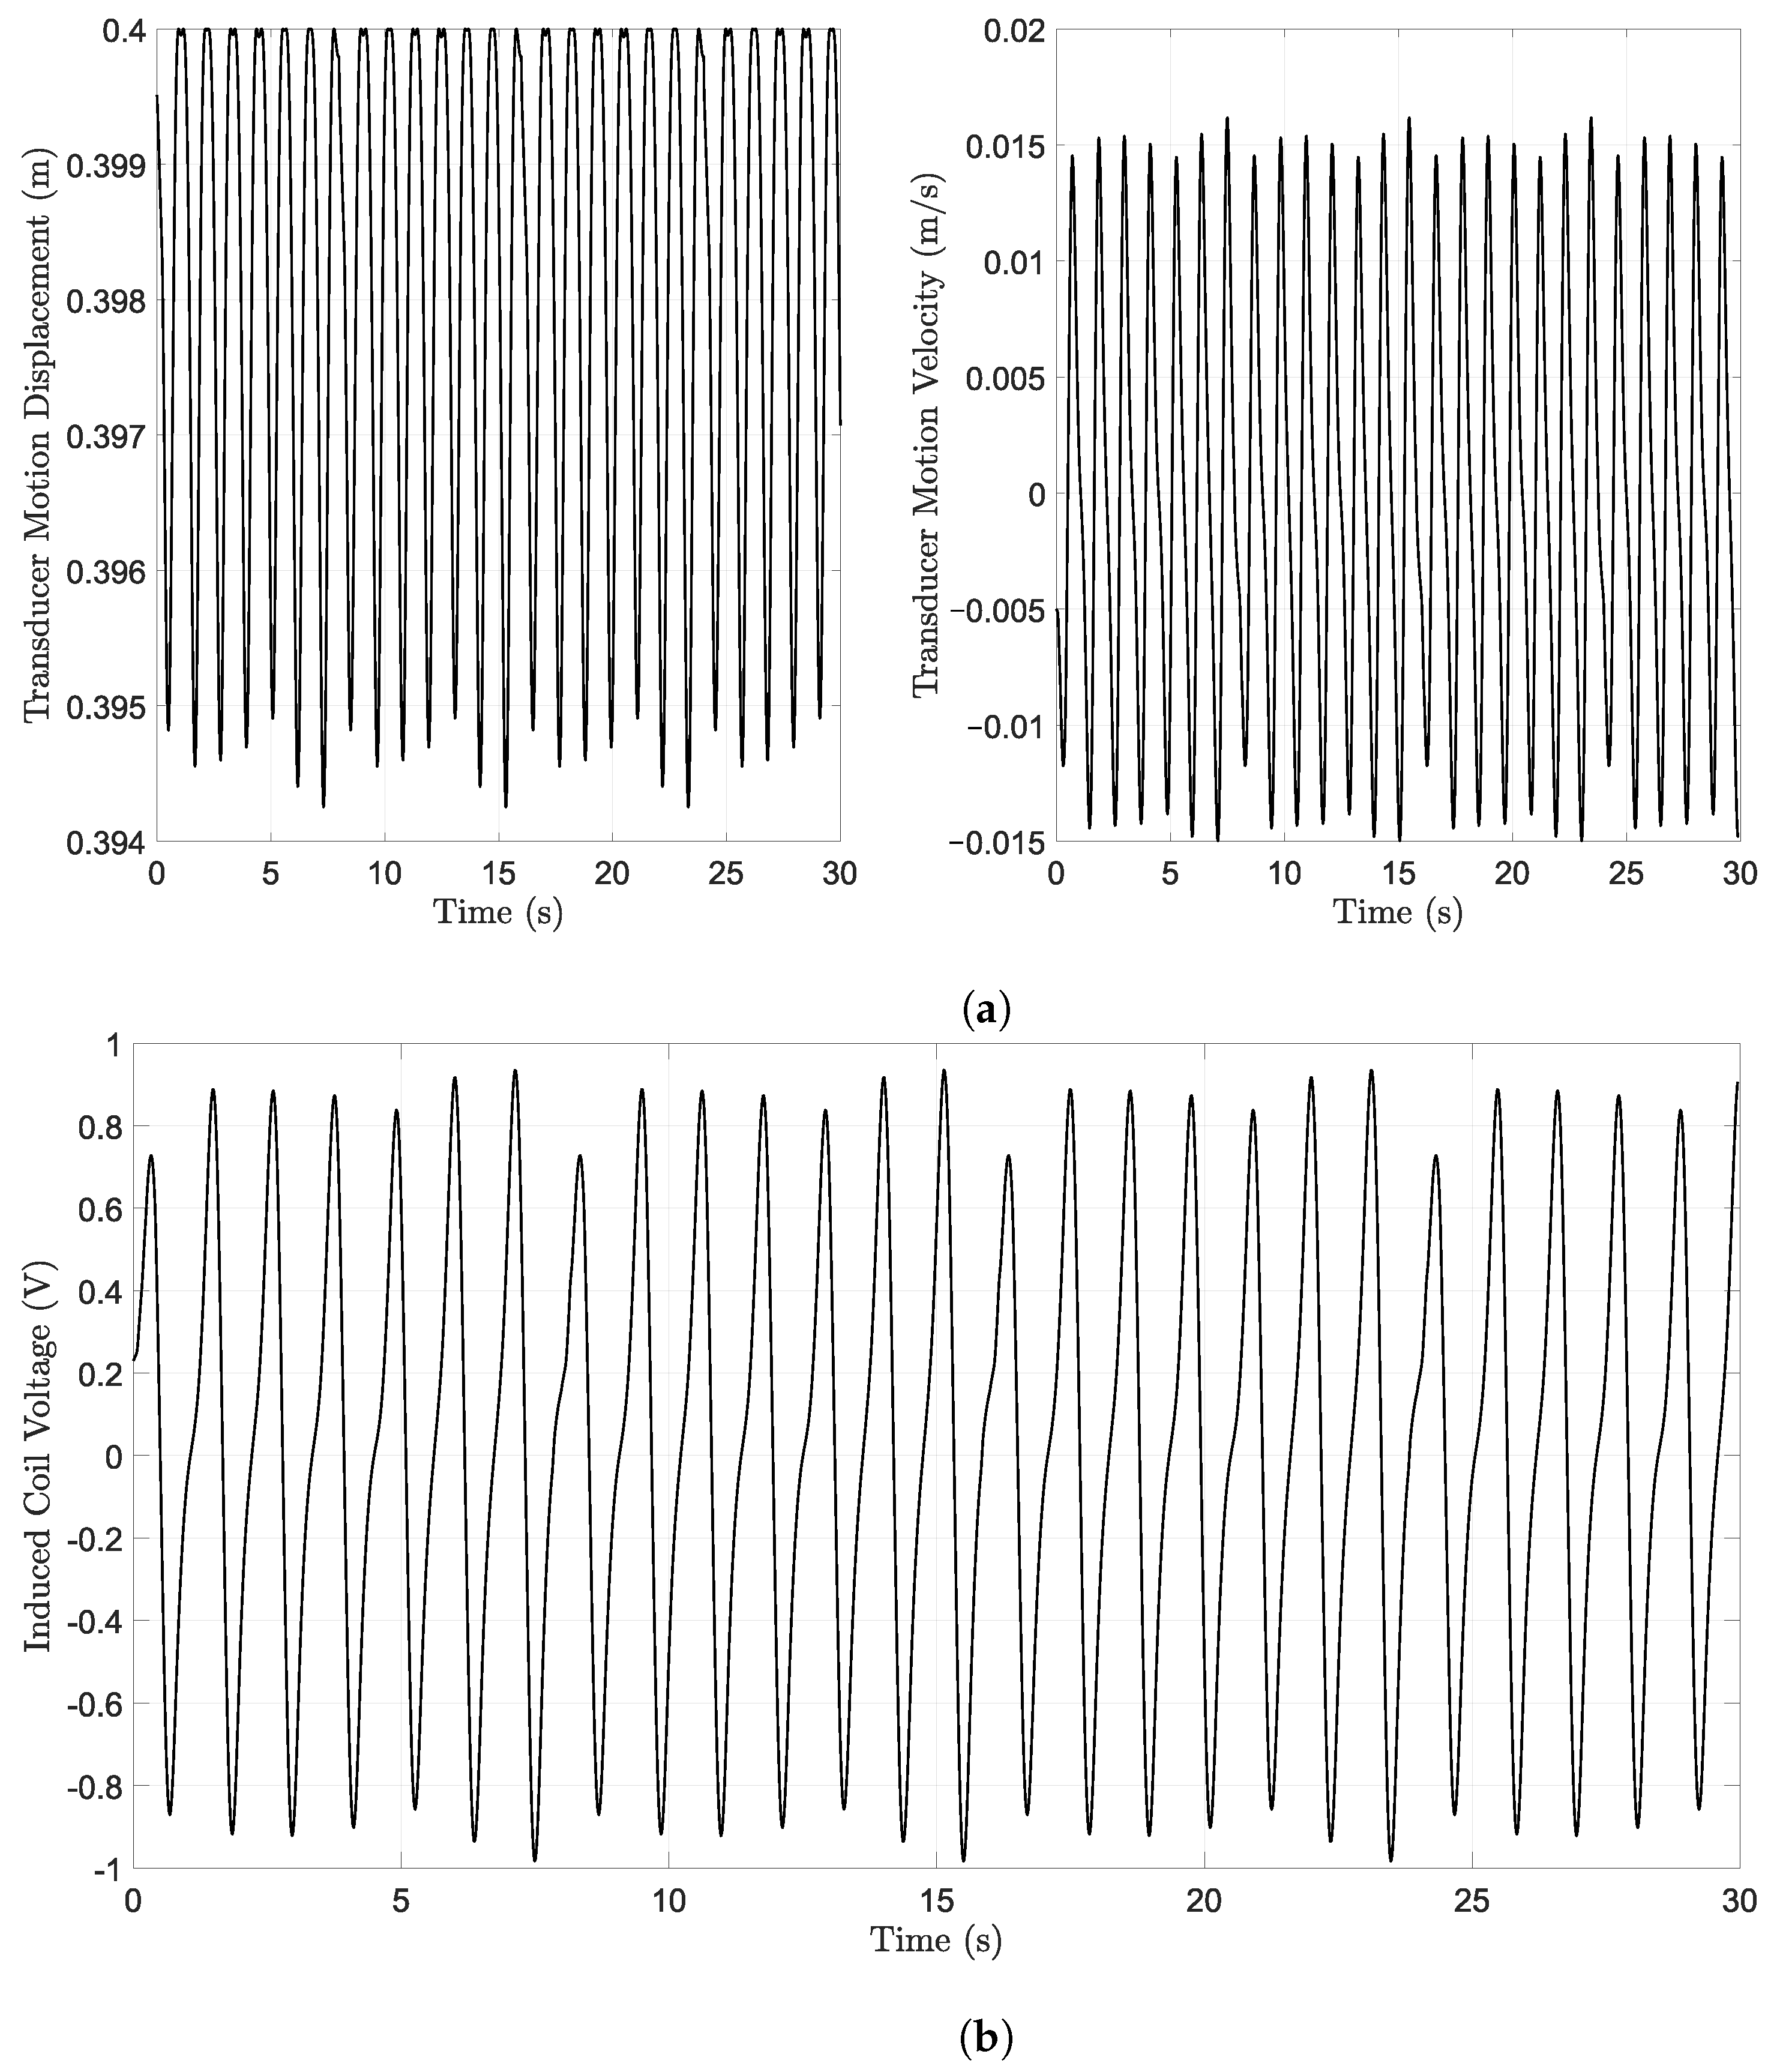
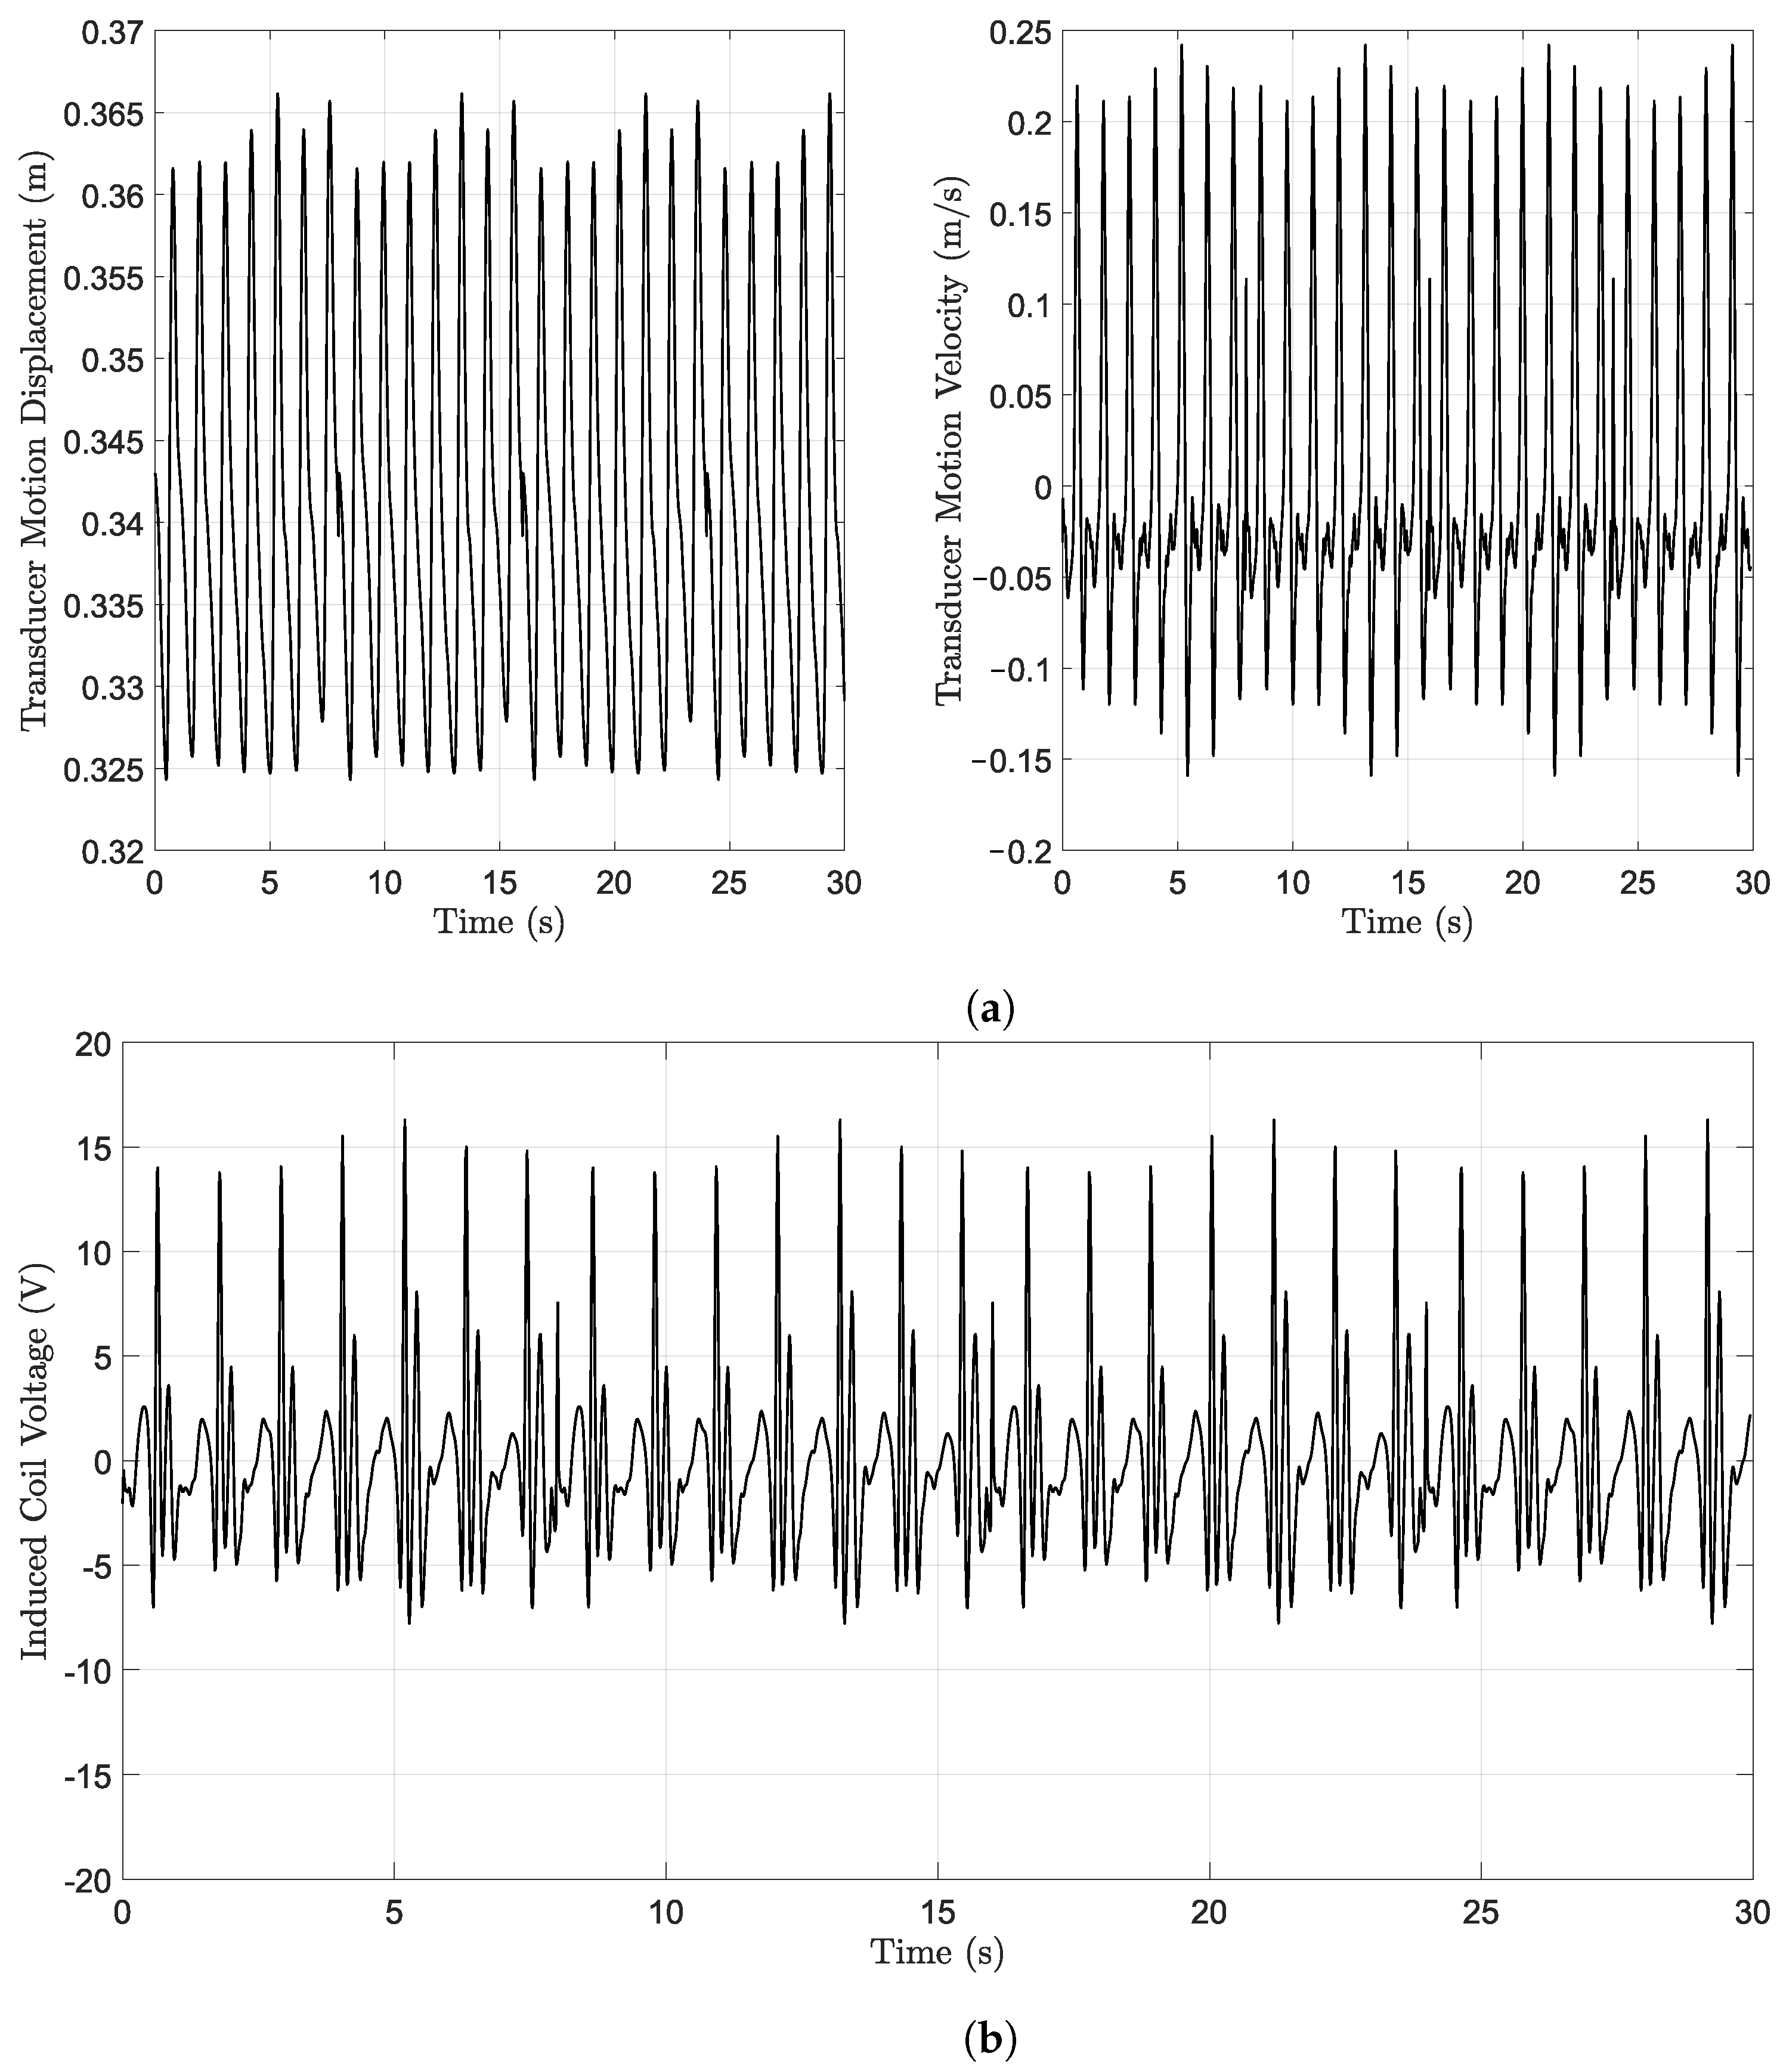
3.2. Kinematic of the Energy Harvester
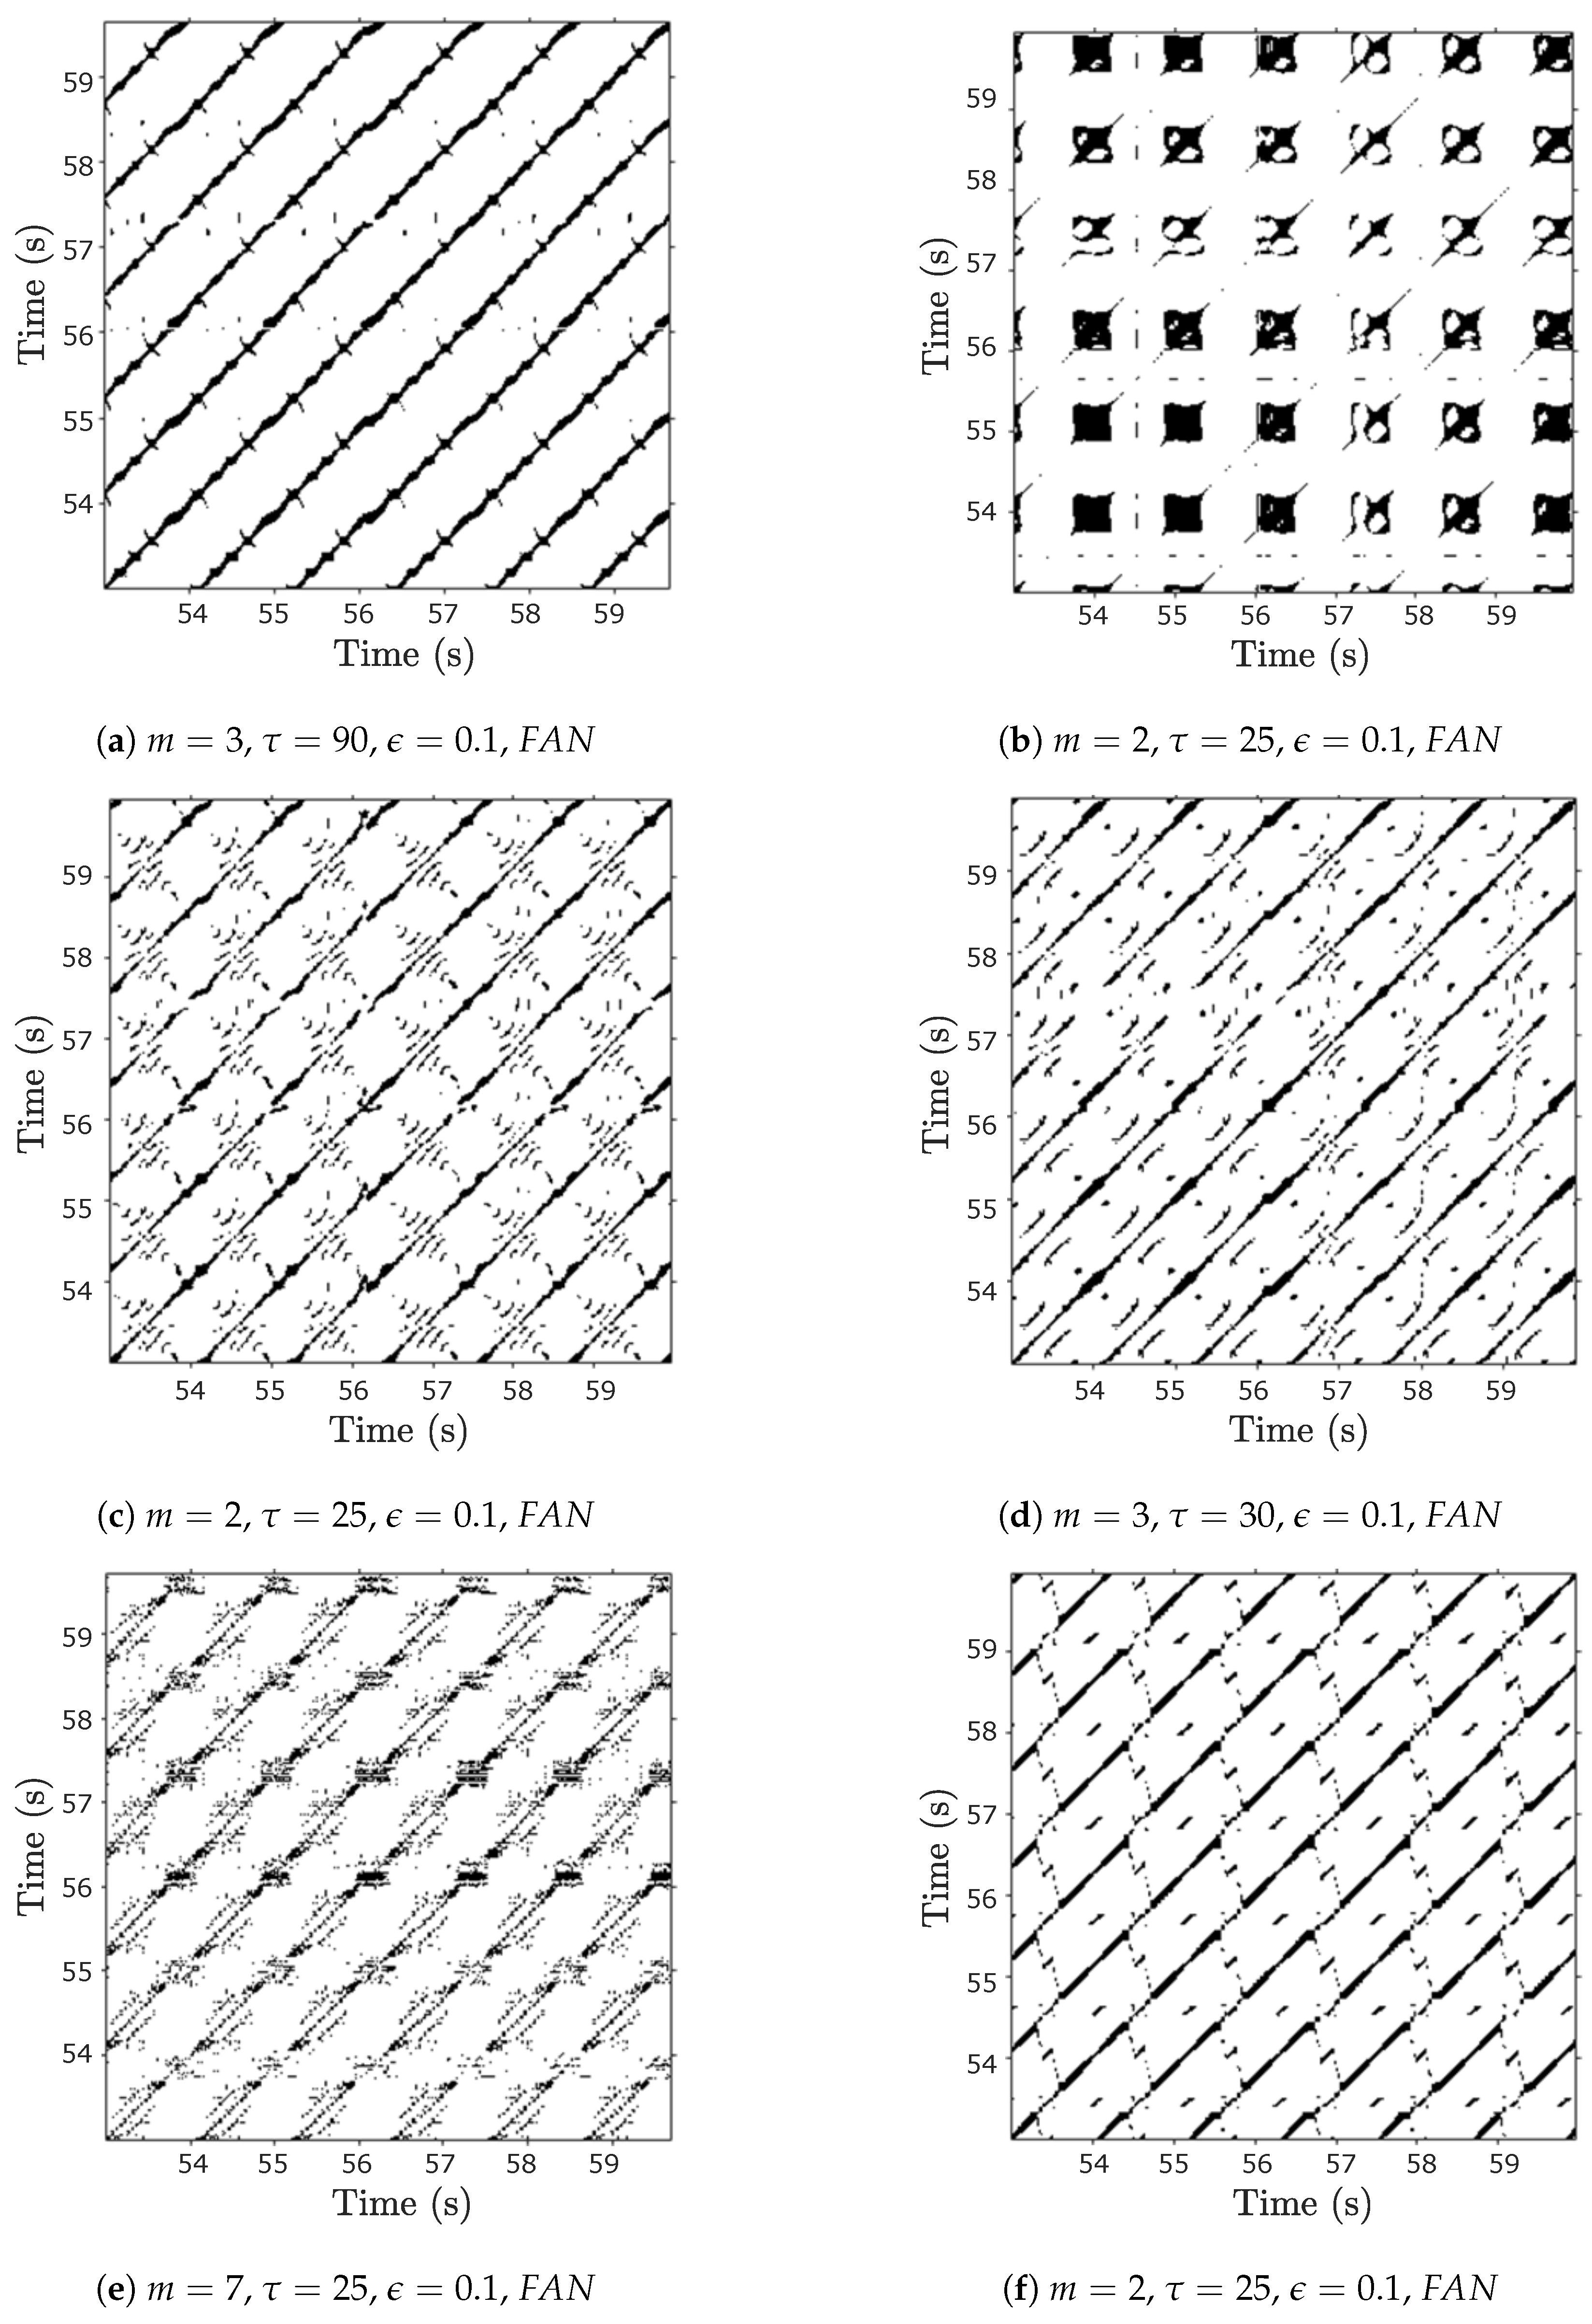
3.3. Recurrence Plot (RP) and Recurrence Quantification Analysis (RQA)
3.4. Simulation Setup
4. Results and Discussion
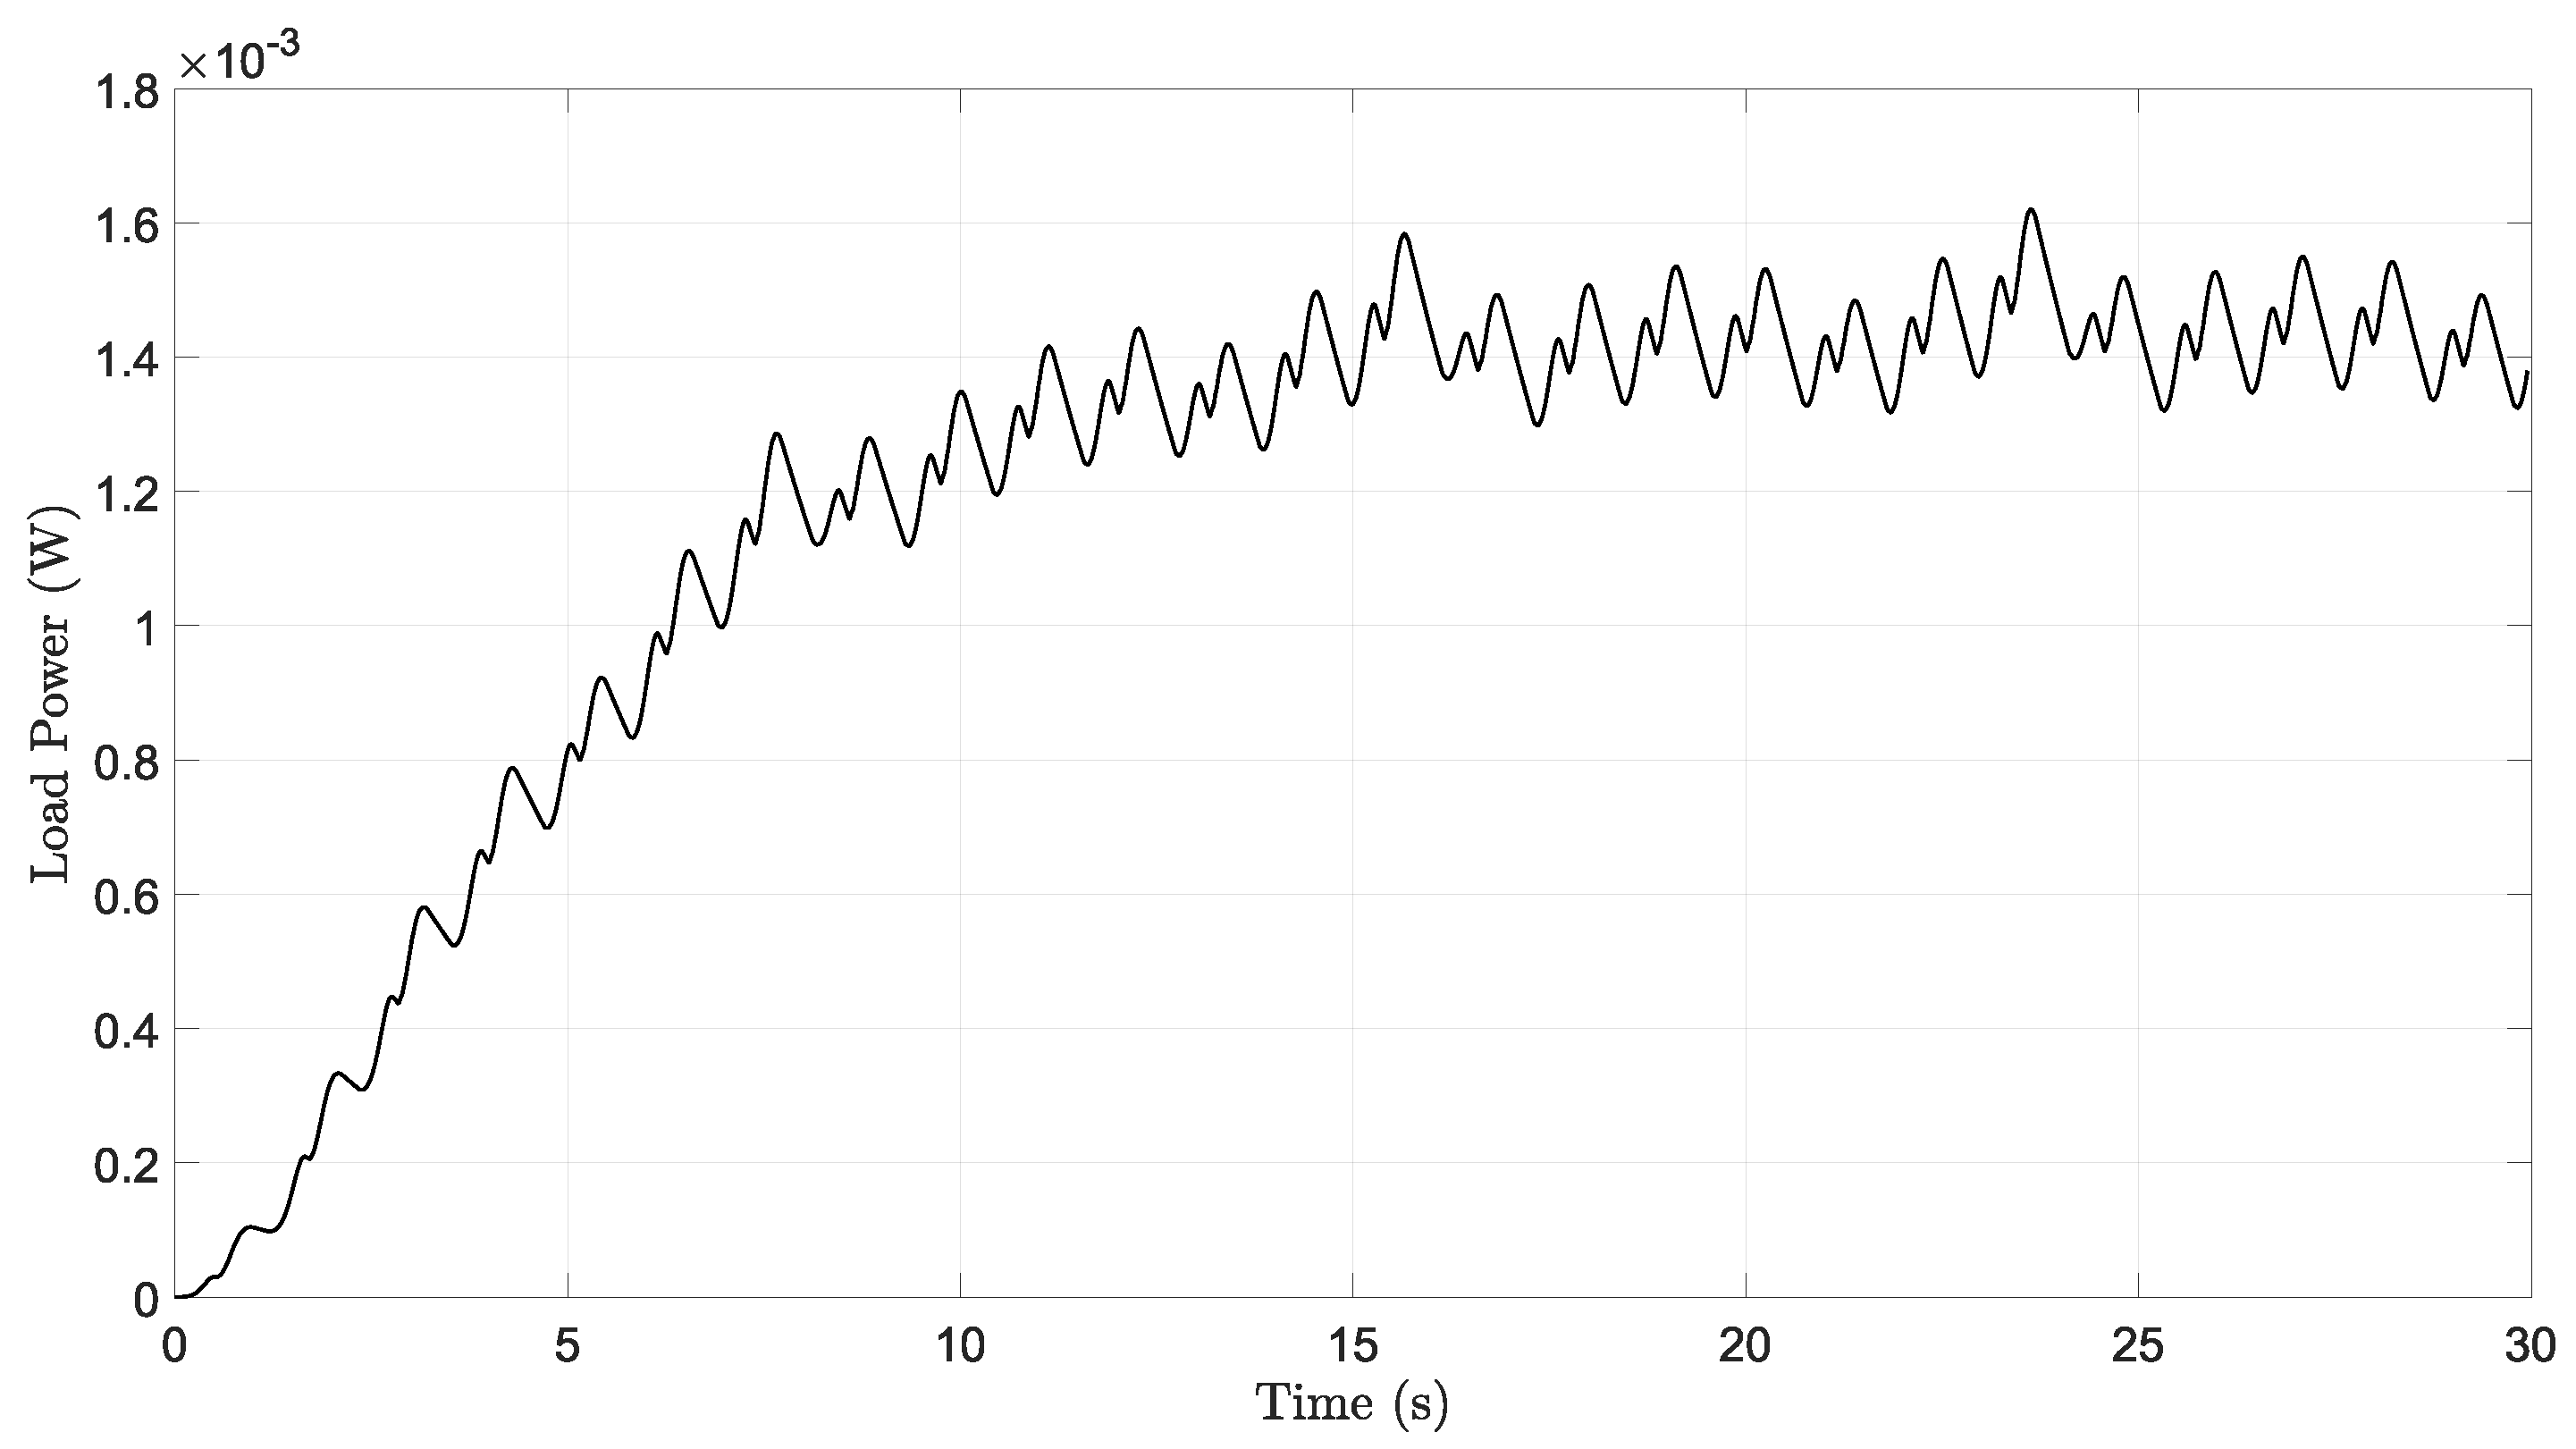
4.1. Hip Joint
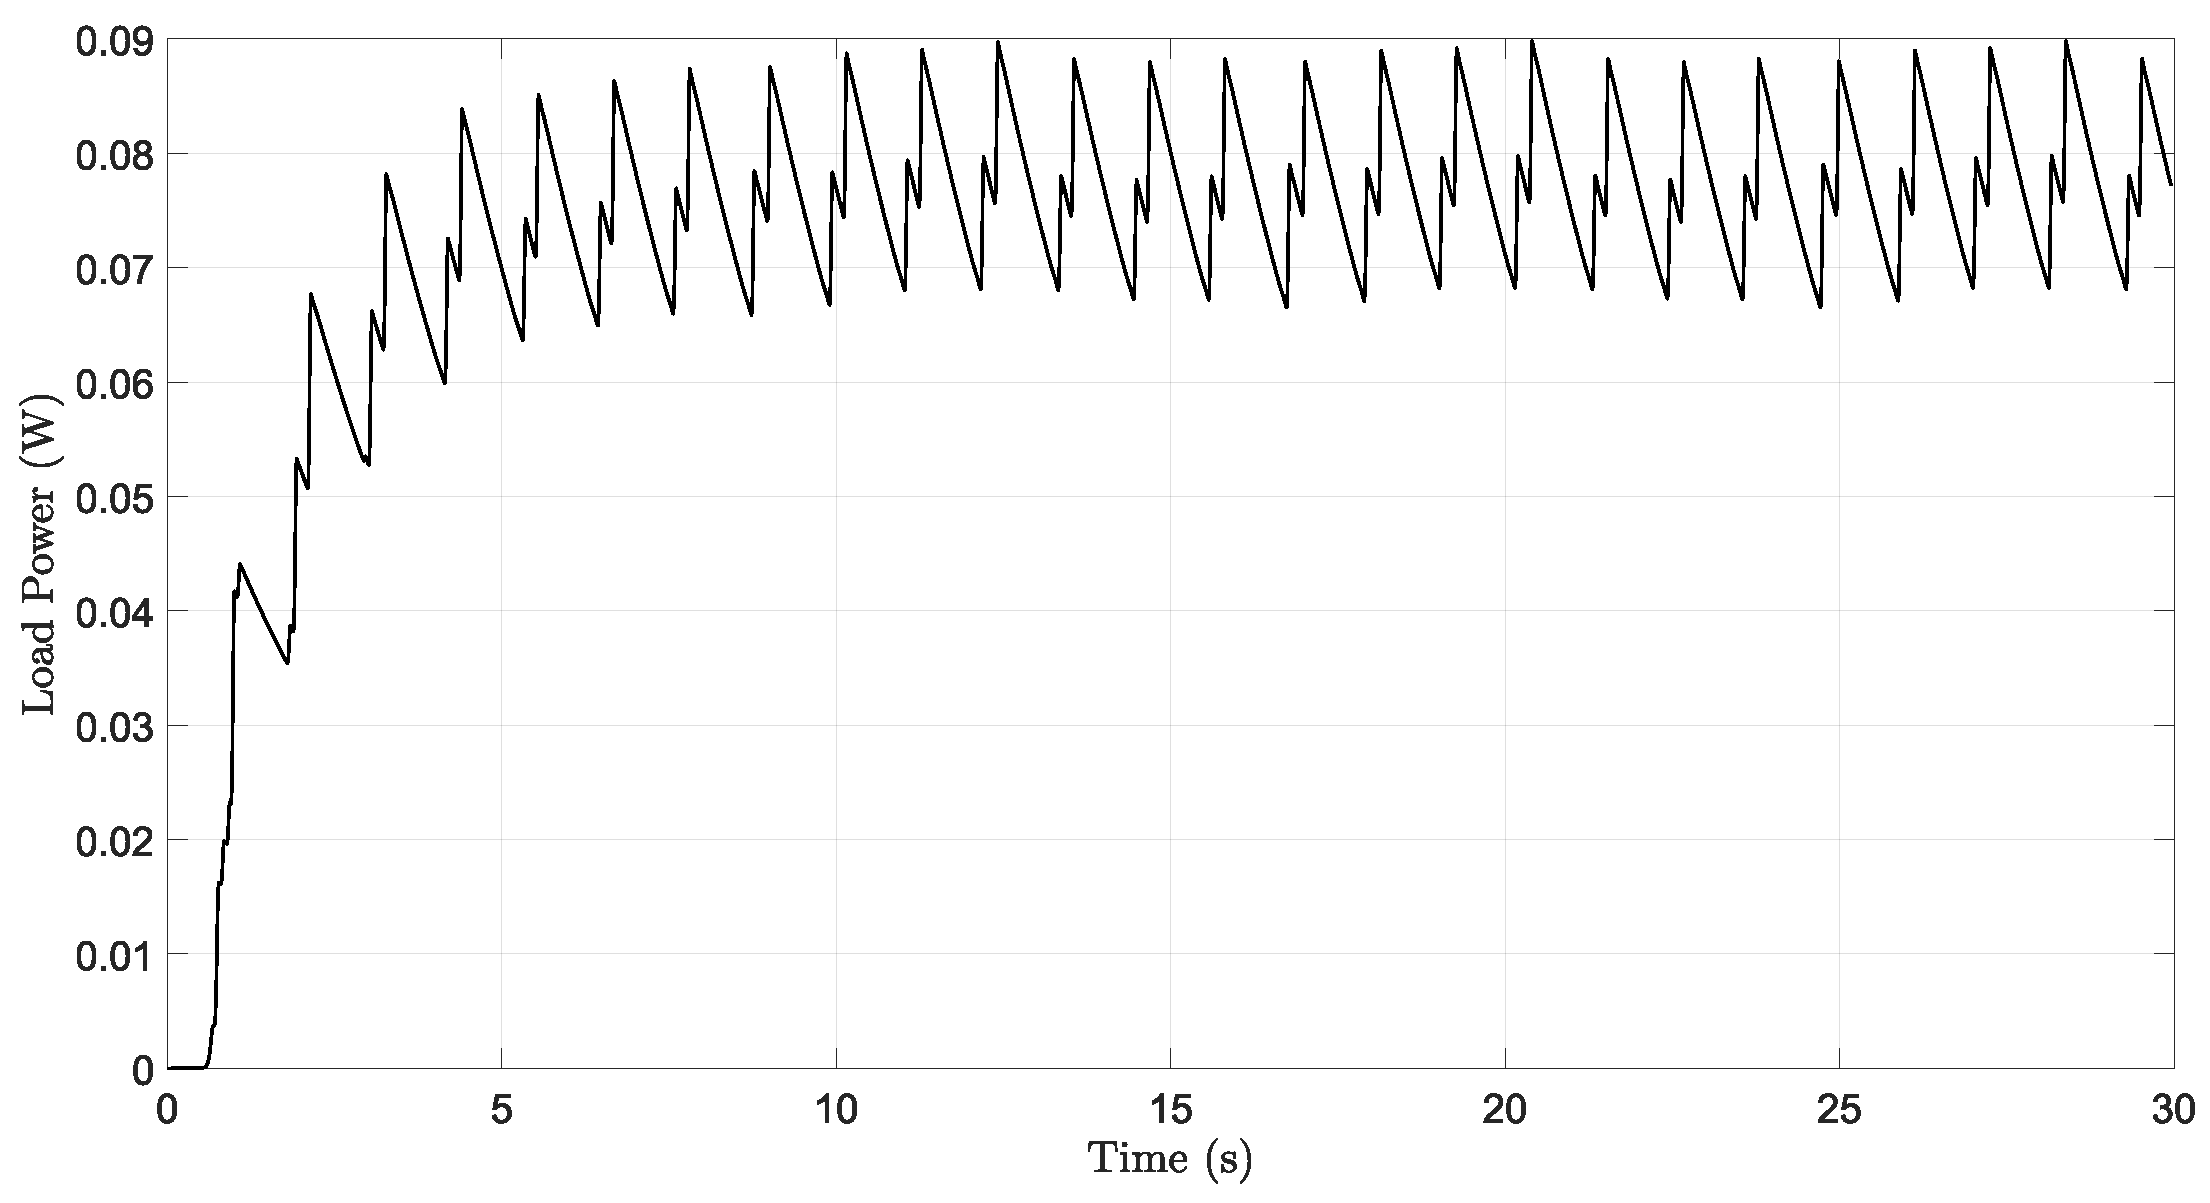
4.2. Knee Joint
4.3. Ankle Joint
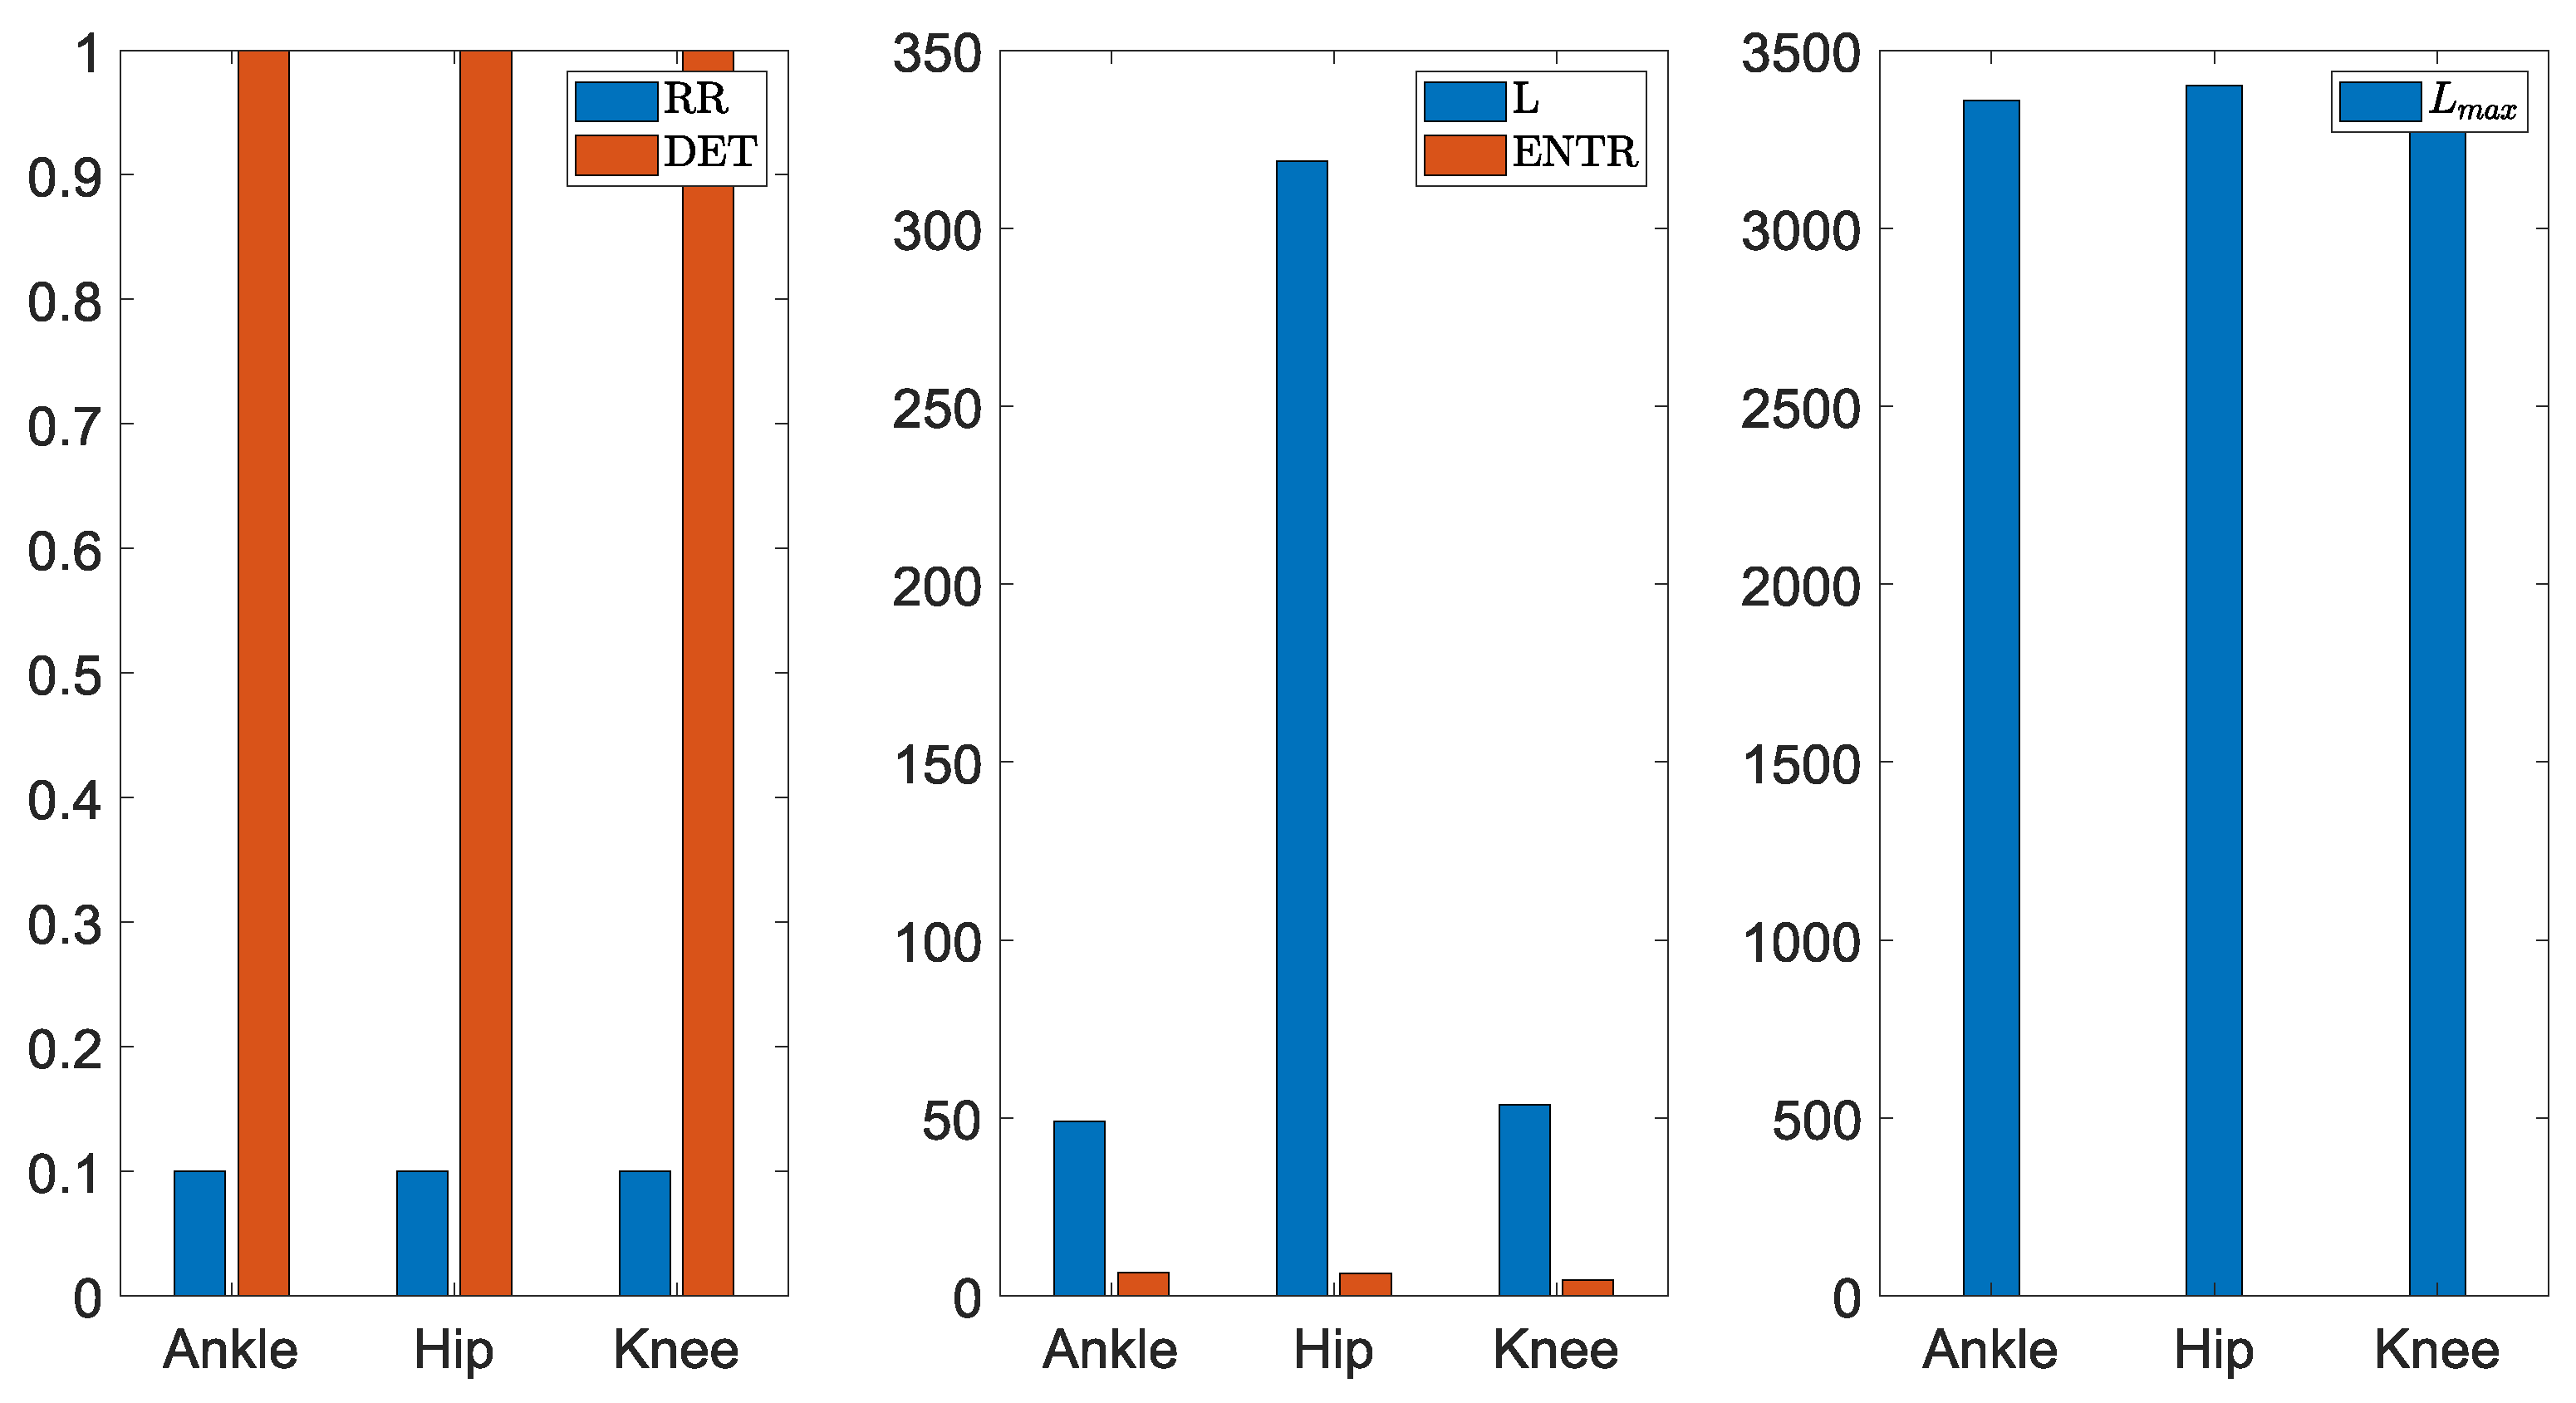
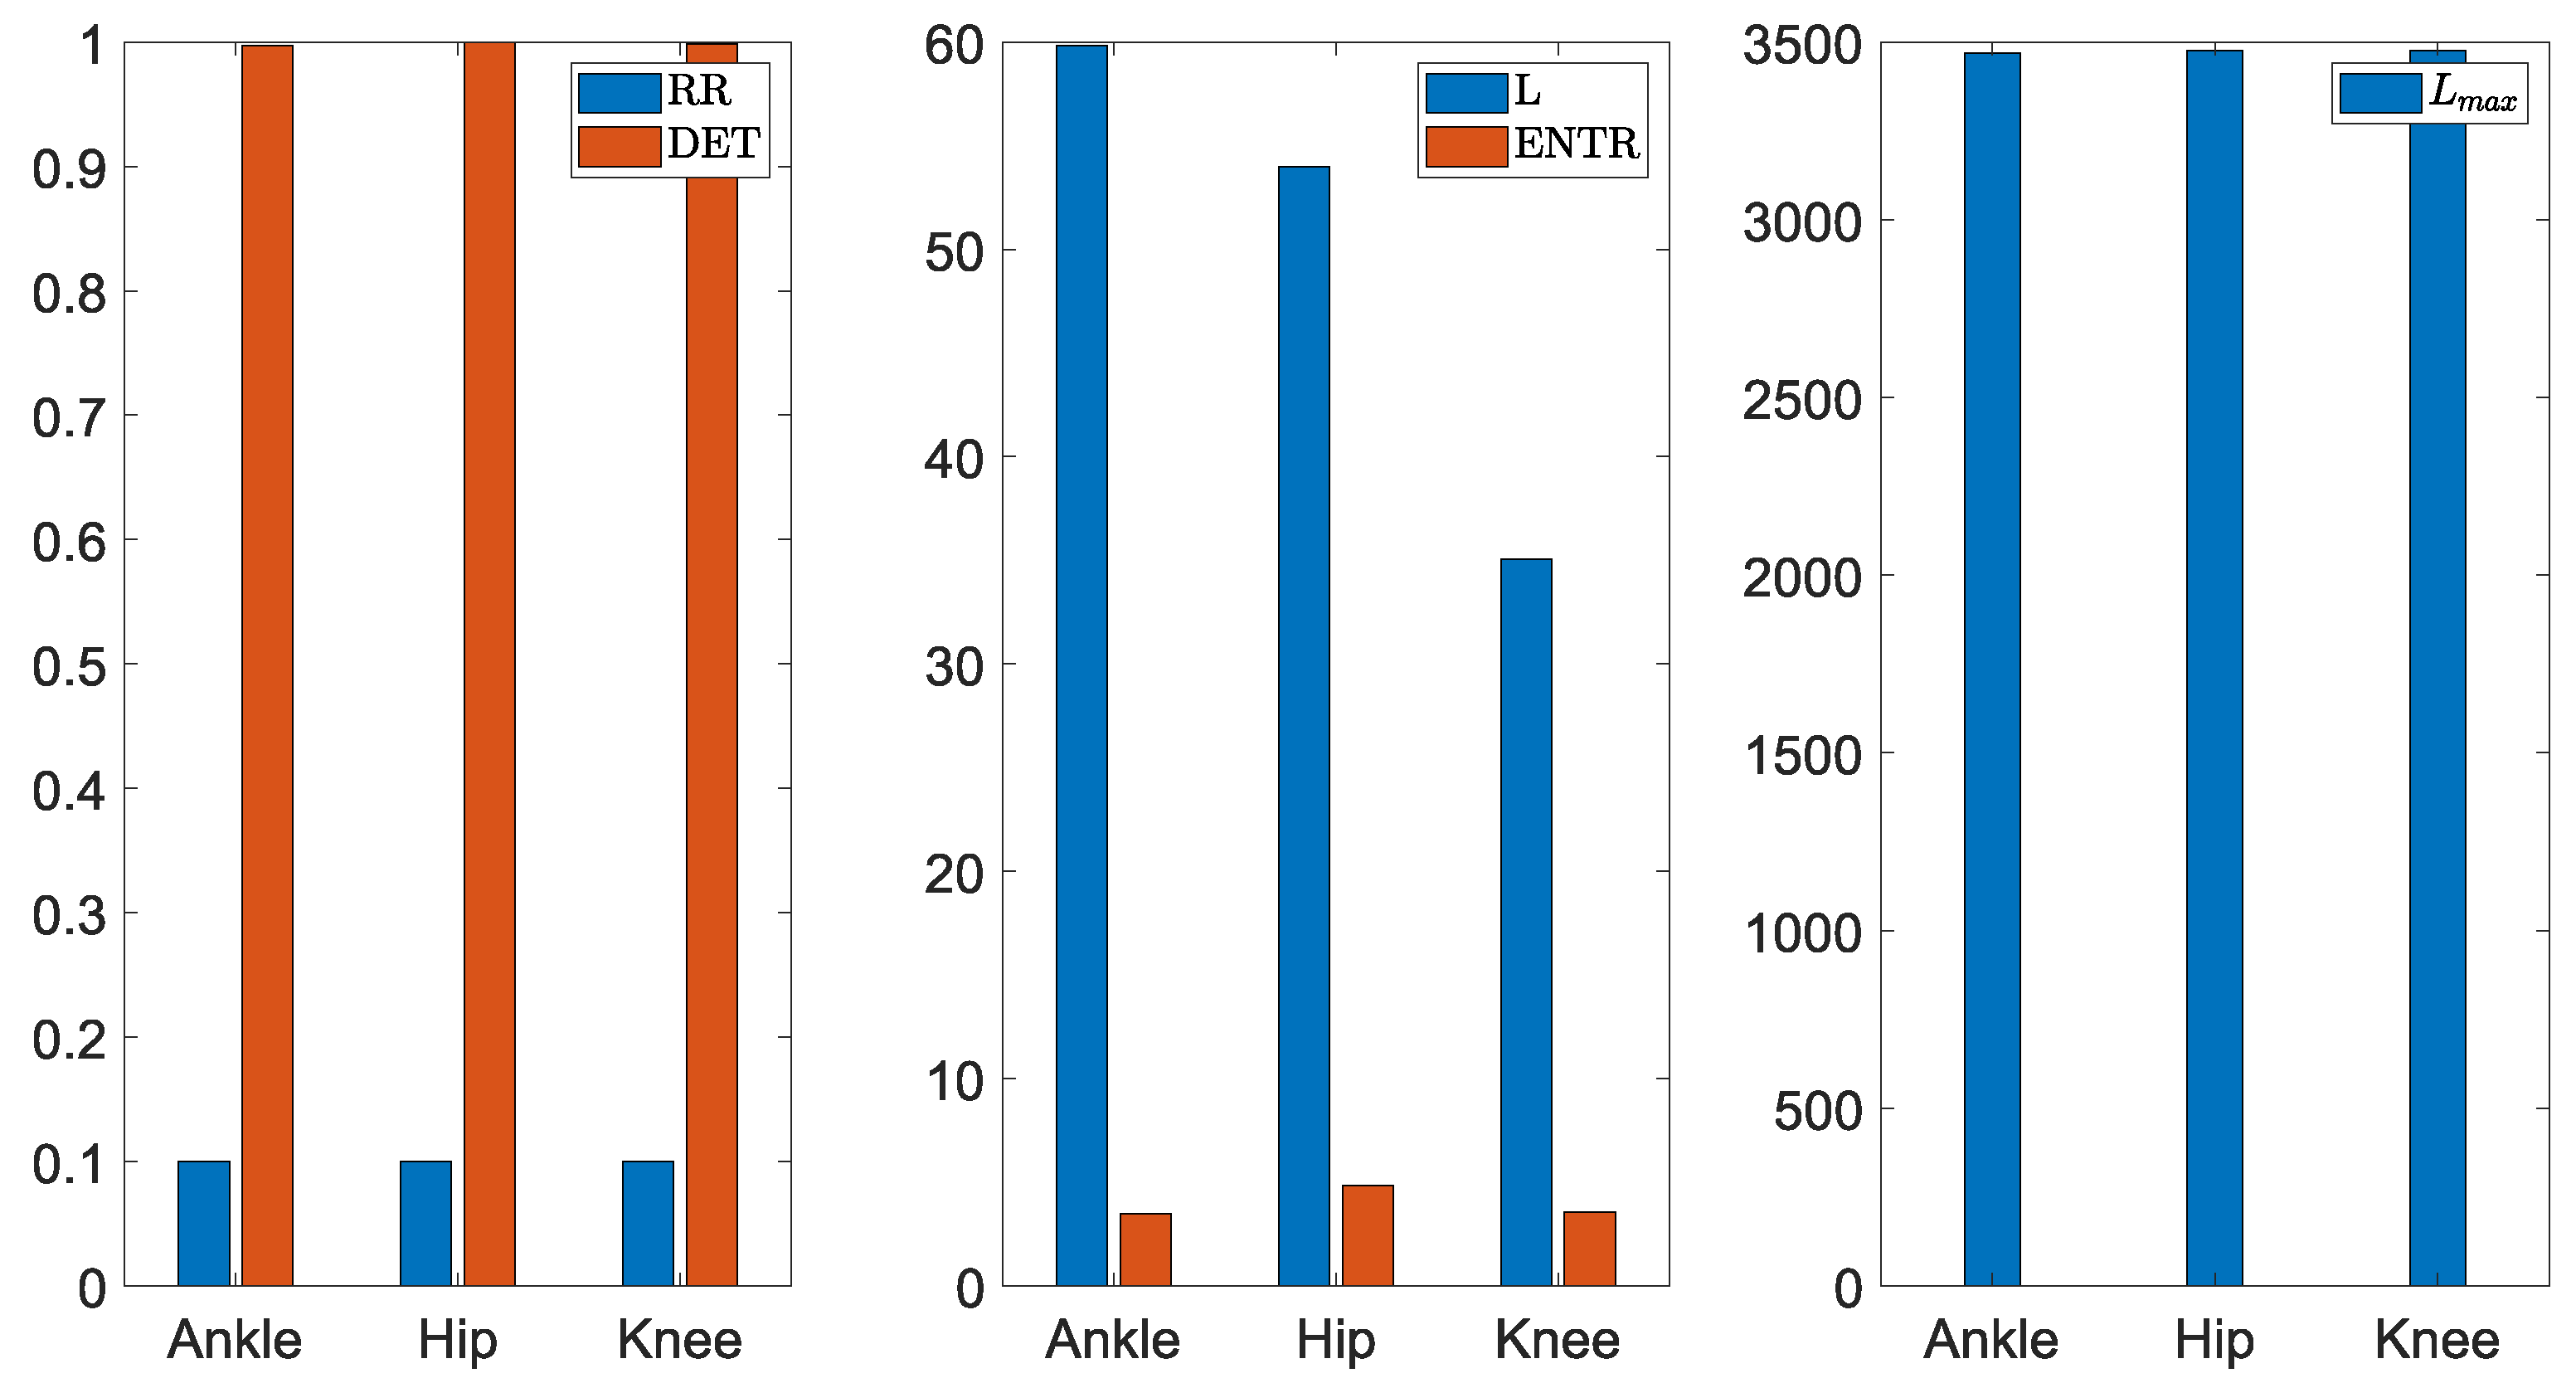
4.4. RQA Measures
5. Conclusions
Author Contributions
Funding
Institutional Review Board Statement
Informed Consent Statement
Acknowledgments
Conflicts of Interest
References
- Khalid, S.; Raouf, I.; Khan, A.; Kim, N.; Kim, H.S. A Review of Human-Powered Energy Harvesting for Smart Electronics: Recent Progress and Challenges. Int. J. Precis. Eng. Manuf. Green Technol. 2019, 6, 821–851. [Google Scholar] [CrossRef]
- Choi, Y.M.; Lee, M.G.; Jeon, Y. Wearable biomechanical energy harvesting technologies. Energies 2017, 10, 1483. [Google Scholar] [CrossRef] [Green Version]
- Niu, P.; Chapman, P.; Riemer, R.; Zhang, X. Evaluation of motion and actuation methods for biomechanical energy harvesting. In Proceedings of the IEEE Annual Power Electronics Specialists Conference, Aachen, Germany, 20–25 June 2004; Volume 3, pp. 2100–2106. [Google Scholar] [CrossRef]
- Shi, H.; Liu, Z.; Mei, X. Overview of human walking induced energy harvesting technologies and its possibility for walking robotics. Energies 2019, 13, 86. [Google Scholar] [CrossRef] [Green Version]
- Donelan, J.M.; Li, Q.; Naing, V.; Hoffer, J.A.; Weber, D.J.; Kuo, A.D. Biomechanical energy harvesting: Generating electricity during walking with minimal user effort. Science 2008, 319, 807–810. [Google Scholar] [CrossRef] [PubMed]
- Liu, H.; Hou, C.; Lin, J.; Li, Y.; Shi, Q.; Chen, T.; Sun, L.; Lee, C. A non-resonant rotational electromagnetic energy harvester for low-frequency and irregular human motion. Appl. Phys. Lett. 2018, 113. [Google Scholar] [CrossRef] [Green Version]
- Lin, J.; Liu, H.; Chen, T.; Yang, Z.; Sun, L. A rotational wearable energy harvester for human motion. In Proceedings of the 2017 IEEE 17th International Conference on Nanotechnology, NANO 2017, Pittsburgh, PA, USA, 25–28 July 2017; pp. 22–25. [Google Scholar] [CrossRef]
- Cai, Q.l.; Zhu, S. Enhancing the performance of electromagnetic damper cum energy harvester using microcontroller: Concept and experiment validation. Mech. Syst. Signal Process. 2019, 134, 106339. [Google Scholar] [CrossRef]
- Hu, Y.; Xue, H.; Hu, T.; Hu, H. Nonlinear interface between the piezoelectric harvesting structure and the modulating circuit of an energy harvester with a real storage battery. IEEE Trans. Ultrason. Ferroelectr. Freq. Control 2008, 55, 148–159. [Google Scholar] [CrossRef] [PubMed]
- Lefeuvre, E.; Audigier, D.; Richard, C.; Guyomar, D. Buck-boost converter for sensorless power optimization of piezoelectric energy harvester. IEEE Trans. Power Electron. 2007, 22, 2018–2025. [Google Scholar] [CrossRef]
- Abouloifa, A.; Greyc, F.G. Nonlinear control of buck-boost AC/DC converters: Output voltage regulation & power factor correction. Proc. Am. Control Conf. 2004, 1, 168–173. [Google Scholar] [CrossRef]
- Tang, X.; Lin, T.; Zuo, L. Design and optimization of a tubular linear electromagnetic vibration energy harvester. IEEE/ASME Trans. Mechatron. 2014, 19, 615–622. [Google Scholar] [CrossRef]
- Duong, M.T.; Chun, Y.D.; Hong, D.K. Design of a high-performance 16-slot 8-pole electromagnetic shock absorber using a novel permanent magnet structure. Energies 2018, 11, 3352. [Google Scholar] [CrossRef] [Green Version]
- Zhu, S.; Shen, W.A.; Xu, Y.L. Linear electromagnetic devices for vibration damping and energy harvesting: Modeling and testing. Eng. Struct. 2012, 34, 198–212. [Google Scholar] [CrossRef] [Green Version]
- Eriksson, S. Design of permanent-magnet linear generators with constant-torque-angle control for wave power. Energies 2019, 12, 1312. [Google Scholar] [CrossRef] [Green Version]
- Asadi, E.; Ribeiro, R.; Behrad Khamesee, M.; Khajepour, A. A new adaptive hybrid electromagnetic damper: Modelling, optimization, and experiment. Smart Mater. Struct. 2015, 24, 75003. [Google Scholar] [CrossRef]
- Middlebrook, R.D.; Ćuk, S. A general unified approach to modelling switching-converter power stages. Int. J. Electron. 1977, 42, 521–550. [Google Scholar] [CrossRef]
- Krein, P.T.; Lesieutre, B.L.C.; Bentsman, J.; Bass, R.M.; Lesieutre, B.L.C. On the Use of Averaging for the Analysis of Power Electronic Systems. Comput. Eng. 1989, 5, 463–467. [Google Scholar] [CrossRef]
- Villalva, M.G.; Filho, E.R. Buck converter with variable input voltage for photovoltaic applications. In Proceedings of the Brazilian Power Electronics Conference, Blumenau, Brazil, 30 September–4 October 2007. [Google Scholar]
- Puig, A.; Escalona, C.; Padullés, J.; Busquets, A.; Padullés, X.; Marcos, D. Validity and reliability of the Kinovea program in obtaining angles and distances using coordinates in 4 perspectives. PLoS ONE 2019, 14, e2843847. [Google Scholar] [CrossRef]
- Poincaré, H. Sur le probléme des trois corps et les équations de la dynamique. Acta Math. 1890, 13. [Google Scholar] [CrossRef]
- Eckmann, J.P.; Oliffson Kamphorst, O.; Ruelle, D. Recurrence plots of dynamical systems. Erophycics Lett. 1987, 4, 973–977. [Google Scholar] [CrossRef] [Green Version]
- Marwan, N.; Carmen Romano, M.; Thiel, M.; Kurths, J. Recurrence plots for the analysis of complex systems. Phys. Rep. 2007, 438, 237–329. [Google Scholar] [CrossRef]
- Kantz, H.; Schreiber, T. Nonlinear Time Series Analysis; Cambridge University Press: Cambridge, UK, 2004; p. 388. [Google Scholar] [CrossRef]
- Cao, L. Practical method for determining the minimum embedding dimension of a scalar time series. Phys. D Nonlinear Phenom. 1997, 110, 43–50. [Google Scholar] [CrossRef]
- Zbilut, J.P.; Giuliani, A.; Webber, C.L., Jr. Recurrence quantification analysis and principal components in the detection of short complex signals. Phys. Lett. A 1998, 237, 131–135. [Google Scholar] [CrossRef] [Green Version]
- Zbilut, J.P.; Webber, C.L. Embeddings and delays as derived from quantification of recurrence plots. Phys. Lett. A 1992, 171, 199–203. [Google Scholar] [CrossRef]
- Wheeler, H.A. Inductance Formulas for Circular and Square Coils. Proc. IEEE 1982, 70, 1449–1450. [Google Scholar] [CrossRef]
- Webber, C.L.; Norbertt, M. Recurrence Quantification Analysis Theory and Best Practices-Understanding Complex Systems; Springer International Publishing: Cham, Switzerland, 2015. [Google Scholar] [CrossRef]
- Zhu, D.; Duarte-Rabelo, I.; Ayala-Garcia, I.N.; Somov, A. An electromagnetic in-shoe energy harvester using wave springs. In Proceedings of the 2018 IEEE Industrial Cyber-Physical Systems, ICPS 2018, St. Petersburg, Russia, 15–18 May 2018; pp. 659–663. [Google Scholar] [CrossRef]
- Niroomand, M.; Foroughi, H.R. A rotary electromagnetic microgenerator for energy harvesting from human motions. J. Appl. Res. Technol. 2016, 14, 259–267. [Google Scholar] [CrossRef] [Green Version]
- Wang, W.; Cao, J.; Zhang, N.; Lin, J.; Liao, W.H. Magnetic-spring based energy harvesting from human motions: Design, modeling and experiments. Energy Convers. Manag. 2017, 132, 189–197. [Google Scholar] [CrossRef]
- Halim, M.A.; Cho, H.; Park, J.Y. Design and experiment of a human-limb driven, frequency up-converted electromagnetic energy harvester. Energy Convers. Manag. 2015, 106, 393–404. [Google Scholar] [CrossRef]
- Saha, C.R.; O’Donnell, T.; Wang, N.; McCloskey, P. Electromagnetic generator for harvesting energy from human motion. Sens. Actuators A Phys. 2008, 147, 248–253. [Google Scholar] [CrossRef]
- Marwan, N.; Wessel, N.; Meyerfeldt, U.; Schirdewan, A.; Kurths, J. Recurrence-plot-based measures of complexity and their application to heart-rate-variability data. Phys. Rev. E 2002, 66. [Google Scholar] [CrossRef] [PubMed] [Green Version]
- Ngamga, E.J.; Nandi, A.; Ramaswamy, R.; Romano, M.C.; Thiel, M.; Kurths, J. Recurrences of strange attractors. Pramana J. Phys. 2008, 70, 1039–1045. [Google Scholar] [CrossRef]
- Marwan, N. Cross Recurrence Plot Toolbox for Matlab Reference Manual. Available online: https://tocsy.pik-potsdam.de/CRPtoolbox/ (accessed on 15 April 2021).


| Symbol | Value | Description |
|---|---|---|
| 10 mm | Magnet Height | |
| 3 mm | Shaft Radius | |
| 8 mm | Magnet Width | |
| 1.5 mm | Air Gap between stator and slider | |
| 10 mm | Tooth Height | |
| 9.5 mm | Coil Width | |
| 3 mm | Stator Shell Thickness | |
| 0.4 mm | Wire Diameter Width | |
| 1.23 T | Remanent Magnetic Flux Density | |
| N | 593 | Turns Coils Width |
| 5 | Number of Coils |
| Symbol | Value | Description |
|---|---|---|
| 42.7 Ω | Transducer resistance | |
| 286 mH | Transducer inductance | |
| 0.8 mF | Rectifier capacitance | |
| 50 mH | Converter inductance | |
| 8.5 mF | Converter capacitance | |
| 750 Ω | Load resistance |
| Output Power | Location | Methods | Input | Ref. |
|---|---|---|---|---|
| 10.4 mW | Knee joint | Measurement and simulation | 8 Hz | [6] |
| 0.2 mW/cm3 | Ankle joint | Measurement | 8 km/h | [7] |
| 1.6 mW | Shoes | Measurement | [30] | |
| 416.6 μW | Ankle joint | Measurement and simulation | [31] | |
| 0.42 mW | Leg | Measurement and simulation | [32] | |
| 0.84 mW | Hand | Measurement and simulation | 5 Hz | [33] |
| 2.46 mW | Back | Measurement and Simulation | [34] | |
| 1.4 mW | Hip joint | Simulation | 4.5 km/h | |
| 90 mW | Knee joint | Simulation | 4.5 km/h | |
| 45 mW | Ankle joint | Simulation | 4.5 km/h |
| RR | DET | L | Lmax | ENTR | |
|---|---|---|---|---|---|
| Hip Joint | |||||
| Rotational Joint Velocity () | 0.0997 | 0.9999 | 318.8056 | 3400 | 6.2370 |
| Transducer Induced Voltage () | 0.0997 | 0.9999 | 251.3183 | 3400 | 6.0501 |
| Transducer Inductance Current () | 0.0997 | 0.9998 | 71.1061 | 3400 | 4.9530 |
| Rectifier Voltage () | 0.0997 | 0.9997 | 66.2809 | 3200 | 4.8355 |
| Converter Inductance Current () | 0.0997 | 0.9991 | 27.7869 | 3100 | 3.9821 |
| Load Voltage () | 0.0998 | 0.9997 | 53.9709 | 3475 | 4.8245 |
| Load Power () | 0.0998 | 0.9997 | 53.9918 | 3475 | 4.8256 |
| Knee Joint | |||||
| Rotational Joint Velocity () | 0.0997 | 0.9996 | 53.6390 | 3320 | 4.4041 |
| Transducer Induced Voltage () | 0.0998 | 0.9967 | 26.7134 | 2121 | 4.0428 |
| Transducer Inductance Current () | 0.0998 | 0.9987 | 24.7266 | 2122 | 3.9134 |
| Rectifier Voltage () | 0.0997 | 0.9986 | 31.0438 | 2504 | 4.0277 |
| Converter Inductance Current () | 0.0997 | 0.8428 | 5.83173 | 394 | 2.3226 |
| Load Voltage () | 0.0998 | 0.9985 | 35.1008 | 3475 | 3.5716 |
| Load Power () | 0.0998 | 0.9986 | 35.0679 | 3475 | 3.5702 |
| Ankle Joint | |||||
| Rotational Joint Velocity () | 0.0997 | 0.9995 | 49.0584 | 3360 | 4.5180 |
| Transducer Induced Voltage () | 0.0997 | 0.9989 | 32.5250 | 3440 | 4.1800 |
| Transducer Inductance Current () | 0.0997 | 0.9987 | 25.1214 | 1988 | 3.9726 |
| Rectifier Voltage () | 0.0997 | 0.9993 | 34.8633 | 3440 | 4.2629 |
| Converter Inductance Current () | 0.0999 | 0.8853 | 7.27593 | 426 | 2.5351 |
| Load Voltage () | 0.0997 | 0.9972 | 59.3336 | 3470 | 3.4533 |
| Load Power () | 0.0997 | 0.9972 | 59.8217 | 3470 | 3.4741 |
Publisher’s Note: MDPI stays neutral with regard to jurisdictional claims in published maps and institutional affiliations. |
© 2021 by the authors. Licensee MDPI, Basel, Switzerland. This article is an open access article distributed under the terms and conditions of the Creative Commons Attribution (CC BY) license (https://creativecommons.org/licenses/by/4.0/).
Share and Cite
Molina Arias, L.; Iwaniec, J.; Iwaniec, M. Modeling and Analysis of the Power Conditioning Circuit for an Electromagnetic Human Walking-Induced Energy Harvester. Energies 2021, 14, 3367. https://doi.org/10.3390/en14123367
Molina Arias L, Iwaniec J, Iwaniec M. Modeling and Analysis of the Power Conditioning Circuit for an Electromagnetic Human Walking-Induced Energy Harvester. Energies. 2021; 14(12):3367. https://doi.org/10.3390/en14123367
Chicago/Turabian StyleMolina Arias, Ludwin, Joanna Iwaniec, and Marek Iwaniec. 2021. "Modeling and Analysis of the Power Conditioning Circuit for an Electromagnetic Human Walking-Induced Energy Harvester" Energies 14, no. 12: 3367. https://doi.org/10.3390/en14123367