Article

Descending Modal Transition Dynamics in a Large Eddy Simulation of a Rotating Detonation Rocket Engine

by
Armani Batista
1,*,
Mathias C. Ross
2,
Christopher Lietz
3 and
William A. Hargus, Jr.
4
1
National Research Council (NRC), Air Force Research Laboratory, Edwards AFB, CA 93524, USA
2
Department of Mechanical and Aerospace Engineering, University of California, Los Angeles, CA 90095, USA
3
Sierra Lobo, Inc., Edwards AFB, CA 93524, USA
4
Air Force Research Laboratory, Edwards AFB, CA 93524, USA
*
Author to whom correspondence should be addressed.
Energies 2021, 14(12), 3387; https://doi.org/10.3390/en14123387
Submission received: 15 April 2021 / Revised: 30 May 2021 / Accepted: 4 June 2021 / Published: 8 June 2021
(This article belongs to the Special Issue Rotating Detonation Engines)

Abstract

:
Rotating detonation rocket engines (RDREs) exhibit various unsteady phenomena, including modal transitions, that significantly affect their operation, performance and stability. The dynamics of the detonation waves are studied during a descending modal transition (DMT) where four co-rotating detonations waves decrease to three in a gaseous methane-oxygen RDRE. Detonation wave tracking is applied to capture, visualize and analyze unsteady, 3D detonation wave dynamics data within the combustion chamber of the RDRE. The mechanism of a descending modal transition is the failure of a detonation wave in the RDRE, and in this study, the failing wave is identified along with its failure time. The regions upstream of each relative detonation show the mixture and flow-field parameters that drive detonation failure. Additionally, it is shown that descending modal transitions encompass multiple phases of detonation decay and recovery with respect to RDREs. The results show high upstream pressure, heat release and temperature, coupled with insufficient propellants, lead to detonation wave failure and non-recovery of the trailing detonation wave during a descending modal transition. Finally, the Wolanski wave stability criterion regarding detonation critical reactant mixing height provides insight into detonation failure or sustainment.

Graphical Abstract

1. Introduction

1.1. RDRE Overview

The rotating detonation rocket engine (RDRE) utilizes one or more detonation waves that continuously travel around an annular chamber above an injection plane where propellant is axially injected [1,2]. RDREs potentially produce significantly increased combustion pressures and, as a result ,may provide performance improvements over classical deflagration rocket engines [3,4]. Figure 1 depicts general RDRE function. As the detonation(s) continuously propagate around the chamber at their respective wave speed(s), an associated characteristic propellant refill zone forms [5]. This reactant fill-zone is where fuel and oxidizer are available for combustion just upstream of each detonation wave. In this way, each successive detonation wave passes through sufficient fuel and oxidizer to sustain it [6]. Above each detonation wave, an oblique shock and shear layer form. The hot gases travel axially down the chamber until exiting through the exhaust plane. Certain RDREs employ a nozzle to expand the flow upon exiting the chamber.
The main modes of RDRE operation consist of a transient start-up phase, a steady-state phase, and a shutdown phase [7]. The start-up phase consists of igniting the propellants in the chamber, by directly igniting with a spark, high pressure-temperature kernel, or via a pre-detonator. In the cases of direct ignition, a symmetrically spreading deflagration develops in both annular directions that undergoes a deflagration to detonation transition (DDT). Subsequently, a large number of counter-propagating (rotating clockwise and counterclockwise) detonation waves travel around the annulus. Next, the detonation wave complex undergoes a number of changes, where the detonation wave structure simplifies. Detonation waves will disappear, re-appear, merge and change direction until a particular number of detonations becomes prevalent. Once an unchanging number and direction of detonation waves develop within the RDRE, it is considered to have reached a steady operational mode [8]. Time scales commonly observed in gaseous methane-oxygen RDRE simulation start-ups are on the order of: 0.25 ms to 0.30 ms from ignition to DDT, 1.0 ms to 2.0 ms for unsteady counter-propagating to co-rotating detonation transition, and 2.0 ms to 4.0 ms to reach steady state.

1.2. Background

Modal transitions are an unsteady or transient phenomenon that occur in rotating detonation engines (RDEs) when the number of detonations decrease, increase, or change direction. In this study, we specifically address the scenario when the number of co-rotating detonations decrease during the RDRE startup sequence just prior to reaching steady-state. This phenomenon is known as the descending modal transition (DMT). The findings in this work are applicable to DMTs that occur outside of RDRE startup, such that the DMT is a trailing wave failure type [9].
Modal transitions have been experimentally observed by Suchocki et al., Rankin et al., Stechmann et al., and Bennewitz at al. [10,11,12,13]. Figure 2 shows an example of a DMT from three to two waves captured from the RDRE exhaust plane during an experimental run [13]. Additionally, theoretical studies by Koch et al. [14], numerical simulations by Lietz et al. [8], and wave stability investigations by Anand et al. [15], have encountered modal transitions while examining RDE/RDRE nonlinear physics. As such, modal transitions are not isolated incidents.
There exists a coupling of global parameters such as: propellant type, injection mass flow rate and chamber mixing, with local dynamics of inter-detonation wave interactions. This global-local level coupling modulates the sustained number of waves, their speeds, and modal transitions in RDREs [16]. The mechanisms that prelude modal transitions in RDREs (i.e., wave galloping) are an open area of research. However, in the case of most co-rotating DMTs, galloping detonation wave behavior intensifies until one of the waves fail becoming an uncoupled shock-deflagration, decays, and does not reinitiate (recover) [13]. Then, the subsequent deflagration wave is absorbed/merged with another detonation wave (note: in two or more RDRE wave modes) [10,11,12].

1.3. Research Focus

In this work, we closely study a DMT that occurs during the approach of the RDRE simulation to operational steady state. To fully capture the oscillatory flow-field dynamics associated with the mode transition, we utilize a high-fidelity modeling approach. We focus on a 120 μ s period utilizing high time resolution data during the DMT. This approach limits the scope of the analysis by isolating the DMT from the wave galloping and interactions that occur beforehand. Thus, this time period provides a direct set of data to study the decaying weak to moderate transients leading up to the RDRE steady-state mode.
The main findings in this work are briefly summarized. Recall, a DMT occurs in an RDRE when one or more detonation waves fail and do not reinitiate. The data shown identifies the trailing detonation wave as the failing wave, for the studied type of RDRE DMT [16]. A recovery period for the RDRE ensues after trailing wave failure, that is directly related to the strengthening of another detonation that survives the wave interaction that led to DMT. The critical reactant mixing height is calculated, and provides an approximation for the required reactant fill height needed to sustain a detonation. Characterizing DMTs in this manner aids researching other transient phenomena in RDREs, thus, leading to potential engineering design and performance improvements.

2. Methodology

2.1. Numerical Solver Overview

Numerous mathematical models and numerical studies have been performed to capture the small-scale physics of various types of RDEs [17]. In this study, numerical data is generated using an implicit, large-eddy simulation (LES) [8]. The LES solver is a commercial product named AHFM (ALREST High-Fidelity Modeling) derived from LESLIE (LES with Linear Eddy model). LESLIE was developed by, for example, Kim, Genin, Masquelet, Jin, Friedrich, Srinivasan, Ranjan and Menon [18,19,20,21,22] AHFM is a multiblock structured mesh turbulent combustion solver for non-orthogonal structured grids with a prototypical block structure, and is capable of resolving complex geometries with rounded features [8]. To date, AHFM has been extensively validated for a variety of turbulent combustion and RDRE simulations [23,24] and compared with numerous experiments [25,26].
AHFM solves the reacting LES formulation of the Navier-Stokes equations of motion [21]. A 12-species/38-reaction mechanism, FFCMy-12, is used to model chemical source terms, and was developed by Wang et al. and Xu et al. [27,28]. Specific heats are calculated using NASA polynomial curve-fits [20]. JANAF polynomial curve-fits, and Wilke’s formula are used to determine mixture viscosity and thermal conductivity transport properties [29]. Subgrid scale equations are used for closure of the LES equations as described in Kim et al. [30]. A second-order MacCormack scheme is used for temporal and spatial resolution, with third-order MUSCL (Monotonic Upstream-centered Scheme for Conservation Laws) upwinding applied to alleviate instabilities near the detonation wave fronts.

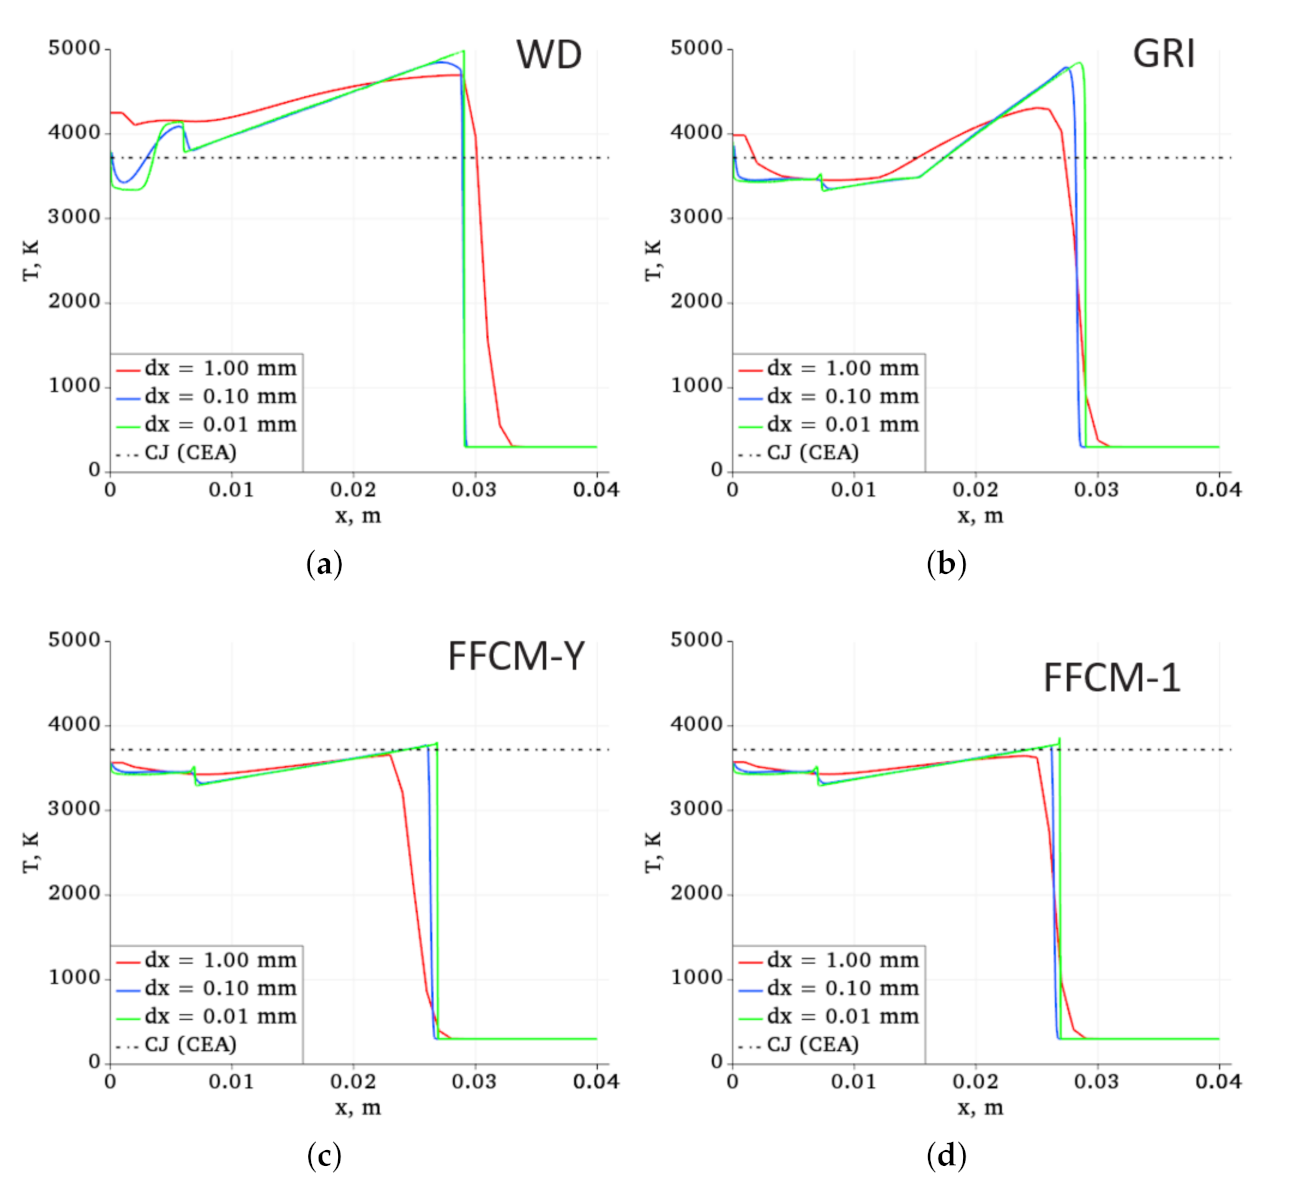
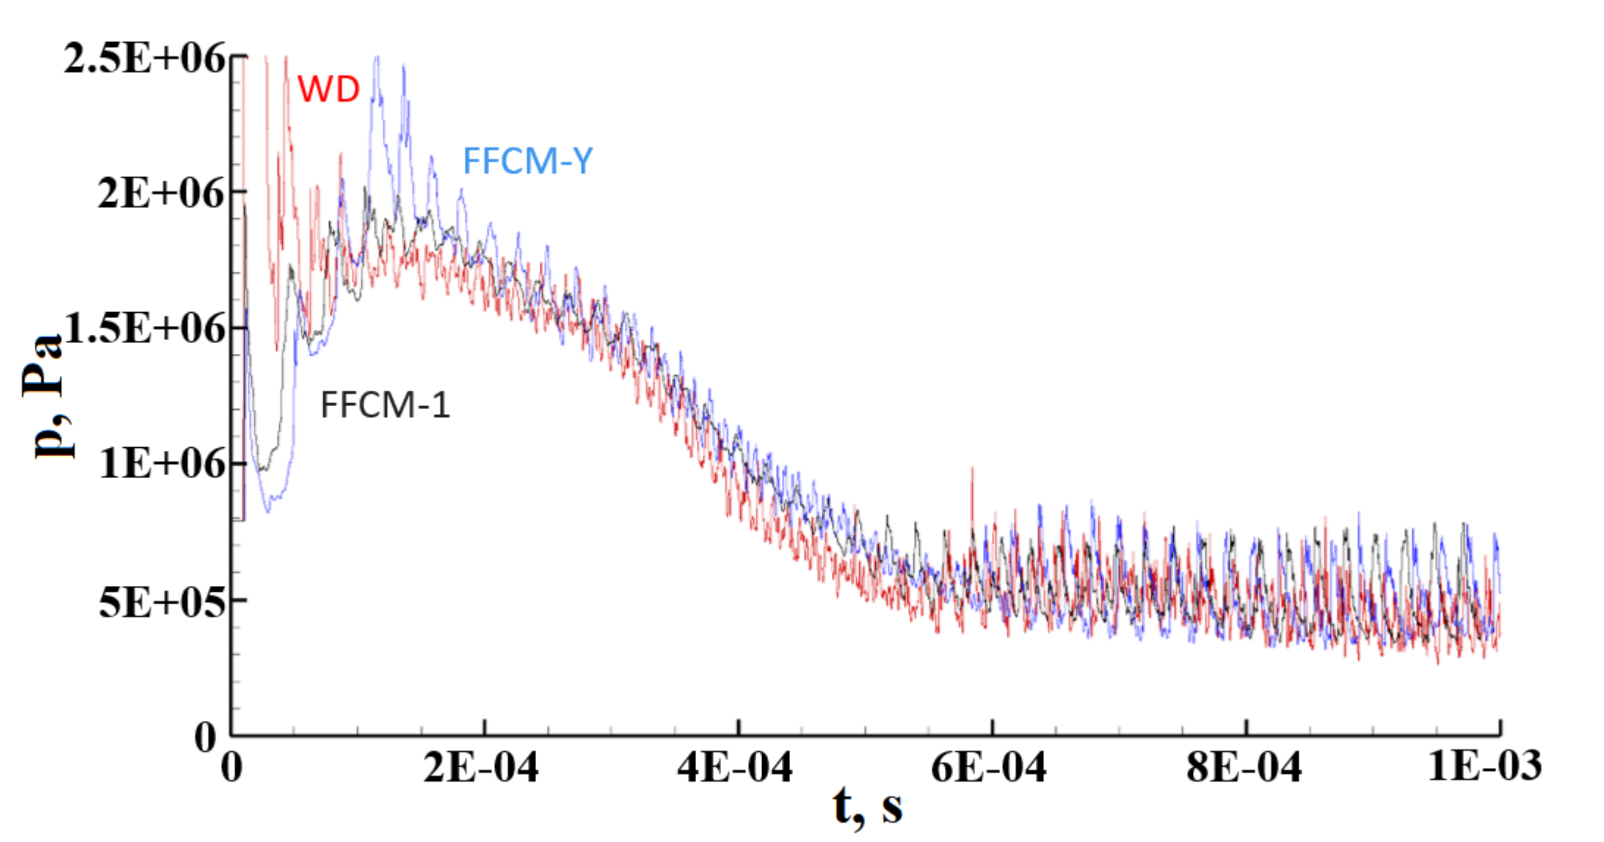
2.2. Grid and Chemical Mechanism Comparisons

In this section, relevant grid and chemical mechanism sensitivity results are reviewed from another study by Lietz et al. [31]. The results are directly applicable to compare the chemical mechanism FFCMy-12 used in this LES study to other mechanisms. Additionally, an RDRE grid sector case simulation is also reviewed.
One-dimensional (1D), premixed, methane-oxygen detonation tube simulations were conducted using four chemical mechanisms: Westbrook-Dryer (WD), FFCMy-12, FFCM-1, and GRI 3.0. The conditions are an equivalence ratio 1.15, an initial temperature of 300 K, and an initial pressure of 1 atm. Figure 3 and Figure 4 show the results of the 1D simulation. The grid cell sizes are varied: 1.00 mm, 0.10 mm, and 0.01 mm. As the grid is refined, the temperature for each solution approaches a consistent value for all four mechanisms. In Figure 4, the pressure and temperature versus × location data overlap with respect to the FFCM based mechanisms. The mechanisms WD and GRI 3.0 show pressure results that are similar at their respective detonation fronts and post detonation. However, WD overpredicts temperature for most of the post detonation range, while GRI 3.0 initially overpredicts, then converges to similar temperatures to FFCM-1 and FFCMy-12. The theoretical CJ wave speed at these conditions is 2461 m/s. Both FFCM based mechanisms yield similar wave speeds at 2460 m/s, while both WD and GRI 3.0 overpredict wave speeds at 2630 m/s.
A one-eighth RDRE sector grid and simulation with periodic boundary conditions at both azimuthal boundaries is provided for comparison. The sector grid is relatively coarser than the full RDRE, consisting of 10 million grid points. This grid would correlate to 80 million grid points for an entire RDRE annulus. The three chemical mechanisms used for the one-eighth sector simulation were are WD, FFCMy-12, and FFCM-1, and consumed 0.18 million, 0.28 million and 0.42 million CPU-hours respectively.
Figure 5 shows chamber pressures corresponding to a capillary tube attenuated pressure (CTAP) probe. Besides differences during the earlier startup transient among the three mechanisms, the steady state pressure magnitudes are of similar order. The oscillatory pressure peaks correspond to detonations in the RDRE that all three mechanisms capture. The pressure signal amplitude and frequency from the WD case does not match as closely to both FFCM based mechanisms. Differences in CTAP signals in RDREs imply differences in the number of detonation waves present in the chamber, their speeds, and their strengths. The FFCM based mechanisms are tuned for high-pressure combustion processes, so they more accurately predict certain detonation characteristics such as wave speed. The benefits of using the reduced mechanism FFCMy-12 is that it is computationally less expensive compared to GRI 3.0 and FFCM-1.

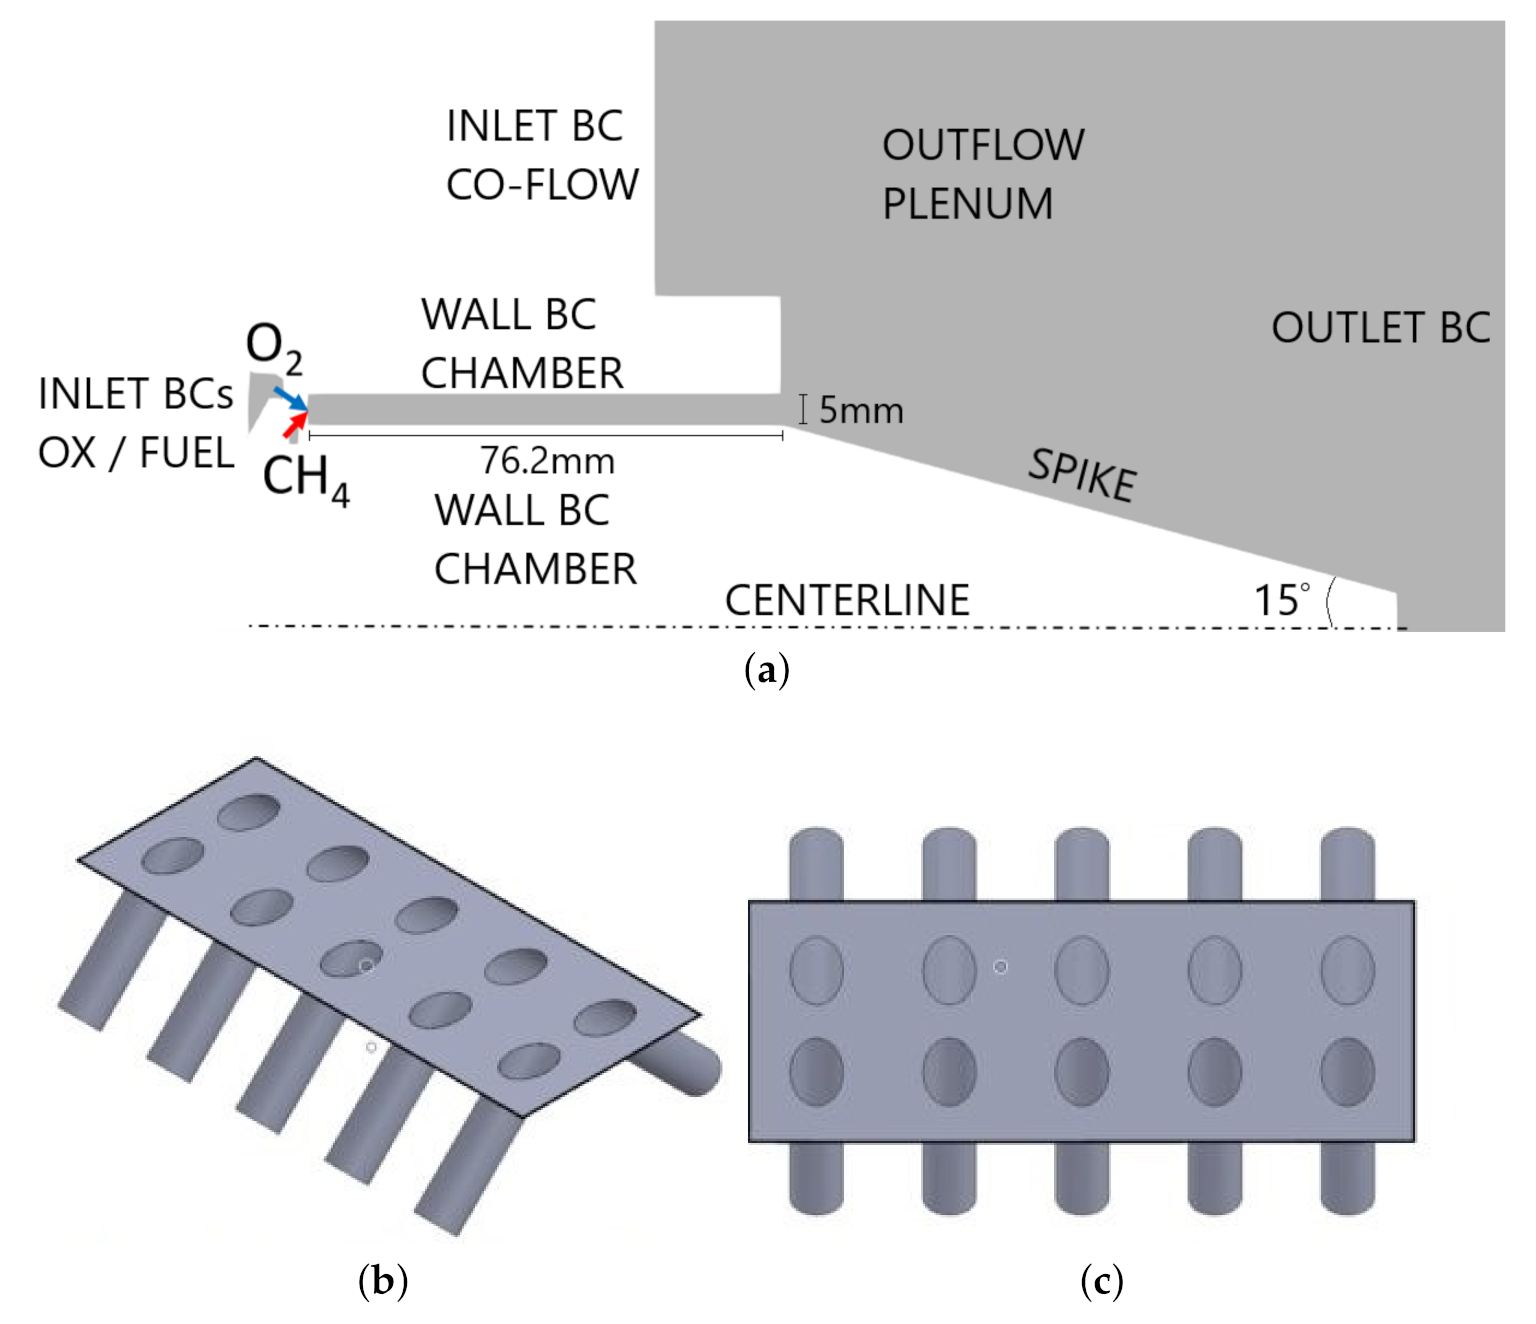
2.3. RDRE Geometry and Numerical Setup

The RDRE utilizes a design by Smith and Stanley [32], and consists of 72 discrete fuel and oxidizer injector pairs that axially inject gaseous methane and oxygen into the chamber. The combustion chamber dimensions have an outer diameter and axial length of 76.2 mm, a 5 mm annulus channel width, and a 15 conical exit spike at the exhaust plane illustrated in Figure 6. Fuel and oxidizer inflow boundary conditions are modeled with fixed mass flow rates and temperatures at plenum inflow boundaries [8]. At the walls, adiabatic and no-slip conditions are applied. The outflow boundary condition utilizes an adaptive local Mach number subsonic/supersonic condition. Table 1 lists the operating conditions used for the simulation and are a direct reference to the experiment in Bennewitz et al. [13]. Further details on the RDRE design are found in Smith and Stanley [32].
The full RDRE grid consists of approximately 140 million hexahedral cells, with the annular chamber nearest to where the detonations propagate corresponding to grid cell sizes on the order of 50 μ m. Induction length and detonation cell size are determined relative to the RDRE run conditions and average detonation wave speed. The induction length calculated from Zel’dovich-Neumann-Döring (ZND) theory is 292 μ m. The experimental induction length range is from approximately 130 μ m to 230 μ m per Schumaker et al. [34]. Additionally, the experimental detonation cell size is on the order of 1.25 mm to 2.0 mm [34], and the simulation detonation cell size is approximately 2.5 mm. Thus, the grid spacing sufficiently resolves both detonation cells and induction lengths, with 25–50 grid cells per detonation cell, and 5 grid cells per induction length. Such sizing is necessary to capture transient detonation dynamics along with other flow-field length scales in the RDRE [35,36]. Additionally, this is consistent with numerous RDRE simulations by Schwer and Kailasanath, Ross et al., Pal et al., and Prakash et al. [37,38,39,40,41].
The simulation consumed six million CPU-hours spread across 16,060 processors. At the beginning of the simulation, the combustion chamber is pre-filled with stagnant oxygen at room temperature. A 10 mm height ring is filled with premixed methane and oxygen with a defined pressure gradient starting from 10 atm at the injection plane, to 1 atm at the exhaust plane. A high temperature and pressure ignition kernel within the premixed methane-oxygen ring serves to initiate the DDT process. In this way, no preference is given to the number of detonation waves that result upon reaching steady-state.
The RDRE simulation is considered to reach steady-state when there is negligible detonation wave galloping, negligible wave speed variations and the experimental target reactant flow rates are achieved. However, in this study, we are specifically interested in the time frame leading up to steady state. The dynamics of the full start-up transient in RDREs are the topic of ongoing research. Further details regarding RDRE numerical setup and experimental comparisons are available in Lietz et al. and Prakash et al. [8,40].

2.4. Detonation Surface Plots

The generation of detonation surface plots is an initial step in RDRE data post-processing and analysis, and provides a common framework for validating RDRE simulations to experimental results. Detonation surfaces represent a 2D, unwrapped projection of the RDRE, illustrating the azimuthal and temporal components of the detonation waves and chamber flow-field dynamics. The higher parameter magnitudes (i.e., pressure, heat release, or normalized luminescent intensity) in the plot corresponds to the detonation waves’ angular position versus time. The remaining areas with lower magnitudes are the non-detonation (No Det.) regions that consist of deflagration and unburned reactants. Additional details on experimental and numerical simulations on detonation surfaces are found in references [7,8].

2.5. 3D Data Extraction

A data extraction method using Paraview packages [42] is developed to gather 3D chamber data from local regions of interest (i.e., each detonation wave, non-detonation/deflagration regions (No Det.), and upstream of detonations). In this study, high time resolution data is extracted from the simulation in 0.1 μ s increments. First, a section of the RDRE chamber annulus data is extracted. Next, the angular position and time of each detonation are determined from the detonation surfaces, and plugged into the data extraction tools. Then, criteria are applied to extract the regions of interest in each respective detonation reference frame. Finally, average data is calculated from the regions of interest integrated volumes including pressure, heat release, temperature, and species mass fractions [43].
Traditionally, spatial pressures in the RDRE annulus are compared to determine the local detonation regions of interest. If a local pressure region is greater than or equal to 5 atm, then the region is considered a detonation [44]. This criterion is referred to as the pressure greater than 5 atm criterion [39,45]. However, the pressure criterion, often yields regions beyond the detonation wave, including areas with commensal combustion and post-detonation deflagration [46,47]. Additionally, in RDREs, the pressure criterion may capture the deflagration wave after the detonation has failed.
In this study, the goal is to minimize extracting deflagrations and identify detonation failure, so a different approach denoted the Mach criterion is taken. The Mach criterion uses the supersonic definition of a detonation [48]. For each respective detonation wave, the local Mach number (M) for the mixture is calculated. Then, the Mach criterion is applied, where the flow behind the detonation front M 1 corresponds to the detonation region [9,49]. Such methodology is commonly performed for coordinate transformations into the detonation (or shock) frame of reference. As such, this is not a novel development but merely an application for tracking detonation waves in RDREs. Then, the detonation regions are extracted from the annulus. The remaining regions in the annulus correspond to the non-detonation/deflagration regions (No Det.).
A calorically perfect gas is assumed, where the local speed of sound (a) and Mach number for each relative detonation’s reference frame (M) are calculated as follows:
M = V U w v a
where V is the flow-field velocity, and U w v is the wave speed for each respective detonation. The ratio of specific heats for each mixture region is calculated using the species associated with the FFCMy-12 chemical mechanism. If a detonation is quasi-steady, then an average wave speed is used ( U ¯ w v ). Using an average wave speed is a sufficient assumption due to the change in wave speeds, and the interaction of quasi-steady waves is negligible compared to the unsteady waves during a DMT. However, for unsteady waves, such as those undergoing significant wave interactions, the wave speed is re-calculated every 10 μ s. These updates to wave speeds are required to analyze the transient behavior during a wave interaction or modal transition.
An example of the Mach criterion process is illustrated in Figure 7. In Figure 7a, a subsection of the RDRE annulus is shown, where the bottom faces the injection plane, and the top faces towards the exit plane. In Figure 7b, the Mach criterion is applied, and three detonation wave pressure regions are extracted from the annulus. The green wedges are the tracked regions upstream of each relative detonation, and will be discussed later in this section.
With the detonations tracked, the goal is to identify detonation failure for the DMT. Bennewitz et al. showed using NASA’s Chemical Equilibrium with Applications (CEA) [50] for methane-oxygen reactions at RDRE run conditions, a detonation wave speed of greater than or equal to 54% of Chapman-Jouguet (CJ) velocity corresponds to a detonation [13]. Their calculation resulted in a U C J of ∼2548 m/s, corresponding to a sound speed (54% CJ speed) of approximately 1376 m/s. Thus, wave speed is included as an additional criterion for determining detonation wave failure.
The pressure, wave speed and Mach criteria are combined to capture detonation wave failure. If the detonation wave pressure is less than or equal to the No Det. pressure, and if the wave speed is less than the local speed of sound (54% CJ speed), then the detonation has failed, and the respective failure time is recorded. Using pressure and wave speed in combination buffers oscillatory behavior in the event the detonation briefly decreases below the sound speed, only to increase again above the sound speed via DDT. An example of a mode where a brief DMT, followed by a DDT occurs, is an RDRE counter-propagating mode. However, brief DMTs are beyond the scope of this study, since the focus is on sustained, operational DMTs in RDREs.
We shift our attention to investigating the chemical and physical properties that drive detonation dynamics by tracking the region just upstream of each detonation. Upstream of each detonation, a volumetric wedge that extends 1 cm above the injection plane is extracted in time during post-processing. Figure 7b shows an example of the extracted upstream regions in green. Detonations are not classically shaped during DMTs. The axial height of 1 cm is chosen to prevent extracting the forward leaning, curved shock front of the detonation that occurs approximately above 1 cm. This curved shock front is more prevalent in weaker and unsteady detonations. Since 3D detonation fronts in RDREs are rarely straight or even linear (i.e., forward leaning), a buffer region ∼ 1 between the shock front and the upstream region is added to avoid inadvertently capturing the detonation shock front or post-detonation regions [51].

3. Results

3.1. Numerical Validation—Experimental Comparison

In this section, experimental to numerical data are compared during a DMT to provide validation of the simulation results. Figure 8 and Figure 9 show detonation surface plots of experimental and numerical data during their respective DMTs. Experimental data uses normalized luminescent intensity of the visible light from the RDRE combustion gases. In contrast, the simulation detonation surfaces are created by integrating chamber data, and showing pressure and heat release. In both cases, greater magnitudes correlate to greater detonation strength. The experiment and simulation differ by relative RDRE run time from the starting point of ignition but the difference in run time does not have an effect on DMT comparison. The important metric is that the DMT time scales need to be on the same order of magnitude between experiment and simulation.
In the experimental data of Figure 8, starting at 373.0 ms, there are three detonation waves, and by 373.2 ms there are two waves. In the simulation data of Figure 9 there are initially four waves at 1.530 ms past ignition, and by 1.650 ms there are three waves. The detonation surfaces show good correspondence between the experiment and the simulation during the DMT window. Both experiment and simulation have similar time scales on the order of 100 μ s to 200 μ s for the transition, both decrease by one detonation, and most importantly, it is the trailing detonation that fails in both cases. Thus, we are analyzing the same type of DMT (i.e., trailing detonation wave failure [16]) in the simulation as found during the experimental time period. This characterization is critical, as wave tracking and detailed analysis during a modal transition require knowledge of which wave indeed fails, recovers via DDT (implying galloping behavior), does not recover or merges with another detonation.
By inspection of Figure 9, starting from 1.530 ms, the two steady waves near 45and 150are shown to not significantly interact with the two waves near 90 and 45 . Nor are there significant changes in the two steady wave slopes (indicative of wave speed changes), pressure, or heat release (according to the color bar). These two waves are quasi-steady and are referred to as steady waves S1 and S2. As such, average wave speeds are assumed for S1 and S2. Starting at 1.530 ms again, the unsteady waves near 90 and 45 are interacting due to their close proximity to one another. The wave at 90 is denoted the trailing wave (TW) and at 45 the leading wave (LW). Examining the leading wave, there is an increase in its slope and an intensifying of its pressure and heat release magnitudes, implying an increase in detonation strength. At the end of the DMT period, the leading wave has similar slope, pressure and heat release levels to the other two steady waves.
Conversely, the trailing wave pressure, heat release and corresponding slope are all decreasing. Between 1.580 ms and 1.590 ms, the trailing wave pressure and heat release significantly diminish. Continuing to follow the pressure of the trailing wave in time, it is seen that between 1.630 ms to 1.650 ms the residual pressure is no longer distinguishable from the steady wave S2 that approaches from behind. This suggests a merger or absorption event of the residual pressure disturbance and deflagration of the trailing wave.

3.2. 3D Chamber Data

Figure 10 shows pressure isocontours of the full RDRE chamber annulus during the DMT. In this figure, the bottom is the injection plane, and the top is the chamber exit. The detonation waves move in a counterclockwise direction. Each detonation is annotated in the figure as: steady wave 1 (S1), steady wave 2 (S2), trailing wave (TW), and leading wave (LW).
At 1.530 ms (Figure 10a), the beginning of the DMT, there are four detonation waves. The leading wave is weaker (indicative by a smaller pressure isocontour), and is approached by the stronger trailing wave. By the end of the DMT at 1.650 ms (Figure 10b), the remaining three waves have similar pressures (i.e., strengths), and are separated by approximately 120.

3.3. Unwrapped Chamber Data and Pressure Disturbances

Figure 11, shows an unwrapped 2D projection of the RDRE centerline using spatial pressure gradients. The detonations move from right to left, upon reaching the left-most side, the detonations wrap around to the right-most side. Figure 11 starts at 1.530 ms, and progresses to 1.650 ms with each wave annotated in time. Between the detonations, the pressure gradients show the triangular propellant fill-zone created by the discrete injectors.
Focusing on the interacting, detonation waves (LW and TW), it is observed that the oblique shock structure and size of the pressure gradients behind the waves change in time. At first, the leading wave oblique shock are warped and shorter than the oblique shocks of the other waves. Eventually, the leading wave oblique shock develops into a similar structure to the steady waves. In contrast, the trailing wave degenerates to only a pressure disturbance that is absorbed from behind by steady wave S2.
There are non-detonation pressure waves throughout the chamber too. This result is consistent with Ross et al., who showed the existence of low amplitude pressure waves spread throughout RDRE chambers [52]. The high amplitude local pressure gradients are manifested from the detonations, and the low amplitude pressure gradients are from pressure disturbances reflecting off of the injection plane. These pressure disturbances travel in the opposite direction (left to right) relative to the detonations (right to left). Anand et al. also postulated relationships among instabilities/disturbances and the detonation waves that lead to modal transitions and other types of instabilities observed in RDEs [15].
Subsequently, the pressure disturbances will collide with a downstream detonation front or its oblique shock. The collisions between detonations and pressure disturbances are another form of wave interaction, and potentially modulate the detonation behavior in a form of inter-detonation communication [53]. DMTs are also influenced by the flow-fields upstream of each relative detonation. In the upstream flow-field (i.e., respective reactant fill-zones), perturbations from pressure disturbances or expansion waves are suggested to affect reaction rates, increase detonation front curvature [49], lower detonation wave speeds, induce detonation failures or even stymie DDT processes for failed detonations [51]. Lastly, if counter-propagating pressure disturbances collide with detonations, or couple with deflagrations to cause brief, fast deflagrations or detonations, the number of detonations can increase, inducing an ascending modal transition (AMT) [13].

4. Analysis

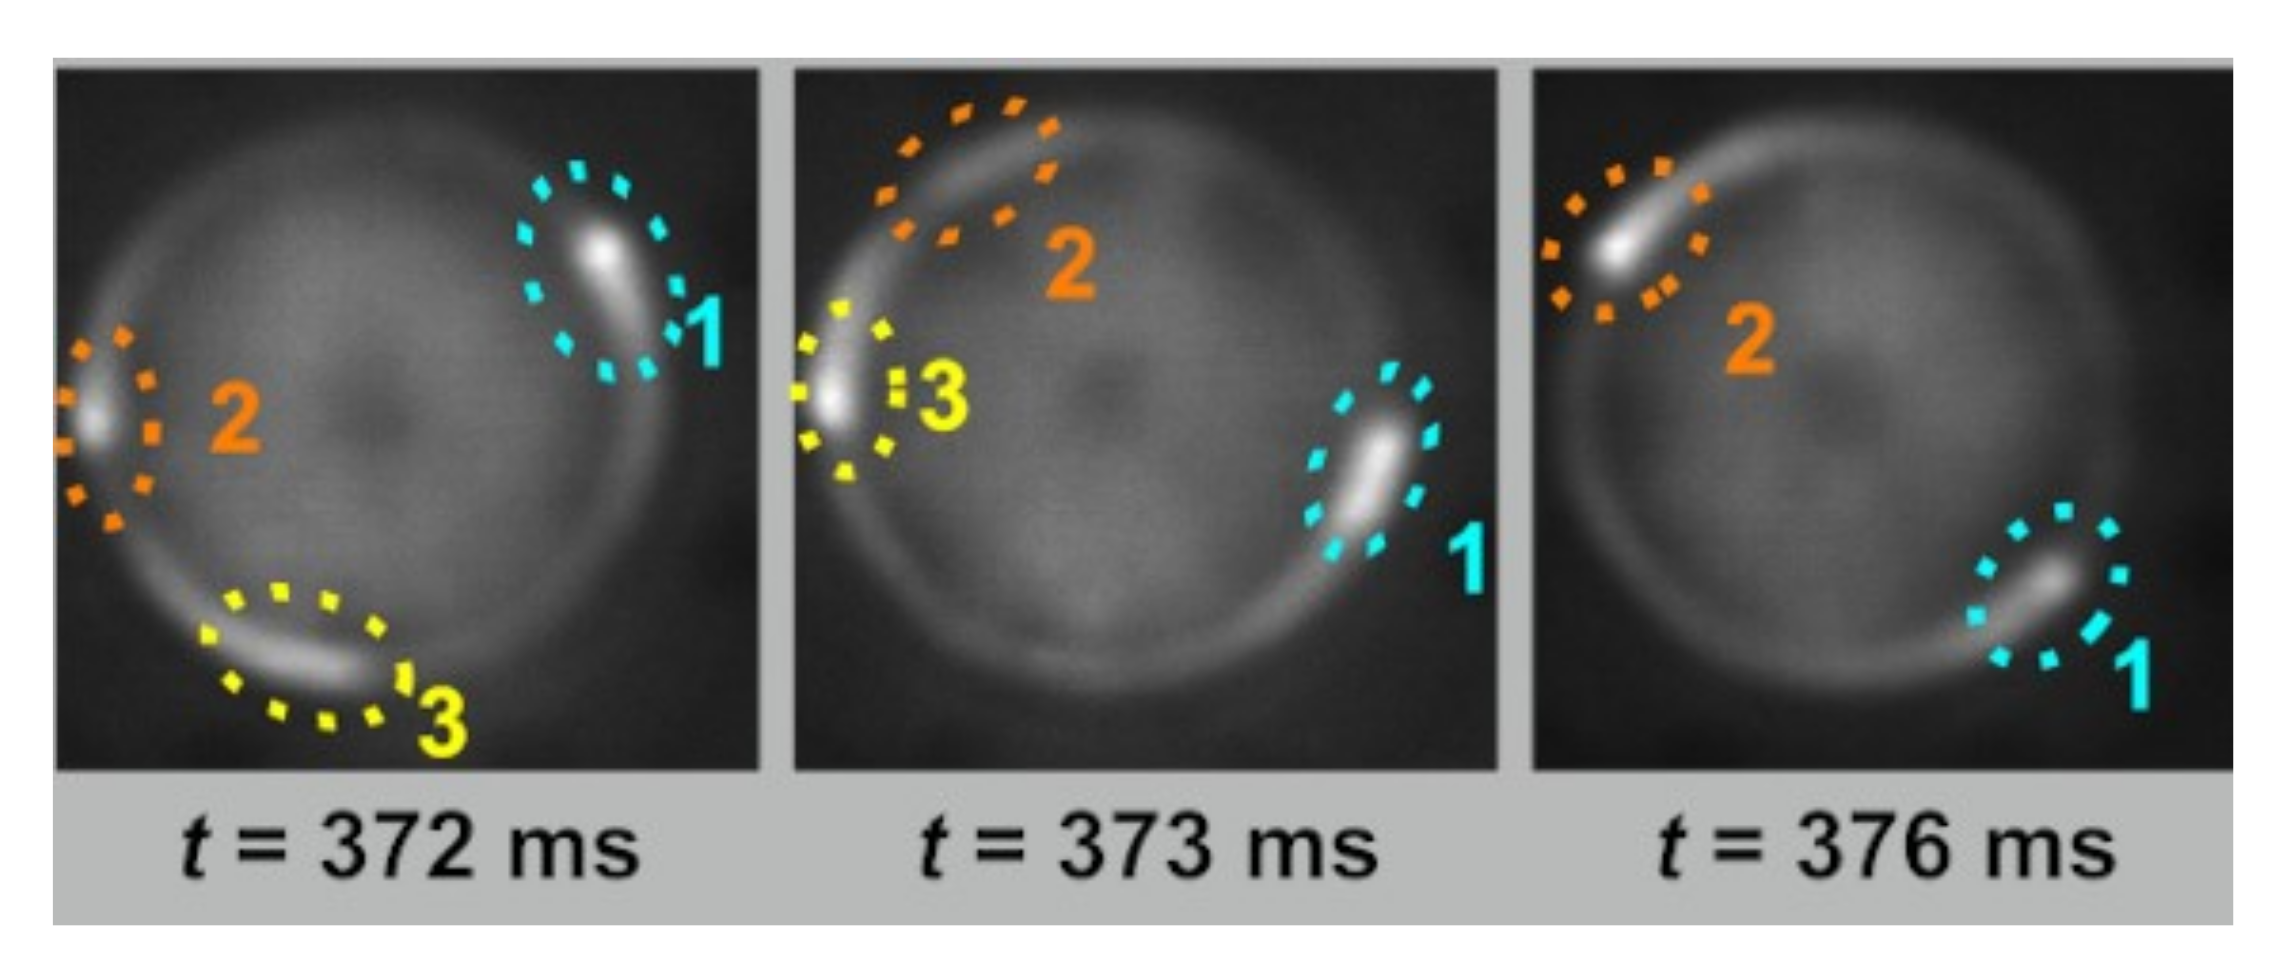
4.1. Detonation Wave Trajectories

In this section, the simulation results are analyzed to provide insight into the DMT process. Figure 12 illustrates the detonation wave trajectories during the DMT. The steady waves are modeled using linear curve fits for their angular positions. A linear fit is acceptable since the overall steady wave speed variations and wave interactions are negligible, during the DMT time frame, as shown in the detonation surface plots (Figure 9). The focus is on the trailing and leading detonation waves, since their interactions and trailing wave failure dictate the DMT. Due to the interactions and changing wave speeds, a cubic spline fit in time is performed on time sampled angular positions. As a result, from the data time samples extracted in 0.5 increments, and the curve-fits, the angular positions are within ± 1.3 to 2.3 as shown. The angular positions correspond to the maximum pressure of the leading and trailing wave fronts. Maximum pressure is determined by inspection of the detonation surface data for the respective waves. The result is a figure similar to that of the detonation surface plots following the maximum magnitude of each wave. The naming convention for each wave is the same, except the trailing wave is identified as Detonation (Det.) or Residual (Res.).
The trailing detonation wave (denoted Trail Wave Det. (TW)) decreases its angular separation from the leading wave, with the smallest separation between waves occurring near 1.550 ms. The trailing detonation failure wave time at 1.582 ms is annotated with an ‘x’. The detonation failure time is determined by analyzing the trailing wave pressure and wave speed as described in Section 2.5. After failure, the angular position of the trailing wave residual maximum pressure (denoted Trail Wave Res. (TW)) is tracked using the detonation surface plot data. A dashed line illustrates the failed trailing wave trajectory. There is a rapid decrease in the slope of the trailing wave, as it is approached from behind by steady wave S2. Just past 1.630 ms, denoted by a circle, the steady wave and the trailing wave merge. The time scale associated from failure to merger is on the order of 0.05 ms. Since DDT in this RDRE is on the order of 0.25 ms, there is not enough time for the trailing wave to recover before merging. Regarding the leading wave, an upward slope or bend in the curve-fit is present, and implies an increase in wave speed.
The fate of trailing wave after merging is not fully understood. It is postulated that the residual trailing wave pressure may simply become fully merged with the steady wave, as such, the trailing wave ceases to exist [13]. Another possibility is that the residual trailing wave passes through the steady wave, and continues to propagate as a pressure disturbance. The cause of the discrepancy is due to the residual trailing deflagration being indistinguishable from the deflagration spread throughout the chamber. Once the residual pressure merges with another detonation, it cannot be distinguished from the other pressure disturbances downstream of the detonation as shown in Figure 11.
Wave speed is shown in Figure 13, and is calculated by numerically differentiating the angular position data. As expected, the trailing wave slows down, and the leading wave speeds up. After failure, the trailing wave continues to slow until it merges with steady wave S2. The leading wave speed approaches the steady wave speeds near the end of the DMT.
The angular separations of Steady 1, leading and trailing waves, relative to the angular position of steady wave S2 are shown in Figure 14. The trailing wave has a close approach to the leading wave, followed by the trailing wave failure. Afterwards, the trailing wave approaches zero angular separation denoting its merger with steady wave S2. This result is consistent with experimental angular separation tracking of detonations during a DMT [13]. Finally, the angular separation among the leading and steady wave approaches 120, which is expected for an RDRE, 3 wave steady-state mode.

4.2. Detonation Wave Dynamics

As described in the materials and methods Section 2.5, local detonation and relative upstream data is extracted, and the results shown in this section. Respective spatial average pressures and heat releases for each detonation wave, the chamber annulus between the injection plane and 2 cm in height (denoted Annulus), and the regions that are not detonations (denoted No Det.), are compared in Figure 15. Recall, the No Det. region consists of deflagration and unburned reactants. Annulus data corresponds to the average value at each instance in time, and is a combination of all flow-field/combustion characteristics (i.e., detonation waves, deflagration, and unburned reactants). Both steady waves, S1 and S2, show overall, similar pressure and heat release magnitudes. Thus, we shift our focus to the interacting waves.
The leading wave shows an overall trend of increasing pressure and heat release until matching similar levels to the steady waves. This trend implies greater pressure and heat release coupling, and more energy to strengthen propagation of the leading wave. The trailing wave undergoes two phases of declining pressure and heat release. Between 1.530 ms to 1.560 ms, there are moderate amplitudes of an oscillatory decline in pressure and heat release. Next, starting from 1.560 ms and onward, there is a near monotonic decrease in trailing wave pressure, and significant damping of the heat release oscillations. Near 1.570 ms, there is an approximately monotonic decline in heat release as well.
A consequence of the decline in heat release is the inability to generate the necessary force for its propagation. In that, the detonation heat release is a product of the rapid combustion taking place in the reaction zone that drives the temperature to rise and the pressure/density to fall behind the wave front. The expansion accelerates the gases in the opposite direction, providing the driving force for the detonation wave front to propagate [49]. Further, between 1.54 ms and 1.56 ms the trailing wave is approximately 16 mm behind the leading wave. This corresponds to a distance between the leading and trailing waves as roughly 6 to 13 detonation cell sizes. As such, this close angular separation may significantly impact the trailing detonation propagation in the RDRE. As the trailing wave slows down, its detonation cell sizes enlarge and become less uniform as its wave front curvature increases as was shown in Section 3.3. These behaviors are potential indicators of impending detonation failure [49].
Then, at 1.582 ms (denoted with an ‘x’), the trailing wave pressure is less than or equal to the No Det. region, and its corresponding wave speed is less than 54% of the CJ velocity (local sound speed). As a result, the trailing wave detonation has failed. The rapid decline of heat release suggests an insufficient energy source necessary to drive the trailing wave, thus its failure.

4.3. Upstream Regions

In this section, the regions just upstream of each respective detonation wave are discussed. The purpose is to investigate the dynamics driving the results shown in the previous sections. Since the trailing detonation fails at 1.582 ms, the time range during the failure interaction (1.530 ms to 1.590 ms) is the focus of the results in this section shown in Figure 16. The time of trailing wave failure is again marked with an ‘x’.
Figure 16a shows the mass fraction of total products upstream of each detonation wave in time. A similar trend occurs, the steady waves have comparable levels of products ahead of them, implying, there are similar amounts of fuel and oxidizer available for combustion. The leading wave also encounters a similar amount of products/reactants as the steady waves, and corroborates the leading wave rising in pressure, heat release, and speed.
Conversely, the trailing wave encounters greater product mass fractions, implying less available fuel and oxidizer for combustion. As the trailing wave continues to move closer to the leading wave, the concentration of products upstream of the trailing wave continues to rise, hence the jump during 1.550 ms to 1.560 ms. The reason for the total product mass fraction increase is due to the leading wave is consuming its available reactants in a combination of detonation and post-detonation (deflagrative) burning. Moreover, the choked injectors upstream of the trailing wave cannot compensate fast enough to alleviate the lack of reactants within the fill-zone. The monotonic decreases in pressure and heat release of the trailing wave shown in Section 4.2 are directly caused by the insufficient amounts of reactants. In other words, the trailing wave is caught in the wake of the leading wave, and the trailing wave is not receiving enough mixed fuel and oxidizer to sustain itself. Hence, an RDRE analog to Kuznetsov et al. for the decay, failure, and non-recovery of the trailing detonation wave in a gaseous mixture [54].
The remaining parameters of upstream temperature and pressure in Figure 16b,c respectively, follow similar trends to the upstream total product mass fractions. The temperature and pressure are overall greater in front of the trailing wave compared to upstream of the other waves. This produces a greater speed of sound that decreases the relative Mach number of the trailing wave, and stymies its reinitiation. The higher temperature and pressure upstream of the trailing wave are also due to the post-detonation combustion (i.e., parasitic deflagration) of the leading wave. Subsequently, a hostile environment exists to sustain or provide an opportunity for reinitiation via DDT of the trailing wave. Upstream flow-field parameters drive the decline in pressure and heat release and, ultimately, the failure and non-recovery of the trailing wave. Thus, the DMT from four to three detonation waves.
Figure 17 highlights the disparity between the trailing and leading waves. The total products upstream flow-field relative to each detonation are displayed with dashed lines corresponding to the plot left axis, and the local detonation pressures with solid lines corresponding to the plot right axis. Consider the pressure curves of each detonation wave first. Between approximately 1.550 ms and 1.565 ms, there is an intersection and swapping in magnitude of the pressure curves for each wave. Next, for the trailing wave, the inflection point from oscillatory decay to monotonic pressure decrease, coincides with right after the sharp increase in relative upstream products. Between 1.550 ms and 1.560 ms the trailing and leading waves are at their closest relative separation per Figure 12. The average total products upstream of the trailing wave from 1.560 ms onward, do not decrease back to levels prior to 1.550 ms. This result shows that insufficient reactants, on the order of only 25%, are driving the pressure decrease and detonation failure of the trailing wave. In contrast, for most of the DMT time frame, the leading wave encounters nearly twice the amount of reactants compared to the trailing wave.

4.4. Wave Stability

A theoretical detonation wave stability criterion was developed by Wolanski to determine the number of sustained waves in an RDE [55]. The Wolanski wave stability criterion is shown in Equation (2), where: W is the number of detonation waves, V ˙ is the volumetric flow rate of the injected reactants, w is the annulus channel width, l c r is the critical reactant mixing height, and U w v is the wave speed.
W = 2 V ˙ w l c r U w v .
As analyzed similarly in Bennewitz et al., l c r is calculated with the assumption to sustain four detonation waves [13]. According to the Wolanski criterion, the fill-zone height of mixed reactants must be greater than or equal to l c r , otherwise, the detonation becomes unstable. A growing l c r indicates that the reactant fill-zone height must increase as well in order to sustain a specified number of detonations. As shown in Figure 18, l c r is determined as a function of wave speed from the curve-fit data shown earlier in Figure 13 for each detonation wave. Since the trailing wave is slowing down and the leading wave is speeding up during the interaction, these results show the general trend that l c r is inversely proportional to wave speed.
The last intersection or swapping of l c r magnitudes for the trailing and leading waves occurs between 1.550 ms to 1.560 ms. Both the l c r and pressure intersection from Figure 17 are in good agreement, with a time scale on the order of about 10 μ s. The time scale consistency corroborates the relationship between the l c r calculations, and the decay/strengthening of the trailing and leading waves respectively. By the time of trailing wave failure, l c r is nearly double that of the steady waves. Calculating beyond the failure time, l c r increases, to nearly five times the l c r of the steady waves.
There is an overall exponential increase of l c r as the trailing wave speed decreases. This result is in agreement with detonation failure of the trailing wave caused by insufficient availability of upstream reactants. Note, the result is intended to show a limiting case as to a necessary quantity of fill-zone height trends. This calculation is not a sufficient condition for describing deflagrations or DDT beyond the trailing wave failure time. Furthermore, reactant mixing length scales are not considered in Equation (2).
Conversely, the leading wave l c r asymptotically approaches the steady wave l c r values. The overall decrease in l c r coupled with plenty of upstream reactants, describes how the leading wave continues to unrestrictedly propagate. Therefore, the Wolanski wave stability criterion provides a good approximation when conducting theoretical calculations for sustaining or decaying detonations in an RDRE during a trailing wave failure type of DMT.

5. Conclusions

The dynamics of detonation waves were studied during a trailing wave failure type of DMT in a gaseous methane-oxygen RDRE. The DMT time frame observed in the simulation is on the same order as experimental observations. Detonation wave failure corresponds to a decoupling of heat release from the pressure wave and delineates the time of DMT. The detonation failure is defined as the time when the trailing wave pressure decreases to less than or equal to RDRE chamber deflagration pressures and when its wave speed becomes subsonic. Wave failure is followed by the merging of the residual trailing wave pressure disturbance with a consecutive steady detonation wave. It is shown that the time scale from trailing wave failure to merger is less than the time required for DDT, therefore, there is not enough time for the trailing wave to recover via DDT. From the simulation data, we determine that the trailing wave fails due to a non-conducive upstream environment: insufficient combustion reactants, large proportion of combustion products, accompanied by high upstream temperature and pressure. These conditions upstream of the trailing wave within the DMT are insufficient to sustain the coupled detonation pressure and heat release for wave sustainment or recovery.
The DMT process passes through multiple phases driven by the transients of the interacting detonation waves. Phase (1) is a critical close approach of the faster trailing wave towards the slower leading wave. As a result, the pressure and heat release coupling of the trailing detonation wave is impacted. Phase (2) corresponds to the decay in strength of the trailing wave, culminating in its failure and non-recovery. The remaining uncoupled pressure wave slows, and will subsequently merge with the consecutive steady detonation wave without significantly affecting that detonation wave. Phase (3) is the recovery of the leading wave, as it increases to similar pressure and heat release magnitudes to the other steady waves, marking the operational end of the DMT.
The Wolanski wave stability criterion defines a critical reactant mixing height ( l c r ) that we have demonstrated to be an indicator of detonation wave viability. During the interaction of the trailing and leading waves, l c r exponentially increases for the trailing wave, whereas l c r asymptotically decreases for the leading wave. These l c r calculations are an inexpensive metric of transient wave stability in an RDRE.
As a result, l c r has additional, potential implications for RDRE data analysis and interpretation. The first is that l c r provides a measure of wave dynamical behavior during RDRE transient events. In addition, l c r asymptotically approaches an average value for detonation waves advancing toward steady wave speeds. As such, l c r serves as a progress variable toward identifying when the RDRE reaches steady-state. The second is with respect to the total number of detonation waves in RDREs. Due to constraints on propellants used, injection mass flow rates, and chamber geometry, there is a general trend observed in RDRE experiments and simulations, where, as the number of detonations increase, their respective wave speeds decrease. Additionally, as the number of detonations increase, their relative reactant fill-zone heights decrease. However, l c r trends for decreasing wave speeds require larger reactant fill heights. Therefore, the Wolanski criterion implies an upper limit on the number of sustainable detonations in an RDRE.
Modeling and simulation allow us to investigate in detail detonation wave dynamics in RDREs beyond what can be measured by experiment. The DMT phases from the simulation show direct congruence with the limited experimental observations. With the DMT simulations, we can probe the dynamics of the trailing wave decay process, demonstrating the initial close approach impacts both the leading and trailing waves, but ultimately the trailing wave fails due to ingestion of combustion products of the leading wave. Finally, the trailing wave failure is well characterized by l c r , as is the return to stability of the leading wave.

Author Contributions

Conceptualization, A.B., M.C.R., C.L. and W.A.H.J.; methodology, A.B. and C.L.; software, M.C.R. and C.L.; formal analysis, A.B. and C.L.; investigation, A.B. and C.L.; writing—original draft preparation, A.B. and W.A.H.J.; writing—review and editing, A.B., M.C.R., C.L. and W.A.H.J.; visualization, A.B., M.C.R. and C.L.; supervision, C.L. and W.A.H.J.; project administration, W.A.H.J.; funding acquisition, W.A.H.J. All authors have read and agreed to the published version of the manuscript.

Funding

This work has been supported by the Air Force Office of Scientific Research (AFOSR) under AFRL Lab Task 20RQCOR63 funded by the AFOSR Energy, Combustion, Non-Equilibrium Thermodynamics portfolio with Dr. Chiping Li as program manager. Additional support provided by the National Research Council (NRC) STFP/AFRL contract# FA9550-18-D-0002.

Institutional Review Board Statement

Not applicable.

Informed Consent Statement

Not applicable.

Data Availability Statement

Not applicable.

Acknowledgments

The authors acknowledge the Department of Defense High Performance Computing Modernization Program (DoD HPCMP) for providing high performance computing resources. This effort is part of the Combustion Stability Tool Development (CSTD), and the Space and Missile Systems Center (SMC) Virtual Injector Screening Platform (VISP) program. Special thanks to John Bennewitz and Jason Burr.

Conflicts of Interest

The authors declare no conflict of interest. The funders had no role in the design of the study; in the collection, analyses, or interpretation of data; in the writing of the manuscript, or in the decision to publish the results.

References

  1. Lu, F.K.; Braun, E.M. Rotating Detonation Wave Propulsion: Experimental Challenges, Modeling, and Engine Concepts. J. Propuls. Power 2014, 30, 1125–1142. [Google Scholar] [CrossRef] [Green Version]
  2. Bykovskii, F.A.; Zhdan, S.A.; Vedernikov, E.F. Continuous Spin Detonations. J. Propuls. Power 2006, 22, 1204–1216. [Google Scholar] [CrossRef]
  3. Wolanski, P. Detonation Engines. J. KONES Powertrain Transp. 2011, 18, 515–521. [Google Scholar]
  4. Fotia, M.L.; Hoke, J.; Schauer, F. Performance of Rotating Detonation Engines for Air Breathing Applications, 1st ed.; Springer International Publishing: Cham, Switzerland, 2018; pp. 1–21. [Google Scholar] [CrossRef]
  5. Hishida, M.; Fujiwara, T.; Wolanski, P. Fundamentals of Rotating Detonations. Shock Waves 2009, 19, 1–10. [Google Scholar] [CrossRef]
  6. Gaillard, T.; Davidenko, D.; Dupoirieux, F. Numerical simulation of a Rotating Detonation with a realistic injector designed for separate supply of gaseous hydrogen and oxygen. Acta Astronaut. 2017, 141, 64–78. [Google Scholar] [CrossRef] [Green Version]
  7. Bennewitz, J.W.; Bigler, B.R.; Schumaker, S.A.; Hargus, W.A. Automated image processing method to quantify rotating detonation wave behavior. Rev. Sci. Instrum. 2019, 90, 065106. [Google Scholar] [CrossRef] [PubMed]
  8. Lietz, C.; Ross, M.; Desai, Y.; Hargus, W.A. Numerical investigation of operational performance in a methane-oxygen rotating detonation rocket engine. In Proceedings of the AIAA Scitech 2020 Forum, Orlando, FL, USA, 6–10 January 2020. [Google Scholar] [CrossRef]
  9. Batista, A.; Ross, M.; Lietz, C.; Hargus, W.A. Descending Modal Transition Study in a Rotating Detonation Rocket Engine. In Proceedings of the AIAA SciTech 2021 Forum, Virtual Event, 11–15 and 19–21 January 2021. [Google Scholar] [CrossRef]
  10. Suchocki, J.; Yu, S.T.; Hoke, J.; Naples, A.; Schauer, F.; Russo, R. Rotating Detonation Engine Operation. In Proceedings of the 50th AIAA Aerospace Sciences Meeting including the New Horizons Forum and Aerospace Exposition, Nashville, TN, USA, 9–12 January 2012. [Google Scholar] [CrossRef]
  11. Rankin, B.A.; Richardson, D.R.; Caswell, A.W.; Naples, A.G.; Hoke, J.L.; Schauer, F.R. Chemiluminescence imaging of an optically accessible non-premixed rotating detonation engine. Combust. Flame 2017, 176, 12–22. [Google Scholar] [CrossRef]
  12. Stechmann, D.P.; Sardeshmukh, S.; Heister, S.D.; Mikoshiba, K. Role of Ignition Delay in Rotating Detonation Engine Performance and Operability. J. Propuls. Power 2019, 35, 125–140. [Google Scholar] [CrossRef]
  13. Bennewitz, J.W.; Bigler, B.R.; Pilgram, J.J.; William, A.; Hargus, J. Modal Transitions in Rotating Detonation Rocket Engines. Int. J. Energ. Mater. Chem. Propuls. 2019, 18, 91–109. [Google Scholar] [CrossRef]
  14. Koch, J.; Kurosaka, M.; Knowlen, C.; Kutz, J.N. Mode-locked rotating detonation waves: Experiments and a model equation. Phys. Rev. E 2020, 101, 013106. [Google Scholar] [CrossRef] [PubMed] [Green Version]
  15. Anand, V.; George, A.S.; Driscoll, R.; Gutmark, E. Characterization of instabilities in a Rotating Detonation Combustor. Int. J. Hydrog. Energy 2015, 40, 16649–16659. [Google Scholar] [CrossRef]
  16. Batista, A.; Ross, M.; Lietz, C.; Hargus, W.A. Detonation Wave Interaction Classifications in a Rotating Detonation Rocket Engine. In Proceedings of the AIAA Propulsion and Energy 2020 Forum, Virtual Event, 24–28 August 2020. [Google Scholar] [CrossRef]
  17. Zhdan, S.A.; Bykovskii, F.A.; Vedernikov, E.F. Mathematical Modeling of a Rotating Detonation Wave in a Hydrogen-Oxygen Mixture. Combust. Explos. Shock Waves 2007, 43, 449–459. [Google Scholar] [CrossRef]
  18. Kim, W.W.; Menon, S. An unsteady incompressible Navier–Stokes solver for large eddy simulation of turbulent flows. Int. J. Numer. Methods Fluids 1999, 31, 983–1017. [Google Scholar] [CrossRef]
  19. Masquelet, M.; Menon, S.; Jin, Y.; Friedrich, R. Simulation of unsteady combustion in a LOX-GH2 fueled rocket engine. Aerosp. Sci. Technol. 2009, 13, 466–474. [Google Scholar] [CrossRef]
  20. Génin, F.; Menon, S. Studies of shock/turbulent shear layer interaction using Large-Eddy Simulation. Comput. Fluids 2010, 39, 800–819. [Google Scholar] [CrossRef]
  21. Masquelet, M.; Menon, S. Large-Eddy Simulation of Flame-Turbulence Interactions in a Shear Coaxial Injector. J. Propuls. Power 2010, 26, 924–935. [Google Scholar] [CrossRef]
  22. Srinivasan, S.; Ranjan, R.; Menon, S. Flame Dynamics During Combustion Instability in a High-Pressure, Shear-Coaxial Injector Combustor. Flow Turbul. Combust. 2014, 94, 237–262. [Google Scholar] [CrossRef]
  23. Gottiparthi, K.C.; Menon, S. A Study of Interaction of Clouds of Inert Particles with Detonation in Gases. Combust. Sci. Technol. 2012, 184, 406–433. [Google Scholar] [CrossRef]
  24. Yang, S.; Ranjan, R.; Yang, V.; Sun, W.; Menon, S. Sensitivity of predictions to chemical kinetics models in a temporally evolving turbulent non-premixed flame. Combust. Flame 2017, 183, 224–241. [Google Scholar] [CrossRef]
  25. Bennewitz, J.W.; Schumaker, S.A.; Lietz, C.F.; Kastengren, A.L. Scaling of Oxygen-Methane Reacting Coaxial Jets Using X-Ray Fluorescence to Measure Mixture Fraction. Proc. Combust. Inst. 2021, 38, 6365–6374. [Google Scholar] [CrossRef]
  26. Bigler, B.R.; Bennewitz, J.W.; Danczyk, S.A.; Hargus, W.A. Rotating Detonation Rocket Engine Operability Under Varied Pressure Drop Injection. J. Spacecraft Rockets 2020, 1–10. [Google Scholar] [CrossRef]
  27. Wang, H.; Xu, R.; Wang, K.; Bowman, C.T.; Hanson, R.K.; Davidson, D.F.; Brezinsky, K.; Egolfopoulos, F.N. A physics-based approach to modeling real-fuel combustion chemistry - I. Evidence from experiments, and thermodynamic, chemical kinetic and statistical considerations. Combust. Flame 2018, 193, 502–519. [Google Scholar] [CrossRef]
  28. Xu, R.; Wang, K.; Banerjee, S.; Shao, J.; Parise, T.; Zhu, Y.; Wang, S.; Movaghar, A.; Lee, D.J.; Zhao, R.; et al. A physics-based approach to modeling real-fuel combustion chemistry-II. Reaction kinetic models of jet and rocket fuels. Combust. Flame 2018, 193, 520–537. [Google Scholar] [CrossRef]
  29. Wilke, C.R. A Viscosity Equation for Gas Mixtures. J. Chem. Phys. 1950, 18, 517–519. [Google Scholar] [CrossRef]
  30. Kim, W.W.; Menon, S.; Mongia, H.C. Large-Eddy Simulation of a Gas Turbine Combustor Flow. Combust. Sci. Technol. 1999, 143, 25–62. [Google Scholar] [CrossRef]
  31. Lietz, C.; Schumaker, S.A.; Sankaran, V. Examination of detailed methane/oxygen kinetics in the context of detonation simulations. In Proceedings of the 11th U.S. National Combustion Meeting Organized by the Western States Section of the Combustion Institute, Pasadena, CA, USA, 24–27 March 2019. [Google Scholar]
  32. Smith, R.D.; Stanley, S.B. Experimental Investigation of Rotating Detonation Rocket Engines for Space Propulsion. J. Propuls. Power 2021, 37, 463–473. [Google Scholar] [CrossRef]
  33. Bigler, B.R.; Bennewitz, J.W.; Schumaker, S.A.; Danczyk, S.A.; Hargus, W.A. Injector Alignment Study for Variable Mixing in Rotating Detonation Rocket Engines. In Proceedings of the AIAA Scitech 2019 Forum, San Diego, CA, USA, 7–11 January 2019. [Google Scholar] [CrossRef]
  34. Schumaker, S.A.; Knisely, A.M.; Hoke, J.L.; Rein, K.D. Methane–oxygen detonation characteristics at elevated pre-detonation pressures. Proc. Combust. Inst. 2021, 38, 3623–3632. [Google Scholar] [CrossRef]
  35. Powers, J.M.; Paolucci, S. Accurate Spatial Resolution Estimates for Reactive Supersonic Flow with Detailed Chemistry. AIAA J. 2005, 43, 1088–1099. [Google Scholar] [CrossRef]
  36. Powers, J.M. Review of Multiscale Modeling of Detonation. J. Propuls. Power 2006, 22, 1217–1229. [Google Scholar] [CrossRef]
  37. Schwer, D.; Kailasanath, K. Fluid Dynamics of Rotating Detonation Engines with Hydrogen and Hydrocarbon Fuels. Proc. Combust. Inst. 2013, 34, 1991–1998. [Google Scholar] [CrossRef]
  38. Ross, M.; Lietz, C.; Desai, Y.; Hamilton, J.; Hargus, W. Investigation into the Impact of an Exit Constriction on Rotating Detonation Rocket Engines, Using Large Eddy Simulations; Technical Report AD1108842; Air Force Research Laboratory: Edwards, CA, USA, 2019. [Google Scholar]
  39. Pal, P.; Xu, C.; Kumar, G.; Drennan, S.A.; Rankin, B.A.; Som, S. Large-Eddy Simulation of Ethylene/Air Combustion in a Non-Premixed Rotating Detonation Engine. In Proceedings of the AIAA Propulsion and Energy 2020 Forum, Virtual Event, 24–28 August 2020. [Google Scholar] [CrossRef]
  40. Prakash, S.; Raman, V.; Lietz, C.; Hargus, W.; Schumaker, S. Numerical simulation of a methane-oxygen rotating detonation rocket engine. Proc. Combust. Inst. 2020. [Google Scholar] [CrossRef]
  41. Prakash, S.; Fiévet, R.; Raman, V.; Burr, J.; Yu, K.H. Analysis of the Detonation Wave Structure in a Linearized Rotating Detonation Engine. AIAA J. 2020, 58, 5063–5077. [Google Scholar] [CrossRef]
  42. Ahrens, J.; Geveci, B.; Law, C. 36—ParaView: An End-User Tool for Large-Data Visualization, 1st ed.; Elsevier Butterworth-Heinemann: Burlington, MA, USA, 2005; pp. 717–731. [Google Scholar] [CrossRef]
  43. Kaemming, T.A.; Fotia, M.; Hoke, J.; Schauer, F. Thermodynamic Modeling of a Rotating Detonation Engine Through a Reduced Order Approach. J. Propuls. Power 2017, 33, 1170–1178. [Google Scholar] [CrossRef]
  44. Subramanian, S.; Meadows, J. Novel Approach for Computational Modeling of a Non-Premixed Rotating Detonation Engine. J. Propuls. Power 2020, 36, 617–631. [Google Scholar] [CrossRef]
  45. Cocks, P.A.; Holley, A.T.; Rankin, B.A. High Fidelity Simulations of a Non-Premixed Rotating Detonation Engine. In Proceedings of the 54th AIAA Aerospace Sciences Meeting, San Diego, CA, USA, 4–8 January 2016. [Google Scholar] [CrossRef]
  46. Chacon, F.; Gamba, M. Study of Parasitic Combustion in an Optically Accessible Continuous Wave Rotating Detonation Engine. In Proceedings of the AIAA Scitech 2019 Forum, San Diego, CA, USA, 7–11 January 2019. [Google Scholar] [CrossRef]
  47. Bigler, B.R.; Bennewitz, J.W.; Danczyk, S.A.; Hargus, W.A. Global Performance Effects of Mode Transitions in a Rotating Detonation Rocket Engine. In Proceedings of the AIAA Propulsion and Energy 2020 Forum, Virtual Event, 24–28 August 2020. [Google Scholar] [CrossRef]
  48. Turns, S.R. An Introduction to Combustion: Concepts and Applications, 3rd ed.; McGraw-Hill Higher Education: Boston, MA, USA, 2012; pp. 616–618. [Google Scholar]
  49. Lee, J.H.S. The Detonation Phenomenon, 1st ed.; Cambridge University Press: Cambridge, NY, USA, 2008. [Google Scholar] [CrossRef]
  50. Gordon, S.; McBride, B.J. Computer Program for Calculation of Complex Chemical Equilibrium Compositions and Applications; Technical Report; National Aeronautics and Space Administration; Lewis Research Center: Cleveland, OH, USA, 1994. [Google Scholar]
  51. Fievisohn, R.T.; Yu, K.H. Steady-State Analysis of Rotating Detonation Engine Flowfields with the Method of Characteristics. J. Propuls. Power 2017, 33, 89–99. [Google Scholar] [CrossRef]
  52. Ross, M.; Lietz, C.; Desai, Y.; Hamilton, J.; Hargus, W.A. Constriction-Induced Counter-Propagating Behavior in RDREs. In Proceedings of the AIAA Propulsion and Energy 2020 Forum, Virtual Event, 24–28 August 2020. [Google Scholar] [CrossRef]
  53. Ng, H.D.; Botros, B.B.; Chao, J.; Yang, J.M.; Nikiforakis, N.; Lee, J.H.S. Head-on Collision of a Detonation with a Planar Shock Wave. Shock Waves 2006, 15, 341–352. [Google Scholar] [CrossRef]
  54. Kuznetsov, M.; Alekseev, V.I.; Dorofeev, S.B.; Matsukov, I.; Boccio, J.I. Detonation Propagation, Decay, and Reinitiation in Nonuniform Gaseous Mixtures. In Twenty-Seventh Symposium (International) on Combustion; Elsevier: Boulder, CO, USA, 1998; Volume 27, pp. 2241–2247. [Google Scholar] [CrossRef]
  55. Wolanski, P. Rotating Detonation Wave Stability. In Proceedings of the 23rd International Colloquium for Dynamics of Explosions and Reactive Systems, Irvine, CA, USA, 24–29 July 2011. [Google Scholar]
Figure 1. Chamber sketch illustrating common RDRE flow-field components.
Energies 14 03387 g001
Figure 2. Experimental observations of RDRE exit plane during a three to two detonation DMT. The wave interaction is a trailing detonation wave failure mode seen between 372 ms to 376 ms [13].
Energies 14 03387 g002
Figure 3. 1D detonation tube grid res. (a) WD, (b) GRI 3.0, (c) FFCMy-12, and (d) FFCM-1 [31].
Energies 14 03387 g003
Figure 4. One dimensional detonation tube pressure and temperature at 0.01 mm WD, GRI 3.0, FFCMy-12 and FFCM-1 [31].
Energies 14 03387 g004
Figure 5. RDRE sector simulations CTAP pressures using chemical mechanisms: WD, FFCMy-12 and FFCM-1 [31].
Energies 14 03387 g005
Figure 6. (a) Geometry cross-section of the RDRE used in the numerical model, (b) isometric view, and (c) top view of conceptual injector model [8,33].
Energies 14 03387 g006
Figure 7. (a) Example RDRE annulus showing pressure of each wave at steady state, (b) extracted detonation waves pressure and detonation upstream regions in green.
Energies 14 03387 g007
Figure 8. Detonation surface plot showing integrated pixel intensity from experimental data of RDRE during DMT with trailing wave failure [13].
Energies 14 03387 g008
Figure 9. High time resolution simulation data of detonation surfaces during DMT focusing on the trailing wave failure time frame of interest from 1.530 ms to 1.650 ms showing pressure (a) and heat release (b).
Energies 14 03387 g009
Figure 10. 3D simulation isometric pressure contour of a four to three detonation wave DMT at approximately 1.530 ms and 1.650 ms, with annotated detonation waves: steady wave 1 (S1), steady wave 2 (S2), leading wave (LW), and trailing wave (TW).
Energies 14 03387 g010
Figure 11. Unwrapped 2D projection of the RDRE chamber centerline showing spatial pressure gradients during the four to three wave DMT from 1.530 ms to 1.650 ms.
Energies 14 03387 g011
Figure 12. Relative wave positions within ± 1.3 to 2.3 during DMT, ‘x’ denotes trailing detonation wave failure, circle denotes merger of the residual trailing wave pressure component with steady wave.
Energies 14 03387 g012
Figure 13. Trailing, leading, and steady wave speeds in time.
Energies 14 03387 g013
Figure 14. Angluar separations of Steady 1, trailing, and leading waves relative to Steady wave 2 ( ± 1.3 to 3.6 ).
Energies 14 03387 g014
Figure 15. Local integrated (a) pressure and (b) heat release divided by region volume for each respective detonation wave, non-detonation regions, and entire annulus.
Energies 14 03387 g015
Figure 16. Local integrated regions upstream of each relative detonation wave: (a) products mass fraction, (b) temperature, and (c) pressure.
Energies 14 03387 g016
Figure 17. Trailing versus leading wave upstream flow-field total products mass fraction and detonation region pressures. Products mass fraction are dashed curves correspond to the left axis, and pressure solid curves correspond to the right axis.
Energies 14 03387 g017
Figure 18. Critical axial reactant mixing height ( l c r ) via Wolanski wave stability criterion for detonation wave sustainment.
Energies 14 03387 g018
Table 1. RDRE run conditions.
m ˙ i n [kg/s]0.267
ϕ 1.15
T i n [K]300
p f u e l [MPa]2.33
p o x [MPa]2.07
p o u t [MPa]0.10
Publisher’s Note: MDPI stays neutral with regard to jurisdictional claims in published maps and institutional affiliations.

