
Evaluation of Stress and Fatigue of a Rail Vehicle Suspension Component


Abstract
:1. Introduction
- Checking the conformity of the performance with the technical requirements of manufacturing and acceptance, technical documentation and the requirements set out in the relevant national or European standards for railway vehicles, their assemblies, subassemblies and components;
- Checking the quality certificates, attestations, results of quality and technical acceptance for the assemblies, subassemblies, elements and materials used;
- Checking the quality of the surface condition;
- Measurement of the torsional (resistance) moment of the bogie for the empty wagon in the new condition and for the empty and loaded wagon after 6 months of operation;
- Measurement of liner wear (surface geometry) after completing the test run;
- Attempts to run the wagon.
2. Selection of Model Parameters
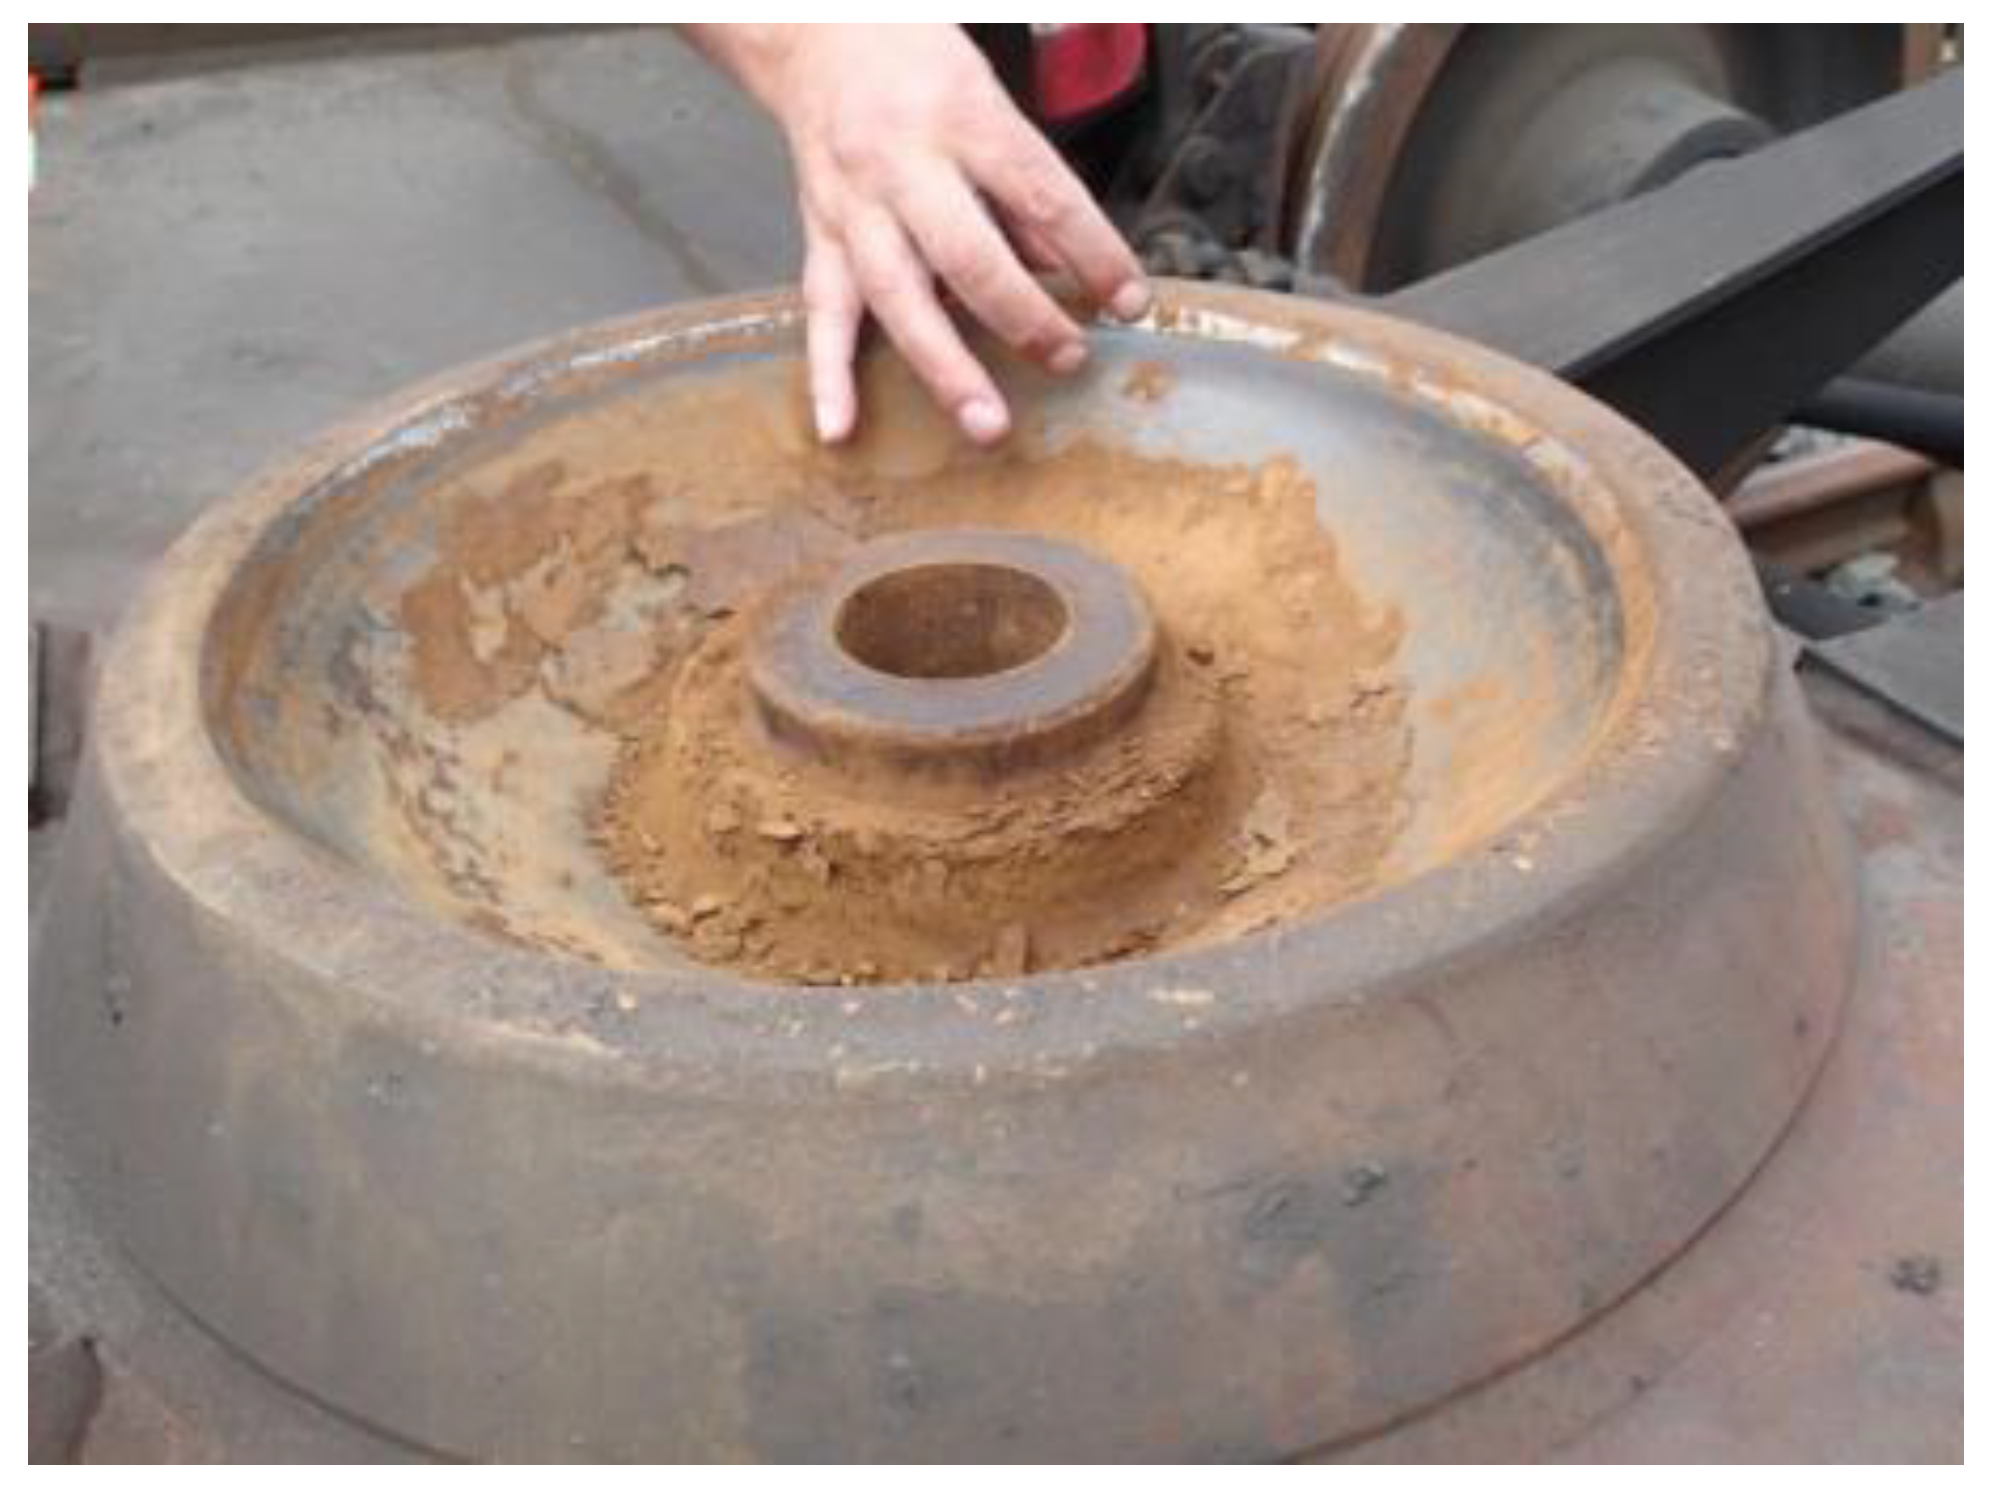
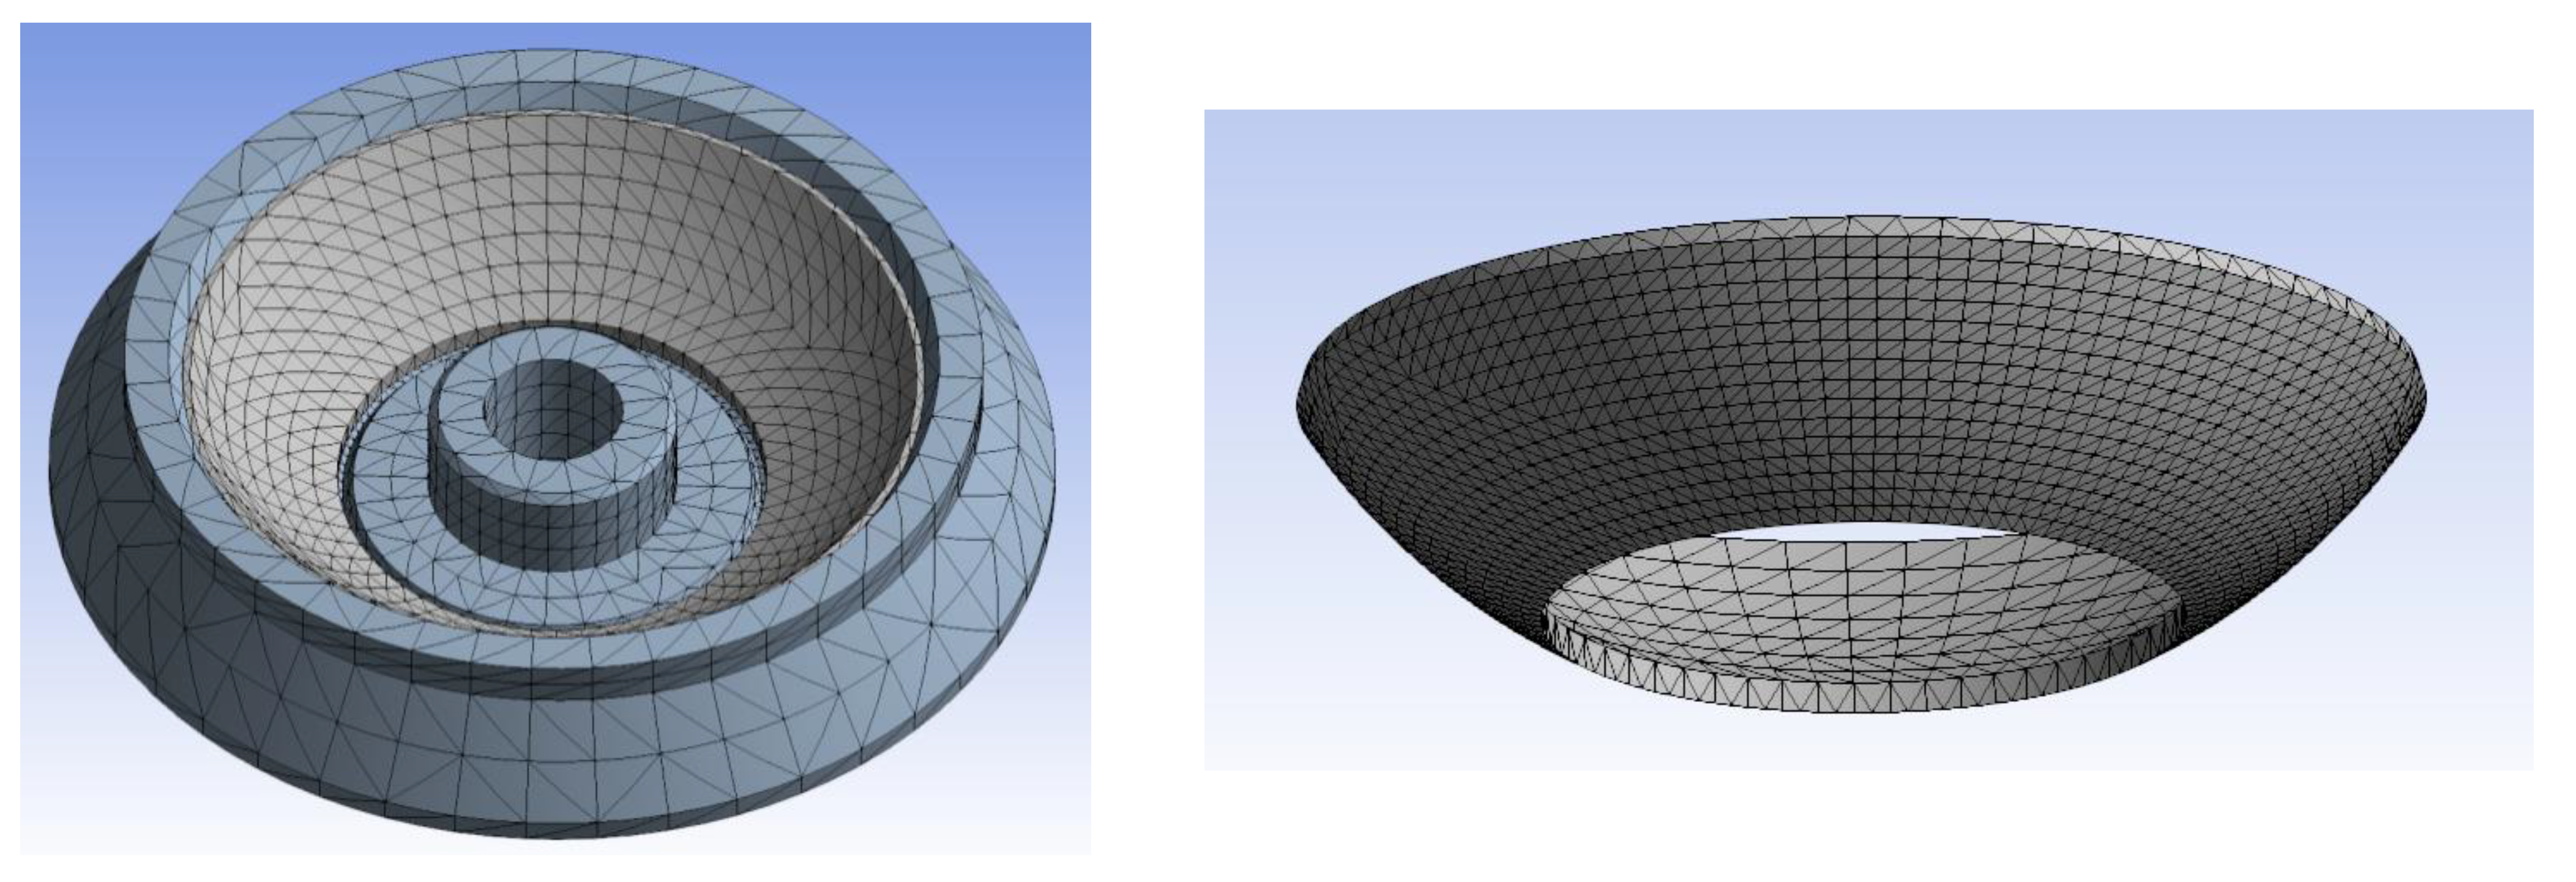
2.1. Centre Bowl Materials and Modeling
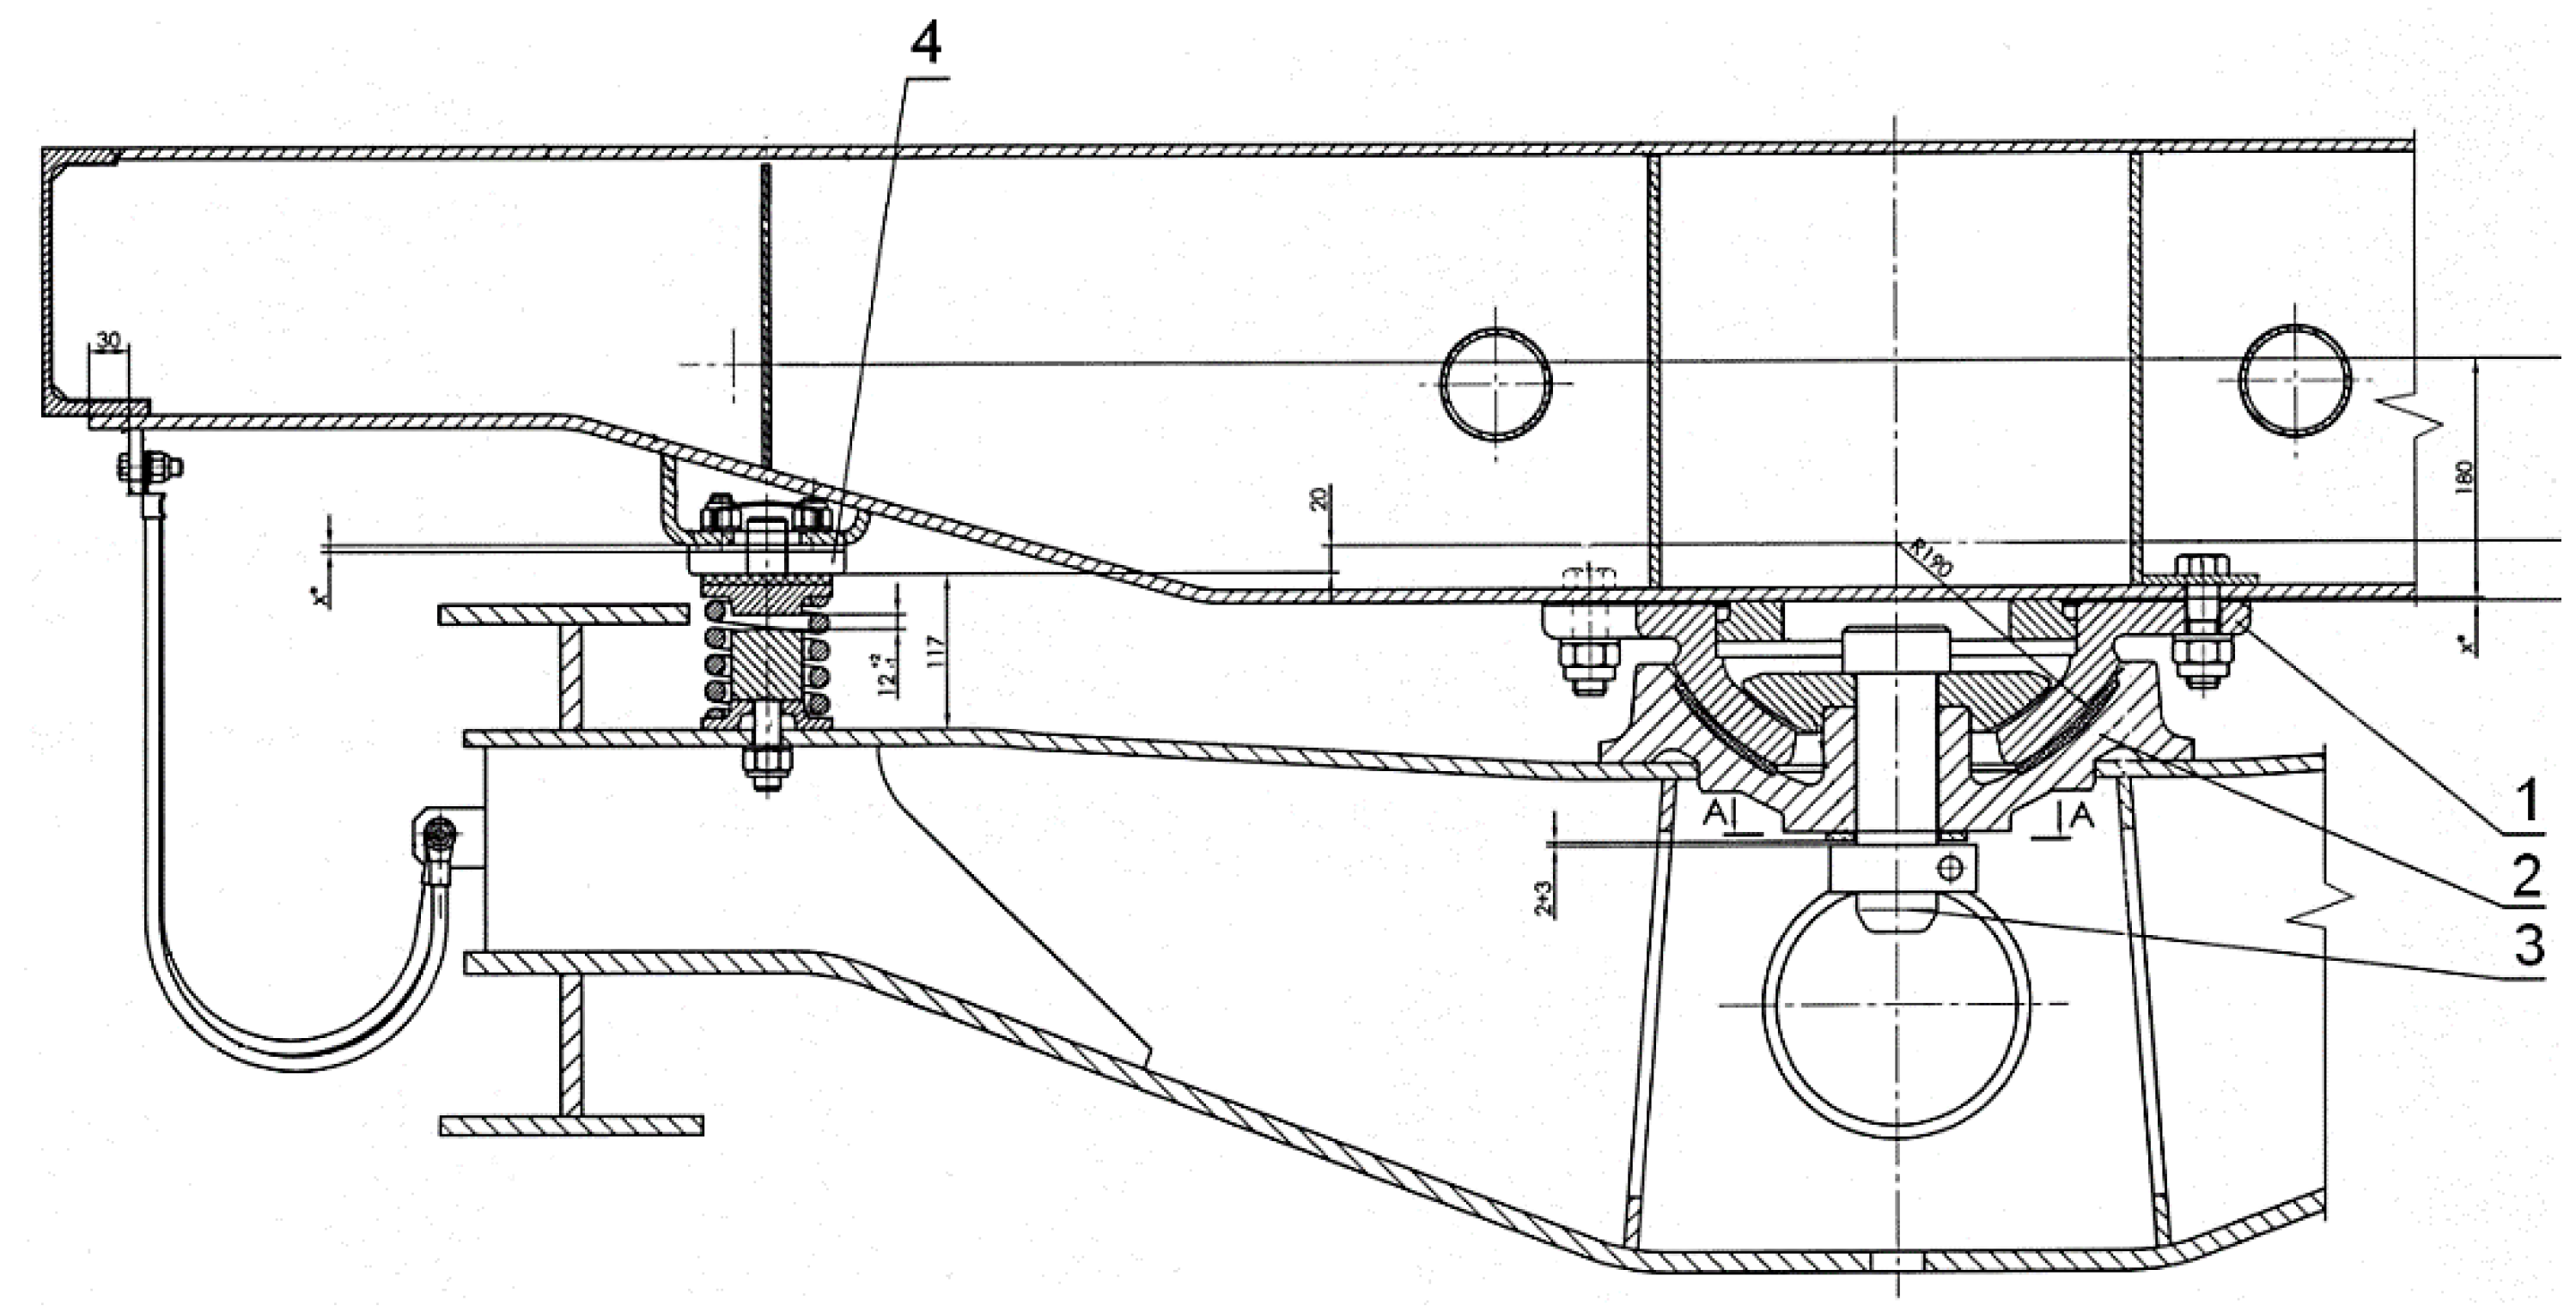
2.2. Vehicle Model
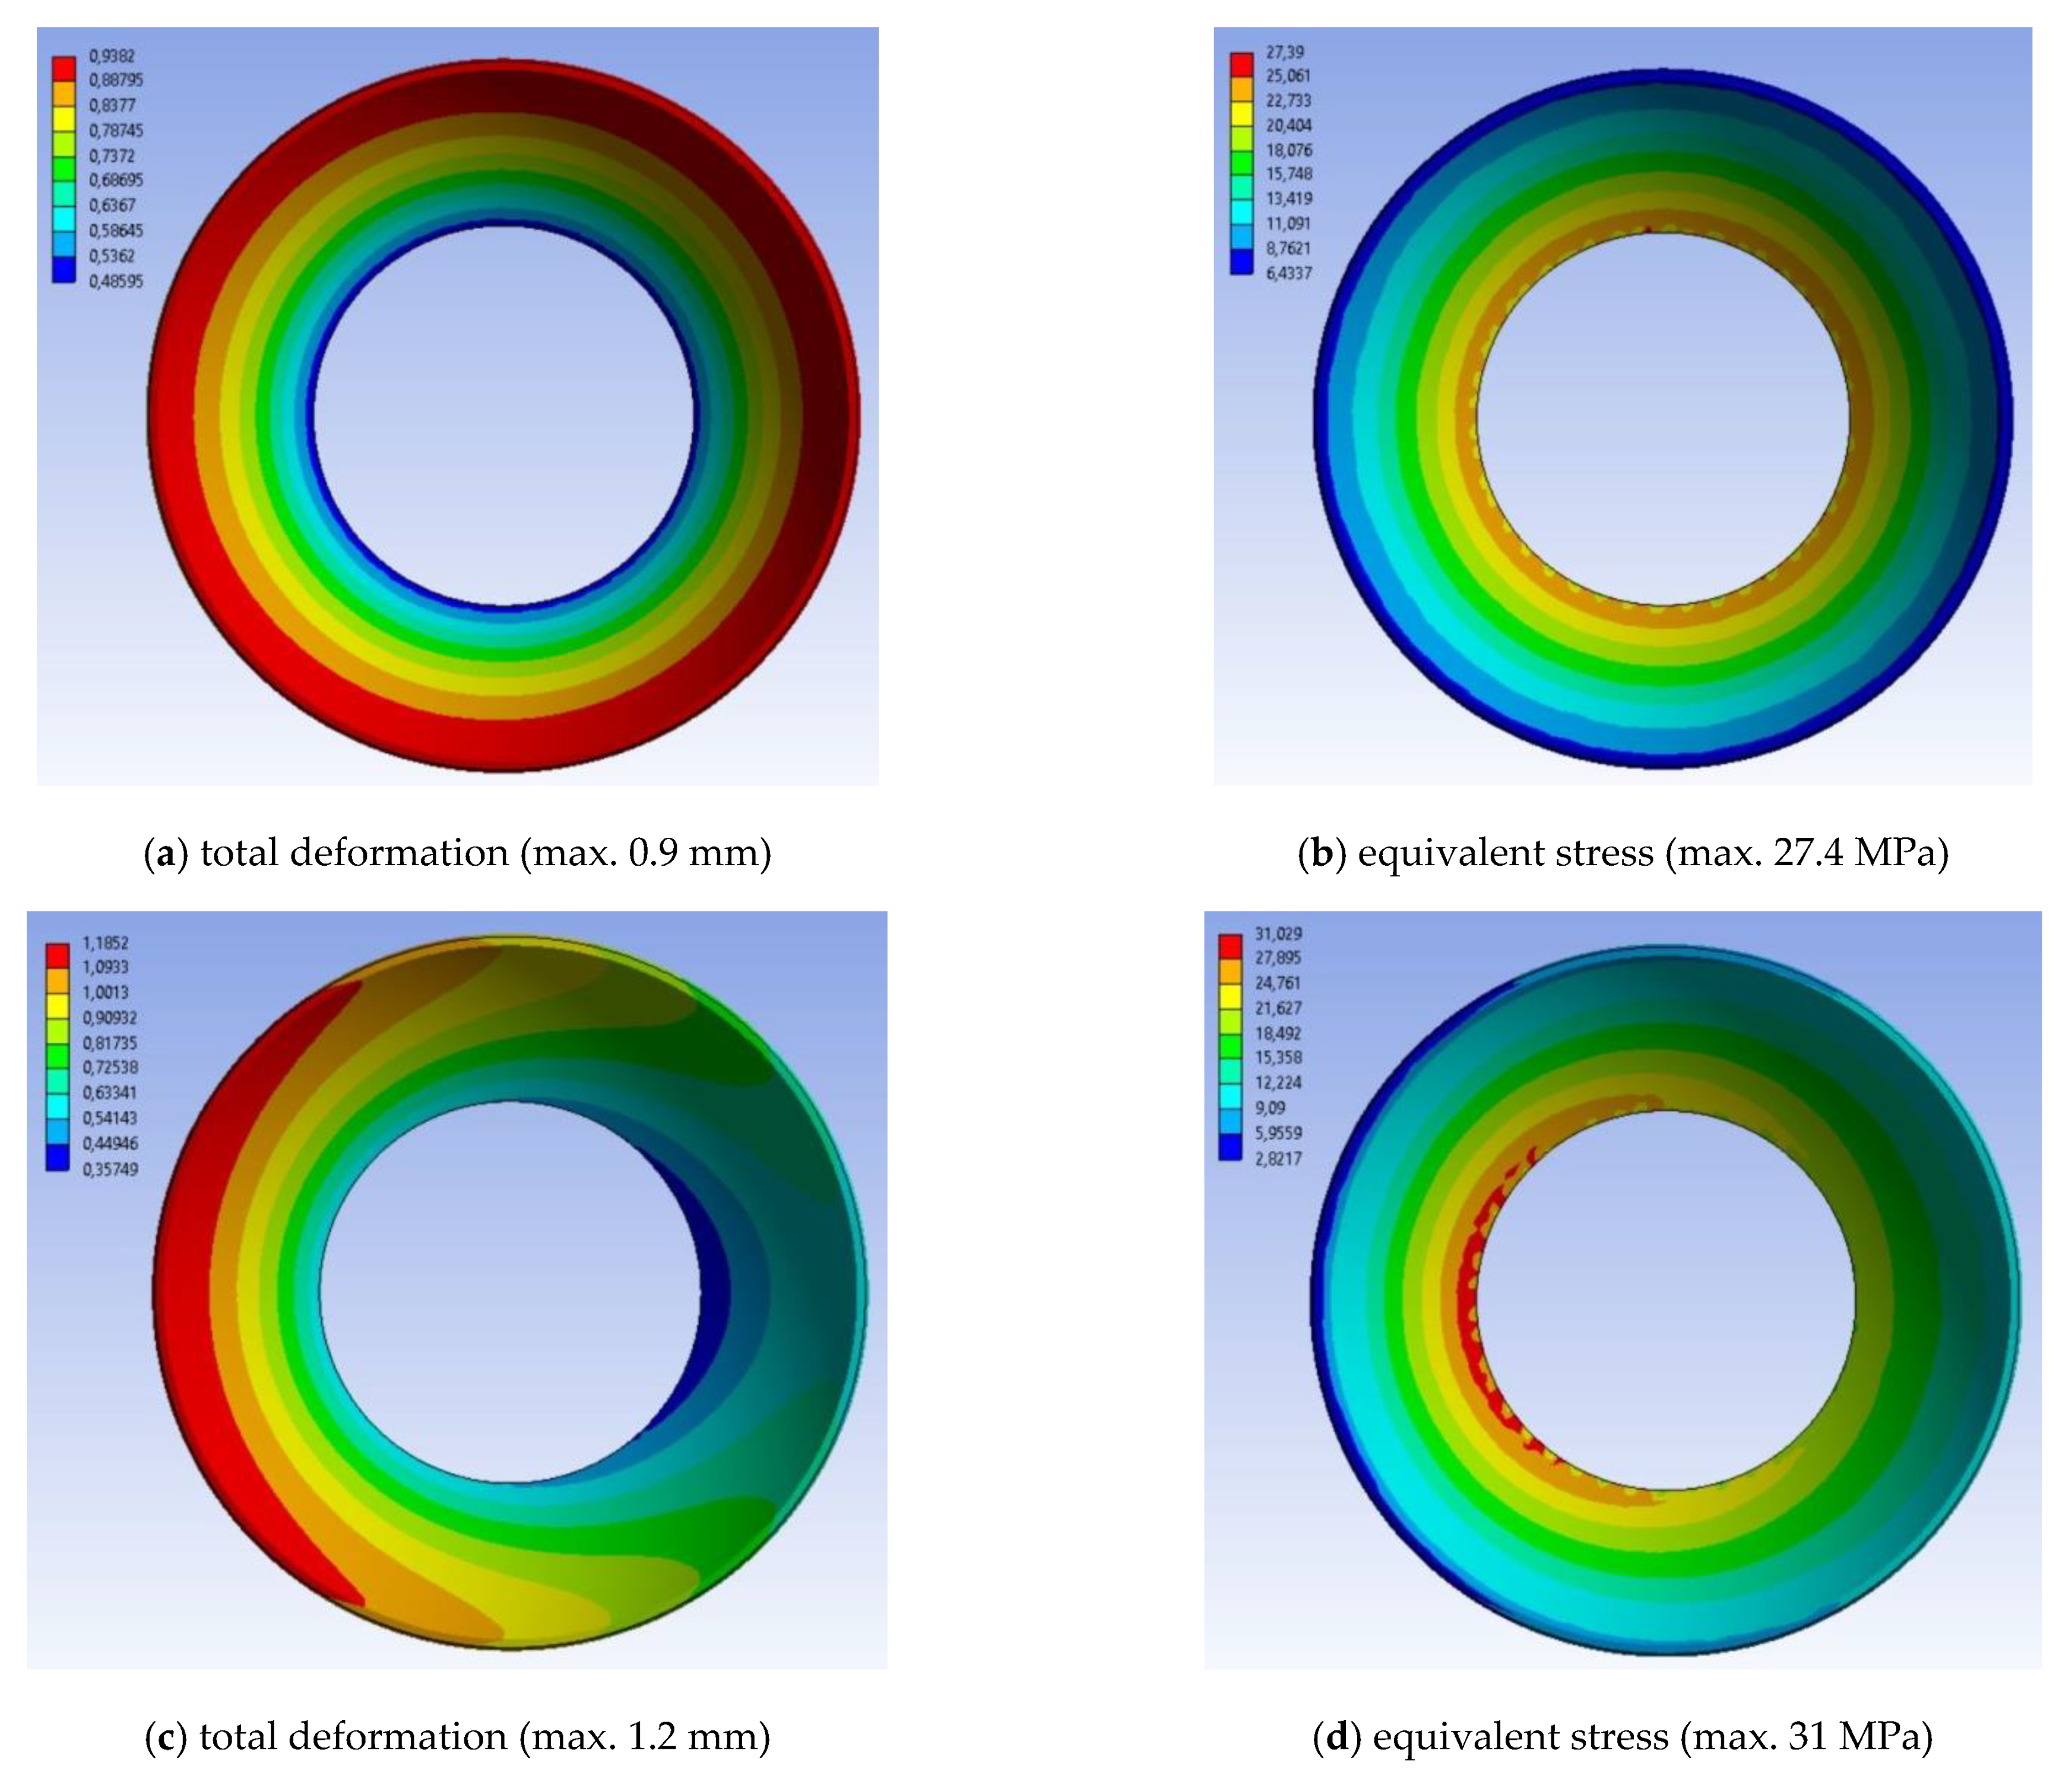
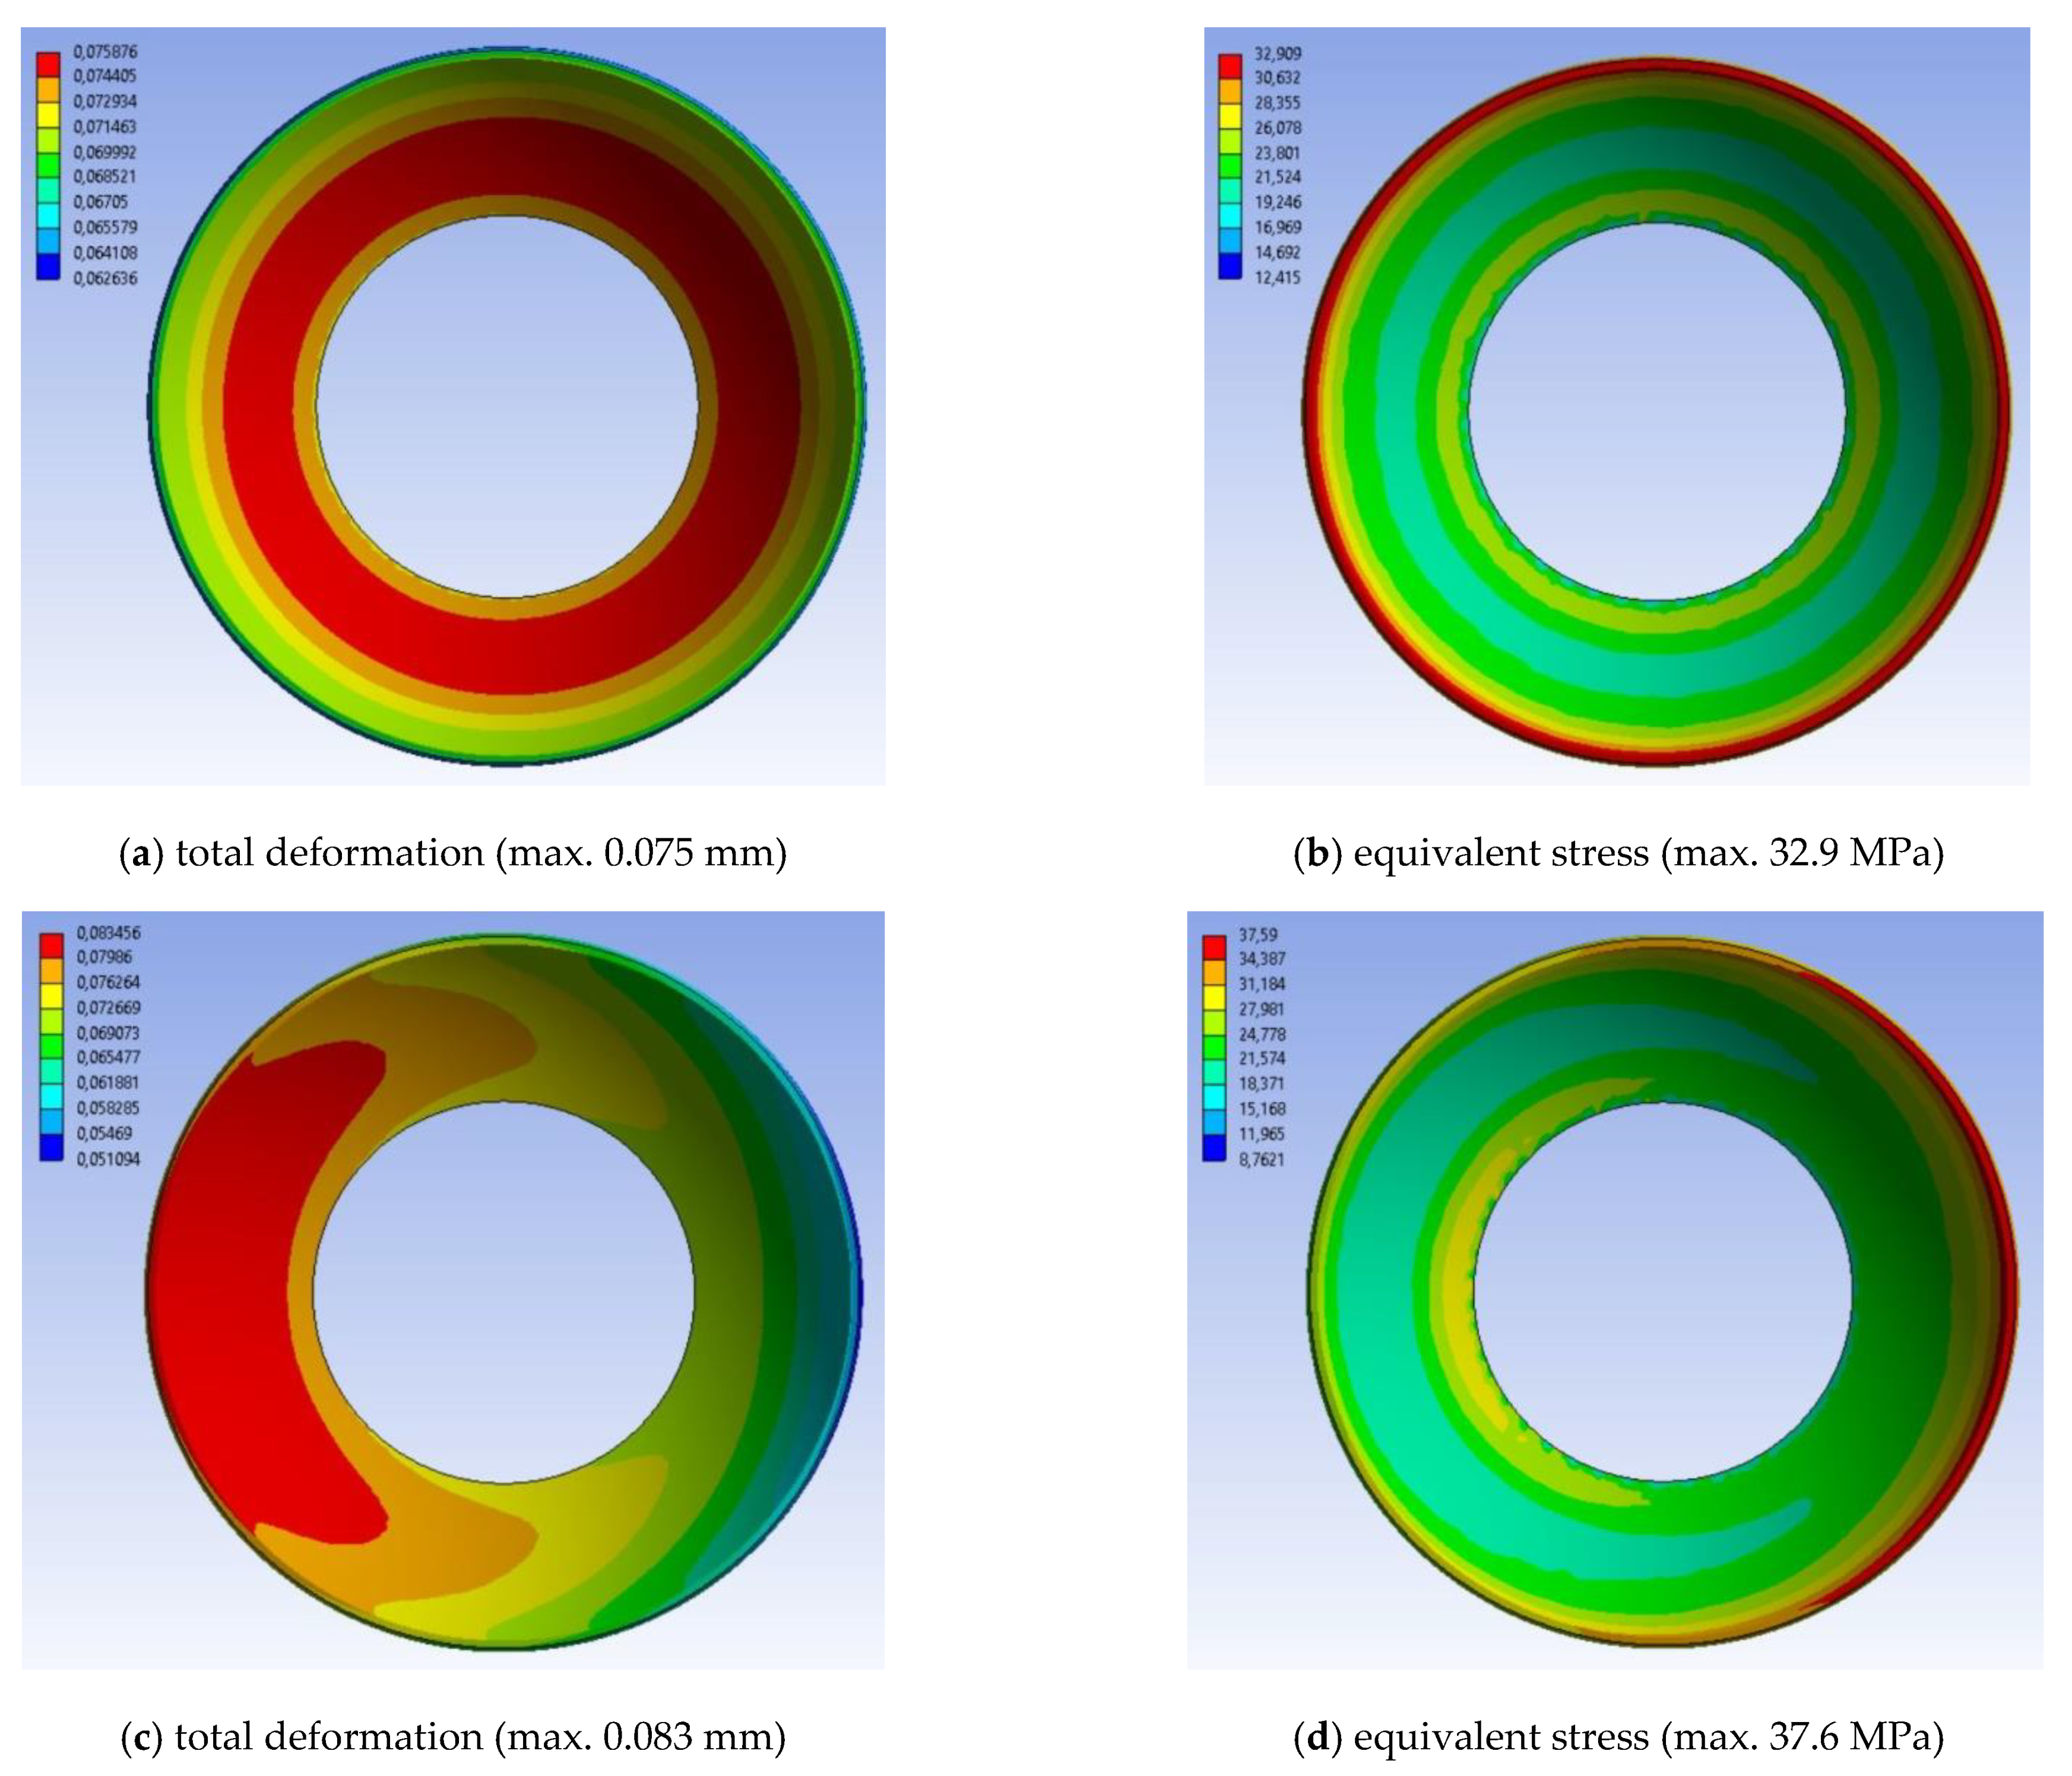
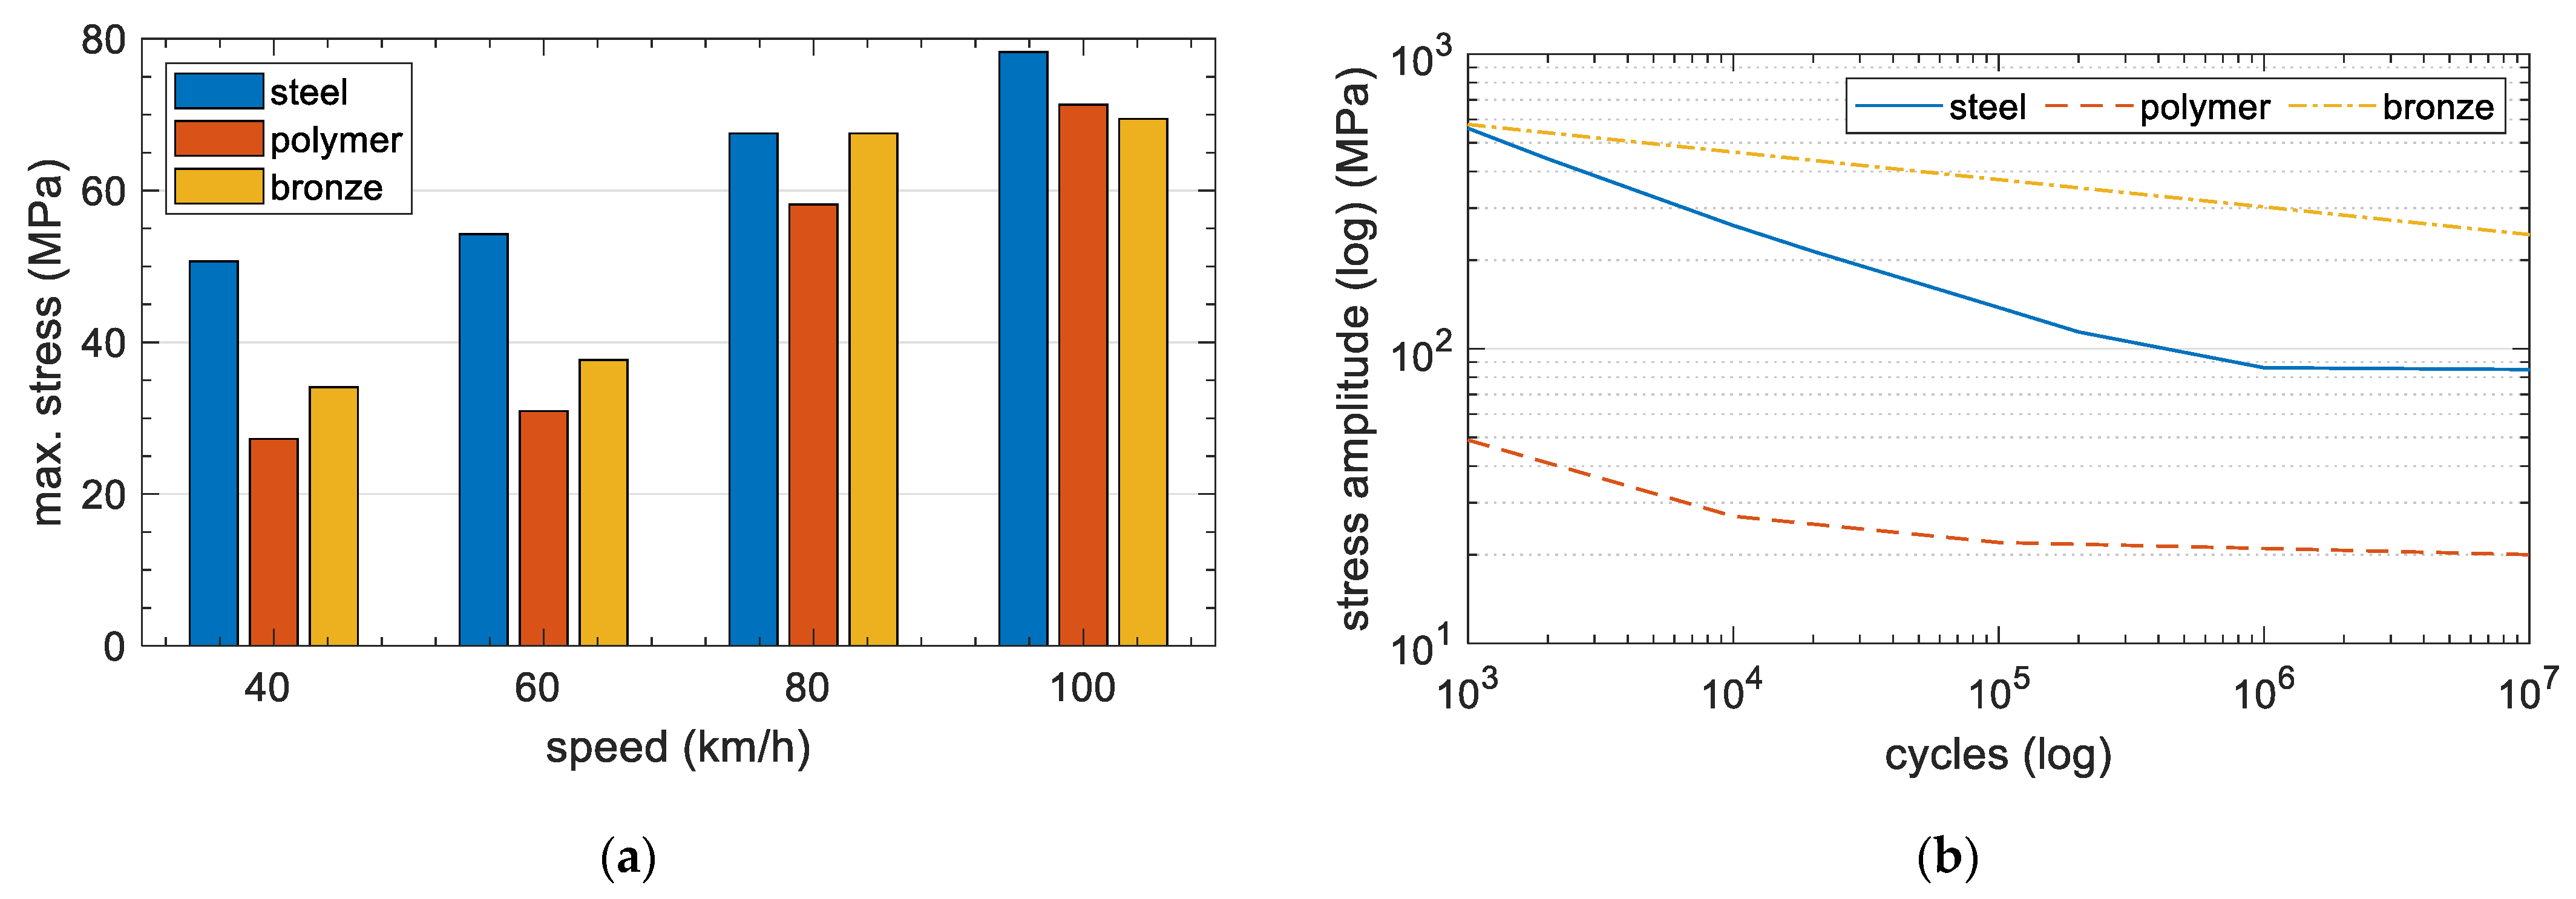
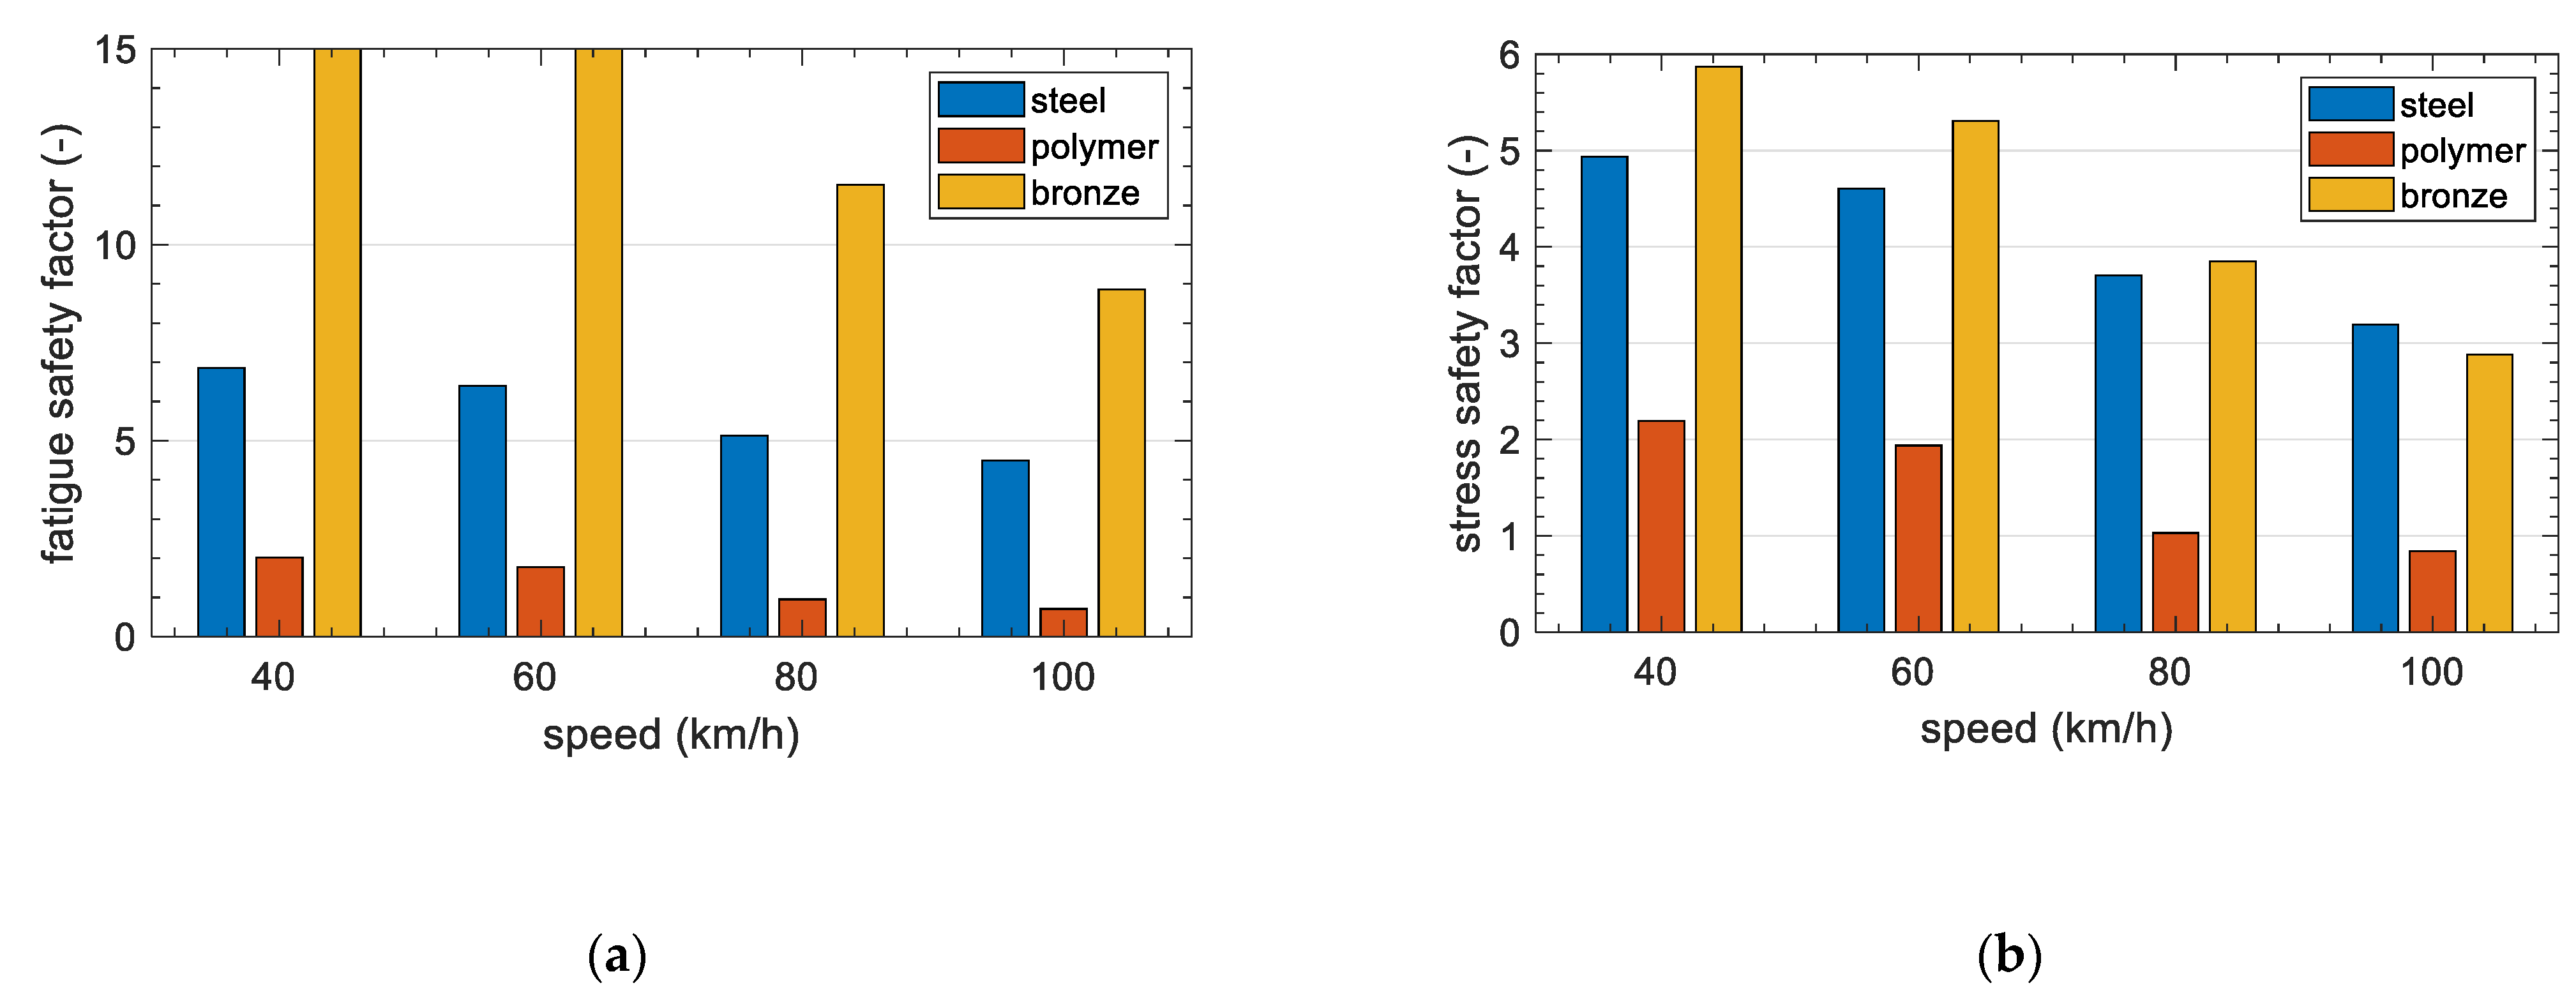
3. Simulation Analysis
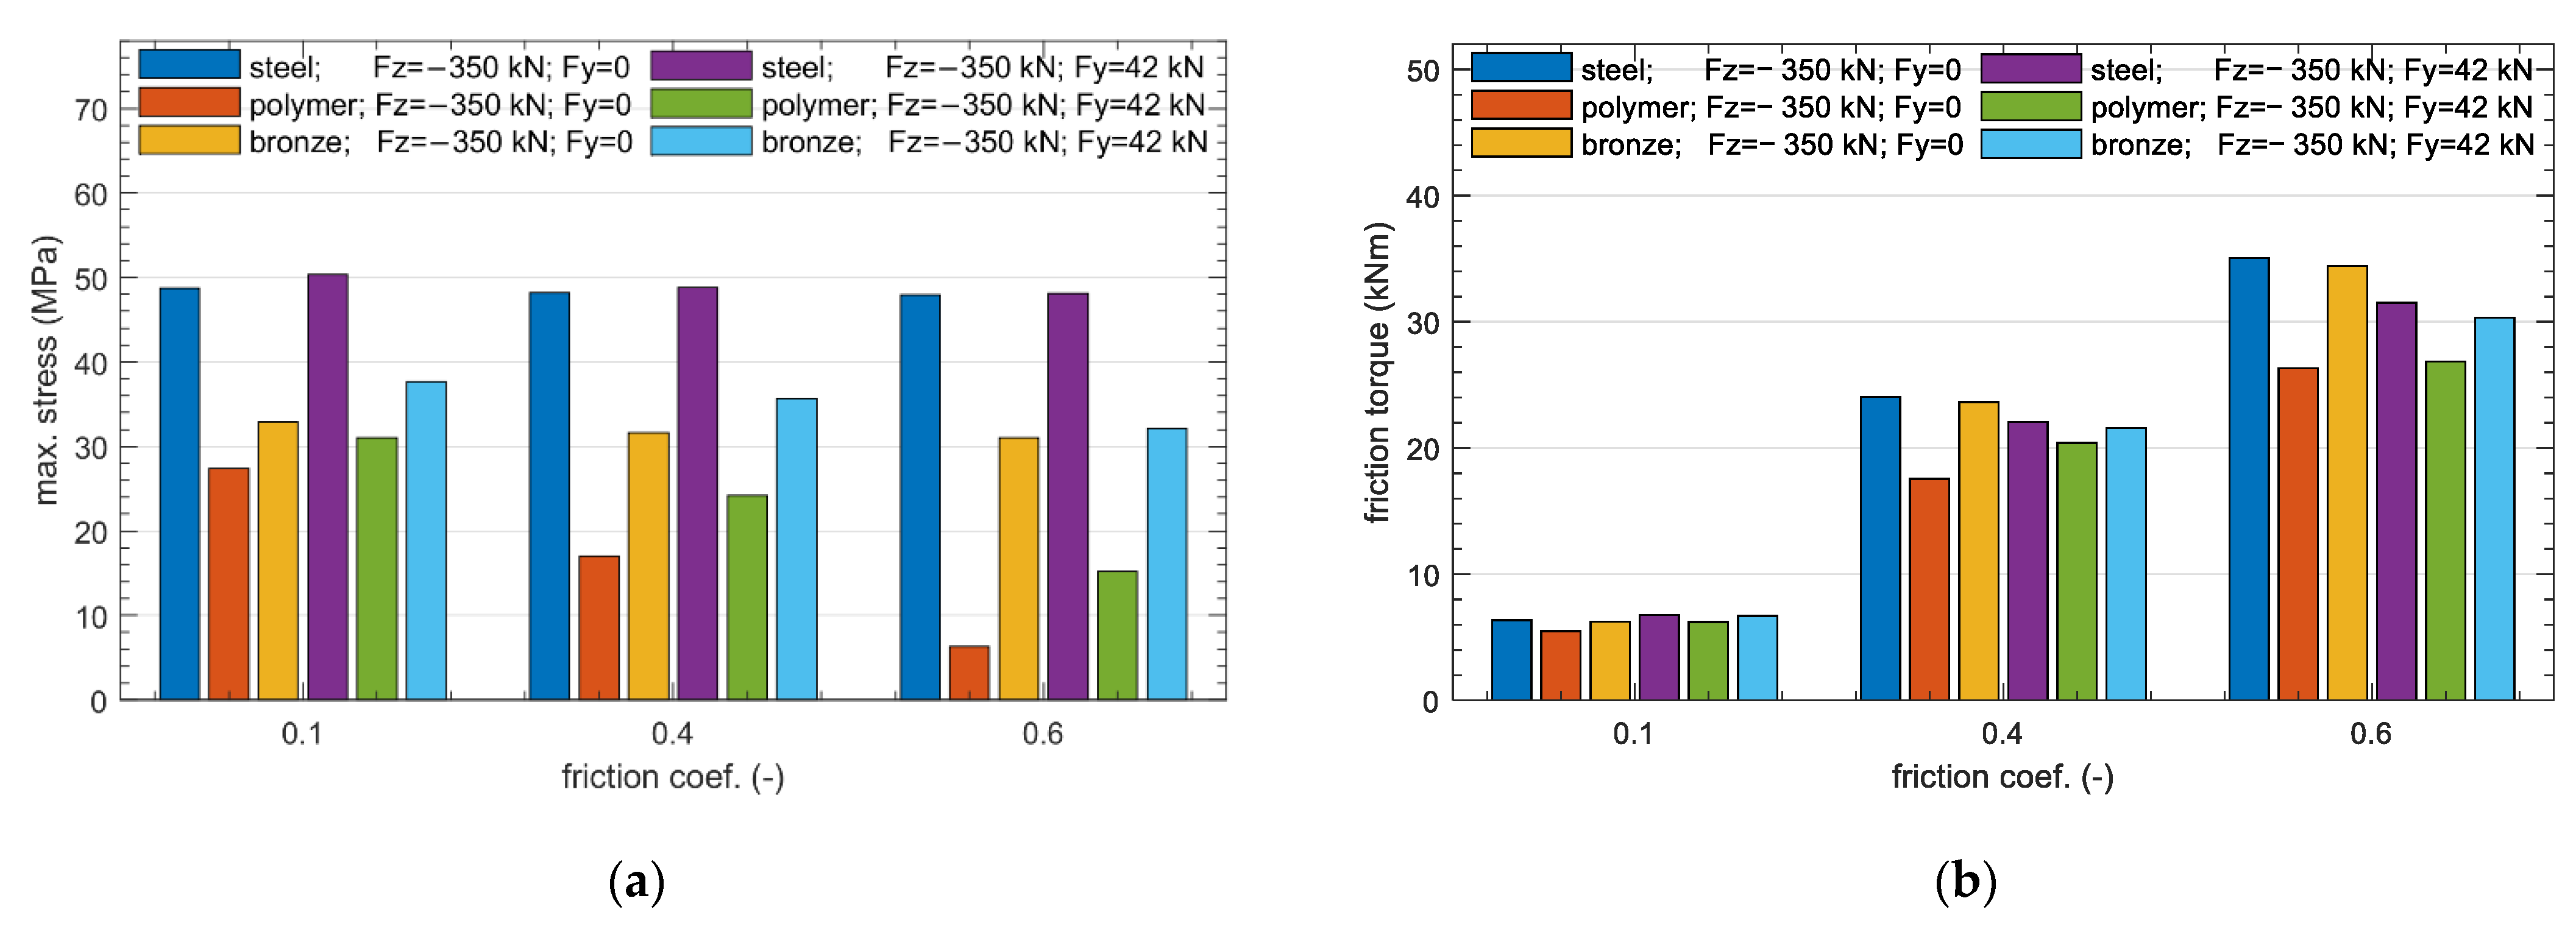
- Type of material of the contacting surfaces of the friction pair; i.e., contact between the steel surface and the other material i.e., the polymer liner, the bronze and the steel surface;
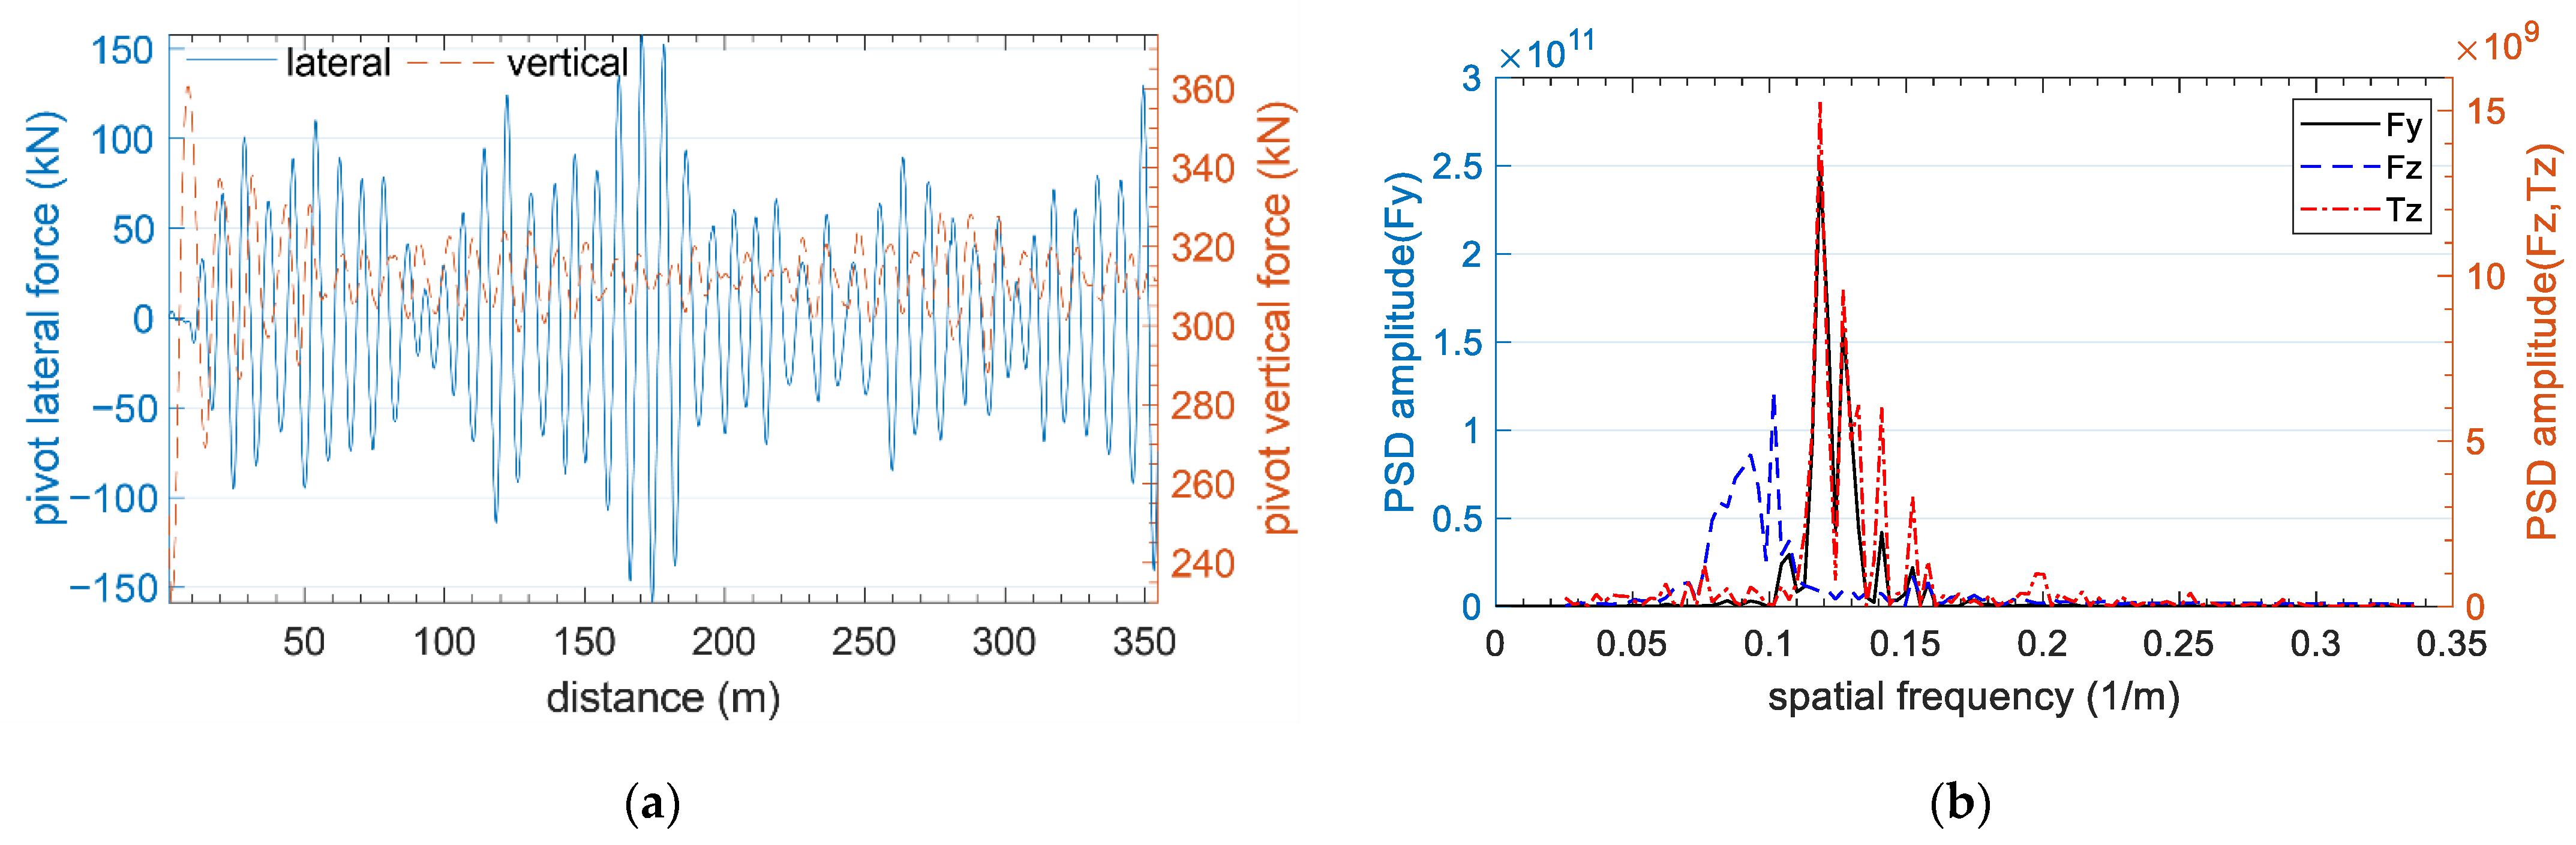
- Loading scenario; vertical force from the wagon’s weight as well as vertical force and additional lateral force;
- Value of the coefficient of friction; three values of the coefficient of friction were assumed: 0.1 is the typical value at the nominal state of a friction pair containing a polymer liner (depending on the modifiers of the liner material, the coefficient may be in the range of 0.1–0.25); 0.4 is a value that can occur after a long period during normal operation; 0.6—this is the extreme value that occurs in the case of a broken pivot connection.
4. Fatigue Life Calculation
5. Conclusions
- They do not require lubrication, what makes their operation easier;
- Easy to replace, inexpensive;
- Constant coefficient of friction between the bogie and the body;
- Indirect positive influence on the wear rate of the wheels and rails.
Author Contributions
Funding
Institutional Review Board Statement
Informed Consent Statement
Data Availability Statement
Conflicts of Interest
References
- Ashby, M.F. Materials Selection in Mechanical Design, 5th ed.; Elsevier LTD.: Oxford, UK, 2016. [Google Scholar]
- Ehrenstein, G.W.; Brocka-Krzemińska, Ż. Materiały Polimerowe. Struktura, Właściwości, Zastosowanie (Polymer Materials. Structure, Properties, Application); Wydawnictwo Naukowe PWN: Warsaw, Poland, 2014. [Google Scholar]
- Wang, S.; Cao, B.; Niu, C.; Pan, L. Effect of Temperature on Mechanical Properties and Torsional Friction Behaviors of Bogie Center Plate. J. Tribol. 2015, 138, 011104. [Google Scholar] [CrossRef]
- Donato, G.H.; Bianchi, M. Pressure Dependent Yield Criteria Applied for Improving Design Practices and Integrity Assessments against Yielding of Engineering Polymers. J. Mater. Res. Technol. 2012, 1, 2–7. [Google Scholar] [CrossRef] [Green Version]
- Siviour, C.R.; Jordan, J.L. High Strain Rate Mechanics of Polymers: A Review. J. Dyn. Behav. Mater. 2016, 2, 15–32. [Google Scholar] [CrossRef] [Green Version]
- Zhai, M.F. Vehicle–Track Coupled Dynamics, 1st ed.; Springer: Singapore, 2020. [Google Scholar]
- Song, Y.; Wang, Z.; Liu, Z.; Wang, R. A spatial coupling model to study dynamic performance of pantograph-catenary with vehicle-track excitation. Mech. Syst. Signal Process. 2021, 151, 107336. [Google Scholar] [CrossRef]
- Clark, G. Urgent Safety Advice; Incident report no 0776; Rail Accident Investigation Branch: Farnborough, UK, 2015. [Google Scholar]
- Ministry of Infrastructure and Development. Regulation of the Minister of Infrastructure and Development, amending the ordinance on technical conditions to be met by railway structures and their location. In Journal of Laws of the Republic of Poland, No. 0, Item 867; Ministry of Infrastructure and Development: Warsaw, Poland, 2014. (In Polish) [Google Scholar]
- Ministry of Infrastructure. Regulation of the Minister of Infrastructure regarding the scope of examinations necessary to obtain certificates for placing in service of types of buildings and devices intended for railway traffic and types of railway vehicles. In Journal of Laws of the Republic of Poland, No. 212, Item 1772; Ministry of Infrastructure: Warsaw, Poland, 2005. (In Polish) [Google Scholar]
- International Union of Railways (UIC). UIC 510-1. In Wagons—Running Gear—Normalisation, 9th ed.; of 1.1.78 and 14 Amendments; International Union of Railways (UIC): Paris, France, 2004. [Google Scholar]
- European Committee for Standardization. EN 14363:2016. In Railway Applications—Testing and Simulation for the Acceptance of Running Characteristics of Railway Vehicles. Running Behaviour and Stationary Tests; European Committee for Standardization: Brussels, Belgium, 2016. [Google Scholar]
- Official Journal of the European Union. Commission Regulation (EU) No 321/2013 of 13 March 2013 Concerning the Technical Specification for Interoperability Relating to the Subsystem ‘Rolling Stock—Freight Wagons’ of the Rail System in the European Union; Official Journal of the European Union: Luxembourg, 2013. [Google Scholar]
- European Rail Research Institute. ERRI B12/RP17. In Programme of Tests to Be Carried out on Wagons with Steel Underframe and Body Structure (Suitable for Being Fitted with the Automatic Buffing and Draw Coupler) and on Their Cast Steel Frame Bogies, 8th ed.; European Rail Research Institute: Utrecht, The Netherlands, 1997. [Google Scholar]
- Fergusson, S.N.; Fröhling, R.D.; Klopper, H. Minimising wheel wear by optimising the primary suspension stiffness and centre plate friction of self-steering bogies. Veh. Syst. Dyn. 2008, 46, 457–468. [Google Scholar] [CrossRef]
- Wu, H.; Robeda, J. Effects of bogie center plate lubrication on vehicle curving and lateral stability. Veh. Syst. Dyn. 2004, 41, 292–302. [Google Scholar]
- Opala, M. Evaluation of bogie centre bowl friction models in the context of safety against derailment simulation predictions. Arch. Appl. Mech. 2018, 88, 943–953. [Google Scholar] [CrossRef] [Green Version]
- Engin, Z.; Coker, D. Comparison of Equivalent Stress Methods with Critical Plane Approaches for Multiaxial High Cycle Fatigue Assessment. Procedia Struct. Integr. 2017, 5, 1229–1236. [Google Scholar] [CrossRef]
- Sun, G.-Q.; Shang, D.-G. Prediction of fatigue lifetime under multiaxial cyclic loading using finite element analysis. Mater. Des. 2010, 31, 126–133. [Google Scholar] [CrossRef]


| Material Constant | Material 1—Steel | Material 2—Polymer Liner | Material 3—Bronze B101 | Material 4—Bronze B1032 | Material 5—Brass MA58 |
|---|---|---|---|---|---|
| Density (kg m−3) | 7850 | 1146 | 8800 | 7500 | 8430 |
| Modulus of elasticity (tangent) (MPa) | 200,000 | 3400 | 103,000 | 115,000 | 110,000 |
| Compressive modulus of elasticity (MPa) | 200,000 | 2290 | 103,000 | 115,000 | 110,000 |
| Poisson’s ratio (–) | 0.3 | 0.4 | 0.33 | 0.3 | 0.33 |
| Bulk modulus (MPa) | 166,670 | 3816 | 101,000 | 113,000 | 108,000 |
| Shear modulus (MPa) | 76,923 | 817 | 39,000 | 44,000 | 42,000 |
| Yield point (MPa) | 250 | 66 | 110 | 200 | 170 |
| Compressive strength (MPa) | 250 | 99 | 100 | 190 | 160 |
| Nominal coefficient of dry friction in contact of material with steel (–) | 0.25–0.4 | 0.1–0.25 | 0.25–0.35 | 0.24 | 0.3–0.35 |
| Body | Mass (kg) | Roll Inertia (kg·m2) | Pitch Inertia (kg·m2) | Yaw Inertia (kg·m2) |
|---|---|---|---|---|
| Carbody | 70,000 | 59,383 | 928,320 | 953,980 |
| Bogie frame | 2070 | 1400 | 2100 | 2400 |
| Wheelset | 2000 | 1200 | 200 | 1200 |
| Suspensions | Longitudinal (kN/m) | Lateral (kN/m) | Vertical (kN/m) |
|---|---|---|---|
| Primary | 4000 | 4500 | 3984 |
| Primary inner spring | - | - | 6476 |
| Centre pivot-bowl | 10,000 | 10,000 | 10,000 |
| Side bearers | - | 350 | 500 |
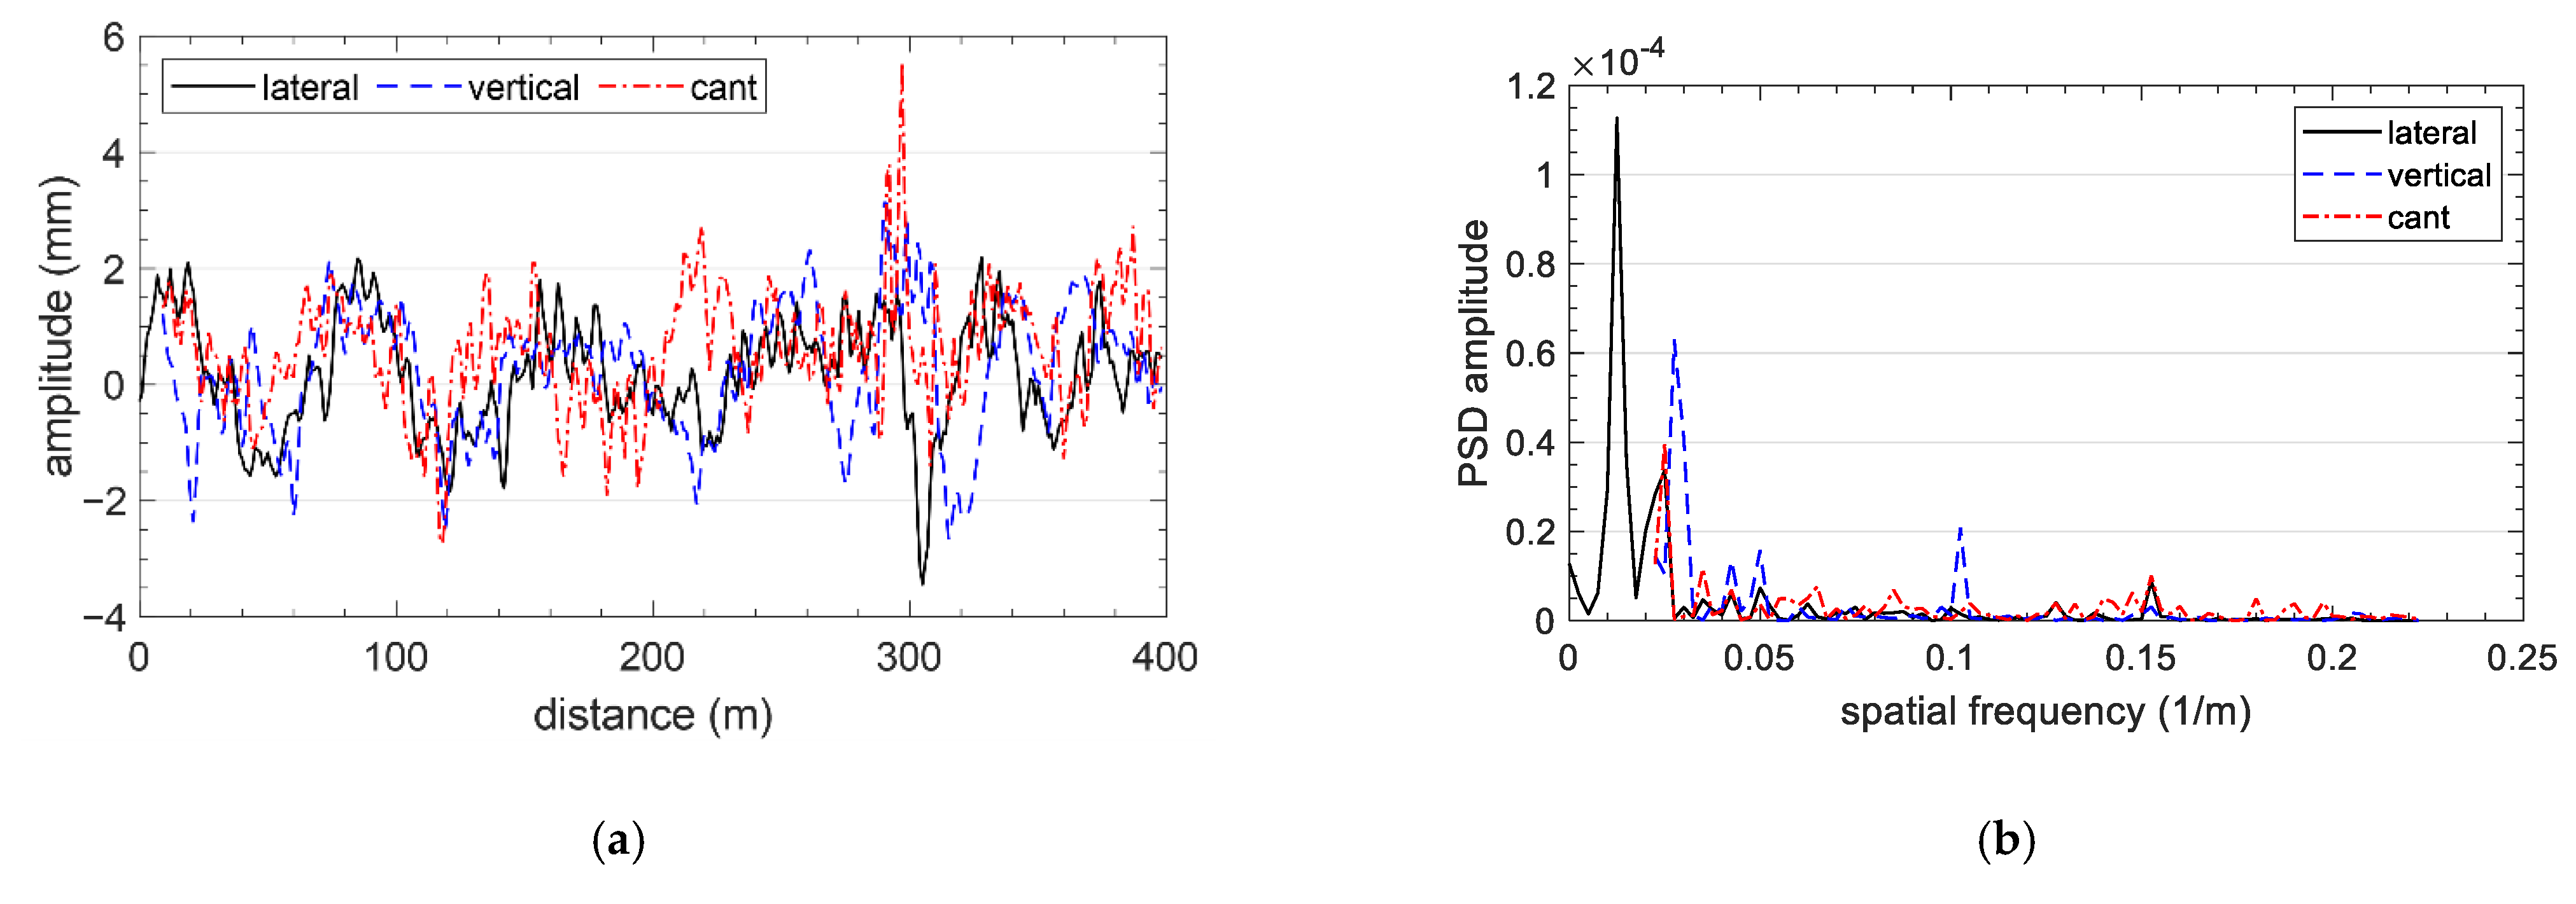
| Thread Irregularity | Lateral—Left Rail | Lateral—Right Rail | Vertical—Centre Line | Cant |
|---|---|---|---|---|
| Max. amplitude (mm) | 2 | 2 | 3 | 5 |
| Std. deviation (mm) | 0.9 | 0.9 | 1 | 1 |
| Vehicle Speed (km/h) | ||||
|---|---|---|---|---|
| 40 | 60 | 80 | 100 | |
| Estimated maximum lateral force (at 99.7%) (kN) | 12.2 | 40.5 | 116.5 | 164.7 |
Publisher’s Note: MDPI stays neutral with regard to jurisdictional claims in published maps and institutional affiliations. |
© 2021 by the authors. Licensee MDPI, Basel, Switzerland. This article is an open access article distributed under the terms and conditions of the Creative Commons Attribution (CC BY) license (https://creativecommons.org/licenses/by/4.0/).
Share and Cite
Opala, M.; Korzeb, J.; Koziak, S.; Melnik, R. Evaluation of Stress and Fatigue of a Rail Vehicle Suspension Component. Energies 2021, 14, 3410. https://doi.org/10.3390/en14123410
Opala M, Korzeb J, Koziak S, Melnik R. Evaluation of Stress and Fatigue of a Rail Vehicle Suspension Component. Energies. 2021; 14(12):3410. https://doi.org/10.3390/en14123410
Chicago/Turabian StyleOpala, Michał, Jarosław Korzeb, Seweryn Koziak, and Rafał Melnik. 2021. "Evaluation of Stress and Fatigue of a Rail Vehicle Suspension Component" Energies 14, no. 12: 3410. https://doi.org/10.3390/en14123410