Article

Effect of Two Different Heat Transfer Fluids on the Performance of Solar Tower CSP by Comparing Recompression Supercritical CO2 and Rankine Power Cycles, China

by
Ephraim Bonah Agyekum
1,*,
Tomiwa Sunday Adebayo
2,
Festus Victor Bekun
3,
Nallapaneni Manoj Kumar
4 and
Manoj Kumar Panjwani
5
1
Department of Nuclear and Renewable Energy, Ural Federal University Named after the First President of Russia Boris Yeltsin, 19 Mira Street, 620002 Ekaterinburg, Russia
2
Faculty of Economics and Administrative Sciences, Cyprus International University Nicosia, North Cyprus Via Mersin 10, Nicosia 99670, Turkey
3
Faculty of Economics, Administrative and Social Sciences, Istanbul Gelisim University, Istanbul 34000, Turkey
4
School of Energy and Environment, City University of Hong Kong, Kowloon, Hong Kong, China
5
Department of Energy Systems Engineering, Sukkur IBA University, Sukkur 65200, Pakistan
*
Author to whom correspondence should be addressed.
Energies 2021, 14(12), 3426; https://doi.org/10.3390/en14123426
Submission received: 15 May 2021 / Revised: 6 June 2021 / Accepted: 8 June 2021 / Published: 10 June 2021
(This article belongs to the Special Issue Solar Forecasting and the Integration of Solar Generation to the Grid)

Abstract

:
China intends to develop its renewable energy sector in order to cut down on its pollution levels. Concentrated solar power (CSP) technologies are expected to play a key role in this agenda. This study evaluated the technical and economic performance of a 100 MW solar tower CSP in Tibet, China, under different heat transfer fluids (HTF), i.e., Salt (60% NaNO3 40% KNO3) or HTF A, and Salt (46.5% LiF 11.5% NaF 42% KF) or HTF B under two different power cycles, namely supercritical CO2 and Rankine. Results from the study suggest that the Rankine power cycle with HTF A and B recorded capacity factors (CF) of 39% and 40.3%, respectively. The sCO2 power cycle also recorded CFs of 41% and 39.4% for HTF A and HTF B, respectively. A total of 359 GWh of energy was generated by the sCO2 system with HTF B, whereas the sCO2 system with HTF A generated a total of 345 GWh in the first year. The Rankine system with HTF A generated a total of 341 GWh, while the system with B as its HTF produced a total of 353 GWh of electricity in year one. Electricity to grid mainly occurred between 10:00 a.m. to 8:00 p.m. throughout the year. According to the results, the highest levelized cost of energy (LCOE) (real) of 0.1668 USD/kWh was recorded under the Rankine cycle with HTF A. The lowest LCOE (real) of 0.1586 USD/kWh was obtained under the sCO2 cycle with HTF B. In general, all scenarios were economically viable at the study area; however, the sCO2 proved to be more economically feasible according to the simulated results.

1. Introduction

One key thing in the lives of humans is energy, and if countries are to see the necessary socio-economic development they seek, then obtaining sufficient, accessible, cost-effective, and secure energy is vital. The world’s energy demand keeps increasing and is projected to continue into the future as a result of increasing population, industrialization, and changing lifestyles, among other factors [1,2,3,4,5,6,7].
Renewable energy (RE) has in the past decades gained much attraction among industry players and other stakeholders due to the numerous advantages associated with its use. The use of solar energy resources for electricity generation has also seen an increase in recent times due to the declining cost of its components [8]. The photovoltaic (PV) technology of solar energy is the most widespread and matured technology used for electricity generation globally. However, PV technology has a drawback that borders on the stability of the grid system, as well as the use of storage systems since solar radiation is intermittent and also unavailable in the night [9,10]. Another type of nascent technology in the solar energy industry is concentrated solar power (CSP) plants; the technology is relatively new compared to the PV. CSP technology collects and concentrates available solar energy at a location using mirrors. This technology is more appropriate in sunny areas. The primary source of energy for CSP technology is solar irradiance (specifically, the direct normal solar irradiance, DNI) due to its direct nature [9,11]. Unlike that of PV technology, the CSP can be combined with a thermal energy storage (TES) system which is akin to the traditional and dispatchable power plants. The addition of the TES system in CSP power plants allows them to mitigate short load fluctuations and extend the period for energy supply and is also partly independent from instantaneous solar radiation [9].
An area may receive much solar radiation but may not be able to support the development of CSP technology if the DNI is not enough. The most nascent areas for the development of CSP include the southwestern part of the United States, sections of Africa, South America, the desert plains of India, China, Pakistan, the Mediterranean countries, Australia, etc. [12].
The CSP is similar to other thermoelectrical power plants relative to the way electricity is produced; they all make use of steam, which turns turbines to generate power. The only dichotomy is the source of heat—the CSP makes use of the sun, whereas other such plants use fossil fuel (i.e., coal, gas, etc.). Heat transfer fluids (HTF) are very crucial in the collection of energy from the solar field to the power block [13]. HTF is key for the overall performance of a CSP plant. Since the CSP requires a large amount of HTF to operate, it is important to minimize the HTF cost while its performance is maximized at the same time. Apart from using HTF as a medium of heat transfer from the receiver to the steam generator, it is also possible to store hot HTF in insulated tanks for the generation of power during periods with no sunlight. For these reasons, an HTF must have the following characteristics: high boiling point, low melting point, low vapor pressure, and thermal stability [14].
A number of literatures from Chile [15], Tanzania [16], Ghana [11], Afghanistan [17], Algeria [18], Kuwait [19], China [20], Malaysia [21], and Iran [22] have reported on the techno-economic performances of different CSP technologies in the various countries. Furthermore, Ling-zhi et al. [23] performed a cost-benefit analysis on CSP technology in China, Zhao et al. [24] conducted a study on the levelized costs of energy (LCOEs) of CSP technology in China on the basis of lifetime cost analysis, and Ji et al. [25] assessed the economic potential of CSP technologies in China on provincial levels. Other researchers looked at some specific technical parameters in power plants to assess their impact on the overall performance of the system. Neises and Turchi [26] compared sCO2 power cycle configurations on CSP applications. Wang and He [27] presented a study on molten solar power tower combined with the sCO2 Brayton cycle. Their results indicated that the best hot temperature for the salt is 565 °C; this is the maximum allowable temperature for using salt as HTF and TES. Iverson et al. [28] showed the performance of sCO2 Brayton cycles for solar-thermal energy. An assessment of the exergy and energy on sCO2 recompression Brayton cycles using solar tower was presented by [29]. Finally, Xu et al. [30] conducted a study on the problems and prospects associated with CSP technologies in desert areas. The study identified water requirements, thermal energy storage systems, and HTF as the major challenges for the smooth operation of CSP technologies.
Virtually all solar thermal power plants (STPP) that are currently operating use the Rankine steam cycle for the conversion of thermal to electric energy. As a result, almost all the aforementioned studies utilized the Rankine steam cycle in their analysis, except Ref. [31], who compared the performance of KCl-MgCl2 and sodium as a HTF using sCO2 power cycles. The various literature (supra) indicate that a study which simultaneously and comprehensively compares the performance of a CSP, i.e., a solar tower power plant on the type of power cycle and HTF it operates on, does not exist. It therefore makes it difficult to know the best technology to adopt during decision-making by interested stakeholders. As a way of bridging that research gap, this study takes a look at two issues, i.e., the effect of the type of HTF and the type of power cycle on the performance of a solar tower power plant under China’s weather conditions. Most of the studies on China paid much attention to the economics of the power plants but left out the technical performance of the power plants, which is also key for planning during feasibility studies. Therefore, it is crucial to conduct a more comprehensive study on CSP technology with more attention on some technical parameters, to help RE industry experts, stakeholders with interest in this area, energy researchers, investors, and policy makers during decision-making.
The study is organized and presented as follows: Section 2 looks at the study area and data used for the study, the methodology adopted for the study is presented in Section 3, Section 4 covers the results and discussions, and the conclusions of the study are presented in Section 5.

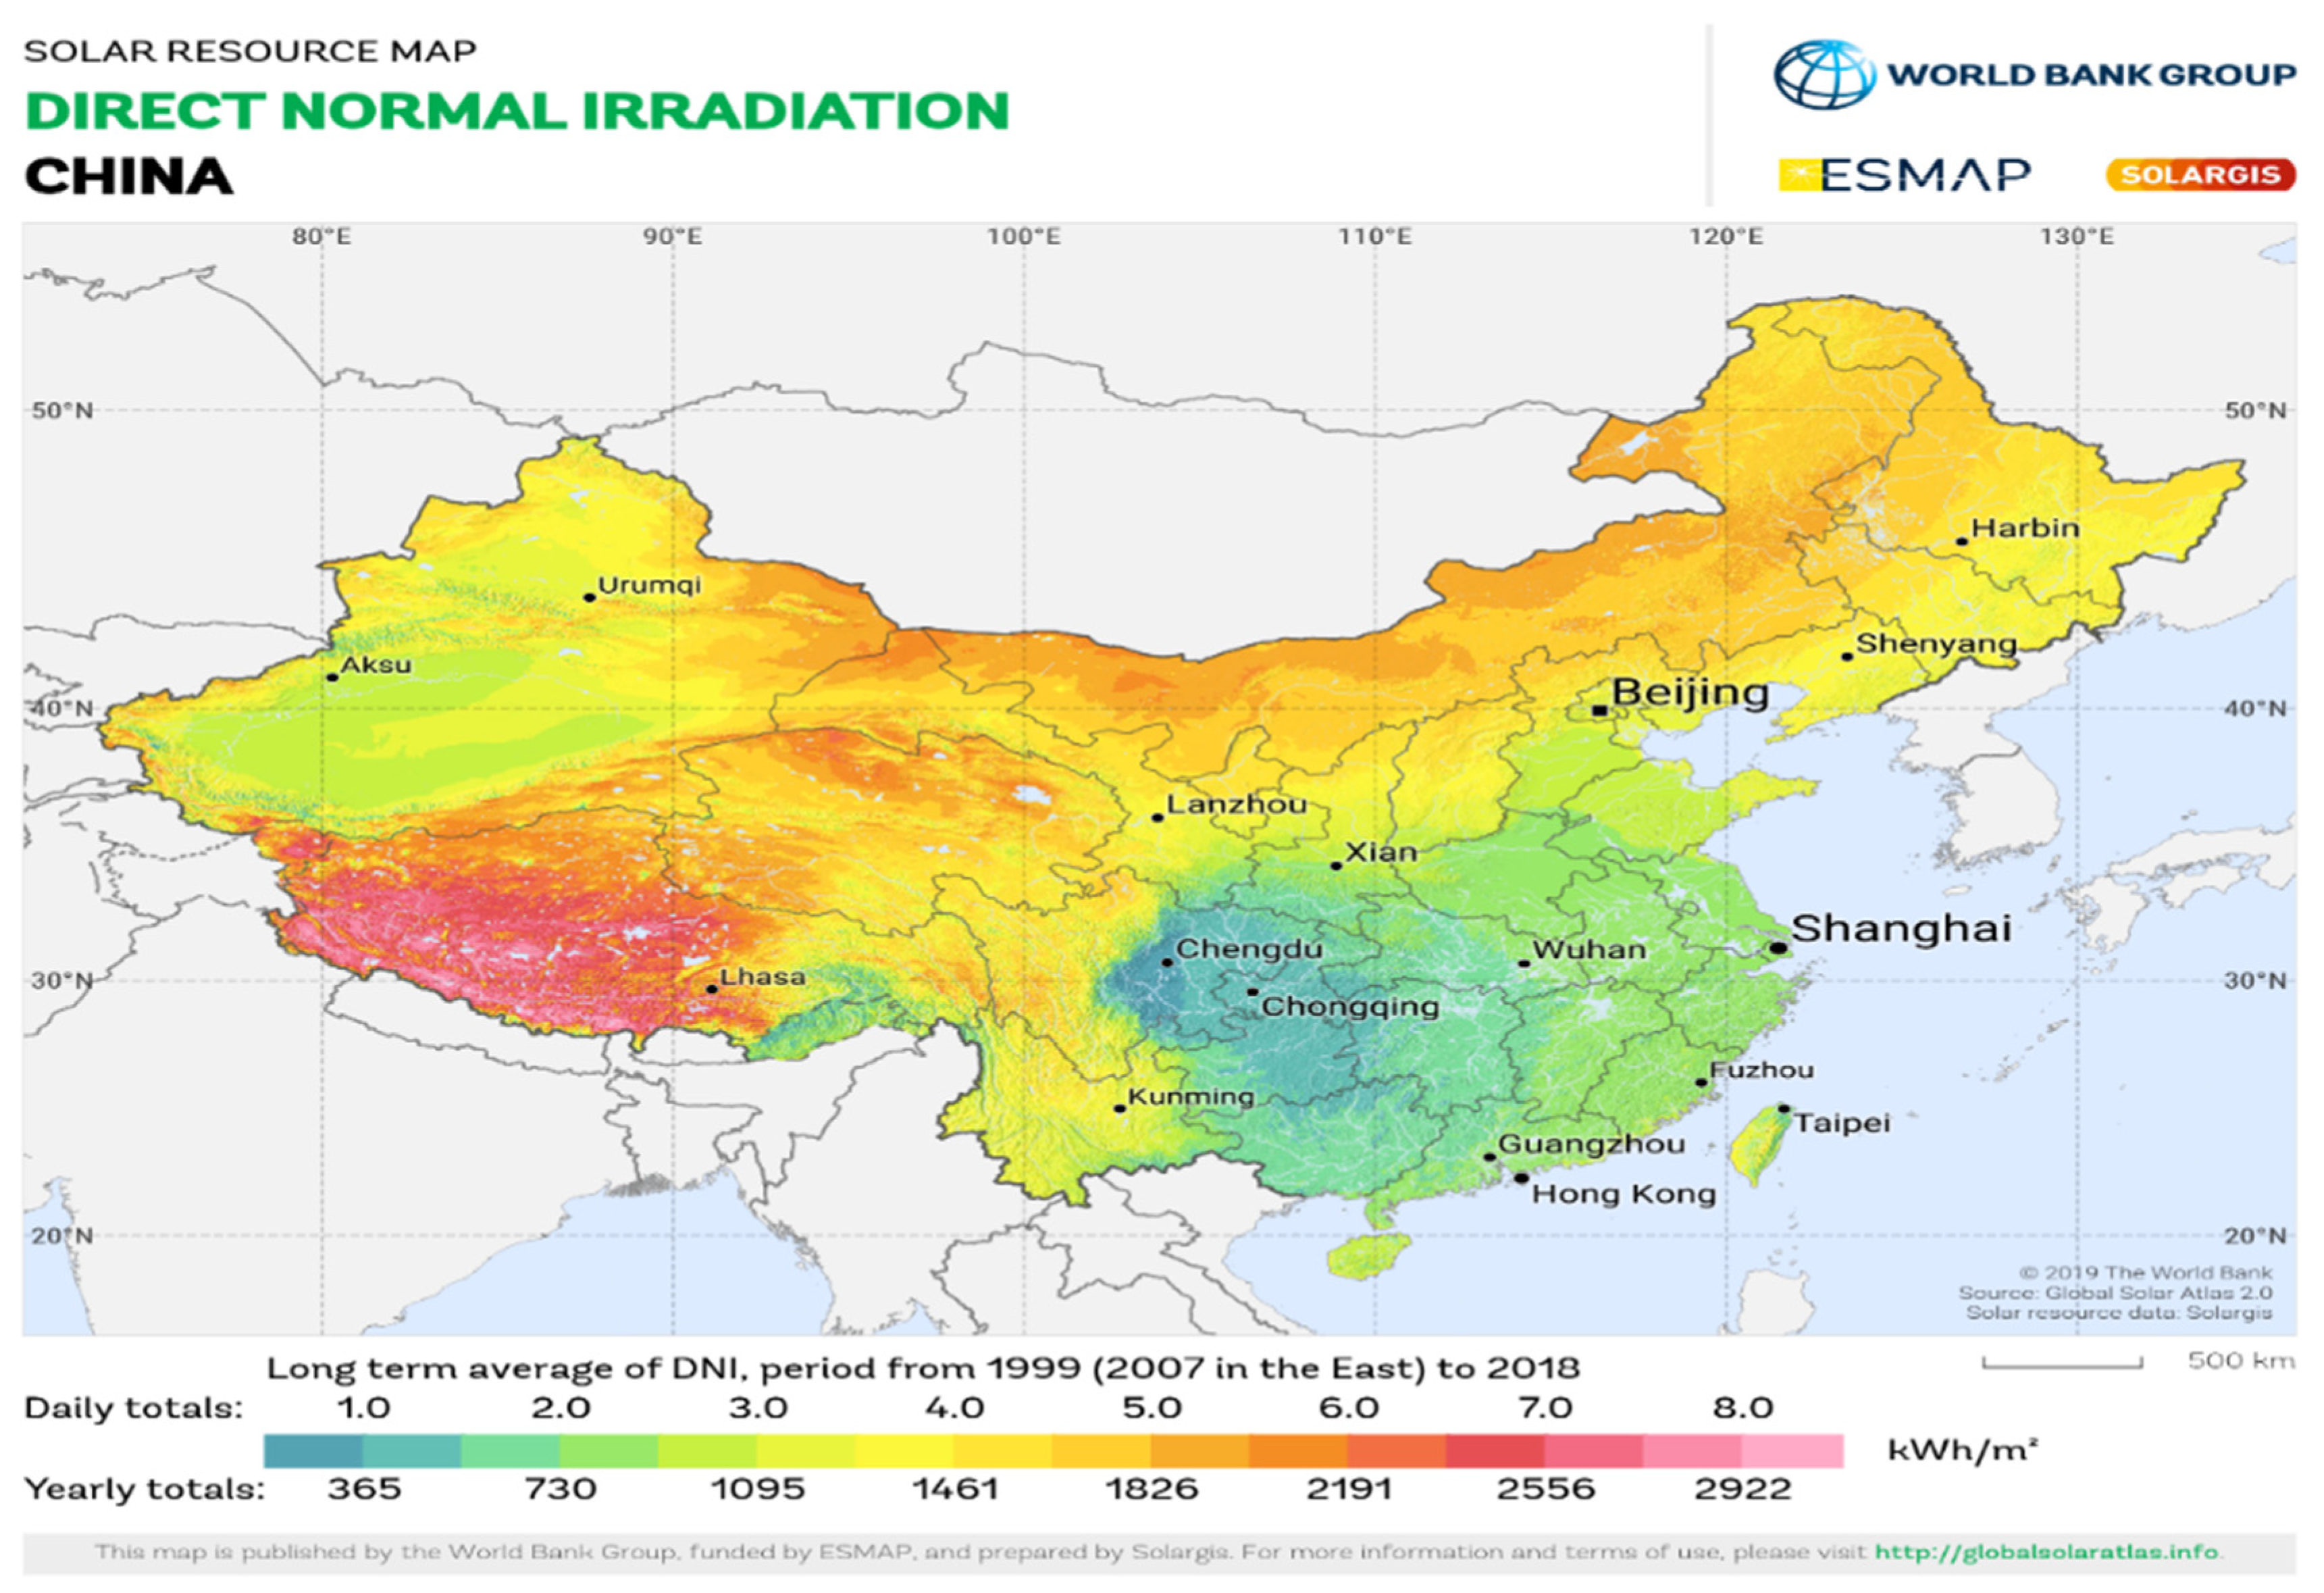
2. Description of the Study Area

China is geographically located in the eastern section of the Eurasian continent; it occupies a territory of about 9,600,000 km2 [32]. Research shows that over two-thirds of land in China receives DNI exceeding 1095 kWh/m2/year, which translates to about 3 kWh/m2/day. The country’s total annual solar radiation equals about 1.7 trillion tons of standard coal [20]. CSP technology requires high solar exposure conditions and high temperatures in order to perform efficiently, and as a result, locations with high DNI are often required for the development of such systems [11,20]. The case study for this research was conducted in China, specifically Tibet, located at latitude 32° N and longitude 90° E with an average wind speed of 4.1 m/s. The study area also has a global horizontal of 5.48 kWh/m2/day and DNI (beam) of 6.10 kWh/m2/day at an elevation of 4668 m [33]. Figure 1 shows the DNI potential for China. The DNI data used for the analysis range between 2007–2016. The hourly weather and solar radiation data used in this study were obtained from the EnergyPlus weather database [34], this was then imported into the SAM software.

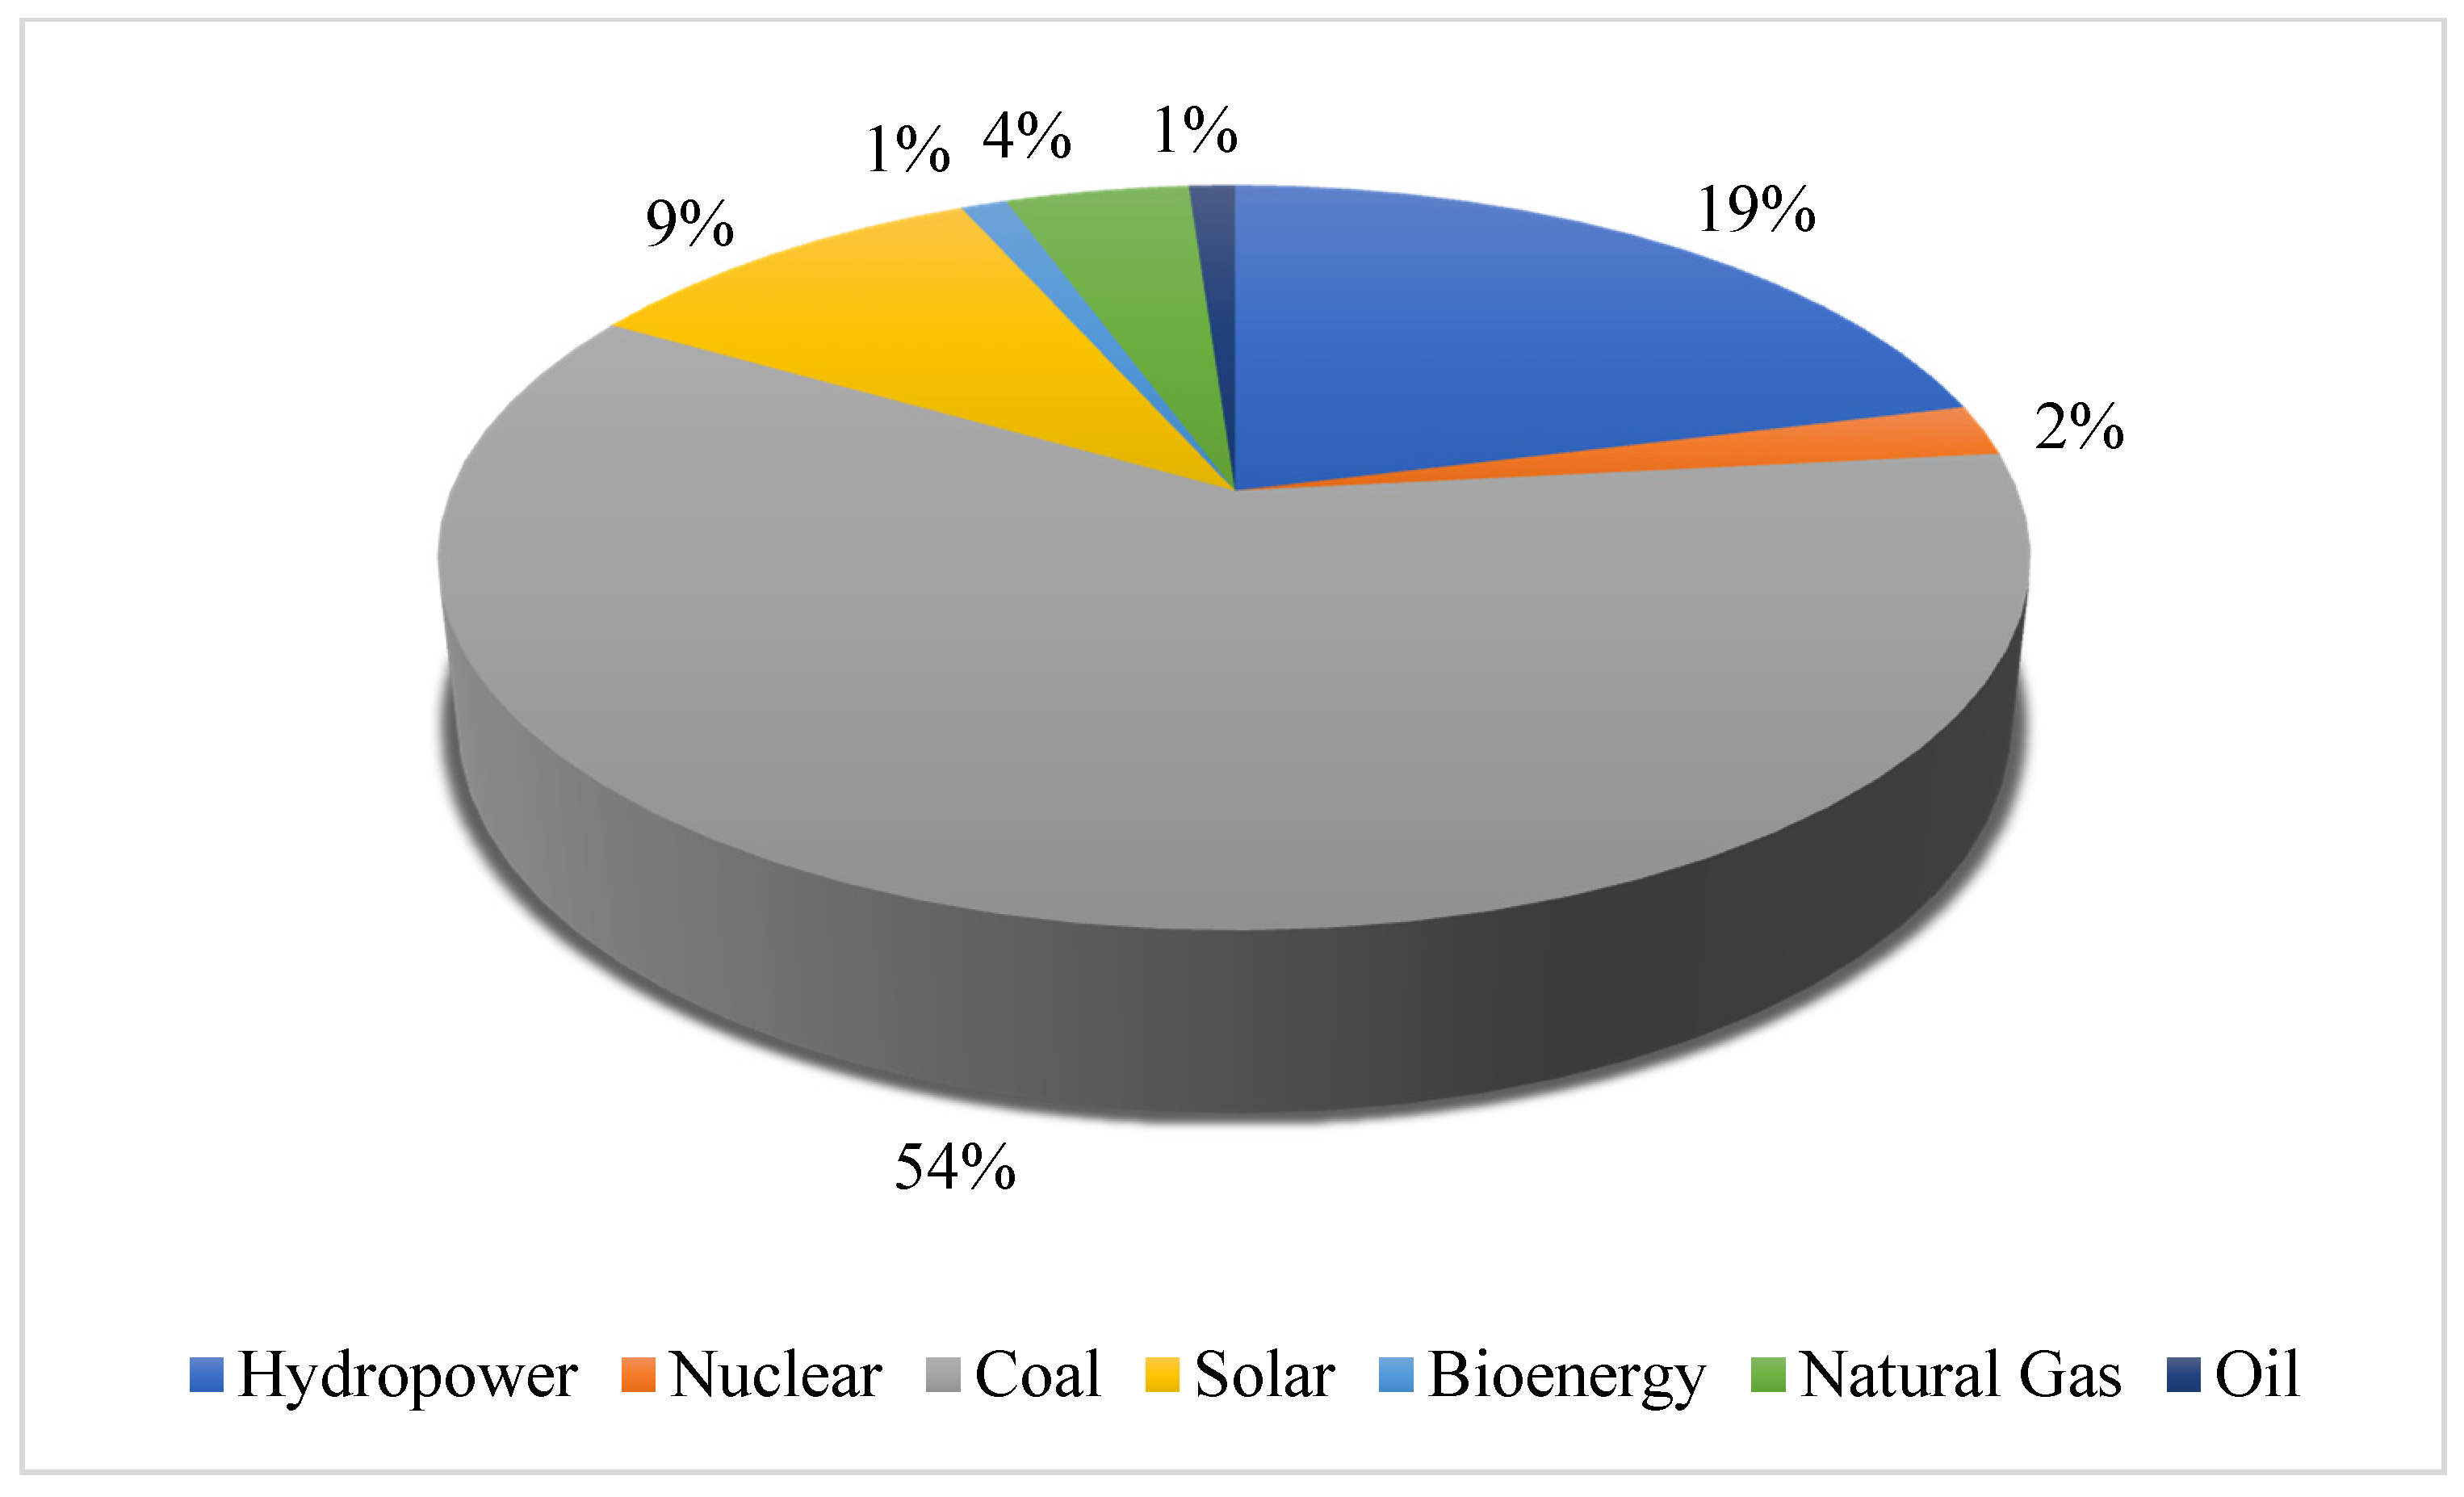
China’s Energy Generation Mix and the Need for CSP Development

China is identified as the world’s hungriest consumer relative to the consumption of energy; the country needed the energetic equivalent of about 3.3 billion tonnes of oil in 2019. China has burnt more coal since 2011 than all other countries combined. It is estimated that greenhouse gas emissions from China represent about one-quarter of the world emissions, which is the highest share of any country [36]. The country’s rapid population and economic growth in the past decade coupled with the growing manufacturing sector has turned it into an energy-hungry economy. Knowing the possible adverse effect fossil fuels has on the environment as well as the need to meet the increasing energy demand, the Chinese government has instituted plans and policies to help address the challenge. Science and technology have been identified as central to meeting these plans [36]. China’s energy generation mix as of 2018 is as shown in Figure 2.
China has been pursuing measures that will attract more investments from the private sector into its energy sector through the streamlining of project approval processes, the relaxation of some price controls, and the implementation of policies that expand the energy transmission infrastructure to connect demand and supply centers. The Chinese government therefore proposed to cap the use of coal at below 58% of the total primary energy consumption by 2020 in the quest to minimize GHG emissions [37].
In order to mitigate the country’s pollution crisis and at the same time also meet its energy demand, the country has invested heavily in its 2040 roadmap in the RE sector. China’s share in global energy use has been estimated to increase by 11%. China accounts for about 32.3% of the world’s RE usage. In 2017, the RE market in the country grew by over 15% [38].
The solar energy industry is dominated by photovoltaic (PV) technology, unlike other technologies, and this is not only limited to China, but is a global phenomenon. The development of PV power plants increased by 145-fold between 2010–2017; it increased from a mere 0.9 GW in 2010 to 130.25 GW by end of 2017 [38]. However, this technology has its drawbacks, as it operates only during the day. As a result, CSP technology has been proposed to replace both wind and solar PV technologies in some provinces in China. China is a country that has significant energy demands in the night due to the country’s huge industries, which PV technology is unable to provide. The instability and intermittency associated with PV technology can be overcome with CSP technology due to the latter’s thermal energy storage capabilities. The country’s legislature has therefore approved a five-year plan to generate some 5 GW of power from CSP technologies [38]. It is for this reason that this study is key for stakeholders in China’s RE sector, as it is expected to help them during decision-making and planning.

3. Methodology

This section covers the methodology that was adopted for the study. Both technical and financial metrics that were used for the simulation and analysis are discussed in this part of the study.

3.1. Power Cycle

There are three main thermo-mechanical cycles that can be used in solar thermal power plants. These include the Brayton cycle, the Rankine cycle, and the Stirling engine systems [40]. This study compares two of these cycles, i.e., supercritical CO2 recompression Brayton cycle and the Rankine cycle, using two different HTFs.

3.2. Modeling of the Power Plant

It has been estimated that the heliostat field alone constitutes about 30–50% of the investment capital of a plant [41,42]. As a result, enhancement and optimization of a CSP system’s efficiency is very critical due to its enormous costs. To that effect, choosing an appropriate geometrical heliostat characteristics during design can reduce the overall cost of the SPT [43]. The NREL’s Solar Power Tower Integrated Layout and Optimization Tool (SolarPILOT™) software handles the heliostat field layout by arranging the layout of the heliostat field by separately characterizing every potential heliostat position. Knowing the heliostat geometry, tower height, and the geometry of the receiver, the optimal heliostat positions can be automatically generated by SAM running the SolarPILOT™. The thermal performance of the receiver is modeled using semi-empirical heat transfer and thermodynamic relations [44]. The optimization algorithm of the solar field uses the SolarPILOT™ to produce the heliostat field layout as well as characterize the optical performance. The following procedures are followed [16]:
  • Gathering of data on the location of the plant, weather characteristics, parameters of the heliostat, receiver parameters, and parameters for the tower.
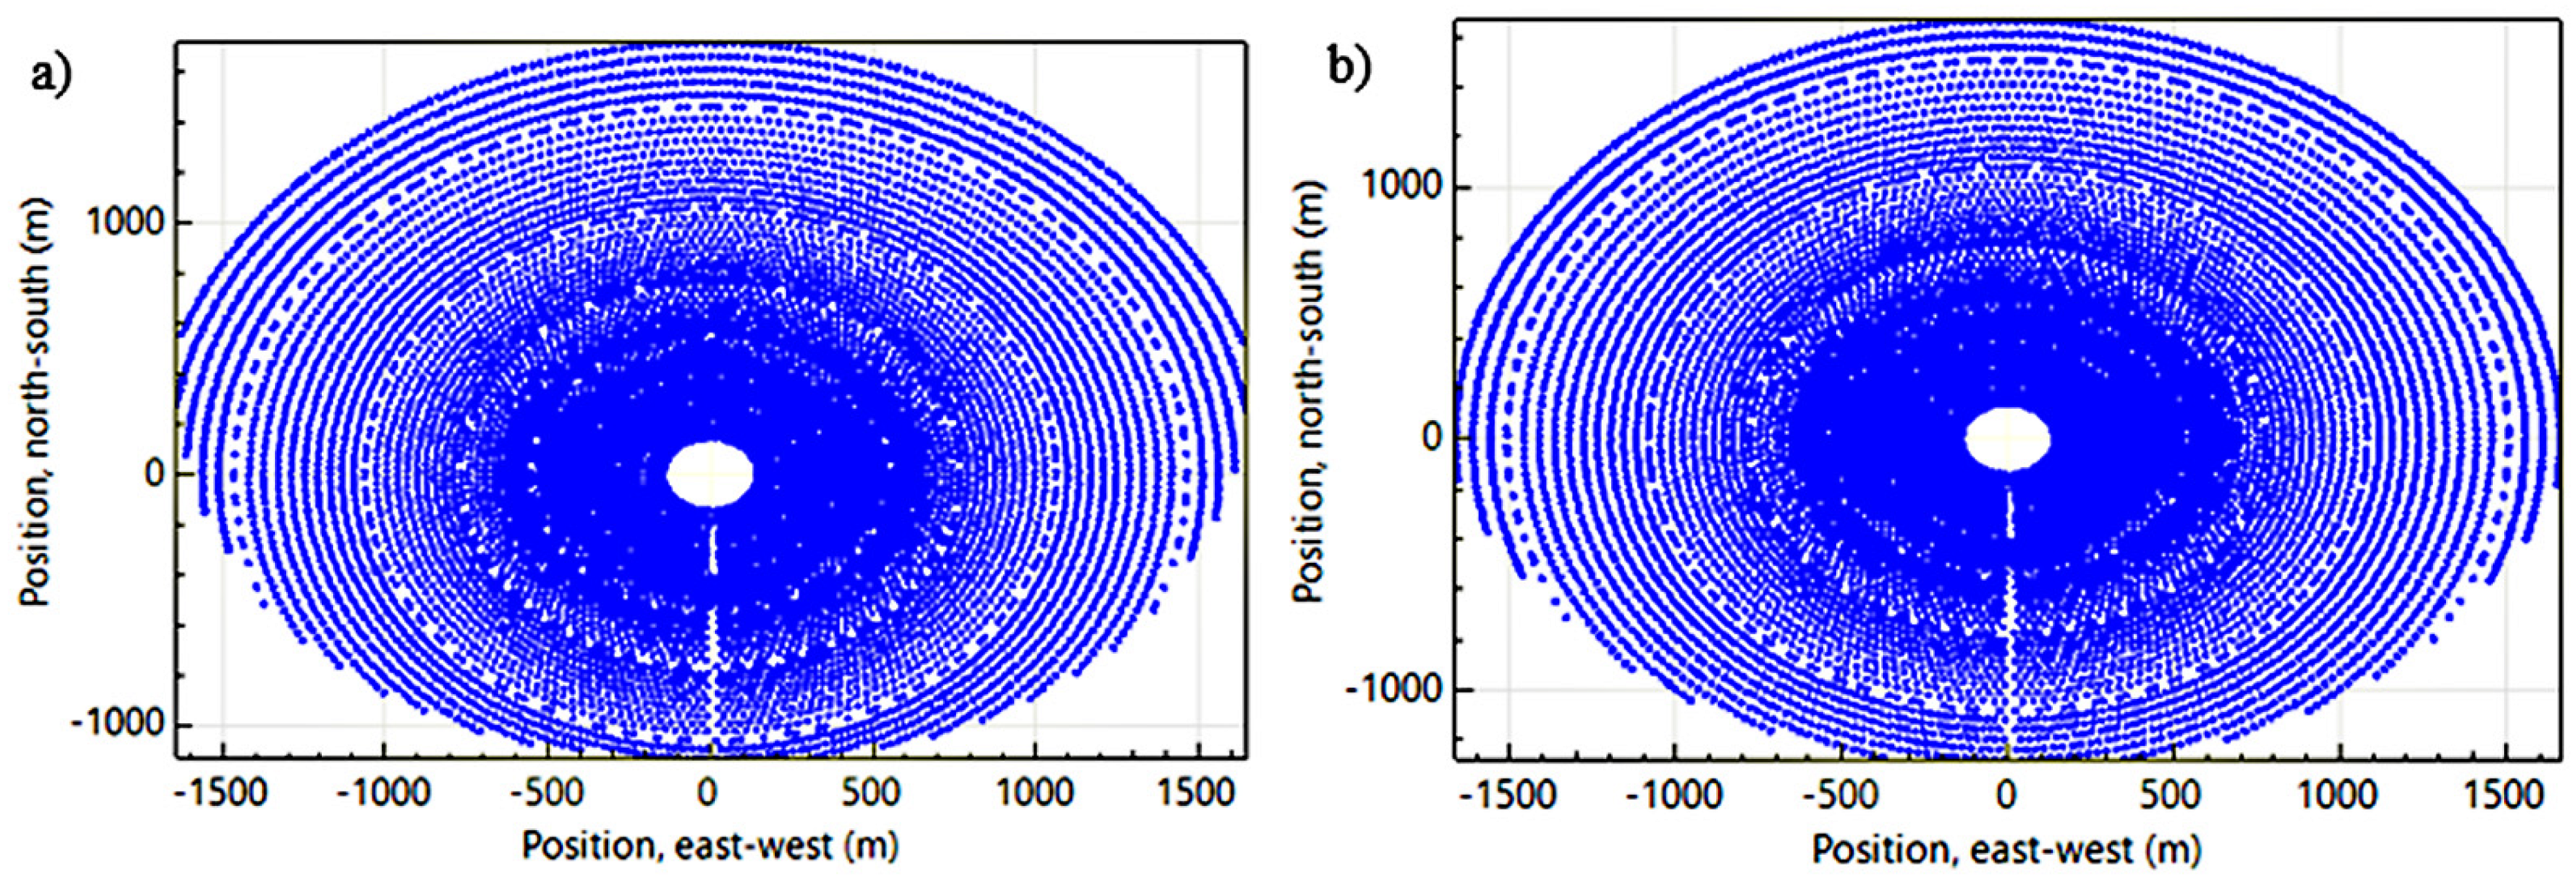
  • Generation of a set of potential positions for the heliostat by means of the “radial stagger” layout approach. This methodology positions the heliostat in rows with a constant radius. In this case, the center of the base of the tower becomes the center point and along the lines of constant azimuth angle.
  • Assessing the accessible heliostat positions by estimating the yearly performance for every heliostat, throughout the year, a set of about 25 time-steps are simulated and for each simulation, average weather profiles are used.
  • Collection of results of the simulation for each heliostat and then ranking of every heliostat relative to its annual output from the simulation.
  • Determination of the energy sent from the solar field to the receiver by running a reference point simulation at a reference condition.
  • Removal of the worst performing heliostats from the layout.
The optimized heliostat fields for both power cycles are represented in Figure 3. The technical parameters used for the simulation of both power cycles are presented in Table 1.

3.3. Economic Assessment Strategy

The financial models in the SAM software calculate various financial metrics for different power plants based on cash flows over a certain period for the power plant. The system’s electrical output calculated by the performance model is used by the financial model to evaluate the series of yearly cash flows. Power purchase agreement (PPA) projects in relation to power production sell electricity power purchase agreement at a fixed price with discretional time-of-delivery and annual escalation factors. SAM calculates the PPA price (electricity sales price), levelized cost of energy (LCOE), net present value (NPV), internal rate of return (IRR), and the debt fraction or debt service ratio. The model can either assess the IRR based on the specified rate of return or the power price [44].

3.3.1. Levelized Cost of Energy

The key objective function during the simulation of such systems (i.e., CSP plants) is the attempt to minimize as much as possible the LCOE over the lifetime of the project. Optimizing the power plant means finding the optimum solar multiple (SM) and TES capacity that result in the maximization of the economic benefits of the power plant, which in this case is the minimization of the LCOE [16]. In this study, the economics of the various power plants were analyzed using the LCOE; this can be calculated using Equation (1) [11,46,47,48,49] assuming a project lifetime of 25 years. A real discount rate of 10% [21,50] is used in this study.
L C O E = y = 1 t c s p U C E y ( 1 + d ) y × C R F
U C E y = T o t a l   a n n u a l   c o s t   i n   t h e   y t h   y e a r T o t a l   e n e r g y   g e n e r a t i o n   i n   t h e   y t h   y e a r
where U C E y represents the unit cost of electricity in year y and C R F is the capital recovery factor.
A total annual cost for a given year consists of the following expenditures: return on equity, operation and maintenance cost, interest in the working capital, principal amount of the loan, and the interest on the loan received.
C R F = d ( 1 + d ) t c s p ( 1 + d ) t c s p 1
The discount rate is represented by d ; this is the interest rate that was used in the discounted cash flow analysis in order to find the present value of future cash flows [48]. The lifetime of the CSP is denoted by t c s p .

3.3.2. Payback Period

The payback year for a project is the year when the cumulative net cash flow for that project turns from a negative value to positive. It is the period needed to attain a break-even point. It can be calculated using Equation (4) [21].
P a y b a c k   p e r i o d = T 1 1 + | i = 1 T 1 1 ( C I C O ) i | ( C I C O ) T i
where the cash inflow and outflow are denoted by C I and C O , respectively. T i denotes the project year i and i = T 0 + 1 T .

3.3.3. Net Present Value

In order to assess the bankability of the CSP project during the analysis period, the NPV shows the absolute and dynamic index by indicating a value greater or equal to zero. It can be computed using Equation (5) [11,21].
N P V = [ i T ( B i C i ( 1 + d ) i ) ] c a p i t a l   c o s t   o f   t h e   C S P   p l a n t
where B i = 8760 × purchase price of electricity delivered by the plant × capacity of the plant × CF and C i = capital investment of a CSP plant × Annual O&M cost. The financial parameters used in the analysis are presented in Table 2.
C F = A n n u a l   e l e c t r i c i t y   p r o d u c t i o n   ( M W h ) P l a n t   c a p a c i t y   ( M W ) × h o u r s   i n   t h e   y e a r × 100 %

4. Results and Discussion

The results from the simulation of the four different scenarios considered in this study are presented in this section. It consists of both technical and economic analysis for the supercritical CO2 recompression Brayton cycle and the Rankine cycle for the two HTF. For the purposes of the construction of the graphs, Salt (60% NaNO3 40% KNO3) HTF is represented by A, and Salt (46.5% LiF 11.5% NaF 42% KF) is denoted by B.

4.1. Technical Analysis

The technical performance of the various scenarios as simulated are presented in this section of the work, including a detailed analysis and comparison of the various options.

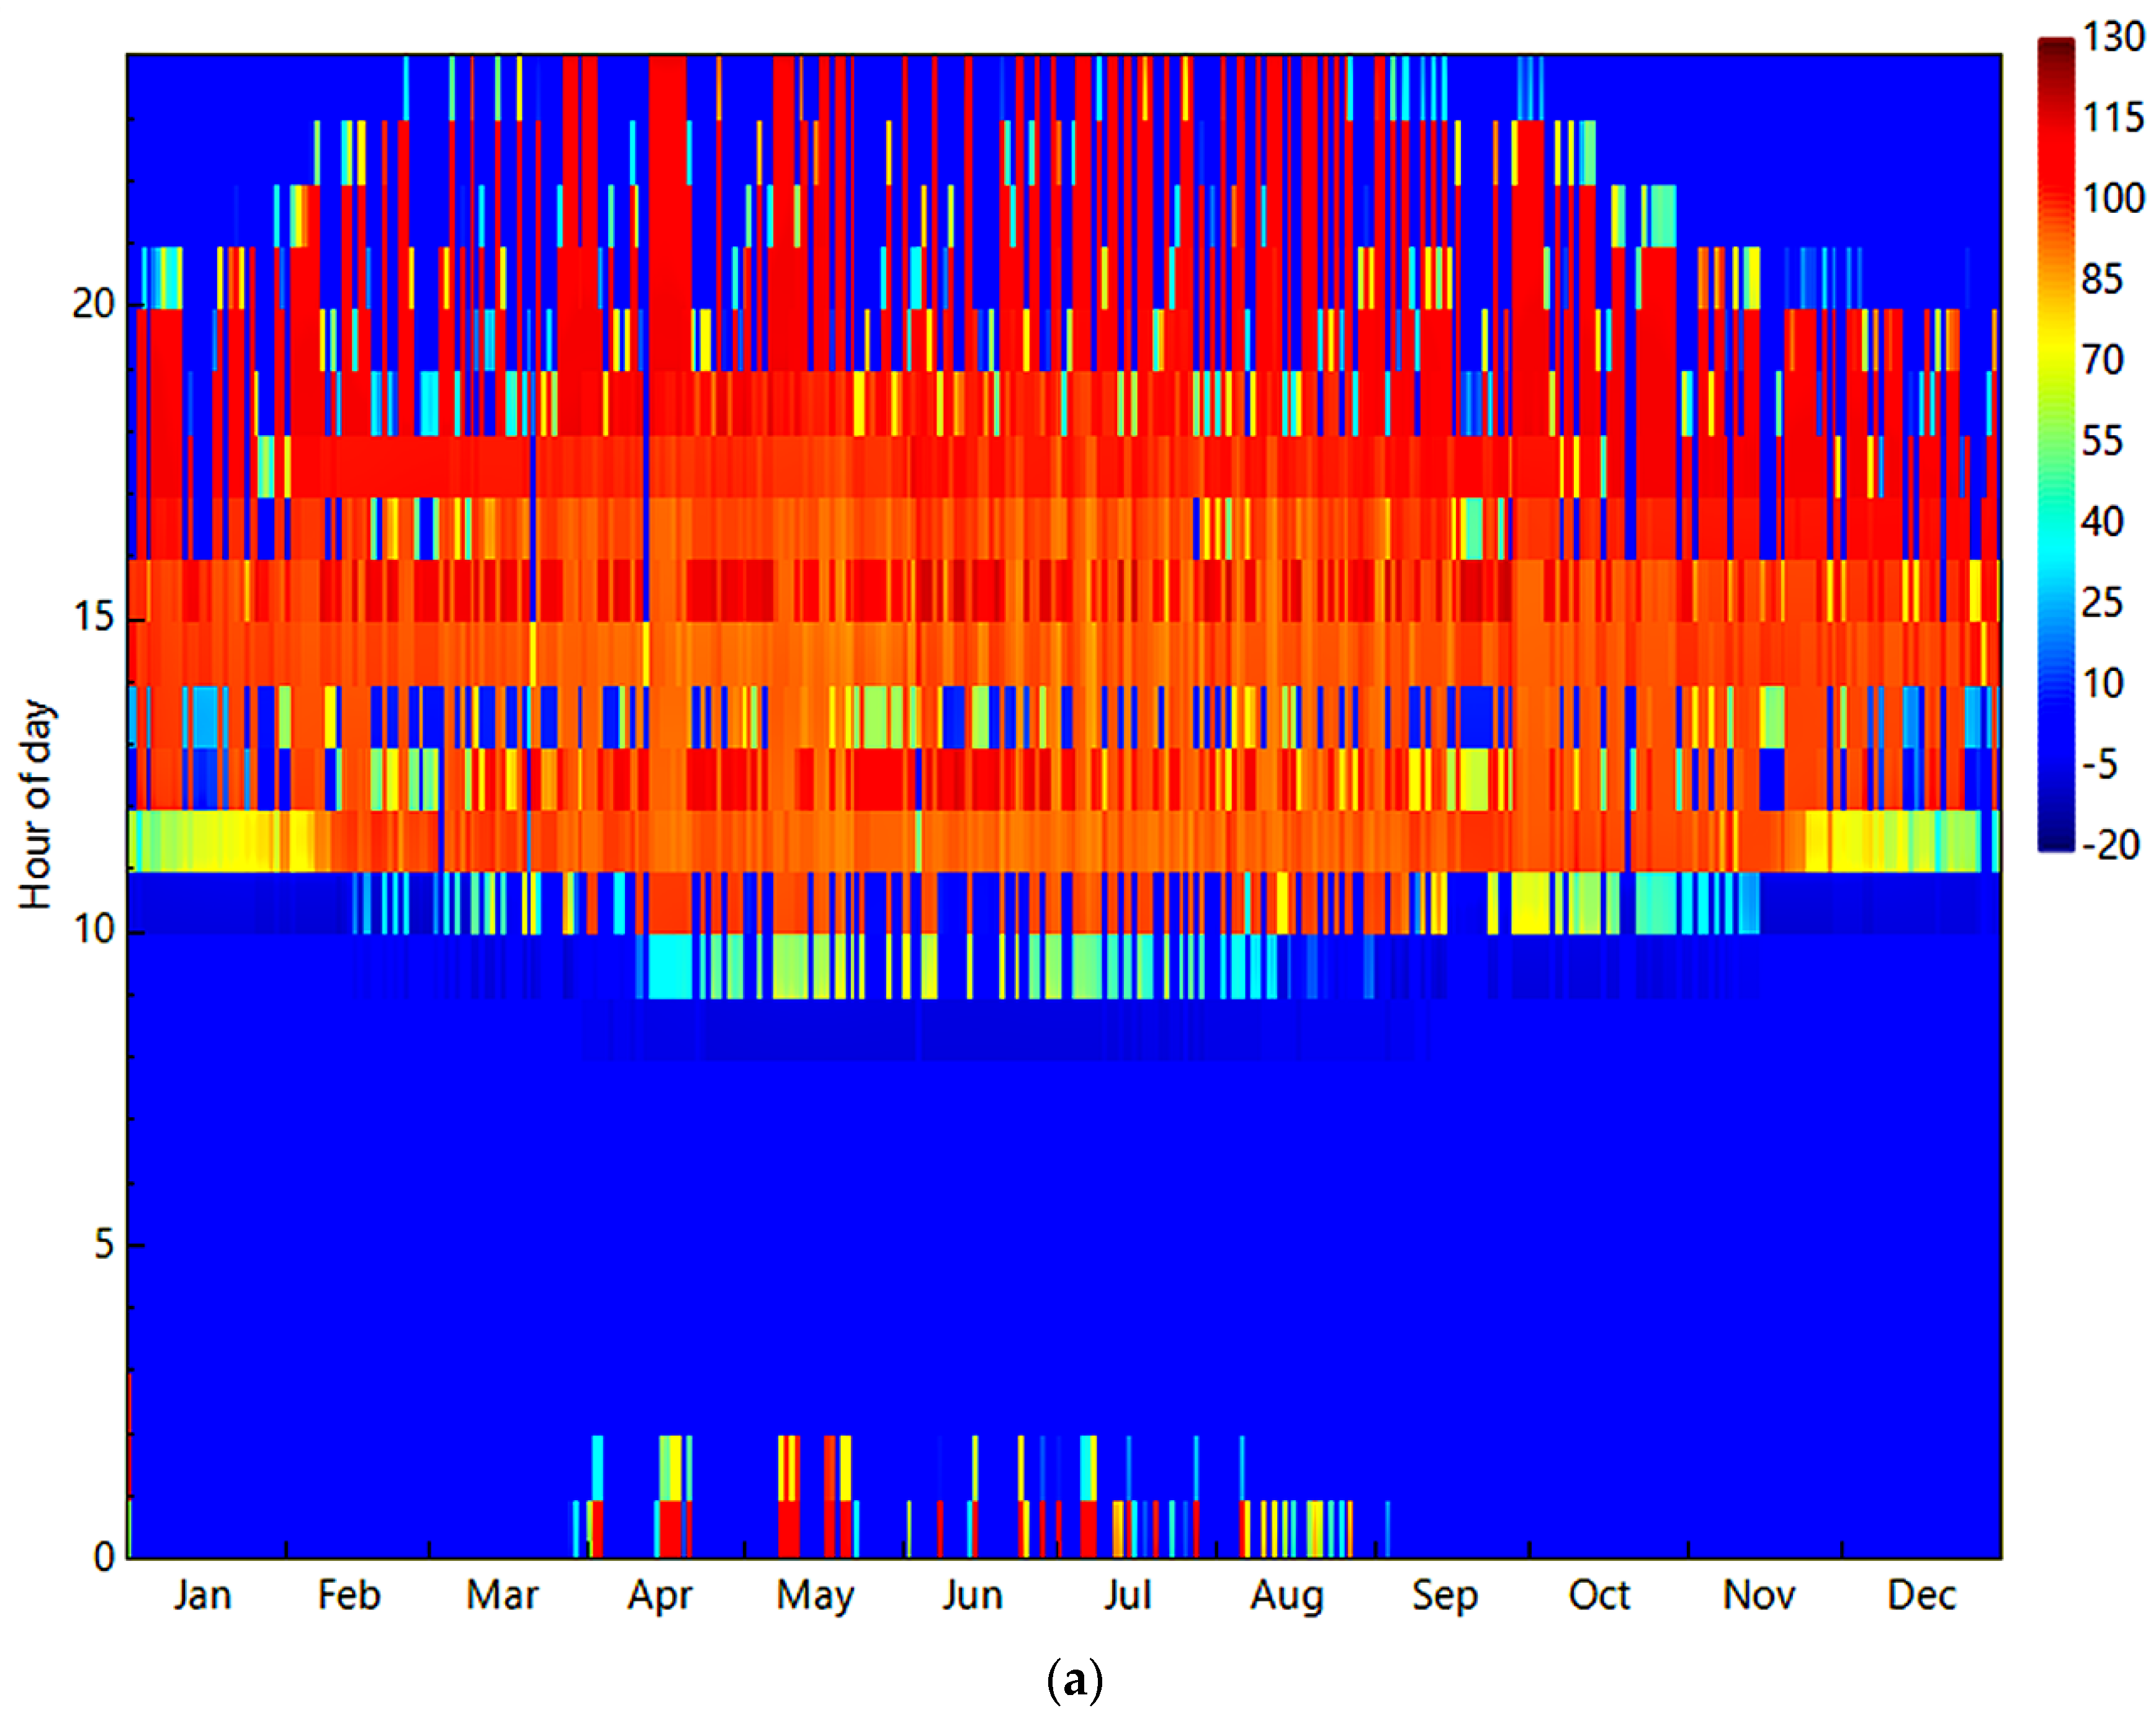
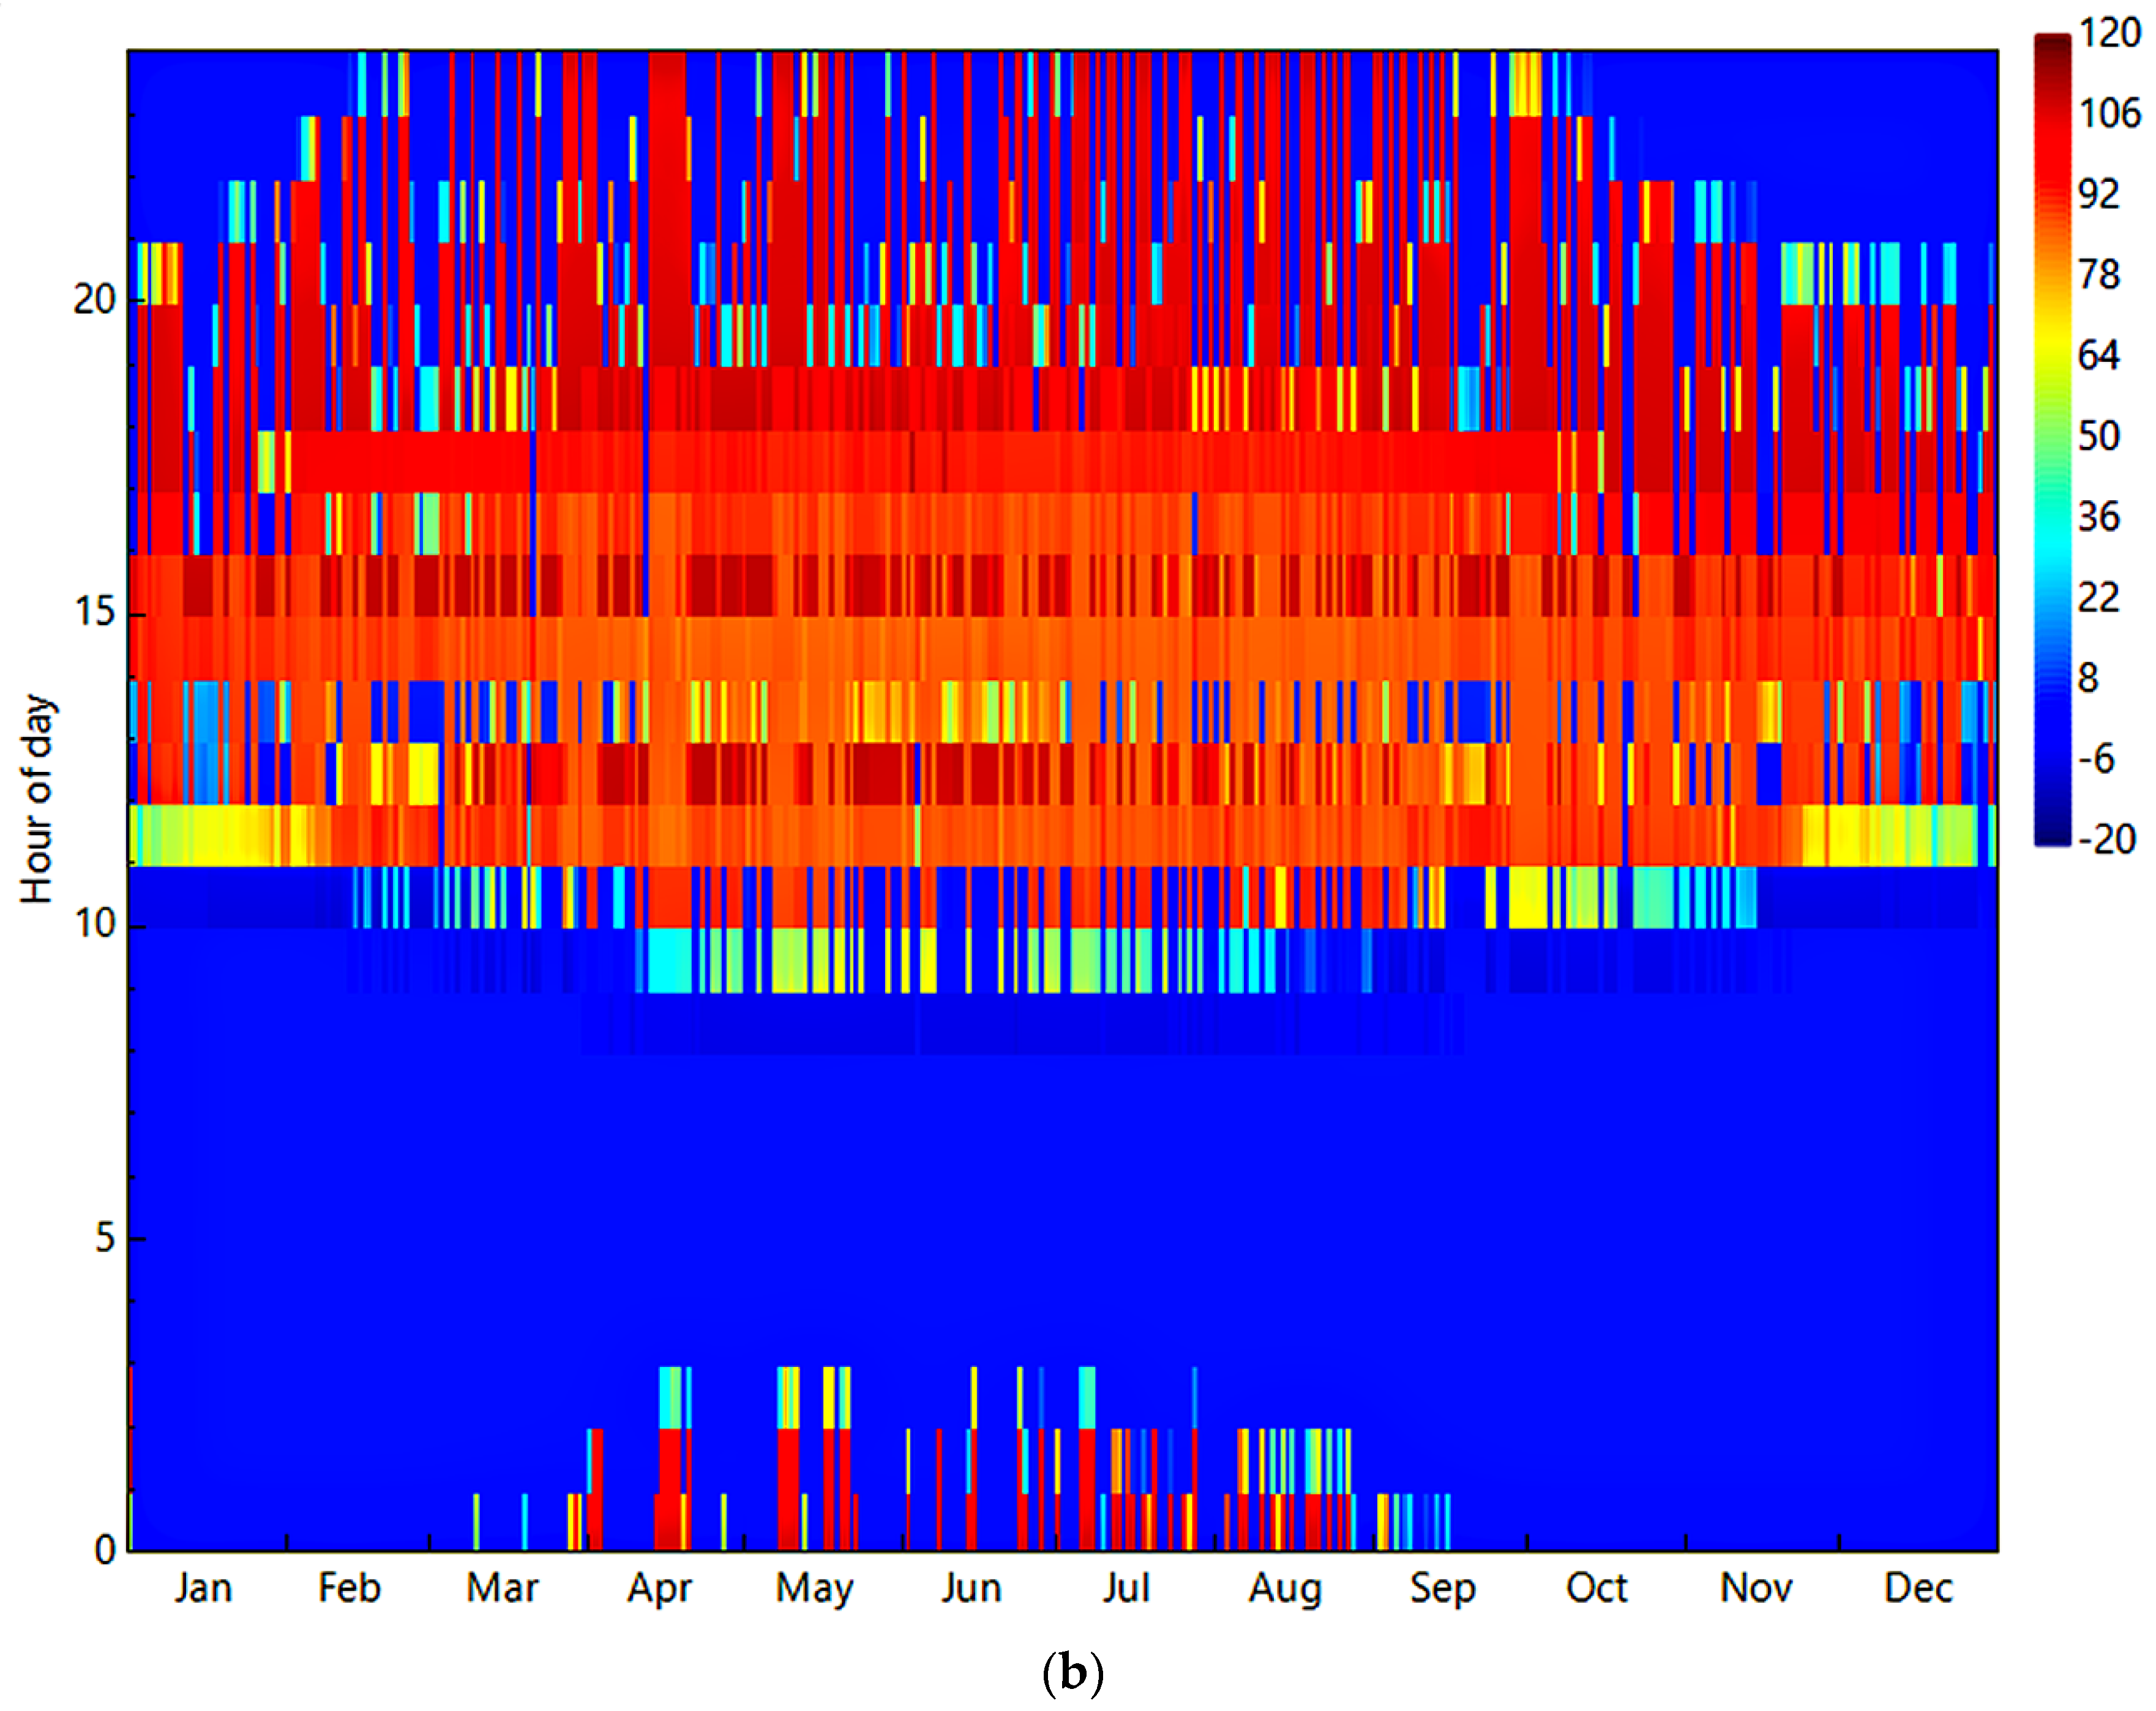
4.1.1. Weather Characteristics

The weather characteristics of the study area are represented in Figure 4. As indicated earlier, CSPs depend mainly on DNI for their energy generation. As indicated in the figure, the study area records the highest annual average DNI of 760 W/m2 around 2:00 p.m. while the lowest occurs in the night. The weather characteristics at the study area are very high for the construction of CSP technologies. According to the results, the study area records an annual average dry bulb temperature of around 11 °C, which is the highest at about 3:00 p.m., whereas the lowest annual average wet bulb temperature has been calculated to be around −2 °C and occurs at around 6:00 a.m.

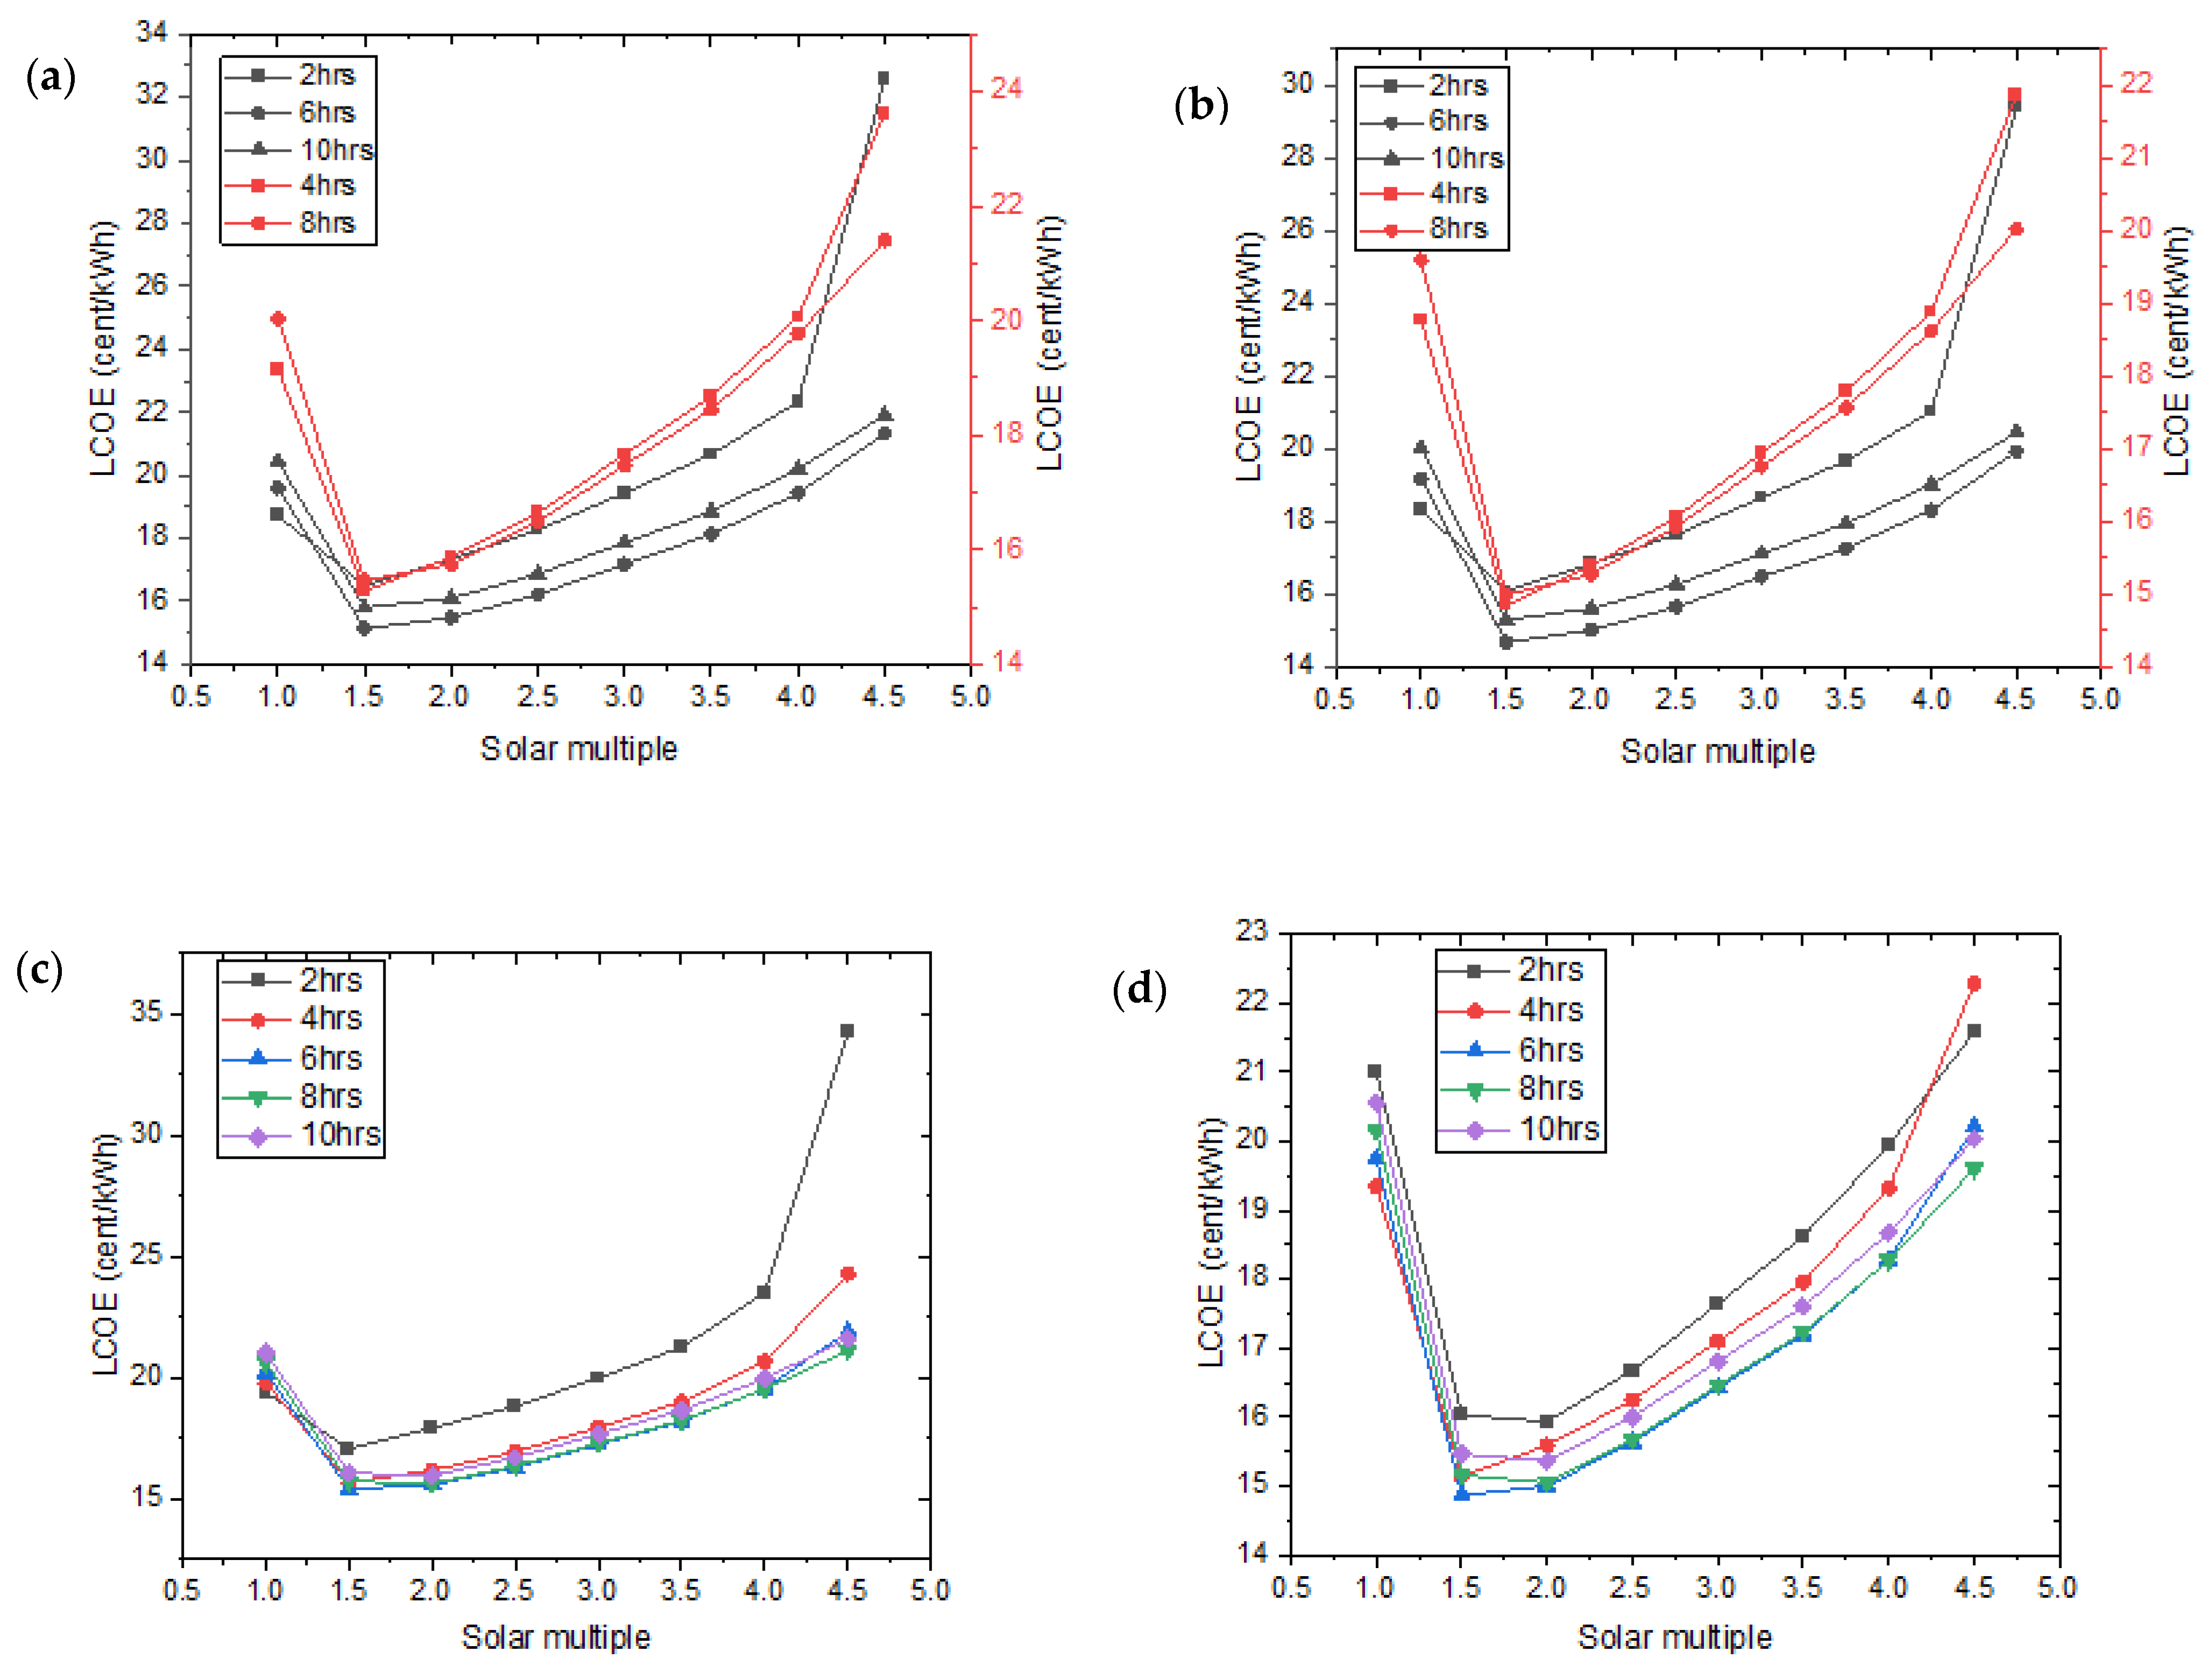
4.1.2. Effects of Solar Multiple and Full Load Hours of Storage

The effects of both full load storage hour and solar multiple on all scenarios are presented in Figure 5. TES systems are considered a critical aspect of CSP plants, because they not only provide dispatchable electricity but also provide stability in the electricity network when there is intermittency as a result of weather conditions or a high fraction of renewable production [51]. Optimization is key in the field of CSP plants, and this is realized by considering the lowest value of the LCOE that has the highest annual power production. In this study, we employed two key input parameters, i.e., full load hours of the TES and the solar multiple for the optimization of the various scenarios.
Data from the analysis indicate that the optimum full load hours for the TES is 6 h since under all scenarios for the different HTF and power cycles, the lowest LCOE was recorded under that condition. The optimum solar multiple was also identified to be 1.5, this is because as can be seen from the figures that all the various LCOEs for the different TES hours converge at that value.

4.1.3. Electricity Generated, Capacity Factors and Water Consumption

A total of 359 GWh of energy was generated by the sCO2 system with HTF B, whereas the sCO2 system with HTF A generated a total of 345 GWh in the first year. The Rankine system with HTF A generated a total of 341 GWh while the system with B as its HTF produced a total of 353 GWh of electricity in year one. Electricity to grid mainly occurs between 10:00 a.m. to 8:00 p.m. throughout the year. However, it moves beyond those hours during the summer periods with longer days. The systems with the sCO2 power cycle recorded the highest average electricity to grid compared to the systems with the Rankine power cycle; this is demonstrated in Figure 6.
From the simulations, CFs of 39% and 40.3% were recorded for HTF A and B, respectively, under the Rankine power cycle conditions. The sCO2 power cycle also recorded CFs of 41% and 39.4% for HTF A and B, respectively. The obtained CFs for all four scenarios are within the estimated CFs for various CSP plants around the world published by IRENA [52]. They also fall within the range of CFs recorded in [11]. Similarly, water consumption for the various scenarios are as follows: in the case of the Rankine system, HTF A and B consumed 81,699 m3 and 81,996 m3, respectively. The sCO2 system with HTF A and B also consumed 56,099 m3 and 55,551 m3, respectively. This means that the sCO2 system would save water compared to the Rankine system.

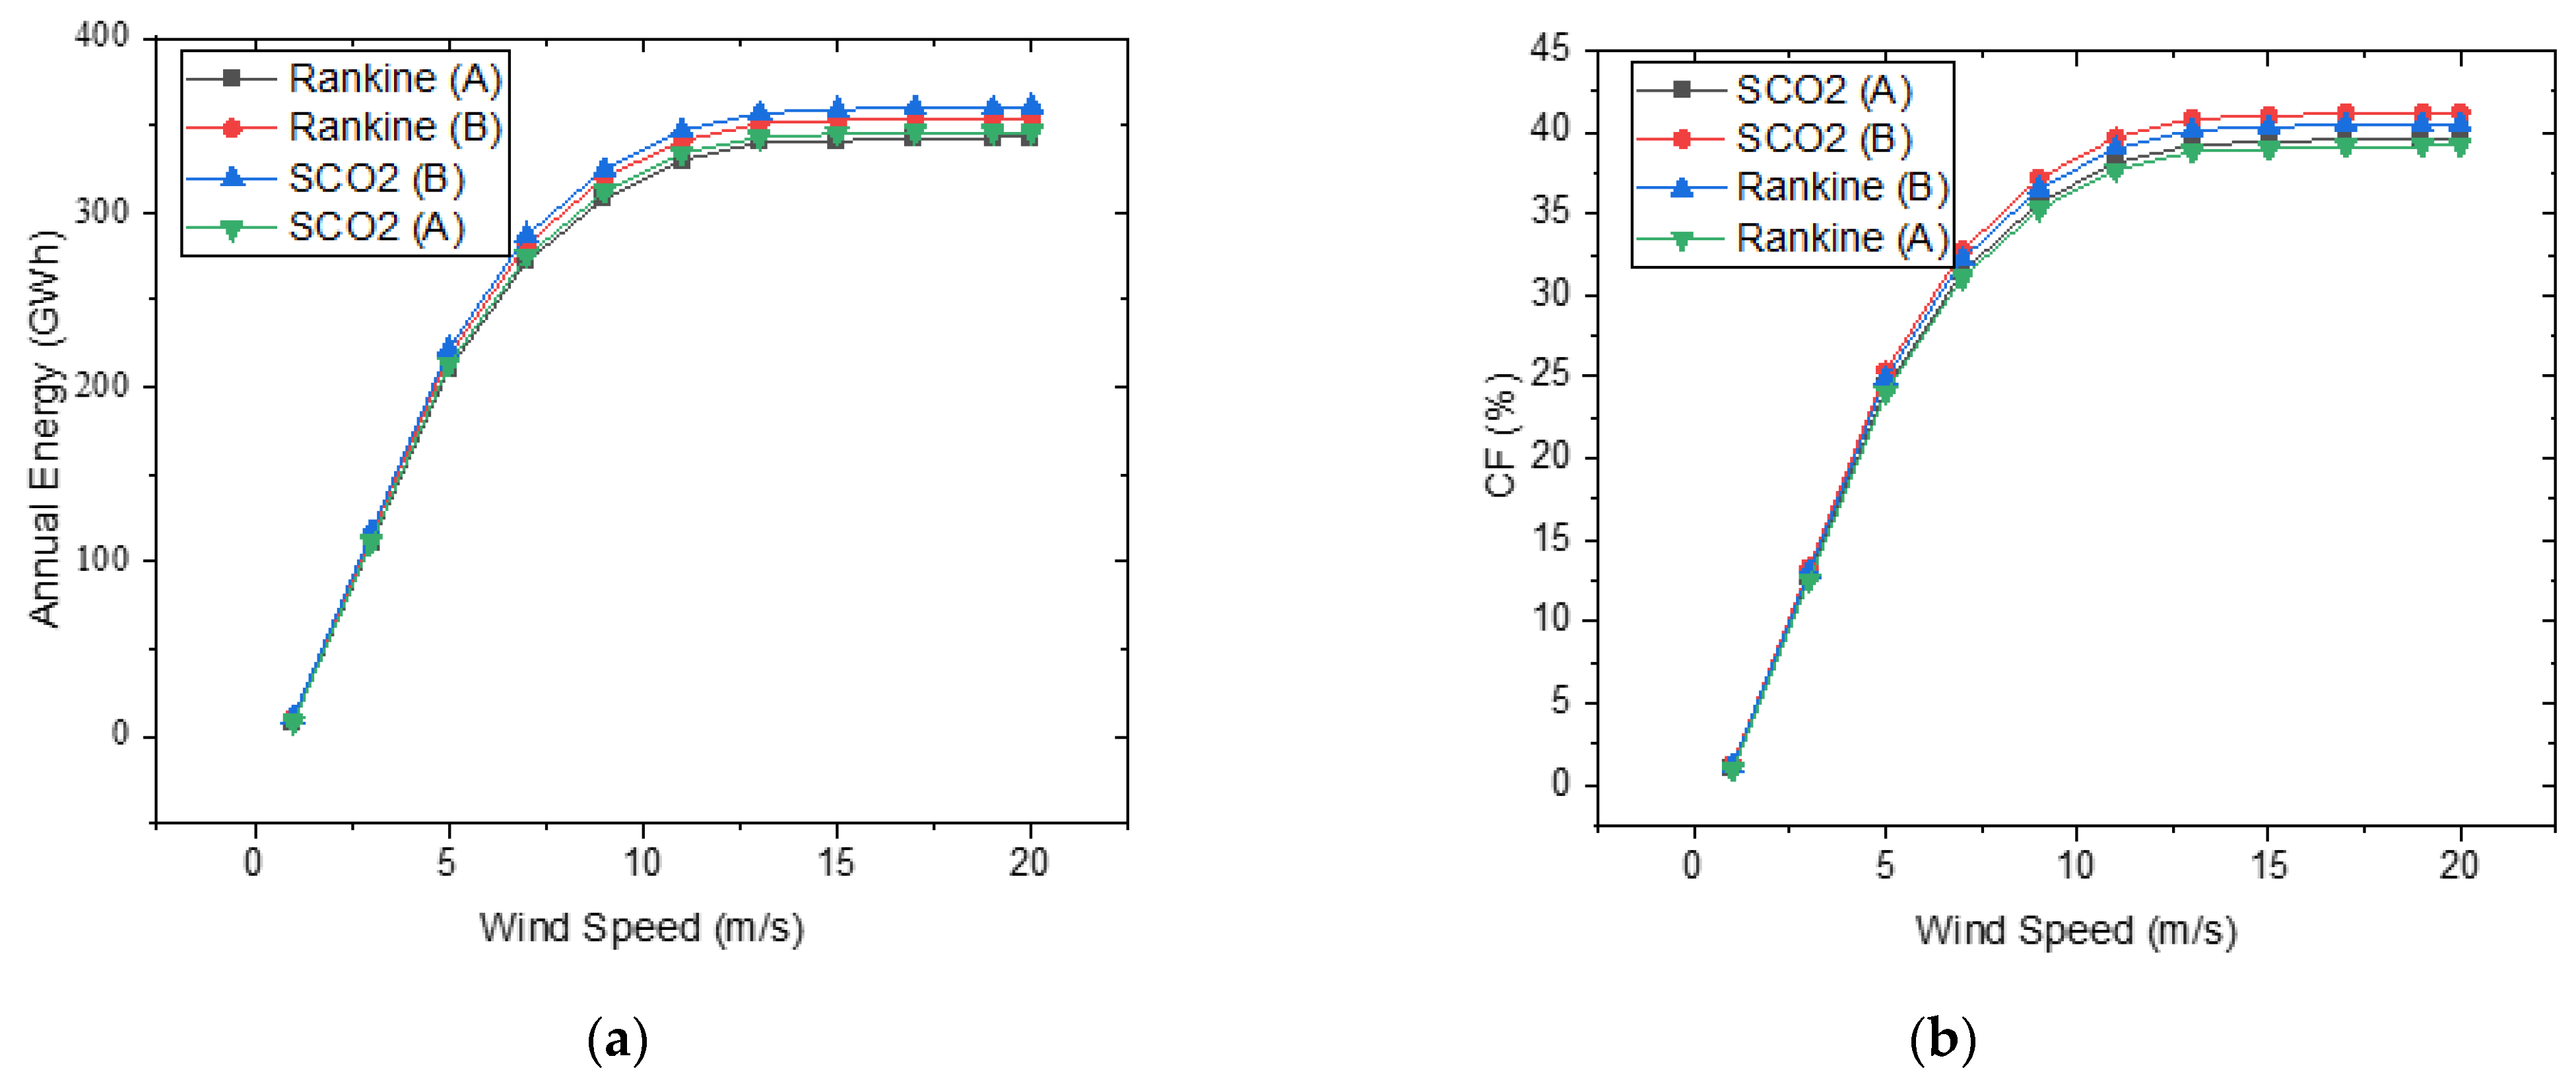
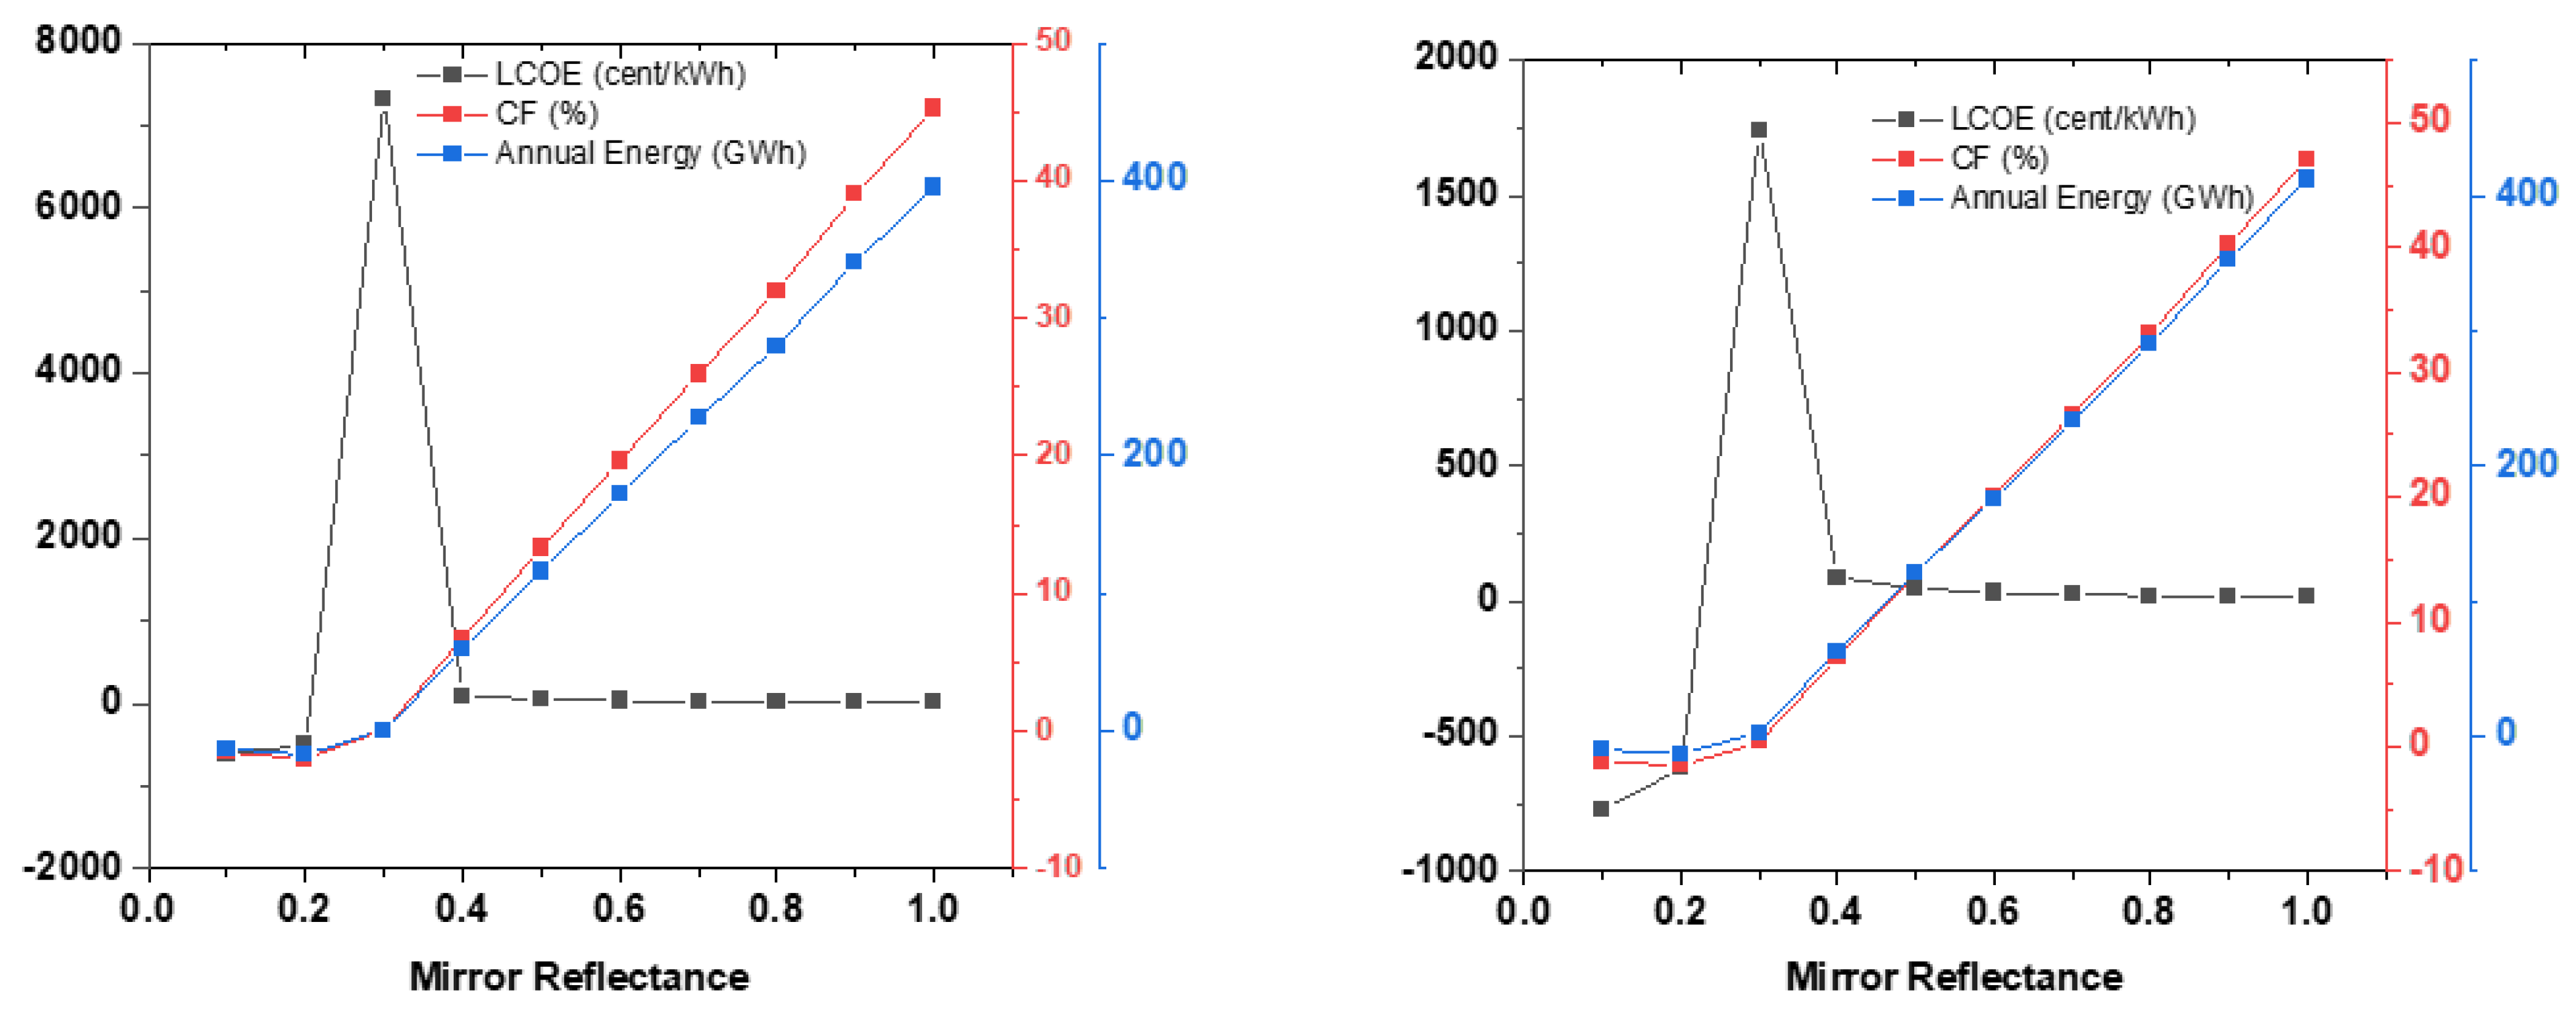
4.1.4. Parametric Analysis of Some Technical Parameters

A sensitivity analysis on certain parameters was conducted to assess their effect on the output of the various scenarios presented supra. A reduction in the design wind speed for parking heliostats in the stow position minimizes the heliostat field’s cost at the expense of a decrease in the harvested energy [53]. Simulations were therefore conducted to assess the effect of wind speed on the output of the plant. The effect of wind speed on the output performance of the power plants is presented in Figure 7. As can be seen from Figure 7a, the effect of wind stow speed on the annual energy generated is significant. It can be deduced from that figure that the optimum wind speed for all scenarios is approximately 12 m/s, beyond which the annual energy performance remains constant. Under this circumstance, the sCO2 power cycle system with HTF B generated the highest annual energy. This is because, as the results in Figure 7b show, the sCO2 with HTF B worked under the highest CF. It can also be seen from Figure 7a that a decrease in the wind stow speed from 10 m/s to 5 m/s can reduce the annual energy production by almost 50%.
The amount of solar radiation that can be redirected by the heliostat can be affected by the mirror reflectivity. This is basically as a result of the heliostat’s design specifications and condition [54]. Mirrors used in CSP technologies affect the thermal efficiency of the system’s collectors. Researchers have been trying to attain a solar mirror with an ideal reflectance of 1. However, such a situation is yet to come to realization even though a number of materials for the mirror’s reflecting surface has been proposed or developed [55]. Considering the importance of this parameter to the performance of the power plant, a sensitivity assessment was conducted on the mirror reflectance, and the outcome of it is reported in Figure 8 and Figure 9. According to the results from the study, the mirror reflectance has a significant effect on the performance of the CSP power plant. Mirror reflectances of 0.1 and 0.2 makes the project completely unfeasible, as they record negative CF, LCOE, and annual energy generation. The following LCOEs and CFs were obtained for the two scenarios under the Rankine power cycle for a mirror reflectance of 1: HTF A recorded 0.1442 USD/kWh with a CF of 45.23% while HTF B recorded 0.1386 USD/kWh with a CF of 47.05%. Similarly, in the case of the two scenarios under the sCO2 power cycle: HTF A recorded 0.1435 USD/kWh with a CF of 45.45% while HTF B recorded 0.1368 USD/kWh at a CF of 47.72%. Clearly, in terms of the optimum HTF, Salt (46.5% LiF 11.5% NaF 42% KF) comes first under both power cycles. The sCO2 power cycle, however, proved to be the best as it recorded the highest CF and annual energy generation.

4.2. Economic Analysis

The cost metrics for the various scenarios for the 100 MW CSP systems are presented in Table 3. According to the results, the highest LCOE (real) of 0.1668 USD/kWh was recorded under the Rankine cycle with HTF A. The lowest LCOE (real) of 0.1586 USD/kWh was obtained under the sCO2 cycle with HTF B. The obtained LCOE (real) for the modeled systems were slightly higher than the 0.116–0.125 USD/kWh obtained by [16] for a similar plant modeled under Tanzanian weather conditions. Agyekum and Velkin [11] also obtained 0.1367 USD/kWh and 0.1473 USD/kWh, slightly less than the results of this study. Sultan et al. [19] modeled a similar project under Kuwaiti weather conditions and obtained an LCOE of 0.150663 USD/kWh, which is slightly higher than the figures obtained in the current study. The slight differences in the LCOEs for the various reviewed literature and that recorded in this study could be attributed to a number of reasons, including the DNI values, financial parameters, and the solar multiple (SM). The figures of the other reviewed literatures were relatively smaller because they were optimized values for the corresponding SM. Optimization for this study is realized in subsequent sections which may affect the various parameters obtained in this section. It is also important to state that although the sCO2 cycle with Salt (46.5% LiF 11.5% NaF 42% KF) system recorded the lowest LCOE, the differences in the values for the other scenarios are relatively small. This therefore means that, economically, the two scenarios do not significantly change the viability of the project.

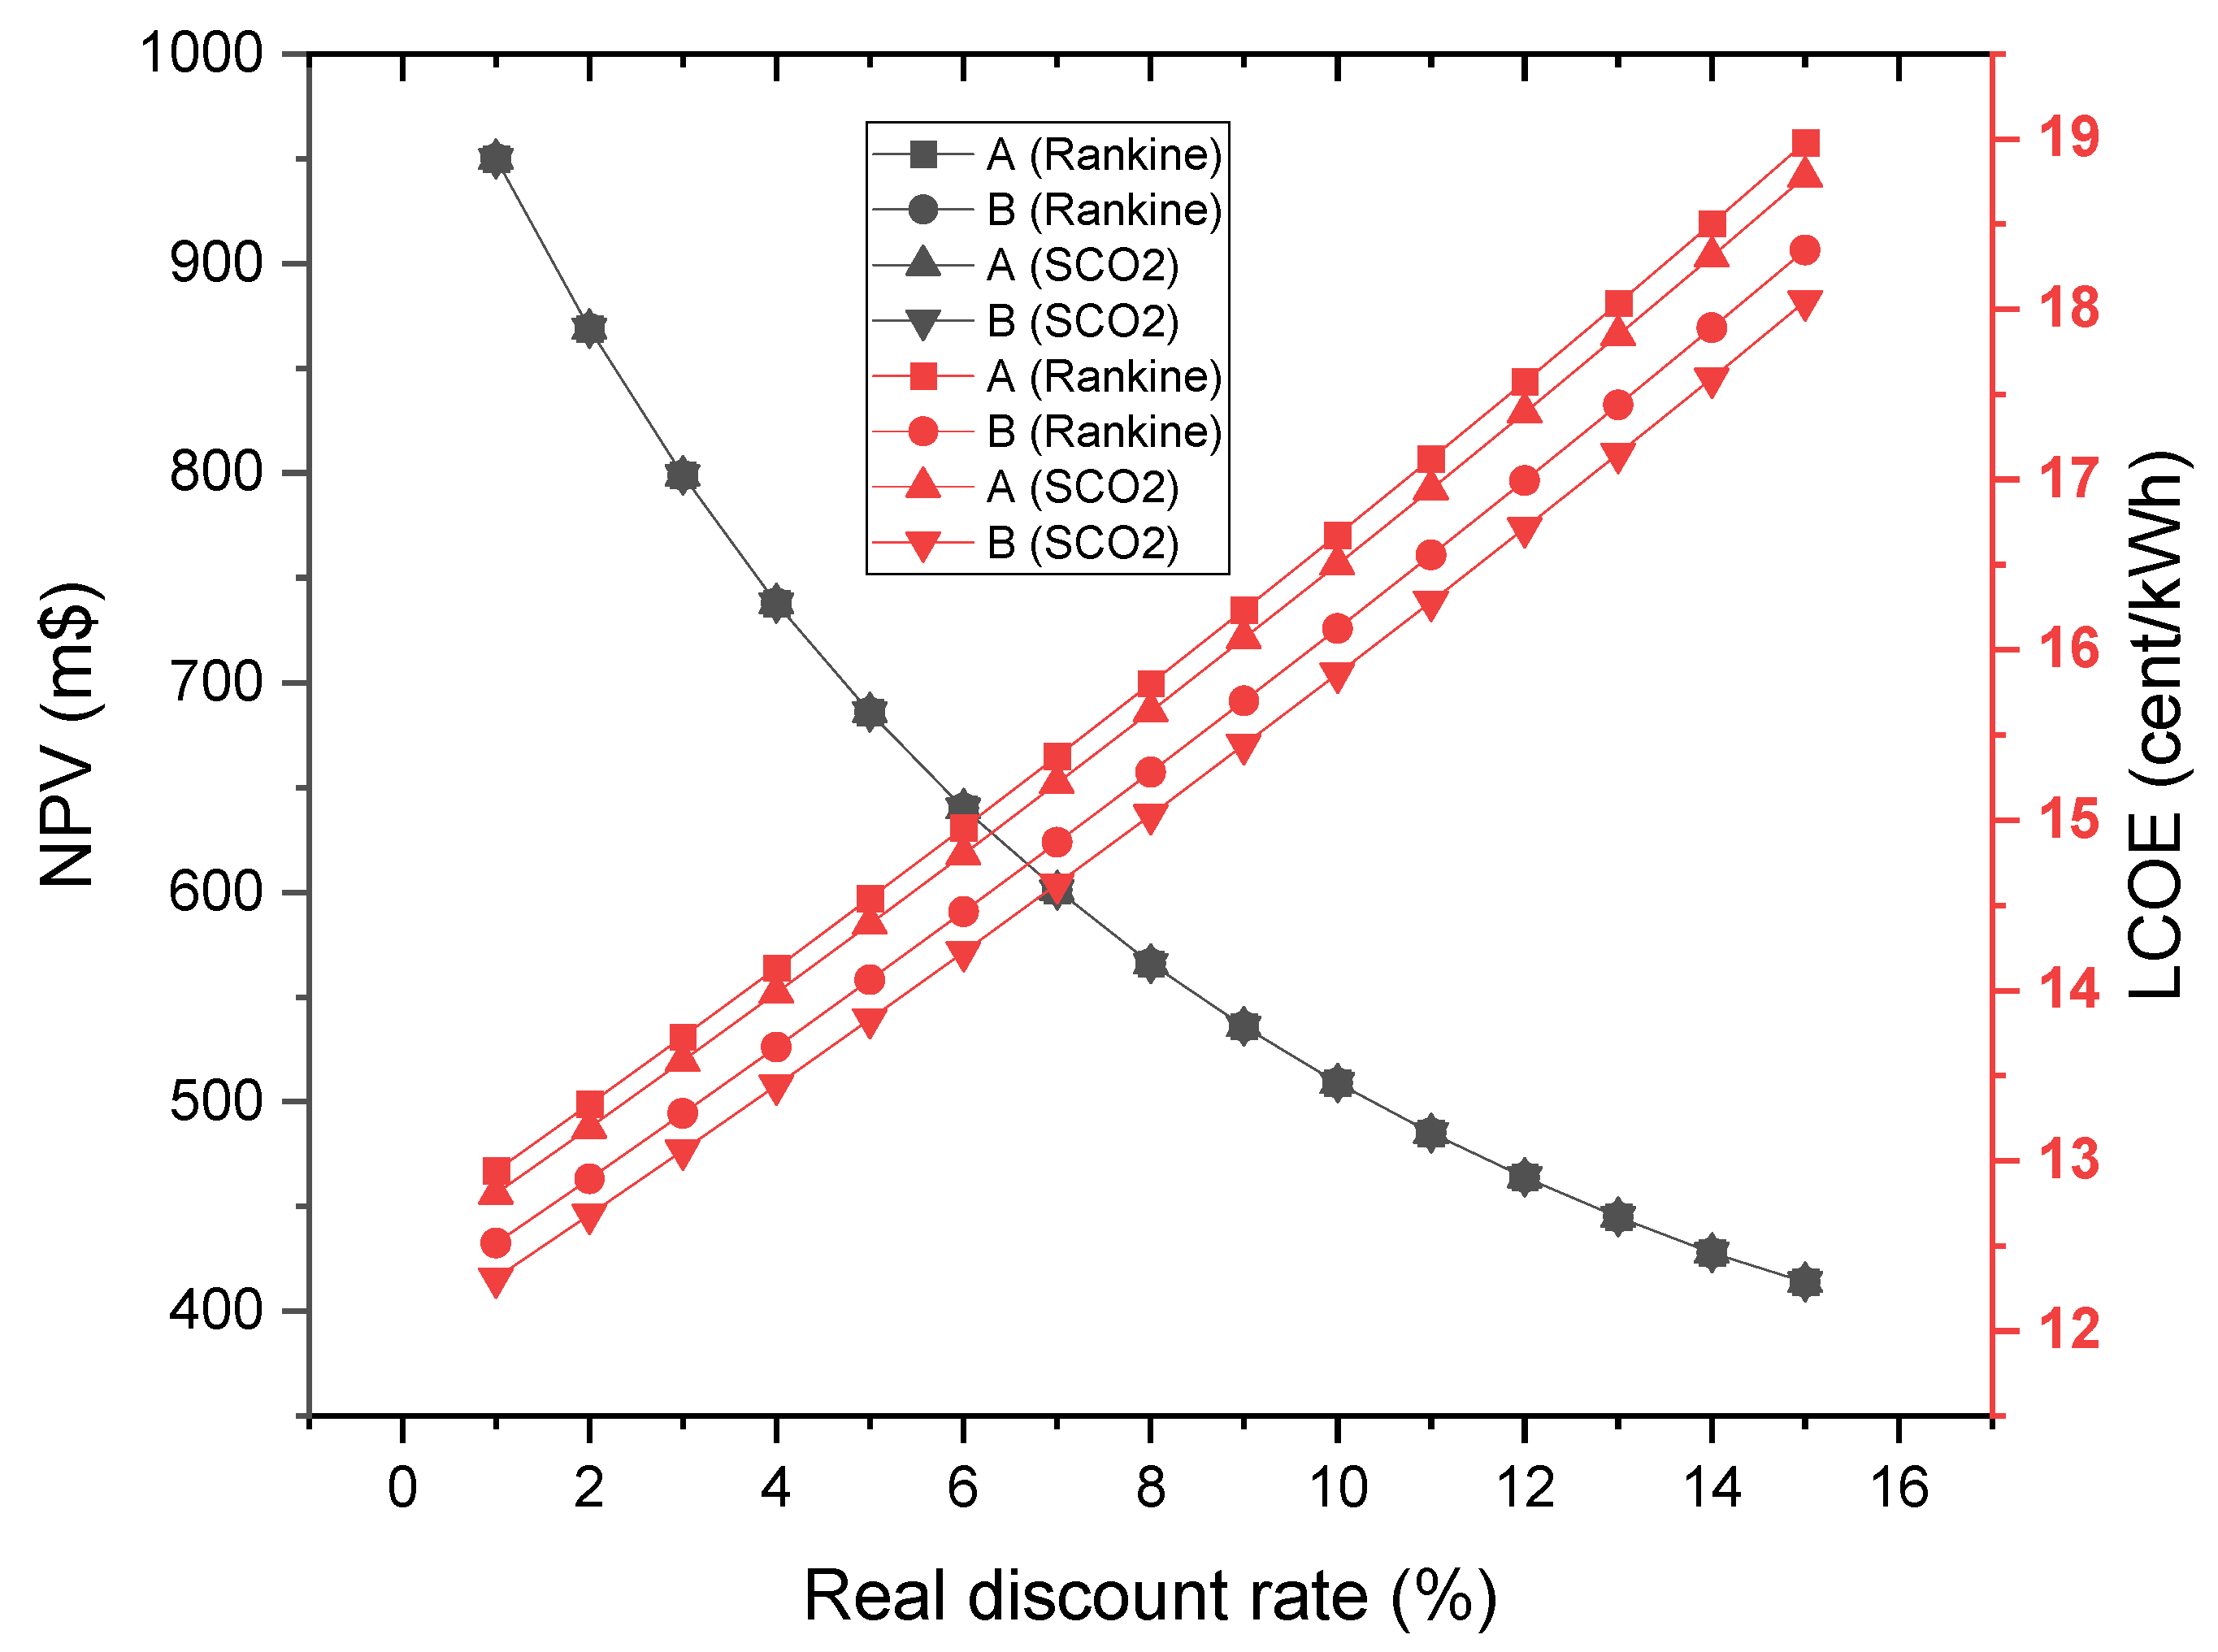
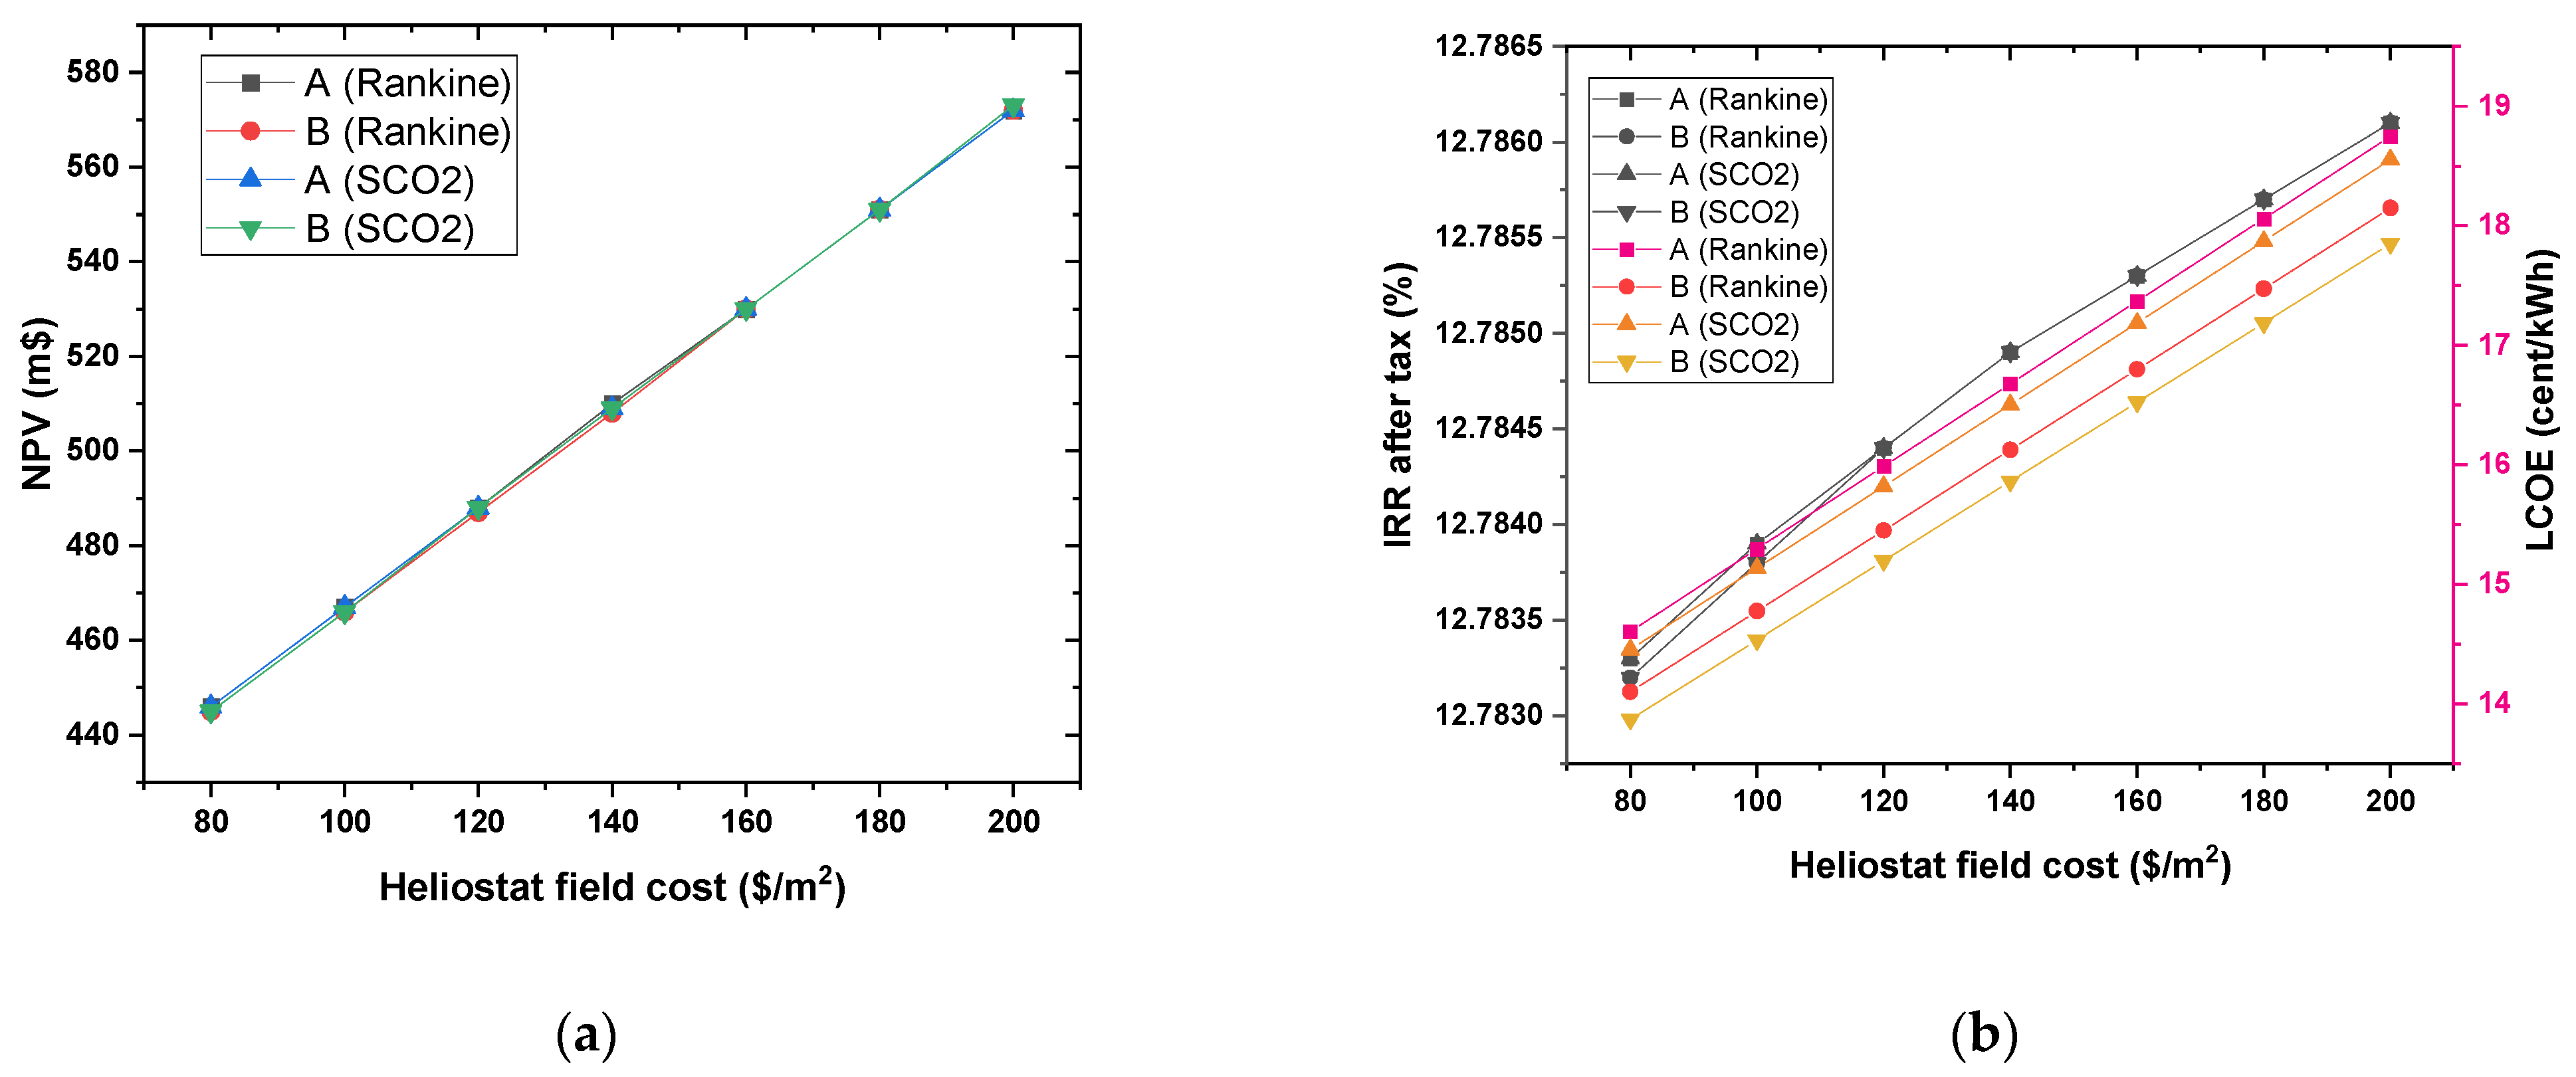
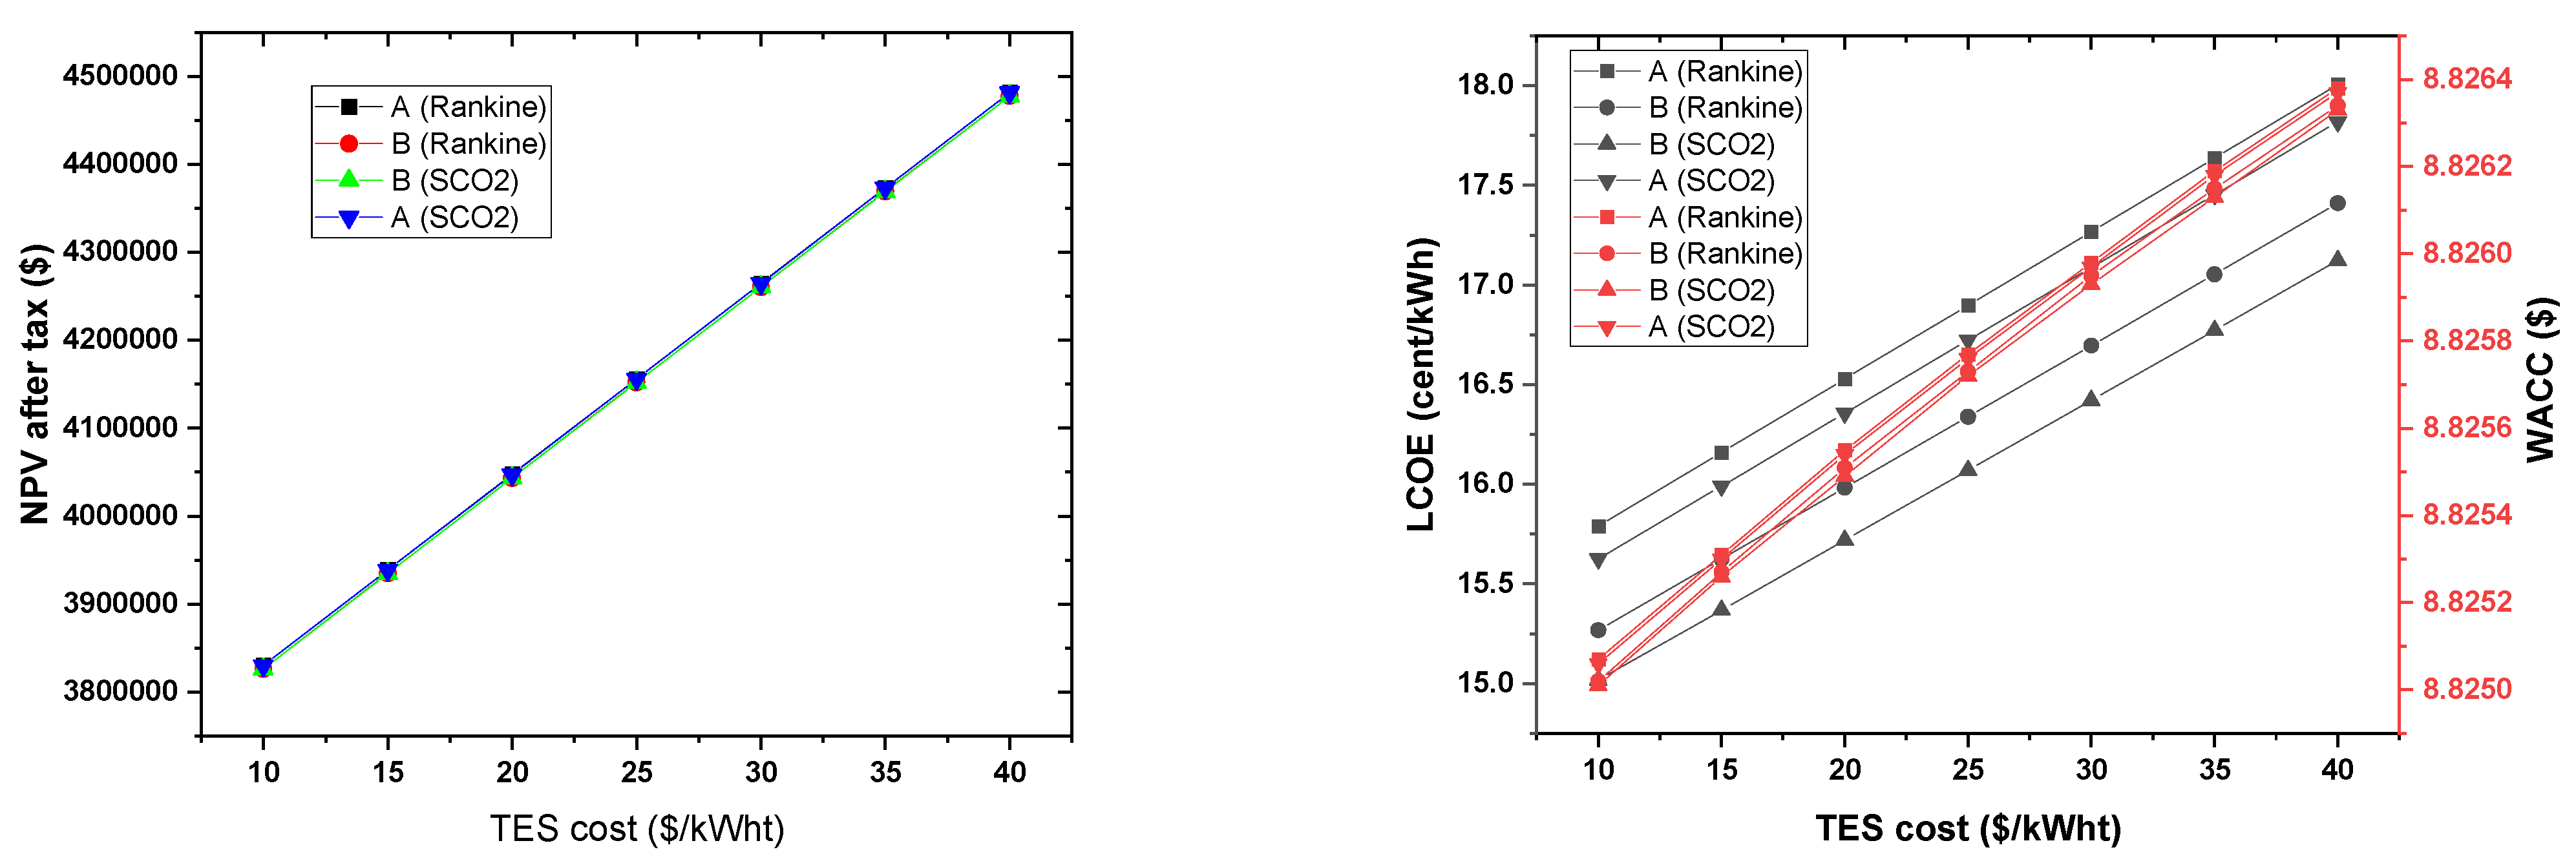
Sensitivity Analysis on Economic Parameters

An assessment of the effect of certain key financial parameters is key in this kind of analysis. It provides stakeholders the needed information during decision-making on the key areas to pay attention to during financial arrangements for such projects. A sensitivity analysis of some financial parameters such as, discount rate, heliostat field cost, and thermal energy storage cost were analyzed to find their effect on the viability of the various scenarios; this will also assist stakeholders to find the optimum inputs during planning. These parameters were selected as a result of their impact on the viability of such projects.
As indicated in Figure 10, the LCOE increases with an increasing real discount rate whereas the NPV decreases. This therefore suggests that, at a particular discount rate, the NPV for all four scenarios would fall to zero, which means the project will be unviable beyond that rate. The increasing rate of the LCOE with the discount rate also gives an indication to interested stakeholders on where to peg the discount rate during the financial arrangement of such projects in order to get the best consumer price in terms of cost of electricity and also good returns for the investor. The system that recorded the lowest LCOE is the sCO2 system with Salt (46.5% LiF 11.5% NaF 42% KF) as its HTF, whereas the Rankine system with Salt (60% NaNO3 40% KNO3) as its HTF recorded the highest LCOE. This means the sCO2 system with Salt (46.5% LiF 11.5% NaF 42% KF) would be the best option for the study area. The effect of the heliostat field cost on the economic viability of the project is represented in Figure 11. The results suggest that the heliostat field cost has an insignificant effect on the NPV (annual cost) and IRR after tax among all four scenarios but has an increasing effect on each scenario. However, in terms of the LCOE, similar trends as in the case of the effect of discount rate were observed.
The effect of TES cost on the viability of the various scenarios are represented in Figure 12. According to the results, the effect of TES cost is insignificant on the weight average cost of capital (WACC), as it remained virtually constant under varying TES costs. However, both NPV and LCOE increase significantly with increasing TES cost.

4.3. Comparative Studies

The current study is compared with other studies to assess the validity of the results obtained. A number of studies have already been conducted across the global using a similar approach, but this study also comes with a number of analyses that are lacking in previous studies. The scope of this work is more detailed, as it compares two different power cycles and two different HTFs. Table 4 presents some studies and their results. From the results from other studies, it is clear that the results obtained from this study are consistent with them and therefore valid. For instance, the study by Zhu et al. [56], which assessed the viability of three different technologies of CSP in China, indicates that the LCOE of all three technologies falls between 0.19–0.43 USD/kWh, which confirms what has been obtained in this study.

5. Conclusions and Future Research Recommendations

The development of CSP technologies is on the rise around the globe. CSP’s development in China is in its early stages, although there are some operational technologies. The rise in electricity demand due to the country’s huge industrialization coupled with the need to cut down on emissions has heightened the need to find alternative sources of energy generation. Authorities in the country have proposed the development of CSP technology in China due to its huge potential in the country. This study was conducted to assess the cost-benefits and technical performance of a 100 MW solar tower power plant in Tibet, China. Although there are few studies that have assessed the techno-economics of CSP technologies in China, none exist in the manner and approach under which this study was conducted. The current study compares two different HTF systems in two different power cycles, i.e., sCO2 and Rankine, with detailed technical and economic comparisons providing interested stakeholders and researchers ample information during planning stages. Results from the study suggest that the Rankine power cycle with HTF A and B recorded CFs of 39% and 40.3%, respectively. The sCO2 power cycle recorded CFs of 41% and 39.4% for HTF A and HTF B, respectively. A total of 359 GWh of energy was generated by the sCO2 system with HTF B, whereas the sCO2 system with HTF A generated a total of 345 GWh in the first year. The Rankine system with HTF A generated a total of 341 GWh, while the system with B as its HTF produced a total of 353 GWh of electricity. Electricity to grid mainly occurs between 10:00 a.m. to 8:00 p.m. throughout the year. According to the results, the highest LCOE (real) of 0.1668 USD/kWh was recorded under the Rankine cycle with HTF A. The lowest LCOE (real) of 0.1586 USD/kWh was obtained under the sCO2 cycle with HTF B. In general, all scenarios were economically viable at the study area, but the sCO2 proved to be more economically feasible according to the simulated results.
This study therefore recommends the following. Firstly, the obtained LCOE from the various scenarios are still costly and implementing such projects under the conditions used in this study will make the cost of power expensive for consumers. The Chinese government can reduce the cost of power from such projects through the provision of low-interest loans, incentives, and tax waivers to investors in the CSP sector. Secondly, improvement in the efficiencies of the various components that form CSP power plants will help in reducing the costs associated with the production of energy from such facilities. It is therefore important for the government and all other interested stakeholders to invest in research and development in the CSP sector.
Even though this work comes in a more detailed form relative to some other studies, it has its limitations, which must be highlighted for future studies. This study did not consider the cost of land during the analysis; thus, it is recommended to assess the effect of cost of land on the bankability of the project in future studies. Moreover, it will be important to assess the effect of meteorological parameters such as precipitation and cloud cover on the technical and economic performance of power plants.

Author Contributions

Conceptualization, E.B.A.; methodology, E.B.A.; software, E.B.A.; validation, E.B.A., T.S.A., F.V.B., N.M.K. and M.K.P.; formal analysis, E.B.A.; investigation, E.B.A.; resources, E.B.A.; data curation, E.B.A., T.S.A., F.V.B., N.M.K. and M.K.P.; writing—original draft preparation, E.B.A.; writing—review and editing, E.B.A., T.S.A., F.V.B., N.M.K. and M.K.P.; visualization, E.B.A.; project administration, E.B.A.; funding acquisition, E.B.A. and N.M.K. All authors have read and agreed to the published version of the manuscript.

Funding

This research received no external funding.

Institutional Review Board Statement

Not applicable.

Informed Consent Statement

Not applicable.

Data Availability Statement

Data used for the study are available in the text.

Conflicts of Interest

The authors declare no conflict of interest.

Abbreviations

CFCapacity factor
CSPConcentrated solar plant
DNIDirect normal irradiation
GHGGreenhouse gases
HTFHeat transfer fluid
IRRInternal rate of return
NPVNet present value
PPAPower purchase agreement
PVPhotovoltaic
STPPSolar thermal power plants
WACCWeight average cost of capital
kWhKilowatt hour

References

  1. Agyekum, E.B. Energy poverty in energy rich Ghana: A SWOT analytical approach for the development of Ghana’s renewable energy. Sustain. Energy Technol. Assess. 2020, 40, 100760. [Google Scholar] [CrossRef]
  2. Agyekum, E.B.; Nutakor, C. Feasibility study and economic analysis of stand-alone hybrid energy system for southern Ghana. Sustain. Energy Technol. Assess. 2020, 39, 100695. [Google Scholar] [CrossRef]
  3. Segura, E.; Morales-Herrera, R.; Somolinos, J. A strategic analysis of tidal current energy conversion systems in the European Union. Appl. Energy 2018, 212, 527–551. [Google Scholar] [CrossRef]
  4. Agyekum, E.B.; Amjad, F.; Mohsin, M.; Ansah, M.N.S. A bird’s eye view of Ghana’s renewable energy sector environment: A Multi-Criteria Decision-Making approach. Util. Policy 2021, 70, 101219. [Google Scholar] [CrossRef]
  5. Adebayo, T.S.; Awosusi, A.A.; Kirikkaleli, D.; Akinsola, G.D.; Mwamba, M.N. Can CO2 emissiovns and energy consumption determine the economic performance of South Korea? A time series analysis. Environ. Sci. Pollut. Res. 2021. [Google Scholar] [CrossRef]
  6. Adebayo, T.S.; Kalmaz, D.B. Determinants of CO2 emissions: Empirical evidence from Egypt. Environ. Ecol. Stat. 2021, 28, 1–24. [Google Scholar] [CrossRef]
  7. Agyekum, E.; PraveenKumar, S.; Eliseev, A.; Velkin, V. Design and Construction of a Novel Simple and Low-Cost Test Bench Point-Absorber Wave Energy Converter Emulator System. Inventions 2021, 6, 20. [Google Scholar] [CrossRef]
  8. Qaisrani, M.A.; Fang, J.; Jin, Y.; Wan, Z.; Tu, N.; Khalid, M.; Rahman, M.U.; Wei, J. Thermal losses evaluation of an external rectangular receiver in a windy environment. Sol. Energy 2019, 184, 281–291. [Google Scholar] [CrossRef]
  9. Petrollese, M.; Cocco, D.; Cau, G.; Cogliani, E. Comparison of three different approaches for the optimization of the CSP plant scheduling. Sol. Energy 2017, 150, 463–476. [Google Scholar] [CrossRef]
  10. Shivashankar, S.; Mekhilef, S.; Mokhlis, H.; Karimi, M. Mitigating methods of power fluctuation of photovoltaic (PV) sources—A review. Renew. Sustain. Energy Rev. 2016, 59, 1170–1184. [Google Scholar] [CrossRef]
  11. Agyekum, E.B.; Velkin, V.I. Optimization and techno-economic assessment of concentrated solar power (CSP) in South-Western Africa: A case study on Ghana. Sustain. Energy Technol. Assess. 2020, 40, 100763. [Google Scholar] [CrossRef]
  12. Baba, Y.F.; Ajdad, H.; Al Mers, A.; Bouatem, A.; Idrissi, B.B.; El Alj, S. Preliminary cost-effectiveness assessment of a Linear Fresnel Concentrator: Case studies. Case Stud. Therm. Eng. 2020, 22, 100730. [Google Scholar] [CrossRef]
  13. Reuters. Heat Transfer Fluids: Key to CSP Success|Reuters Events|Renewables. 2013. Available online: https://www.reutersevents.com/renewables/csp-today/technology/heat-transfer-fluids-key-csp-success (accessed on 1 November 2020).
  14. Vignarooban, K.; Xu, X.; Arvay, A.; Hsu, K.; Kannan, A. Heat transfer fluids for concentrating solar power systems—A review. Appl. Energy 2015, 146, 383–396. [Google Scholar] [CrossRef]
  15. Hernández, C.; Barraza, R.; Saez, A.; Ibarra, M.; Estay, D. Potential Map for the Installation of Concentrated Solar Power Towers in Chile. Energies 2020, 13, 2131. [Google Scholar] [CrossRef]
  16. Aly, A.; Bernardos, A.; Fernández-Peruchena, C.M.; Jensen, S.S.; Pedersen, A.B. Is Concentrated Solar Power (CSP) a feasible option for Sub-Saharan Africa?: Investigating the techno-economic feasibility of CSP in Tanzania. Renew. Energy 2019, 135, 1224–1240. [Google Scholar] [CrossRef]
  17. Hakimi, M.; Baniasadi, E.; Afshari, E. Thermo-economic analysis of photovoltaic, central tower receiver and parabolic trough power plants for Herat city in Afghanistan. Renew. Energy 2020, 150, 840–853. [Google Scholar] [CrossRef]
  18. Mihoub, S.; Chermiti, A.; Beltagy, H. Methodology of determining the optimum performances of future concentrating solar thermal power plants in Algeria. Energy 2017, 122, 801–810. [Google Scholar] [CrossRef]
  19. Sultan, A.J.; Hughes, K.J.; Ingham, D.B.; Ma, L.; Pourkashanian, M. Techno-economic competitiveness of 50 MW concentrating solar power plants for electricity generation under Kuwait climatic conditions. Renew. Sustain. Energy Rev. 2020, 134, 110342. [Google Scholar] [CrossRef]
  20. Li, Y.; Liao, S.; Rao, Z.; Liu, G. A dynamic assessment based feasibility study of concentrating solar power in China. Renew. Energy 2014, 69, 34–42. [Google Scholar] [CrossRef]
  21. Islam, T.; Huda, N.; Saidur, R. Current energy mix and techno-economic analysis of concentrating solar power (CSP) technologies in Malaysia. Renew. Energy 2019, 140, 789–806. [Google Scholar] [CrossRef]
  22. Hirbodi, K.; Enjavi-Arsanjani, M.; Yaghoubi, M. Techno-economic assessment and environmental impact of concentrating solar power plants in Iran. Renew. Sustain. Energy Rev. 2020, 120, 109642. [Google Scholar] [CrossRef]
  23. Ling-Zhi, R.; Xin-Gang, Z.; Xin-Xuan, Y.; Yu-Zhuo, Z. Cost-benefit evolution for concentrated solar power in China. J. Clean. Prod. 2018, 190, 471–482. [Google Scholar] [CrossRef]
  24. Zhao, Z.-Y.; Chen, Y.-L.; Thomson, J.D. Levelized cost of energy modeling for concentrated solar power projects: A China study. Energy 2017, 120, 117–127. [Google Scholar] [CrossRef]
  25. Ji, J.; Tang, H.; Jin, P. Economic potential to develop concentrating solar power in China: A provincial assessment. Renew. Sustain. Energy Rev. 2019, 114, 109279. [Google Scholar] [CrossRef]
  26. Neises, T.; Turchi, C. A Comparison of Supercritical Carbon Dioxide Power Cycle Configurations with an Emphasis on CSP Applications. Energy Procedia 2014, 49, 1187–1196. [Google Scholar] [CrossRef] [Green Version]
  27. Wang, K.; He, Y.-L. Thermodynamic analysis and optimization of a molten salt solar power tower integrated with a recompression supercritical CO2 Brayton cycle based on integrated modeling. Energy Convers. Manag. 2017, 135, 336–350. [Google Scholar] [CrossRef]
  28. Iverson, B.D.; Conboy, T.M.; Pasch, J.J.; Kruizenga, A.M. Supercritical CO2 Brayton Cycles for Solar. Therm. Energy 2013, 111, 957–970. [Google Scholar]
  29. Atif, M.; Al-Sulaiman, F.A. Energy and exergy analyses of solar tower power plant driven supercritical carbon dioxide recompression cycles for six different locations. Renew. Sustain. Energy Rev. 2017, 68, 153–167. [Google Scholar] [CrossRef]
  30. Xu, X.; Vignarooban, K.; Xu, B.; Hsu, K.; Kannan, A. Prospects and problems of concentrating solar power technologies for power generation in the desert regions. Renew. Sustain. Energy Rev. 2016, 53, 1106–1131. [Google Scholar] [CrossRef]
  31. Polimeni, S.; Binotti, M.; Moretti, L.; Manzolini, G. Comparison of sodium and KCl-MgCl2 as heat transfer fluids in CSP solar tower with sCO2 power cycles. Sol. Energy 2018, 162, 510–524. [Google Scholar] [CrossRef]
  32. Advantour. The Geographical Position of China. 2020. Available online: https://www.advantour.com/china/geography.htm (accessed on 1 November 2020).
  33. European Commission. JRC Photovoltaic Geographical Information System (PVGIS). European Commission, 2019. Available online: https://re.jrc.ec.europa.eu/pvg_tools/en/tools.html#TMY (accessed on 1 November 2020).
  34. EnergyPlus. Weather Search|EnergyPlus n.d. Available online: https://energyplus.net/weather-search/tibet (accessed on 30 April 2021).
  35. Solargis. Global Solar Atlas n.d. Available online: https://globalsolaratlas.info/download/china (accessed on 1 November 2020).
  36. O’Meara, S. China’s plan to cut coal and boost green growth. Nat. Cell Biol. 2020, 584, S1–S3. [Google Scholar] [CrossRef]
  37. EIA. International—U.S. Energy Information Administration (EIA). 2020. Available online: https://www.eia.gov/international/analysis/country/CHN (accessed on 2 November 2020).
  38. Qaisrani, M.A.; Wei, J.; Khan, L.A. Potential and transition of concentrated solar power: A case study of China. Sustain. Energy Technol. Assess. 2021, 44, 101052. [Google Scholar] [CrossRef]
  39. IEA. World Energy Outlook 2019—Analysis. 2019. Available online: https://www.iea.org/reports/world-energy-outlook-2019 (accessed on 2 November 2020).
  40. Elbeh, M.B.; Sleiti, A.K. Analysis and optimization of concentrated solar power plant for application in arid climate. Energy Sci. Eng. 2021, 9, 784–797. [Google Scholar] [CrossRef]
  41. Les, I.; Mutuberria, A.; Schöttl, P.; Nitz, P.; Leonardi, E.; Pisani, L. Optical Performance Comparison between Heliostat Field Generation Algorithms; AIP Publishing LLC: Santiago, Chile, 2018; p. 040020. [Google Scholar] [CrossRef]
  42. Bhargav, K.; Gross, F.; Schramek, P. Life Cycle Cost Optimized Heliostat Size for Power Towers. Energy Procedia 2014, 49, 40–49. [Google Scholar] [CrossRef] [Green Version]
  43. Belaid, A.; Filali, A.; Gama, A.; Bezza, B.; Arrif, T.; Bouakba, M. Design optimization of a solar tower power plant heliostat field by considering different heliostat shapes. Int. J. Energy Res. 2020, 44, 11524–11541. [Google Scholar] [CrossRef]
  44. Freeman, J.M.; DiOrio, N.A.; Blair, N.J.; Neises, T.W.; Wagner, M.J.; Gilman, P.; Janzou, S. System Advisor Model (SAM) General Description (Version 2017.9.5); 2018. Available online: https://www.osti.gov/biblio/1440404/ (accessed on 9 June 2021). [CrossRef] [Green Version]
  45. NREL. sam-help-2020-11-29r1.pdf. 2020. Available online: https://sam.nrel.gov/images/web_page_files/sam-help-2020-11-29r1.pdf (accessed on 13 May 2021).
  46. Agyekum, E.B.; Velkin, V.I.; Hossain, I. Sustainable energy: Is it nuclear or solar for African Countries? Case study on Ghana. Sustain. Energy Technol. Assess. 2020, 37, 100630. [Google Scholar] [CrossRef]
  47. Agyekum, E.B.; Afornu, B.K.; Ansah, M.N.S. Effect of Solar Tracking on the Economic Viability of a Large-Scale PV Power Plant. Environ. Clim. Technol. 2020, 24, 55–65. [Google Scholar] [CrossRef]
  48. Wang, Q.; Pei, G.; Yang, H. Techno-economic assessment of performance-enhanced parabolic trough receiver in concentrated solar power plants. Renew. Energy 2020, 167, 629–643. [Google Scholar] [CrossRef]
  49. Kumar, S.; Agarwal, A.; Kumar, A. Financial viability assessment of concentrated solar power technologies under Indian climatic conditions. Sustain. Energy Technol. Assess. 2021, 43, 100928. [Google Scholar] [CrossRef]
  50. Hernández-Moro, J.; Martínez-Duart, J. Analytical model for solar PV and CSP electricity costs: Present LCOE values and their future evolution. Renew. Sustain. Energy Rev. 2013, 20, 119–132. [Google Scholar] [CrossRef]
  51. Torras, S.; Perez-Segarra, C.-D.; Rodríguez, I.; Rigola, J.; Oliva, A. Parametric Study of Two-tank TES Systems for CSP Plants. Energy Procedia 2015, 69, 1049–1058. [Google Scholar] [CrossRef] [Green Version]
  52. IRENA. Renewable Power Generation Costs in 2017. 2018. Available online: https://www.irena.org/publications/2018/jan/renewable-power-generation-costs-in-2017 (accessed on 9 June 2021).
  53. Emes, M.J.; Arjomandi, M.; Nathan, G.J. Effect of heliostat design wind speed on the levelised cost of electricity from concentrating solar thermal power tower plants. Sol. Energy 2015, 115, 441–451. [Google Scholar] [CrossRef]
  54. Hussaini, Z.A.; King, P.; Sansom, C. Numerical Simulation and Design of Multi-Tower Concentrated Solar Power Fields. Sustainability 2020, 12, 2402. [Google Scholar] [CrossRef] [Green Version]
  55. Jamali, H. Investigation and review of mirrors reflectance in parabolic trough solar collectors (PTSCs). Energy Rep. 2019, 5, 145–158. [Google Scholar] [CrossRef]
  56. Zhu, Z.; Zhang, D.; Mischke, P.; Zhang, X. Electricity generation costs of concentrated solar power technologies in China based on operational plants. Energy 2015, 89, 65–74. [Google Scholar] [CrossRef] [Green Version]
  57. Trabelsi, S.E.; Chargui, R.; Qoaider, L.; Liqreina, A.; Guizani, A. Techno-economic performance of concentrating solar power plants under the climatic conditions of the southern region of Tunisia. Energy Convers. Manag. 2016, 119, 203–214. [Google Scholar] [CrossRef]
  58. Tahir, S.; Ahmad, M.; Abd-Ur-Rehman, H.M.; Shakir, S. Techno-economic assessment of concentrated solar thermal power generation and potential barriers in its deployment in Pakistan. J. Clean. Prod. 2021, 293, 126125. [Google Scholar] [CrossRef]
  59. Zayed, M.E.; Zhao, J.; Li, W.; Elsheikh, A.H.; Zhao, Z.; Khalil, A.; Li, H. Performance prediction and techno-economic analysis of solar dish/stirling system for electricity generation. Appl. Therm. Eng. 2020, 164, 114427. [Google Scholar] [CrossRef]
  60. de la Calle, A.; Bayon, A.; Pye, J. Techno-economic assessment of a high-efficiency, low-cost solar-thermal power system with sodium receiver, phase-change material storage, and supercritical CO2 recompression Brayton cycle. Sol. Energy 2020, 199, 885–900. [Google Scholar] [CrossRef]
Figure 1. DNI map for China [35].
Energies 14 03426 g001
Figure 2. Installed energy generation mix [39].
Energies 14 03426 g002
Figure 3. Optimized field (a) sCO2 power cycle and (b) Rankine power cycle.
Energies 14 03426 g003
Figure 4. Hourly weather characteristics for the study area.
Energies 14 03426 g004
Figure 5. Effect of TES on the cost effectiveness of the various scenarios: sCO2 (a) HTF A (b) HTF B, Rankine (c) HTF A (d) HTF B.
Energies 14 03426 g005
Figure 6. Electricity to grid (MWe) for (a) Rankine (b) sCO2 power cycles.
Energies 14 03426 g006aEnergies 14 03426 g006b
Figure 7. Effect of wind stow speed on the annual energy (a) and capacity factor (b) on the various scenarios.
Energies 14 03426 g007
Figure 8. Effect of mirror reflectance on some metrics for Rankine power cycle with HTF A (left) and HTF B (right).
Energies 14 03426 g008
Figure 9. Effect of mirror reflectance on some metrics for SCO2 power cycle with HTF A (left) and HTF B (right).
Energies 14 03426 g009
Figure 10. Effect of real discount rate on NPV (in million dollars) and LCOE of the various scenarios.
Energies 14 03426 g010
Figure 11. Effect of heliostat field cost on some metrics for the various scenarios, (a) NPV (b) LCOE and IRR.
Energies 14 03426 g011
Figure 12. Effect of TES on some economic metrics for the various scenarios.
Energies 14 03426 g012
Table 1. Technical parameters used for the simulation [11,45].
ParameterValue
sCO2 Power CycleRankine Power Cycle
Design point parameters
Solar multiple2.42.4
Receiver thermal power647 MWt647 MWt
HTF hot temperature574 °C574 °C
HTF cold temperature406.04 °C406.04 °C
Full load hours of storage10 h10 h
Solar field hours of storage4.17 h4.17 h
Design turbine gross output111 MWe111 MWe
Estimated net output at design (nameplate)100100
Heliostat field
Heliostat height12.20 m12.20 m
Ratio of reflective area to profile0.970.97
Initial optimization step size0.060.06
Max. heliostat distance to tower height ratio9.509.50
Min. heliostat distance to tower height ratio0.750.75
Tower height192.03 m186.14 m
Mirror reflectance and soiling0.900.90
Base land area1818 acres1892.72 acres
Total land area1864 acres1938 acres
Tower and Receiver
Receiver height19.75 m19.48 m
Receiver diameter17.49 m17.30 m
Tube outer diameter40 mm40 mm
Tube wall thickness1.25 mm1.25 mm
Power cycle
Estimated cycle gross output111 MWe111 MWe
Estimated gross to net conversion factor0.90.9
Cycle thermal power269.42 MWt269.42 MWt
Cycle configurationRecompression-
Boiler operating pressure-100 Bar
Condenser type-Air-cooled
Cycle thermal efficiency0.412-
Recompression fraction0.197-
Low pressure9.47-
Thermal storage
Storage typeTwo-tankTwo-tank
TES thermal capacity2694.2 MWt-h2694.2 MWt-h
Available HTF volume21,536 m313,222 m3
Tank diameter49.9 m39.1 m
Storage tank volume23,493 m314,424 m3
Table 2. Financial parameters used for the analysis [11,16].
ParameterValue
Site improvements16 USD/m2
Tower cost fixedUSD 3,000,000
Tower cost scaling exponent0.0113
Receiver reference costUSD 103,000,000
Thermal energy storage cost22.0 USD/kWht
Contingency cost7% of sub-total
Nominal discount rate12.42%
Insurance rate (annual)0.5%
Tenor18 years
Table 3. Economic results for the various scenarios.
MetricSupercritical CO2 CycleRankine Cycle
Salt (60% NaNO3 40% KNO3)Salt (46.5% LiF 11.5% NaF 42% KF)Salt (46.5% LiF 11.5% NaF 42% KF)Salt (60% NaNO3 40% KNO3)
PPA Price (year 1), cents/kWh16.0215.3415.4416.02
Levelized PPA price (nominal), cents/kWh19.7819.0119.3319.99
Levelized PPA price (real), cents/kWh16.6415.9916.2516.81
LCOE (nominal), cents/kWh19.6318.8619.1819.83
LCOE (real), cents/kWh16.5015.8616.1316.68
NPV, USD4,090,7344,086,6864,086,8544,090,836
Internal rate of return (IRR), %11.0011.0011.0011.00
Year IRR is achieved20.0020.0020.0020.00
IRR at end of project, %12.7812.7812.7812.78
Net capital cost, USD761,803,456761,173,248761,161,408761,796,288
Equity, USD342,008,512341,722,752341,718,496342,005,920
Size of debt, USD419,794,944419,450,464419,442,912419,790,368
Table 4. Comparative analysis with previously published works.
StudyLocationType of CycleType of TechnologyLCOECapacity of Plant
Aly et al. [16]TanzaniaRankineSolar tower plant0.116 to 0.125 USD/kWh100 MW
Trabelsi et al. [57]TunisiaRankineParabolic trough plants0.1828 EUR/kW he50 MW
Tahir et al. [58]Pakistan Parabolic trough plants0.147–0.153 USD/kWh100 MW
Zayed et al. [59]China Solar Dish/Stirling0.2565 USD/kWh25 kW
de la Calle et al. [60]AustraliasCO2 0.1142 AUD/kWh100 MW
Mihoub et al. [18]AlgeriaRankineCentral tower receiver Solar plant0.2357 USD/kWh50 MW
Sultan et al. [19]Kuwait Parabolic trough0.150663 USD/kWh50 MW
Zhu et al. [56]China Parabolic trough CSP, tower CSP, and dish CSP0.19–0.43 USD/kWh
Publisher’s Note: MDPI stays neutral with regard to jurisdictional claims in published maps and institutional affiliations.

