Article

Energy Transition on Islands with the Presence of Electric Vehicles: A Case Study for Porto Santo

1
DEEC, University of Coimbra, FCTUC, 3000 Coimbra, Portugal
2
DME, University of Madeira and ITI/Larsys/M-ITI, 9000 Funchal, Portugal
3
DEEC, University of Coimbra, INESC Coimbra, 3000 Coimbra, Portugal
*
Author to whom correspondence should be addressed.
Energies 2021, 14(12), 3439; https://doi.org/10.3390/en14123439
Submission received: 9 April 2021 / Revised: 21 May 2021 / Accepted: 7 June 2021 / Published: 10 June 2021

Abstract

:
Facilitating high-RES (Renewable Energy Resources) penetration via integrated resource management is considered a promising strategy on different islands worldwide. For this work, the Portuguese island of Porto Santo is established as a test bench using actual data from the island. Given its geographical condition and energy needs, integrating the management of different resources (namely, the electric power grid with the water supply system, intensive in-land transportation electrification, and the energy storage applications) is analyzed by this work to achieve a power grid relying entirely on RES. The energy storage utilization and the purposeful manipulations in demand patterns have been perceived as instruments to reduce RES availability and consumption mismatch. Electric Vehicles (EV) could be perceived as a reliable alternative to centralized storage systems, acting either as a load or power resource (generator), providing the required flexibility for power systems to uptake the increased RES and maintaining the balance of supply and demand. This means that EVs could contribute to greening both the power system and the transport sectors. Hence, the impact of the EVs’ penetration level on the island was assessed through a gradual increase in the EVs’ total number (from 0 to a fleet containing 2500 vehicles). Furthermore, a collaboration between the water supply (seawater desalination) and the energy sector is proposed. The obtained results revealed that the optimized management of resources could significantly help the overall energy system (power grid) to rely only on RES (solar and wind energies). The curtailments decreased relatively (maximizing the RES share), while the polluter conventional power plant remained off over the simulation periods.

1. Introduction

Energy transition, either on islands or on the mainland, might be subject to widespread challenges associated with the electric power grid topology, the local population, geographic specificities, the availability of RES, and the type of load demand [1,2,3]. Furthermore, the nature and intensity of RES on power grids determine the real challenges that the system operators may encounter. For instance, solar and wind energies are considered, so far, intermittent sources without inertia, whereas geothermal and hydropower can provide stability.
Given the available RES and their nominal installed power, every power system should be considered a unique case to be studied. Additionally, the power system characteristics also play a significant role in determining the real challenges such as (i) the geographical and technical spread of RES: where more diversity means fewer challenges, (ii) the demand size (the peak power and the average daily energy need), (iii) the match between the demand and the RES output (seasonal and daily): where a good match means fewer issues, (iv) flexibility that can be provided from various assets of the system (conventional power plants characteristics, energy storage applications, etc.), and (v) the technical standards (grid codes).
The energy transition on islands might face slightly different challenges compared to the mainland, particularly in places where there is no interconnection to compensate for the shortages or export the excess electricity generation. Furthermore, the lack of interconnections and the economy of scale of some RES projects may account for why RES projects on large scales are not economically attractive on islands. Also, the seasonality of the demand imposed by tourist arrivals on islands requires a secure supply system that can efficiently run during high and low seasons. Nevertheless, islands themselves are highly motivated to contribute to the energy transition programs, mainly because their energy needs often differ from those on the mainland. Their energy demand, by sectors, may be categorized primarily as residential, services and commerce, public lightning, electricity for desalinating water (where scarcity of potable water exists), transportation, and agriculture (if an active agriculture industry exists.
The term flexibility (the term flexibility describes the ability of the power system to respond to uncertainty and variability in the supply-demand balance, in the timescale of minutes to hours.) has become essential and a key enabler in the context of shifting from conventional fossil-fuel-based systems to a dominant RES energy system. Given the islands’ isolated nature, their power system can serve as a suitable testbed to demonstrate innovative solutions in this regard. Usually, every solution is put in place with a common objective, increasing the “flexibility” (kW/kWh). Preferably, several flexibility sources need to be exploited and planned ahead of time to manage large-scale RES adoption [4]. In this context, European islands have been hosting a large number of research projects [5] for unlocking the Demand-side Flexibility (DSF) potentials and the Energy Storage Systems (ESS) applications in different areas, such as in implementing microgrids [6,7,8,9], in developing and examining smart-grids (advanced communications and metering) [10,11], and in innovative sector-coupling (heat, transportation, and water supply) [12,13,14,15,16,17,18,19].
IRENA defines DSF [20] as a portion of the demand, including the electrification of other energy sectors (i.e., heat or transport via sector coupling), which could be reduced, increased, or shifted at specific times. The growing number of Electric vehicles (EVs) is perceived as one of the DSF sources, where their “active participation” in power system operation could be recognized as Demand Response (DR). Many researchers have been working on quantifying the flexibility that EVs could provide for system operators under DR programs. The leading instruments to achieve the desired flexibility might be identified as innovative incentive-based programs, the communication between the EV and the grid operator, and the bi-directional power flowability [21]. DSF can only be provided by controllable technologies, which bring additional costs and may increase the complexity of power systems’ functionality compared to the conventional economic dispatching procedure.
This work presents the energy system of the Porto Santo island and reviews its ongoing energy transition program. Thus, it characterizes a possible future scenario for the island’s power system, relying predominantly on RES (wind and solar energies). To maximize the integration of RES, an innovative solution is proposed by utilizing the following resources:
(i)
The deployment of grid-scale ESS, consisting of Li-ion batteries and Compressed Air Energy Storage technology (CAES),
(ii)
The flexible use of electricity demand associated with the water supply sector, namely by optimum scheduling of the Reverse Osmosis Desalination (ROD) plant operation,
(iii)
The flexibility that a large number of EVs could provide under the V2G concept.
The deployment of ESS is an inevitable solution to realize a power grid fundamentally powered by RES. Given that, local authorities could shift some investment from bulk-ESS to dispersed storage (the EV’s battery) while simultaneously incentivizing EV owners to participate in V2G strategies, by which both the inland transportation system and the power grid may benefit. Hence, integrating incentives in policy instruments to stimulate electric mobility by private users might be the key to furthering the decarbonization paradigm. For instance, the former financial incentives for acquiring EVs on the Azores island are now combined with reimbursing the charging stations at 50%. At the same time, the local electricity company is encouraging users to participate in the DR programs by offering bonuses to those possessing a time-differentiated electricity tariff, thereby promoting the charging of electric vehicles during off-peak periods [22].
In short, mutual incorporation of aggregated EVs can bring three major advantages: (i) the provision of flexible energy and reserve services that enable RES integration [23], (ii) the aggregation lessens the need for the installation of new bulk ESS and brings long-term benefits [24], (iii) the coordination of EVs improves the safety of the contribution of aggregated EVs in electricity markets, which in turn can enhance both the power grid and the EV necessities [25,26]. Given the growing number of EVs, the analysis of the impacts of deploying a sizable number of EVs is of particular interest since EVs may strongly contribute to increasing energy consumption and even the peak demand. Most of the works found in the literature investigated the active role of EVs in what concerns ancillary services provision EV participation in the energy market [23,27]. Fei Teng et al. [28] concluded that EVs could benefit from both energy and ancillary service markets. Under various assumptions and limitations, studies have demonstrated that EV owners and utilities could maximize their profit by deploying the V2G concept through DR programs with proper pricing mechanisms [29,30]. The main conclusion is that EV users should get compensated from energy arbitrage for every energy unit discharged from the vehicle’s battery. To extract the added value and fairly allocate it among the owners and the utility, innovative charging strategies need to meet the EV owner’s comfort while tackling the power grid constraints [31].
In this work, rather than investigating the common utilization of EVs in power grids, the impact of many EV batteries’ stacked capacity is studied in an isolated grid. The optimum charging/discharging scheduling of each EV is done to maximize the utilization of RES (solar and wind energies). This work assumes that the system operator can control the ROD’s operation as a sizeable elastic load and the plugged-in EVs as a bulk energy storage module. This could be implemented mainly due to the specific characteristics that the case study represents. The island’s isolation and its limited roads present a lower demand for transportation in comparison to big cities. Besides that, the island is equipped with several water reservoirs, which can store the desalinated seawater for several days, guaranteeing to meet the water demand. This means the ROD’s load at the demand side could accommodate the base-load and the RES variations (RES’s availability) without jeopardizing the water supply.
Moreover, given the vertically integrated energy market (Vertical integration is a strategy whereby a company owns or controls its suppliers, distributors, or retail locations to control its value or supply chain.) on the island, adopting the growing number of EVs and integrating them into the energy market might be less challenging since only the EV owners and the local utility need to be considered. The results demonstrate that through the proposed approach, the power grid of Porto Santo for several consecutive days could rely only on RES (solar and wind energies), maximizing the use of RES while reducing the curtailments relatively.
The following section discusses the challenges associated with the energy transition on different European islands. The challenges regarding the availability of resources and their energy demand profiles are discussed. Section 3 introduces the island of Porto Santo, its resources and assets, and presents the progress of its energy transition master plan up to the present time. The feasibility of the proposed solution is interpreted by characterizing the case study from the energy management point of view. Section 4 argues the capability and requirements of the identified resources (i.e., ESS, the ROD plant, and the EVs). Section 5 indicates the proposed solution, including the mathematical model. The simulation results are reported in Section 6. Finally, in Section 7, the findings are discussed in detail, while the main conclusion and future research directions are drawn in Section 8. Table 1 presents the acronyms used in this work.

2. A Glance at the Energy Transition on Islands

Dealing with the high penetration of non-synchronous RES while breaking down the expenses can be recognized as the main common interest found in most research and projects [3,13,32,33]. Notton [19] highlighted the importance of coupling the RES with the ESS. They concluded that a higher share of solar and wind energy could be reached by having accurate day-ahead predictions in RES availability and the demand profile. Gils and Simon [34] demonstrated that the improvement in energy efficiency measures via electrification and the intelligent management of different sectors (heat, transportation, water) could reduce environmental emissions and energy costs. They concluded that sector-coupling (The process of interconnecting the power sector with the broader energy sector such as heat, gas, water, and mobility.), by employing demand response techniques, with the energy storage applications’ assistance could significantly moderate wind and solar power generation fluctuations, resulting in 100% RES share across all sectors. They noted that long-term energy storage solutions are the key enabler for achieving an energy supply system relying fundamentally on solar and wind power.
According to GIS Lounge, more than 2000 small islands (ranging from 1000 to 100,000 inhabitants) exist globally [35], which are often highly dependent on fossil fuel imports for their electricity supply and their transportation needs. Their economy is usually influenced by expensive energy costs and the presence of tourists [36]. Since the 2000 s, the worldwide growth in RES, mainly in wind and solar energy, has shown promising prospects for islands’ power grids [37,38]. The European Island Union has demonstrated some projects that prove that the islands’ energy supply could substantially rely on endogenous RES. Those islands that receive high solar irradiation levels or enjoy significant wind have been hosting various projects for coupling RES with ESS, seawater desalination plants, the heating demand, inland transportation, and H2 production for different purposes [5,39].
Table 2 presents some basic information for Porto Santo and several European islands. All the selected locations are in the middle or have already begun their energy transition programs. The given data were gathered through various sources, mainly associated with the master plans and ongoing projects related to the islands’ decarbonization paradigm. As is shown by the table below, electricity costs a higher value than the average of the EU-27 (0.21 kWh/euro); although the kWh price of electricity is usually subsidized on most islands, meaning that the actual cost of electricity is usually even higher than what is presented in the table below.
Since the climate, the geographic location, and energy needs vary on the selected islands, their energy and water needs and resources differ slightly, although the common final goal is to realize an energy supply system based on 100% RES and to reduce CO2 emissions. For instance, in Ameland, the annual residential heating demand, on average, is 45 times higher than the electricity demand. Hence, the utilization of heat pumps and district heating systems combined with RES, namely solar energy, has become the center of innovative projects; while in El Hierro, maximizing the RES based on wind power and storing energy through a reverse-hydro system have been the main objectives of its sustainable master plan.
“Sustainable Tourism” has been mentioned repeatedly as one of the main strategies to decarbonize these islands since their dynamic economies depend highly on tourism activities. Transport decarbonization and transport electrification have received particular attention in those master plans since the transportation system is directly involved in most tourism activities. Moreover, the islands with advanced energy transition states have already taken some measures in this regard [43,44], since they have concluded that transport electrification is vital to realize a 100% RES-based energy system [45]. For instance, public transportation in Ameland has been fully electrified since 2018 and electrifying the transport sector is now the center of the ongoing program in the Samsø and Aran islands. A growing number of works and research are associated with the transport electrification concept’s approval, including this work.
In conclusion, the energy supply expenses count as the major expenditures on islands since energy heavily depends on expensive fuel transportation. Hence, shifting from the fossil-fuel-based energy supply system to growing RES (mainly solar and wind energy) has become a favorable option in these places. However, islands may face additional challenges when compared to the mainland in the decarbonization practices. The two main features on most islands, their small market and isolation, imply relative constraints in different aspects for delivering the electricity, water, and transportation needs [46]. For instance, the limited area and lack of interconnections make flexibility a vital issue for isolated locations. The power fluctuations might frequently occur in isolated power grids with high-RES penetration, degrading the power quality and reliability, posing new challenges to grid operators. On the other hand, the simplicity that an isolated energy system and its market may offer (known as a vertically integrated structure) could facilitate the early adoption of new technologies and increase the RES penetration in their power system.

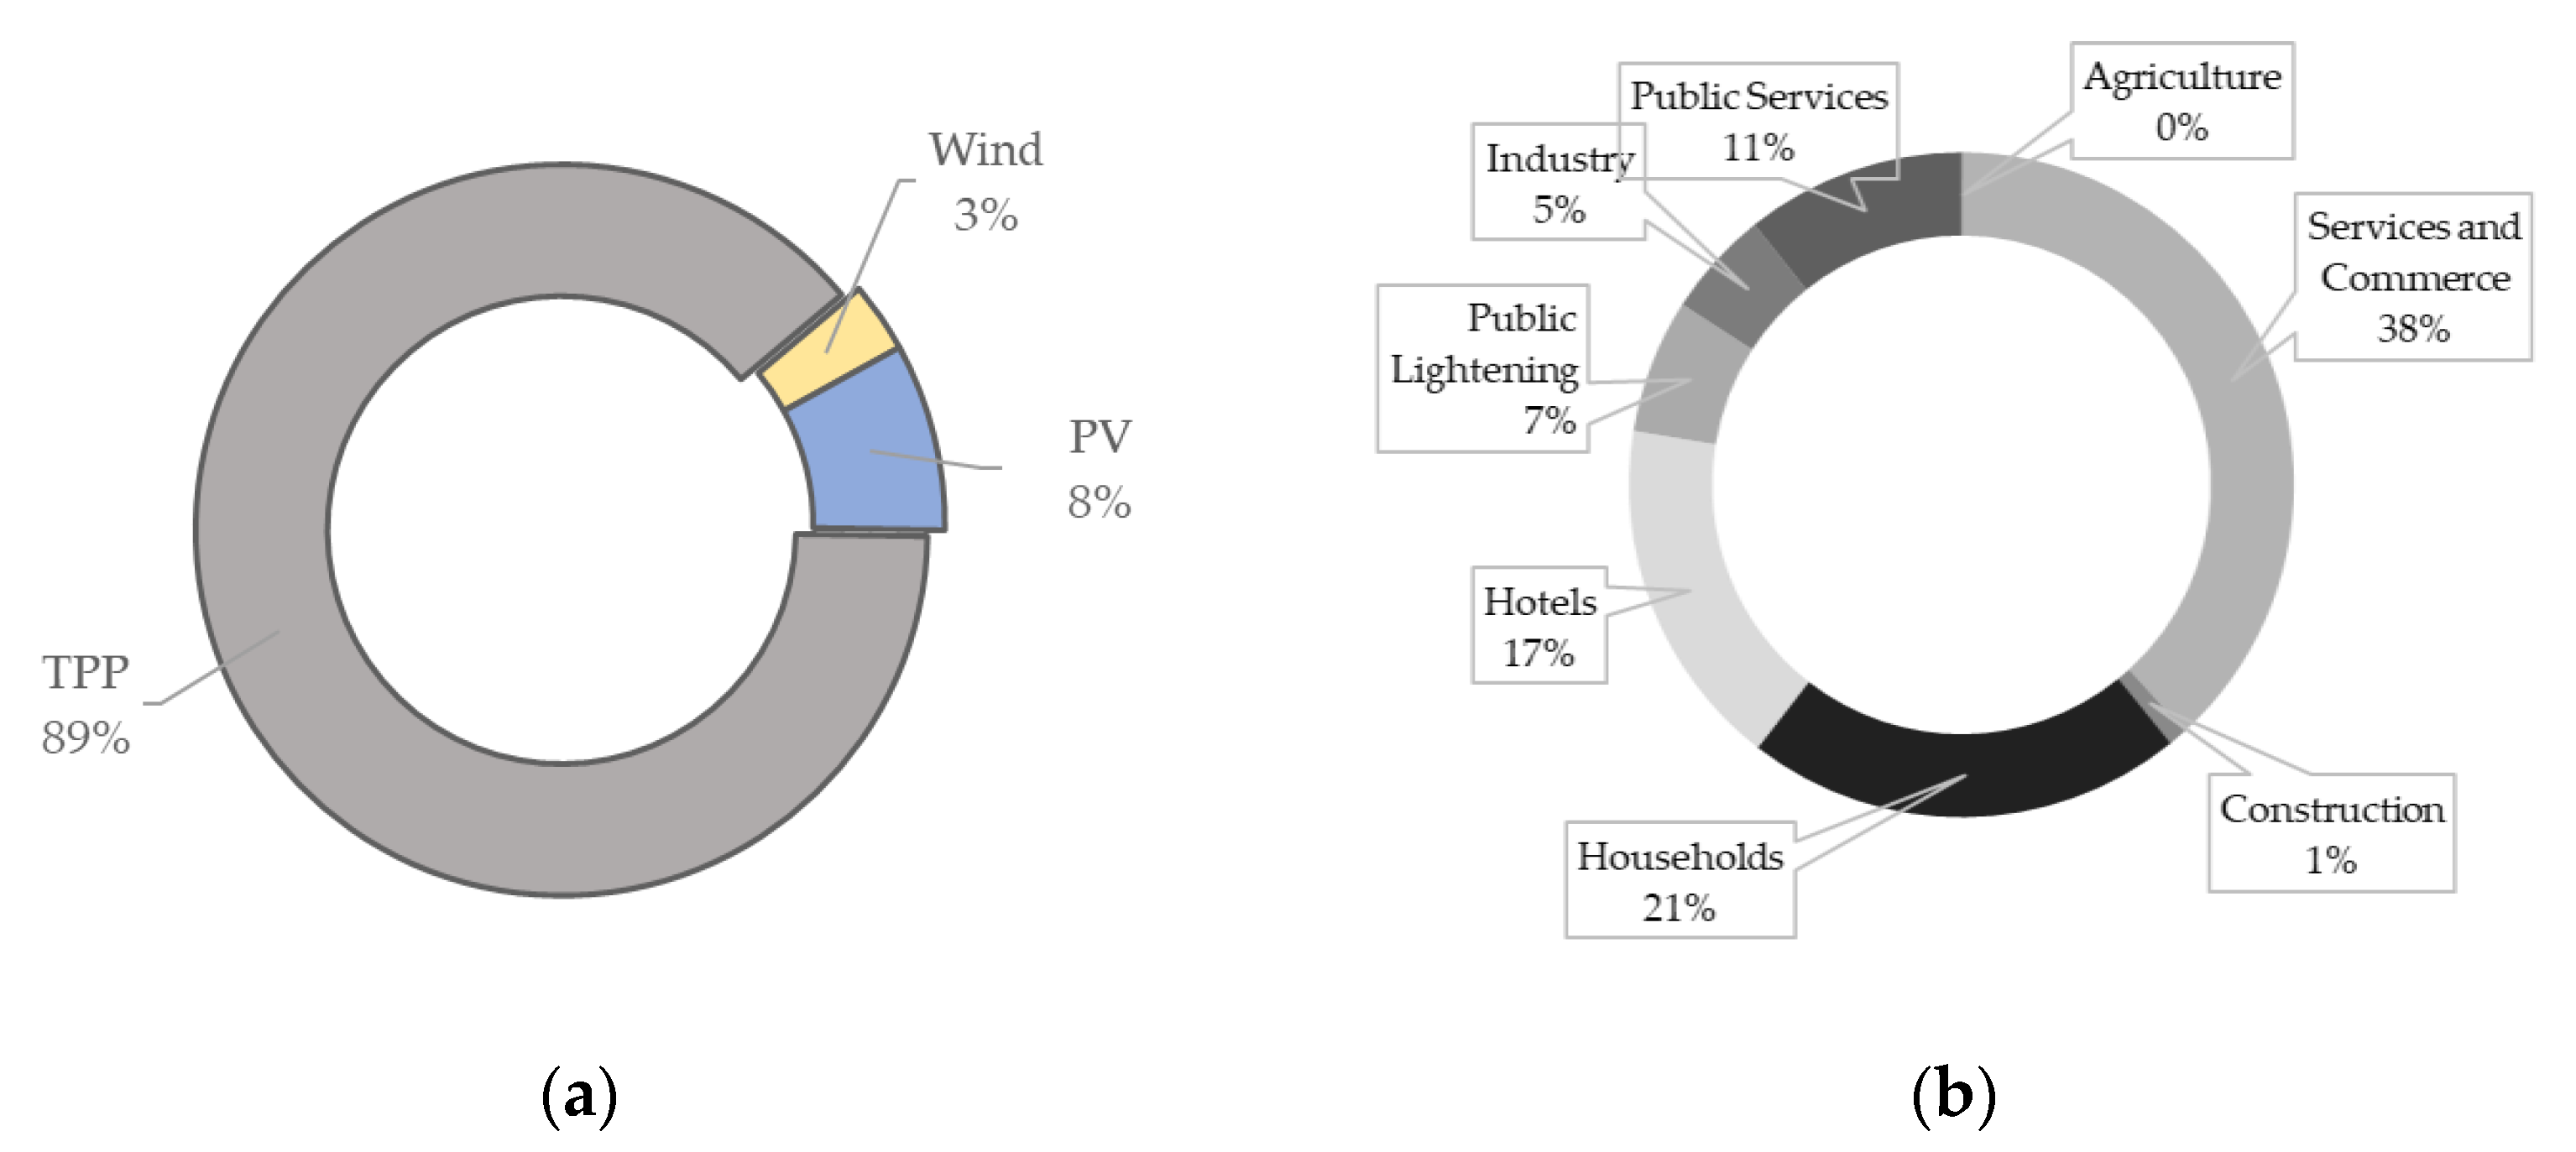
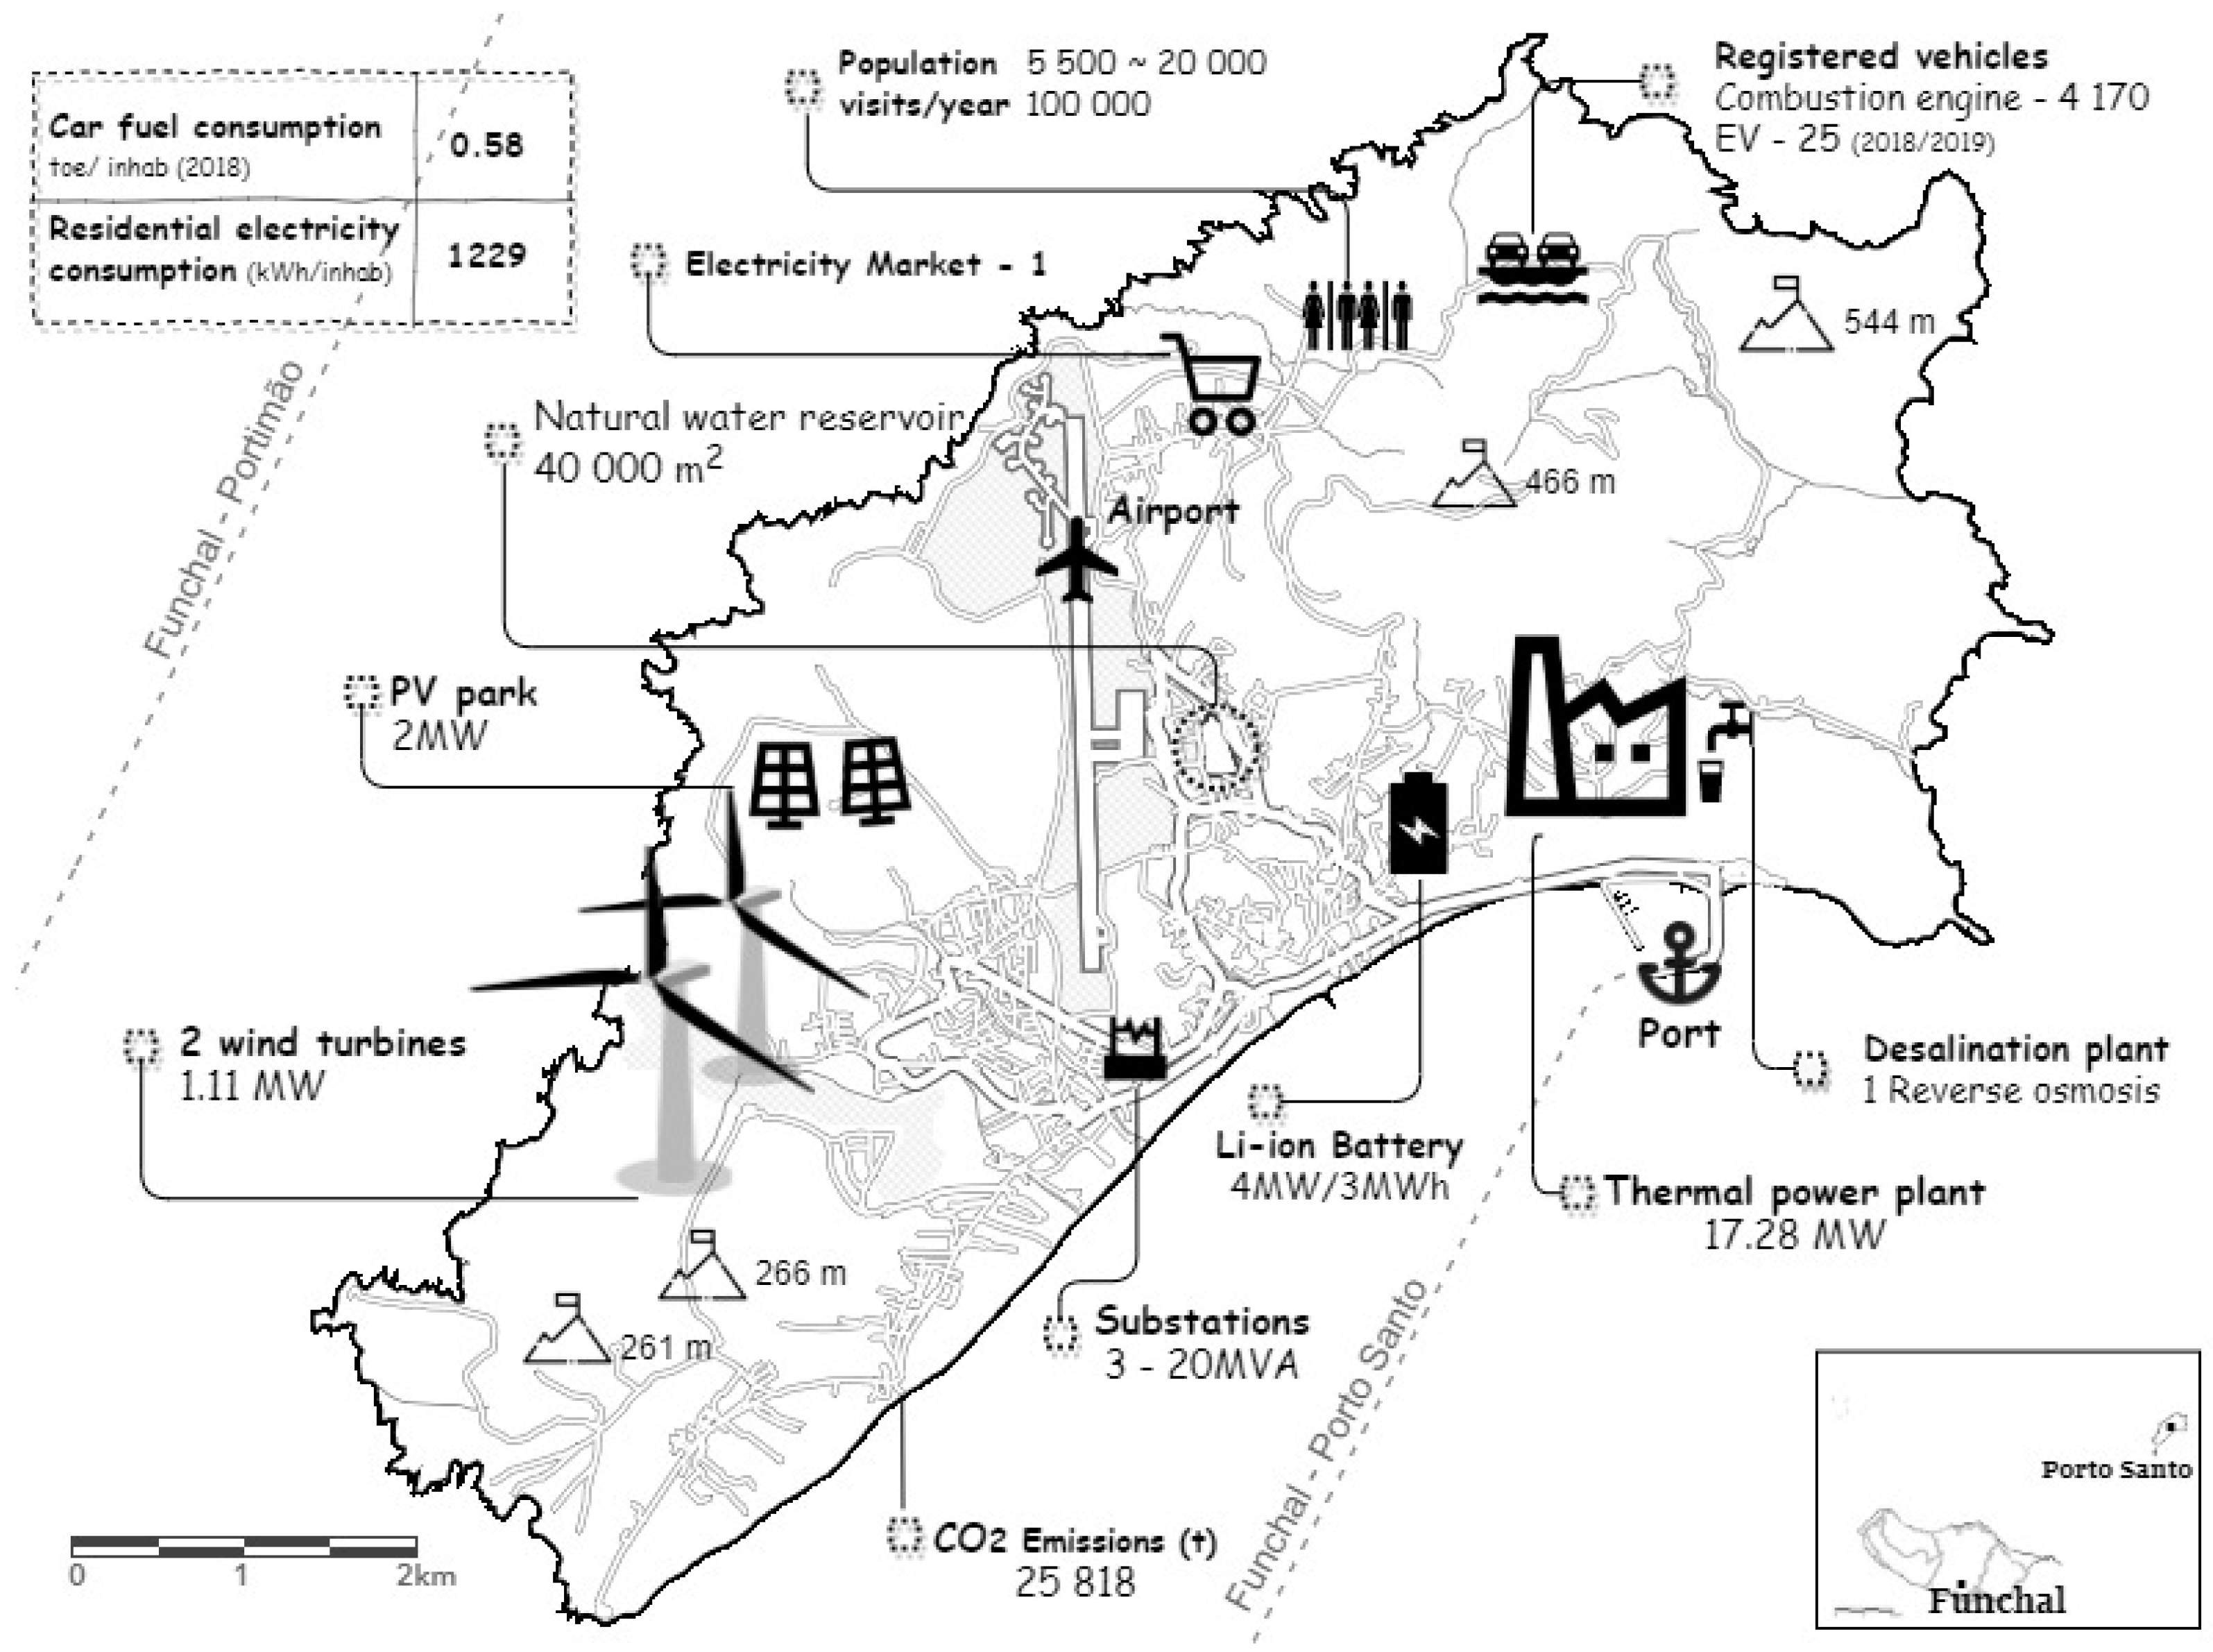
3. Porto Santo Island

Porto Santo island, with its 5483 inhabitants and an area of 42.17 km2 (2011), is the northern and easternmost island of Madeira’s archipelago, located in the Atlantic Ocean, west of Europe and Africa. The Portuguese island has been practicing the developments that let the territory turn into a touristic destination under international standard recognition, free from fossil fuel sources with nearly zero pollutant emissions. The initiative started in 2012 by launching the Sustainable Energy Action Plan of Porto Santo Island, developed under the Pact of Islands’ advisory [47]. In 2016, the local executive branches took the project to a new phase by launching the Smart Fossil Free Island project. They aimed to enable the gradual replacement of fossil fuel resources with RES in the medium and long term [48].
Like many other islands, Porto Santo’s economy relies heavily on tourism (with an average of 100,000 visitors per year), influencing the structure and variability of the island’s water and energy demands. There are almost no water resources on the island except for rainfall and groundwater resources (i.e., saline water sources) [49]. Seawater desalination in Porto Santo is the only solution to supply potable water for public use. As shown in Figure 1, the energy and water demand nearly doubled during the peak tourist season (June, July, August, and September), requiring a high reserve capacity for a short time. It is worth mentioning that the accumulated electricity consumption by the ROD plant roughly accounts for 15% of the annual electricity demand of the island (the area in light blue); that roughly corresponds to half of the energy consumption in the Services and Commerce sector for the same year Figure 2a shows that the 32 GWh electricity consumption in 2015 was mainly supplied by the thermoelectric power plant, while the RES had a share of 11%.
The electricity consumption by activity on Porto Santo is slightly different from mainland Portugal. As shown in Figure 2b, the service and commerce sectors, the hotels, and the residential sectors represent the highest consumers (around 75%) compared to the other sectors. There is no active industry sector nor agriculture (<0.01%). A considerable share of the service and commerce sectors’ and the hotels’ electricity consumption has a linear relationship with the touristic seasons and the number of people on the island. Figure 3. demonstrates some critical information used in this work, while a schematic diagram of the active energy system is drawn on the island’s map.
According to PORDATA (PORDATA is the contemporary Portuguese database (www.pordata.pt, accessed on 02 February 2021).), in 2018, the car-fuel consumption per inhabitant and residential electricity consumption per inhabitant stood at 0.58 toe/inhabt and 1229 kWh/inhabt, respectively. Both indexes represent a higher energy consumption per inhabitant than most Portuguese islands and the Portuguese mainland. The generating power system consists of one thermal power plant (TPP) with 16 MW installed capacity (4 × 4 MW units), two wind turbines (1.11 MW), one solar power plant (2 MW), and twenty mini photovoltaic installations (340 kW accumulated installed power). In 2019, a Li-ion battery pack was established with active power and a usable capacity of 4 MW/3 MWh to complement the power system’s electro-productivity [51].
According to the latest technical annual report published by the local electricity company [50], EEM, some of the fundamental groundwork concerning the island’s power grid reinforcement and the preparation of the required facilities had been put in place, such as (i) installing the necessary communication infrastructure and smart meters, (ii) renovating transformation stations in the context of smart grids, (iii) establishing the EVs’ supply network containing bi-directional load stations and testing it through a pilot project, and, (iv) replacing the conventional public lighting with LEDs under a control center. Ultimately, the island is equipped with a ROD plant capable of producing potable water up to a maximum rate of about 15,700 m3 day−1 with two desalination units, each working with nominal powers between 600 and 1000 kW.
Porto Santo, with 4107 vehicles, represents only 3% of the Madeira archipelago’s total number of registered cars [52]. Although the number of cars seems little compared to the whole archipelago, this number is not that small for an isolated land with roughly 5500 inhabitants.

4. Proposed Means for a 100% RES-Based Energy Supply

Porto Santo’s electricity network is phasing to empower RES that rely mainly on wind and sunlight. To facilitate the increased RES into the electric power system and lessen the net dependence on fossil fuel sources, it would be significantly helpful if, apart from the active TPP, flexibility could be harnessed in various sectors. These resources are listed below:
  • The Li-ion Battery Energy Storage System (BESS) and the Compressed Air Energy Storage system (CAES) are the considered energy storage means,
  • Deployment of a considerable number of EVs under the V2G concept,
  • Controlling the load of the existing Reverse Osmosis Desalination (ROD) plant.
The following presents an overview of each source of flexibility and maps their suitability and adaptability concerning the small-isolated power systems.

4.1. Energy Storage Systems

ESS technologies and their applications have been widely investigated in the literature [53,54,55,56]; accordingly, in an isolated power grid with a considerable RES penetration, the ESS are fundamentally beneficial for two reasons:
  • To absorb the available RES during low-demand periods and back up the power generation during peak demand periods or when the RES are not available. Therefore, a high-power rating (kW) and discharge duration (kWh) are the necessary attributes associated with the ESS. This kind of service is carried mainly through Pump Hydro Energy Storage (PHES) technologies on large scales [57].
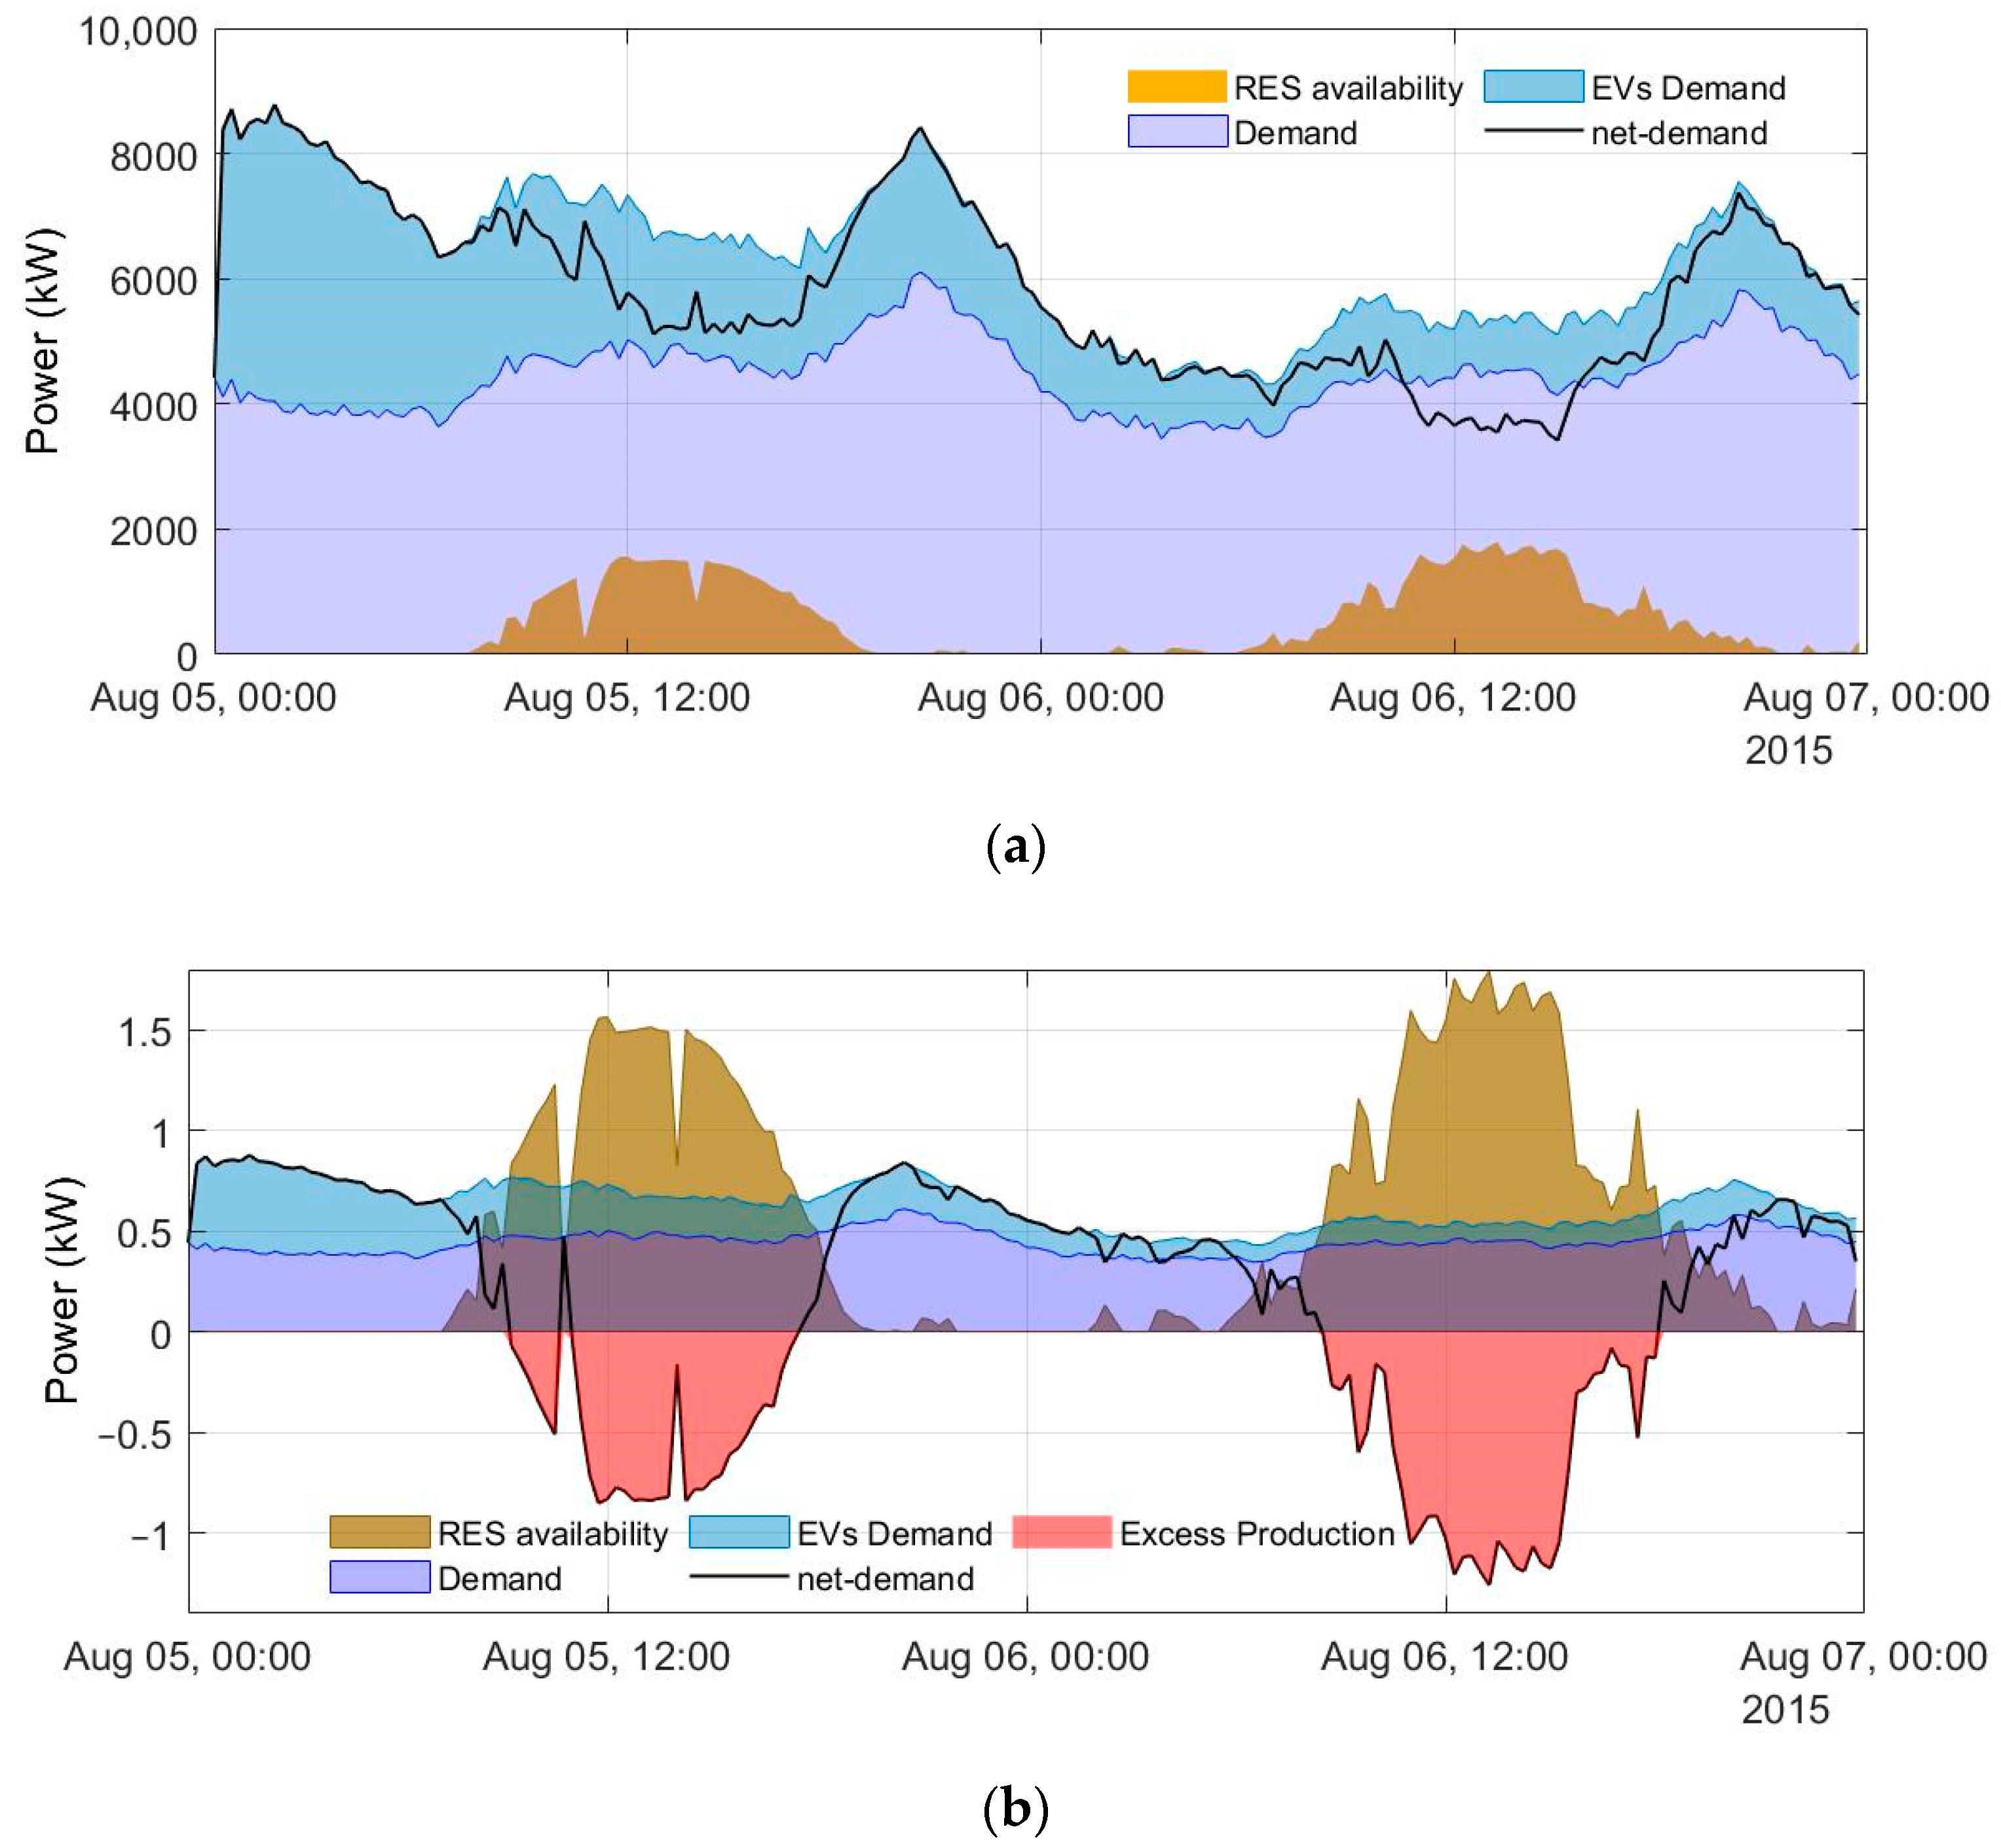
  • Smoothing the net-demand is also particularly important for isolated grids, where system operators often need to keep diesel generators online at less efficient operating levels to mitigate unforeseen ramps in RES generation. If the ESS can tackle the RES variations, the operators can better manage the diesel generators, significantly reducing fuel usage and GHG emissions. Usually, an advanced lead-acid battery or lithium-iron-phosphate is used for this specific service. For instance, the 11 MW/4.3 MWh Li-ion Hawaii wind smoothing project is an example of this kind. While installing storage only to provide RES smoothing is not relevant in most applications; this can, however, be an added value when stacked with other services and other ESS technologies [58]. The island of Graciosa that belongs to the Azores archipelago is another example of an island community that has implemented RES with a BESS, drastically cutting its diesel consumption [8].
Since the tiny island of Porto Santo does not have the proper conditions to benefit from an underground CAES or PHES, therefore, a BESS and an above-ground CAES represent an attractive alternative among the others. Benefits of large-scale BESS units include providing capacity to rapidly compensate for peak loading with a significant energy demand that causes a change in frequency, ramp control, and capacity firming when the output of RES drops (i.e., when the wind drops or clouds cover the PV parks) [59].
The CAES can serve as an alternative to the PHES method for bulk energy storage purposes. They work under similar principles as to how conventional gas turbines operate, although the compression and expansion phases are decoupled instead of occurring simultaneously [60,61,62,63,64,65,66,67]. Advanced adiabatic CAES (AA-CAES) systems, a more recently developed concept, address environmental issues relative to fossil fuel utilization in the classic diabatic CAES expansion phase [67,68]. Although many adiabatic CAES projects have been proposed over the last two decades, none have reached the commercial operation stage, with few still currently under tests in various pilot projects. Lund and Salgi [69] performed an economic assessment by considering several energy storage technologies in a hybrid energy system. The evaluation was conducted using the Energy-PLAN software modeling tool under various market pricing strategies and different wind penetration levels in the Danish electricity supply system. The result demonstrated that the CAES alone could not solve excess electricity production problems, and other ESS options are thus significantly more attractive. Venkataramani et al. [70] showed that integrating the CAES with RES, such as solar and wind energy, improves the utilization of such resources through DSM techniques, making it an attractive medium with high reliability a low environmental impact.

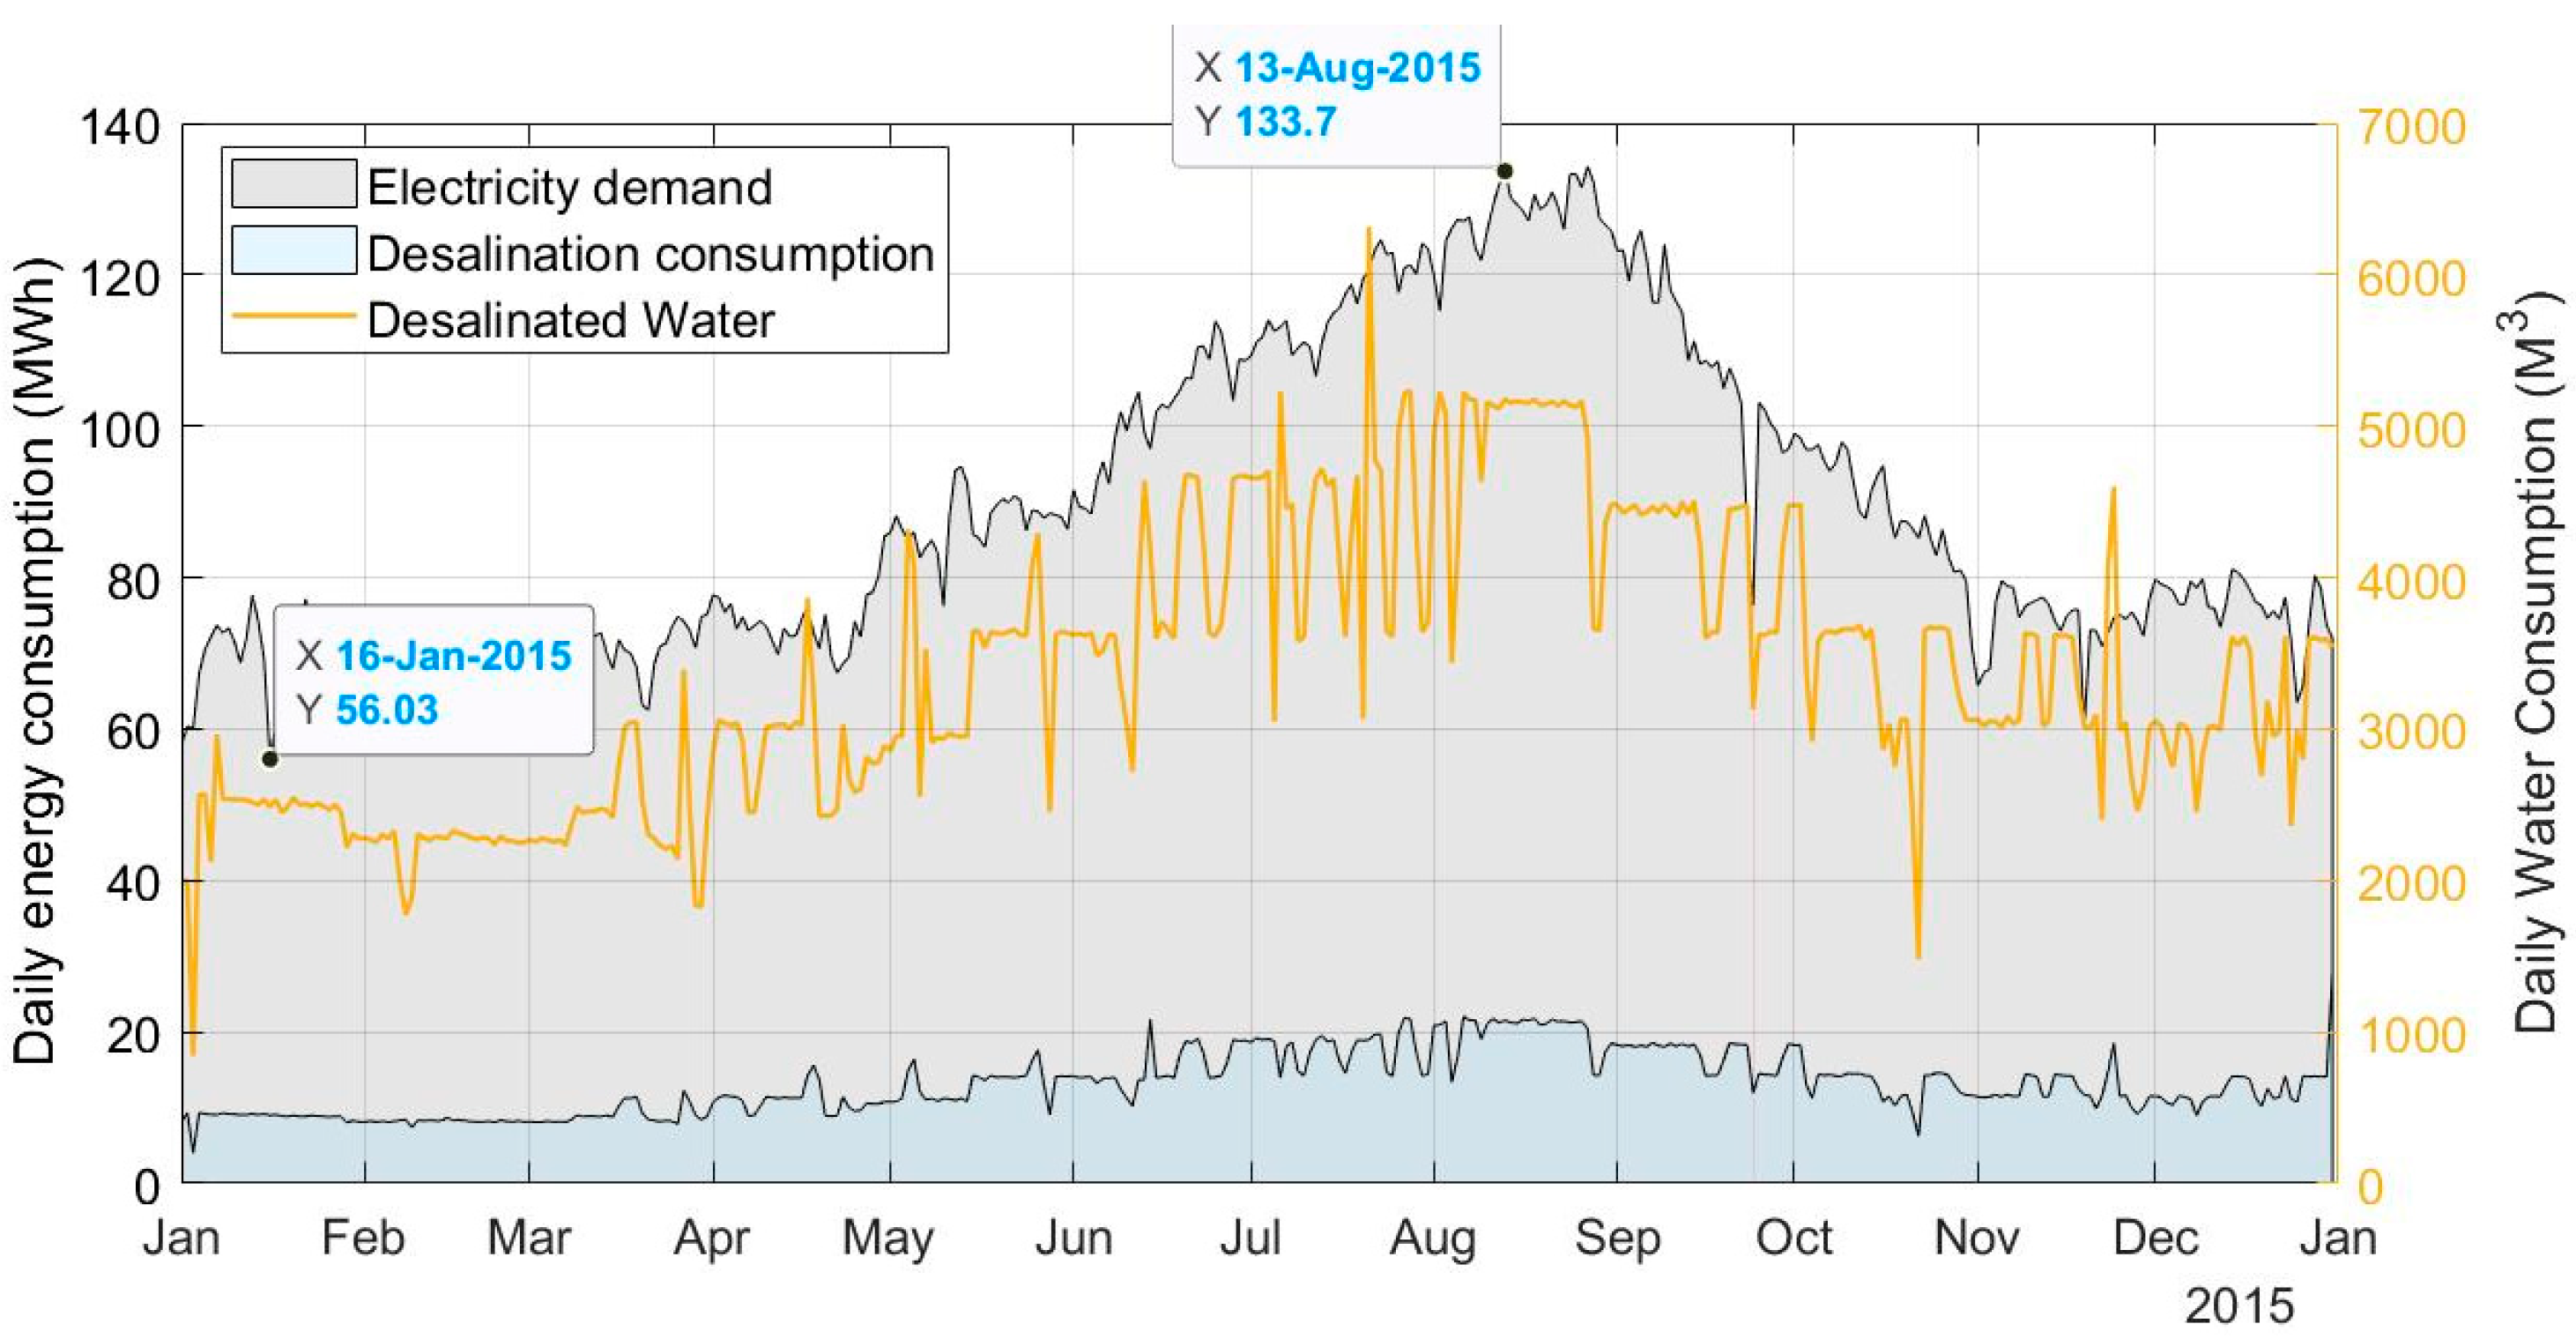
4.2. Reverse Osmosis Desalination Plant & DSM

Although the idea of using desalination plants as a source of flexibility is still fresh, recently, ROD plants have become very attractive from the energy utilities’ point of view. Many researchers in the field and real-world examples have demonstrated that coupling RES with RODs is promising in terms of economic and technical feasibility while significantly reducing the carbon footprint associated with the potable water production process [71,72,73].
The ROD plants usually need to operate at a steady state, indicating that the plant must always consume energy at maximum capacity. From the Demand Side Management’s (DSM) perspective, flexibility could be provided by the ability to start and interrupt the operation of the ROD plant under an incentive-based DR program contracted between the water supply sector and the grid operator [16]. The water reservoir size can also be considered a source of flexibility associated with the water supply system; through the production and storage of potable water during the periods when RESs are available that, if not consumed, may be otherwise curtailed. The integrated ROD plant with RES coupled with an ESS can respond quickly enough and maintain the necessary change for a long enough duration in response to significant changes in the power grid. As Kim demonstrated [74], this can be further exploited through various DR programs supporting multiple ancillary services such as operating reserves (i.e., regulating, ramping, and load following).

4.3. Transport Electrification & the Potential Flexibility

Transport electrification has become plausible due to recent improvements and the cost reduction of available EVs in automobile markets [75]. Nonetheless, it can be a challenging option from different perspectives for both the users and energy (electricity) providers [76,77]. The high EV purchase price, inadequate charging infrastructure, and insufficient product availability may be identified as the main obstacles for the users. In contrast, the lower fuel & maintenance costs over the vehicle’s life, tax credits, and innovative DR programs could offset the front cost. From the system operators’ point of view, there are some concerns about shifting the high-transportation demand (petrol) to the electrical system (electricity). The system operator may face new challenges if the number of uncontrolled connected EVs considerably increases (high transport electrification). On a small island, the requested loads can even change the daily load profile.
The V2G technology can turn Plugged-in EVs into reliable assets, acting either as loads or a power resource (generator), thereby serving the power system. It also can be counted as a practical option in a power market. A high-value electric service such as a quick-response is one of the greatest V2G’s short-term objectives [24,25]. However, studies reported that the V2G is not a favorable option to satisfy the base-load power since it can be dispatched economically by conventional generators. However, for a power system that tends to rely only on RES, the EV adoption with V2G consideration may enhance the power grid’s capability to facilitate more RES and improve efficiency and reliability of the grid [78].
On the other hand, enabling the V2G technology might be very costly, including the need for intensive communication between the vehicles and the grid, infrastructure changes, and most importantly, the provision of a considerable number of bi-directional charging/discharging stations, bringing additional front costs. Moreover, the participation of the EV owners in DR programs is correlated with their willingness and behavior, a crucial factor for extracting the flexibility that a vehicle could offer. Although various pilot projects have been investigating the impacts of V2G integration in power markets, the EV users’ interest in participating in this kind of project and their commitment has still not been fully analyzed. J. Kester et al. [79] highlight the importance of introducing new regulations, taxation, and more pilot projects to boost the research and the findings regarding this matter. In this work, it is assumed that the number of EVs corresponds to the number of users willing to participate in DR programs.

5. 100% RES-Based Energy Supply System

In our previous work [80], in a scenario without the utilization of storage systems, it was concluded that a RES (solar and wind) penetration as low as 40% of the annual energy demand of the island could lead to marginal curtailment rates that exceed 44% of the yearly RES generation. However, given the recently installed Li-ion BESS, greater penetration of the solar and wind resources could be granted, achieving a 38% renewable portfolio standard. Furthermore, it was concluded that a 100% RES-based energy supply system could not be achieved without the utilization of large ESSs; and that the curtailed energy proportion would reach over 60% of the annual RES production. Hence, this section first presents the required assets for achieving a green energy system in Porto Santo, and then the optimization model that explains the optimum use of the resources is delivered in Section 5.1.
As shown in Figure 2a, the RES covered only 11% of the demand in 2015. Hence, in this work, a significant increase in RES is considered compared to the existing RES on the island. Given the current data on the annual electricity demand and the RES production (wind and solar) provided by the island’s local electricity company, the increment was estimated by applying a linear growth on the present solar park’s available data and that of the wind turbines. The table below presents the current resources and the proposed assets for an entirely green energy system of the island.
As Table 3 presents, the sum of the annual electricity generated by the increased PV and wind turbines together roughly accounts for 44 GWh, which is approximately 1.35 times greater than the average yearly energy demand (32 GWh). A 1:1 ratio for the demand and RES supply was not considered due to various reasons:
  • Some curtailment associated with RES is inevitable;
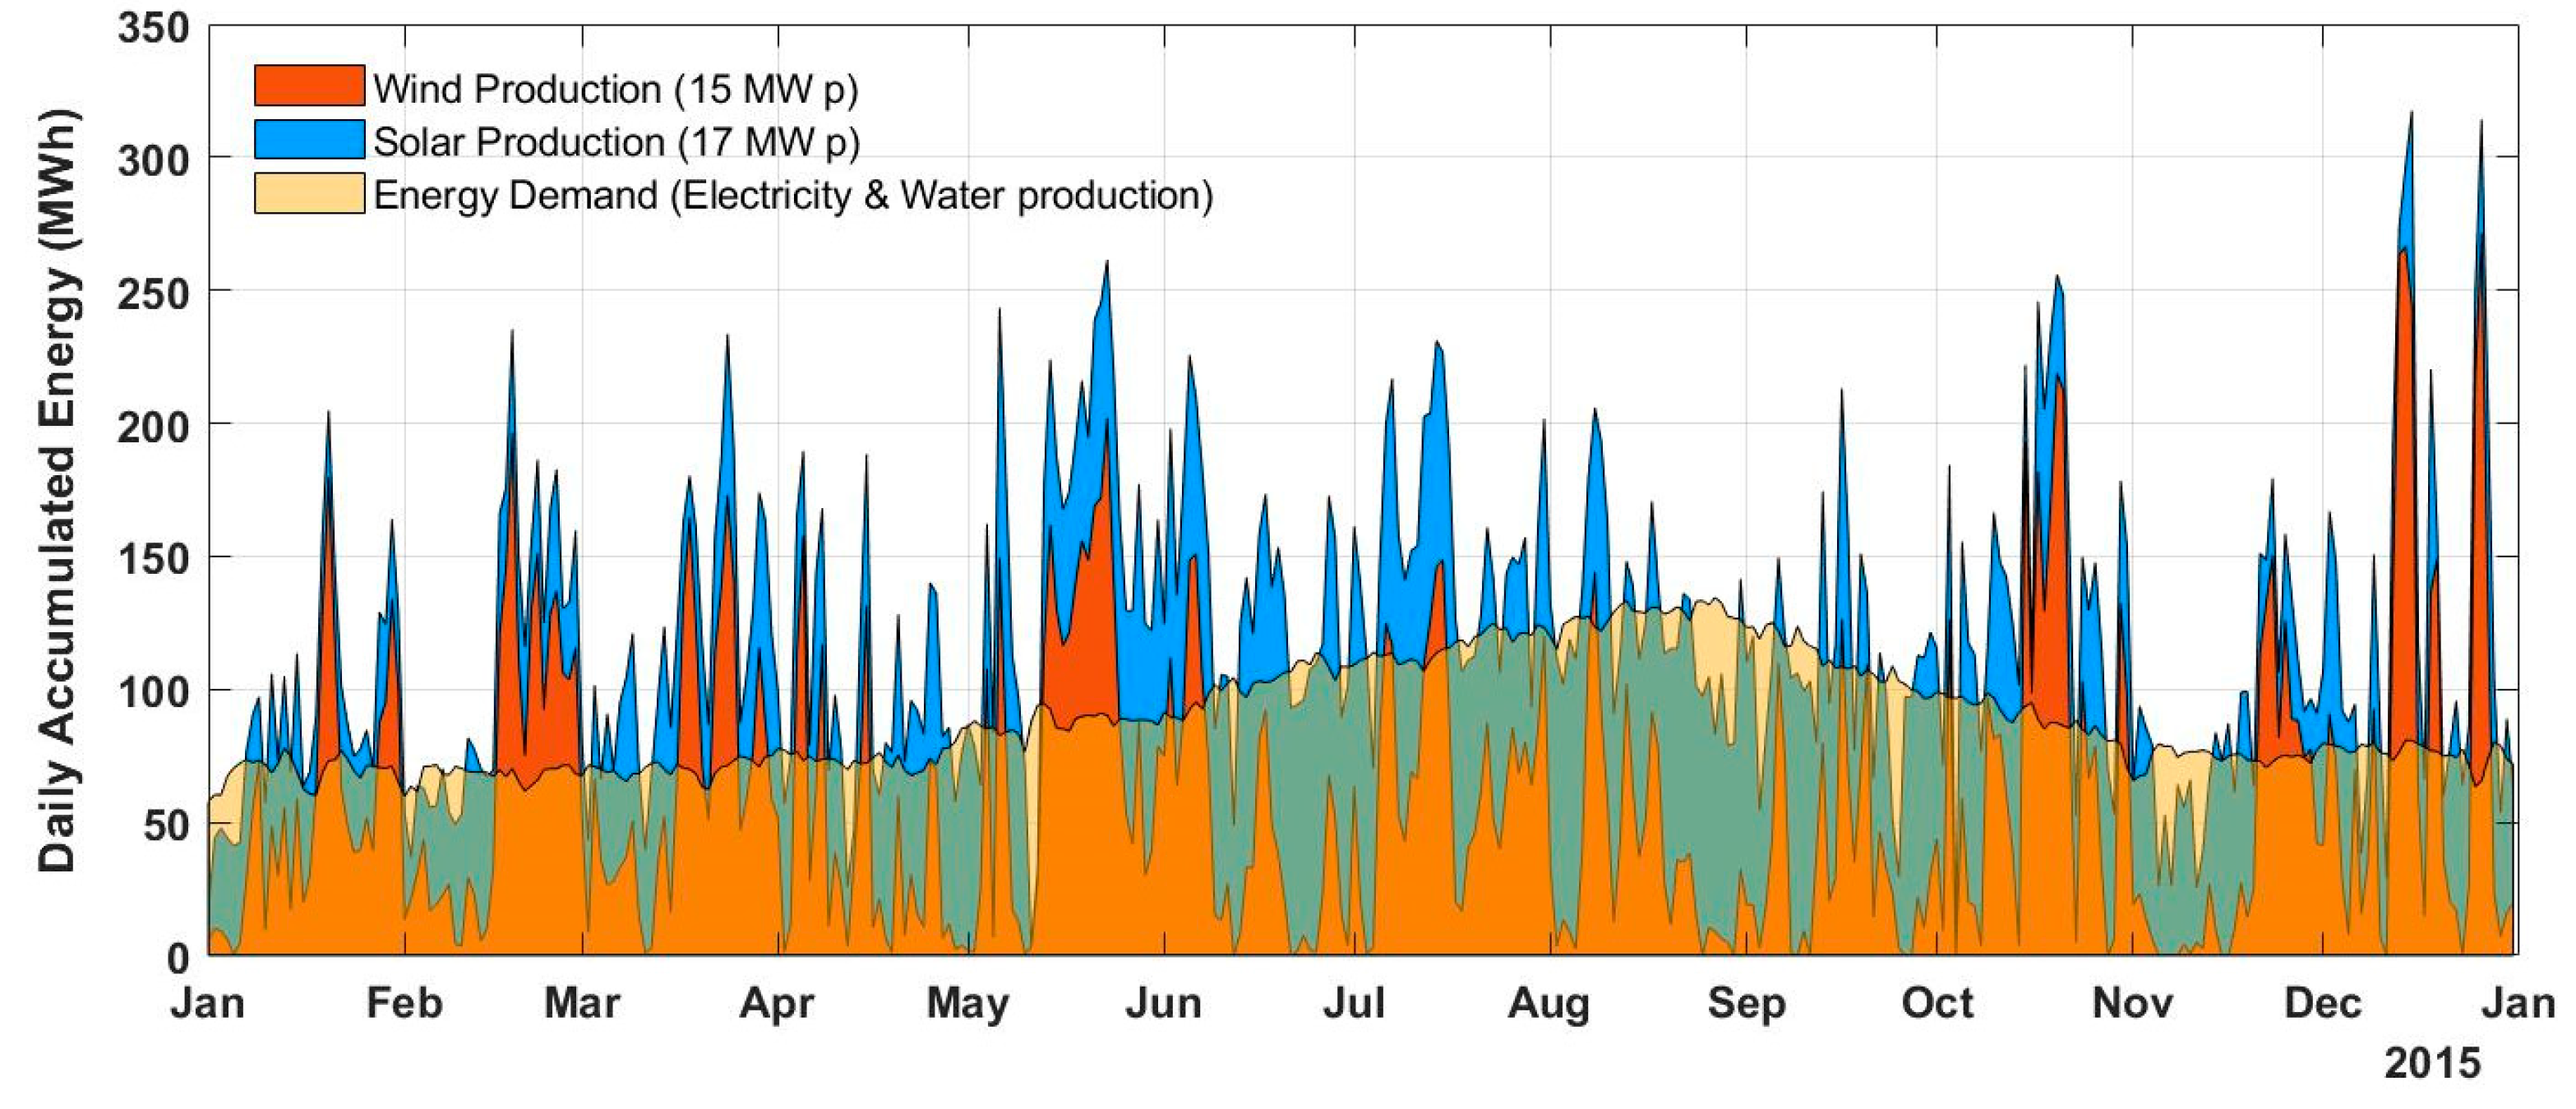
  • As shown in Figure 4, the wind is less available during the summertime when the demand is higher; hence an increase in solar production was necessary. On the other hand, apart from the minor PV production during winter, the solar output is also limited to the daylight; therefore, an increase in wind production was desirable since wind availability on the island presents a more consistent availability during both the day and the night;
  • With the substantial losses associated with the round-trip charging/discharging ICAES, a considerable amount of added RES would be wasted;
  • Ultimately, the significant number of EVs on the island would increase the total demand substantially.
Figure 5 presents the island’s electricity demand, the uncontrolled 2500 EVs demand, and the RES production (kW) during two days for the current and increased with an increase of RES.
As shown in Figure 5a, Even the low penetration of the wind and solar profile would impose a substantial alteration on the power grid, mainly due to the variation in the solar park production. The recently installed Li-ion battery seems to provide sufficient flexibility to cope with unpredictable variations associated with the existing condition. However, the Li-ion BESS alone cannot cope with the 100% RES-based scenario’s challenges, resulting in more frequent “overgeneration” events, leading to a high percentage of “curtailments” with a consequent decrease in benefits and the wasting of investment. Moreover, the EVs would substantially increase the island’s demand, influencing its typical load profile.
As shown in Figure 5b, the excess production power could reach a maximum value of about 12,000 kW with an average of nearly 7000 kW within several hours (equal to 70 MWh, the island’s average daily energy demand), thus requiring bulk energy storage means. Moreover, the security of the supply and the overall cost efficiency of the power system operation must be taken into account to increase the RES in power systems; therefore, understanding the spatiotemporal complementarity of wind and solar power generation and their combined capability to meet the electricity demand is a crucial step towards increasing their share. Accordingly, given our pre-analysis on the required RES to realize a fully-green energy supply system, 15 MWp of wind turbines together with 17 MWp of PV panels presented a sufficient amount of RES production (in terms of both power and energy), by which it would be possible to achieve a power system relying 100% on RES through the proposed integrated management of the resources.
Given the island’s peak power demand of 7.5 MW and the proposed total RES nominal installed power of 32 MWp, the generation capacity divided by the peak demand is 32 / 7.5 = 4.2 . For instance, this ratio for the island of El Hierro, with an 80% annual wind share, is 2.7. However, the energy supply system in El Hierro consists of a PHES with a total power of 11.3 MW and an enormous storage capacity of 580 MWh, 11.5 MWp of wind turbines, and a diesel generating group with a capacity of about 12 MW. The power system of the given example of El Hierro benefits from the security and reliability that the PHES offers; in Porto Santo’s case, the optimized utilization of the proposed assets would realize a power system entirely relying on RES.
As mentioned previously, the PHES system could not be an option due to the island’s geographical condition, and the BESS solutions are still very costly for the required grid-scale storage capacity (15 MW/30 MWh). Additionally, the stacked storage capacity offered by EVs would not be sufficient to support a 100% RES-based power supply system. According to our investigation, the Isothermal CAES (ICAES) developed by SustainX in the United States [66] and TICC-500, an AA-CAES prototype made in China [81], represent a commercial-scale prototype that seems compatible with the energy storage requirement on Porto Santo. Hence, in this work, the promising ICAES developed by SustainX is considered as the bulk ESS technology. According to their performance report [66], the 1.5 MW commercial prototype system, with a 52–58% round-trip efficiency, can reach full power (charge or discharge) in less than 60 s. The charge-to-discharge turnaround time is under 1 s, and the ratio of charge time to discharge time is 1.3:1.
Apart from the ESS mentioned above, utilizing the batteries embedded in EVs is considered a supplementary energy storage medium, providing extra grid-scale storage capacity to assist the island’s uptake of RES. The Renault ZOE with a 52 kWh battery capacity is the considered reference vehicle in this work. It is also assumed that all the EVs could absorb or inject power through low-speed power devices (chargers) with two different modes of 3.7 and 7.2 kW, and thus be capable of supporting “facilities” in low distribution grids that may exist in all dwellings or buildings (residential, hotels, services, commerce, etc.). It is assumed that all the EVs would participate in the V2G program while a sufficient bi-directional loading infrastructure exists, including the public and private stations. To construct scenarios closer to the real world, the availability and the connectivity of each EV are modeled under probability distribution functions associated with the travel patterns and the common working hours within 24 h. Section 5.2 describes the model in detail. The following presents the mathematical model of the proposed assets and the energy system of the island.

5.1. Model

This subsection describes the developed mathematical model. To evaluate the proposed integrated management of resources, each source was characterized, considering the operational limitations. The supply/demand equation was regarded as a hard constraint in the model, which will later be explained in detail. Then, the model was optimized by a Genetic Algorithm for the given simulation period. The total timeframe of the simulation period (three days) is split into 15 min segments. Let t { 1 , , T } be a one-time segment. Then we have the following definitions:
  • D ( t ) : Electricity Demand during t (excluding the EVs’ and RO’s demand);
  • W d ( t ) : Water Demand (m3) during t ;
  • W p ( t ) : Desalinated-Water Production (m3) during t ;
  • P i ( t ) : Power supplied by type ,   i = S , W , T P , during t ,
    • (S = Solar, W = Wind, and TP = Thermal Powerplant);
  • P R O ( t ) : RO desalination plant load (kW) during t ;
  • t a n k ( t ) : Desalinated water-tank level (m3) during t ;
  • S d i ( t ) : Discharged power (kW) of storage unit ,   i = 1 , , N S , during t ;
  • S c h i ( t ) : Charging power (kW) of storage unit ,   i = 1 , , N S , during t ;
  • S s o c i ( t ) : State-of-Charge (SoC) of storage unit ,   i = 1 , , N S , at time t ;
  • E V c i ( t ) : Consumption (kWh) of EV ,   i = 1 , , N EV , during t ;
  • E V c h i ( t ) : Charging outlet power (kW) of EV ,   i = 1 , , N E V , during t ;
  • E V d i ( t ) : Discharging outlet power (kW) of EV ,   i = 1 , , N E V , during t ;
  • E V s o c i ( t ) : State-of-Charge (SoC) of EV ,   i = 1 , , N E V , at time t ;
  • Q ( t ) : Curtailed RES power (kW) at time t ;
  • c f : Cost function ;
Given the above definitions, the S s o c i ( t ) , E V s o c i ( t ) , and t a n k ( t ) can be determined through Equations (1)–(3), respectively, as following:
S s o c i ( t ) = S s o c i ( t 1 ) + S c h i ( t ) 4 S d i ( t ) 4 ,             t = 2 , , T ;
E V s o c i ( t ) = E V s o c i ( t 1 ) + E V c h i ( t ) 4 E V d i ( t ) 4 E V c i ( t ) ,             t = 2 , , T ;
t a n k ( t ) = t a n k ( t 1 ) + W p ( t ) W d ( t ) ,             t = 2 , , T ,
where the S s o c i ( t ) , E V s o c i ( t ) , and t a n k ( t ) are subjected to:
S s o c M I N i S s o c i ( t ) S s o c M A X i ,             t { 1 , , T } ,             i { 1 , , N S } ;
E V s o c M I N E V s o c i ( t ) E V s o c M A X ,             t { 1 , , T } ,             i { 1 , , N E V } ;
t a n k M I N t a n k ( t ) t a n k M A X ,             t { 1 , , T } ;
where S s o c M I N i and S s o c M A X i are the minimum and maximum available energy of the storage system unit i . E V s o c M I N and E V s o c M A X are the minimum and maximum available energy of the embedded battery in each EV. Their available energy at the end of the simulation must be equal to or greater than the initially available energy through:
E V s o c i ( 1 ) E V s o c i ( T ) ,             i { 1 , , N E V } ,
and an analogous constraint is set for the desalination plant
t a n k M I N t a n k ( t ) t a n k M A X ,             t { 1 , , T } ;
t a n k ( 1 ) t a n k ( T ) .
Furthermore, the supply/demand at every time t is subjected to the following hard constraint:
i = s , w , t p P i ( t ) + i = 1 N S S d i ( t ) + i = 1 N E V E V d i ( t ) = D ( t ) + P R O ( t ) + Q ( t ) + i = 1 N S S c h i ( t ) + i = 1 N E V E V c h i
t { 1 , , T } . C f = m i n t = 1 T Q ( t )
The left side of the Equation (4) represents the sum of the supply assets power, and the right side presents the requested power demand plus the curtailed power Q ( t ) ; the sum of the supply assets presents a value being never smaller than the requested demand at time t. Equation (5) presents the cost function, minimizing Q ( t ) the total curtailed power. The model, for every scenario, was optimized by a Genetic Algorithm programmed in the computer-based Matlab software. The optimization continues until no improvements in the cost function are observed for the considered number of iterations. The number of iterations was set to 4000 for every scenario to find the optimal solution while increasing the number of EVs increased the computational time.

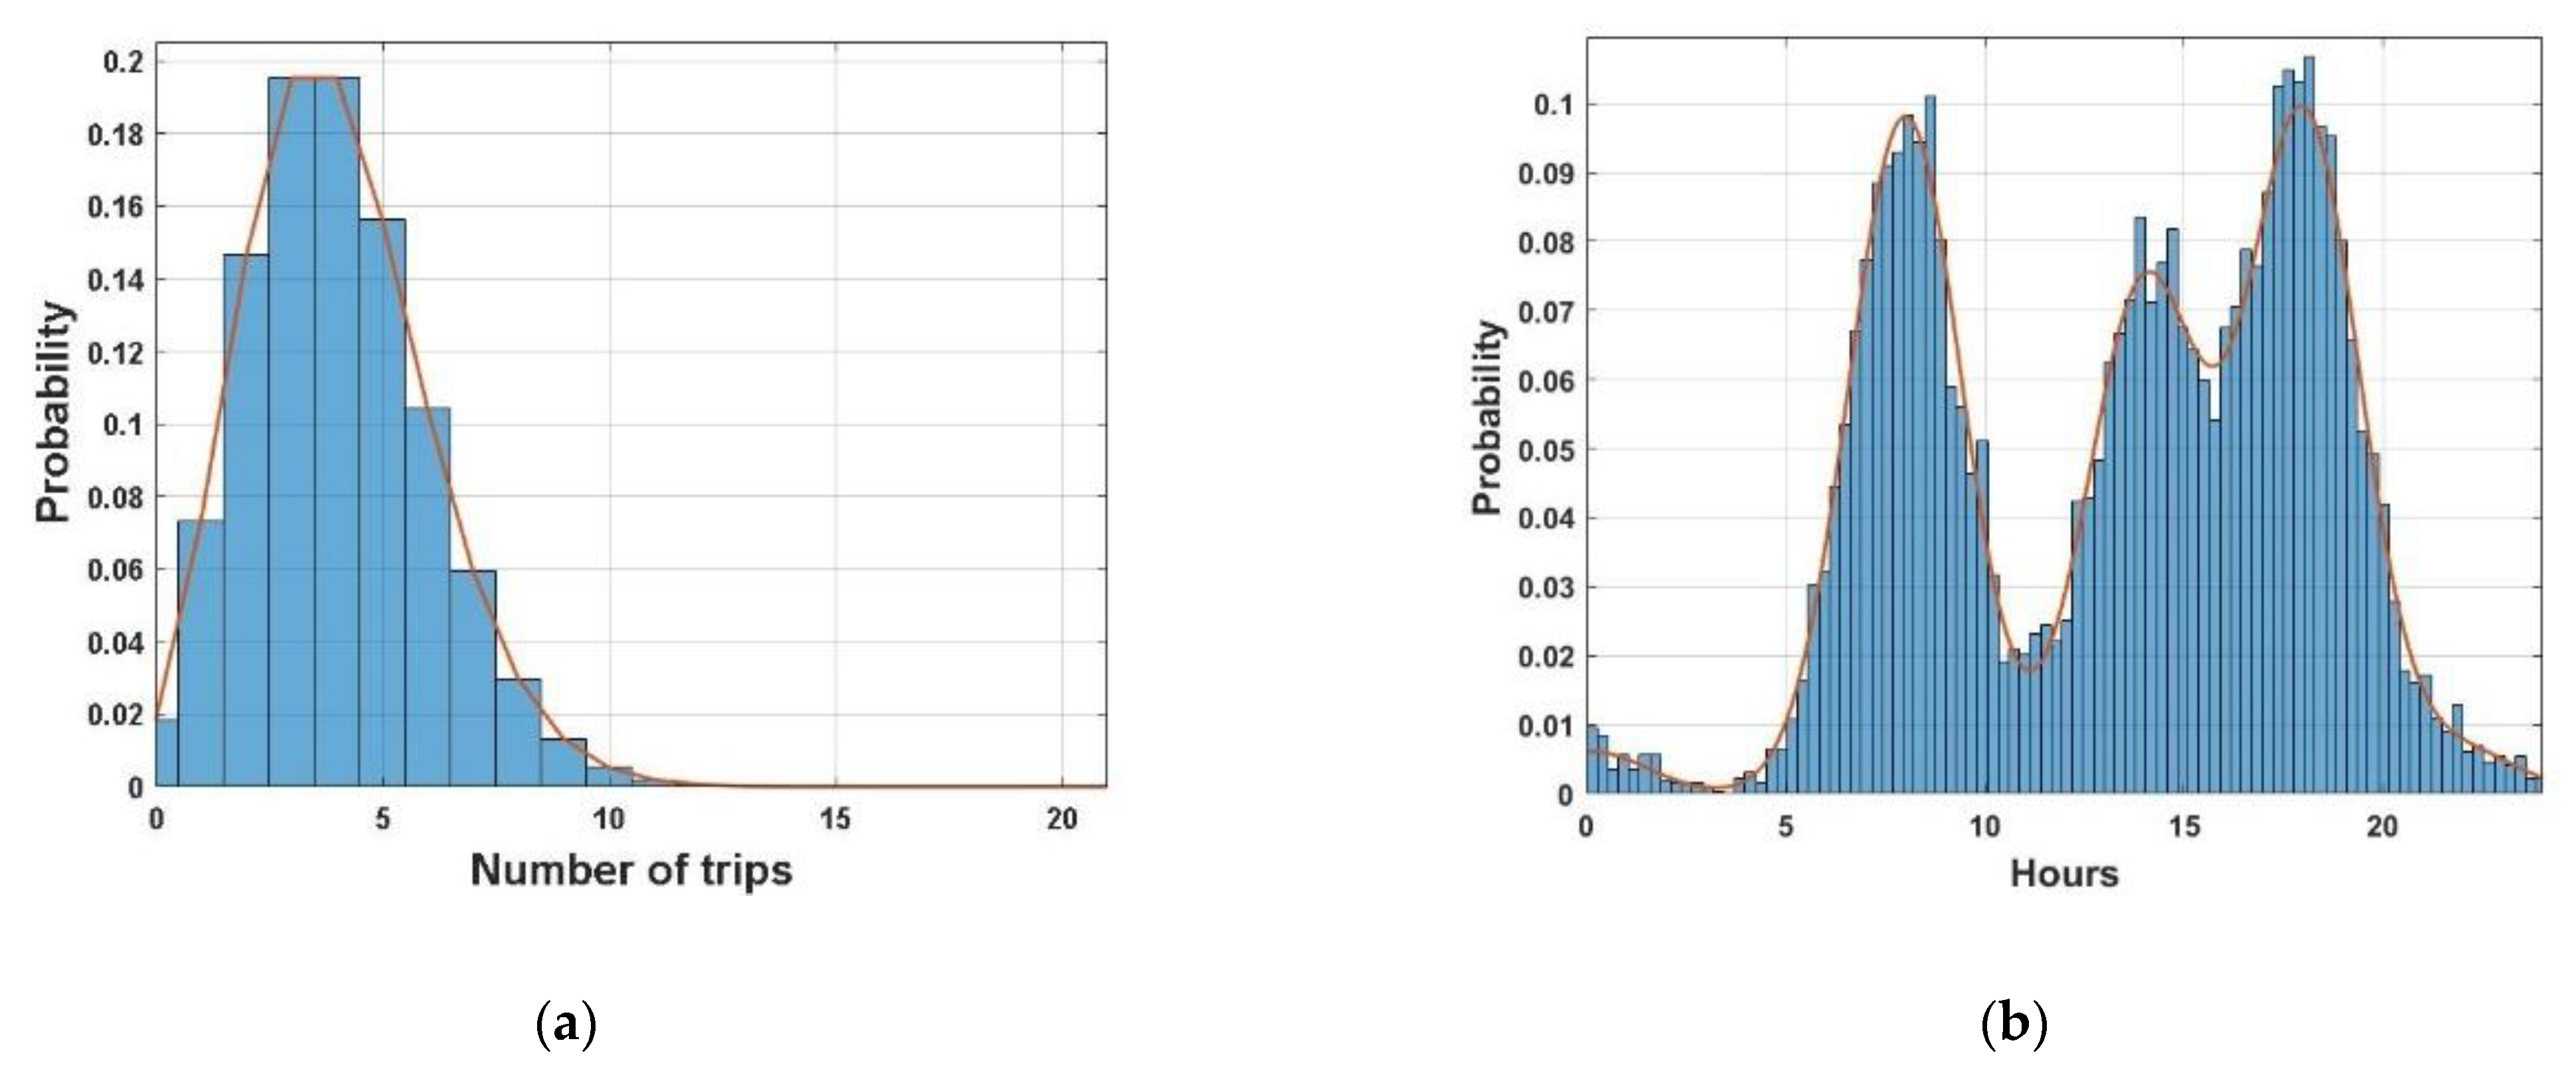
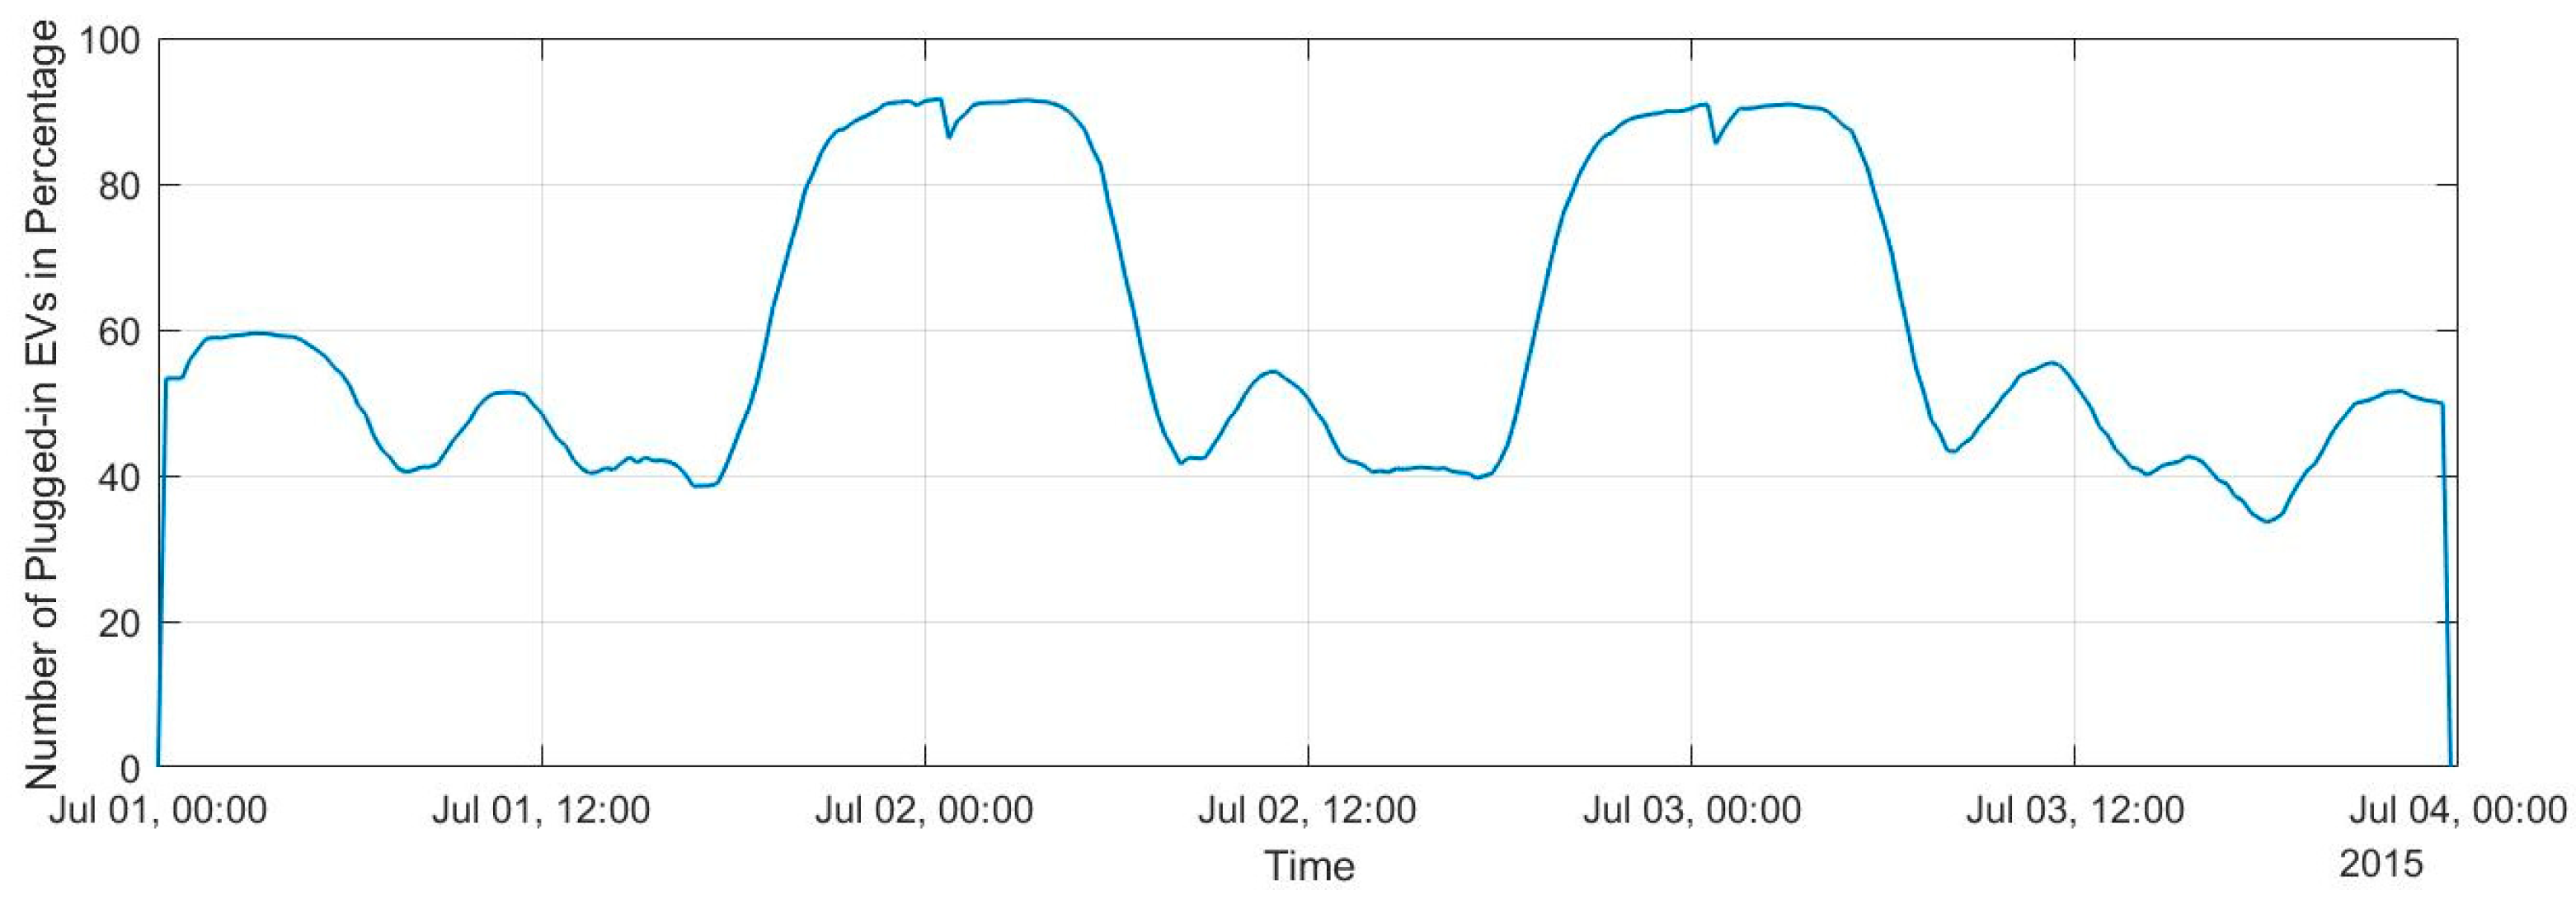
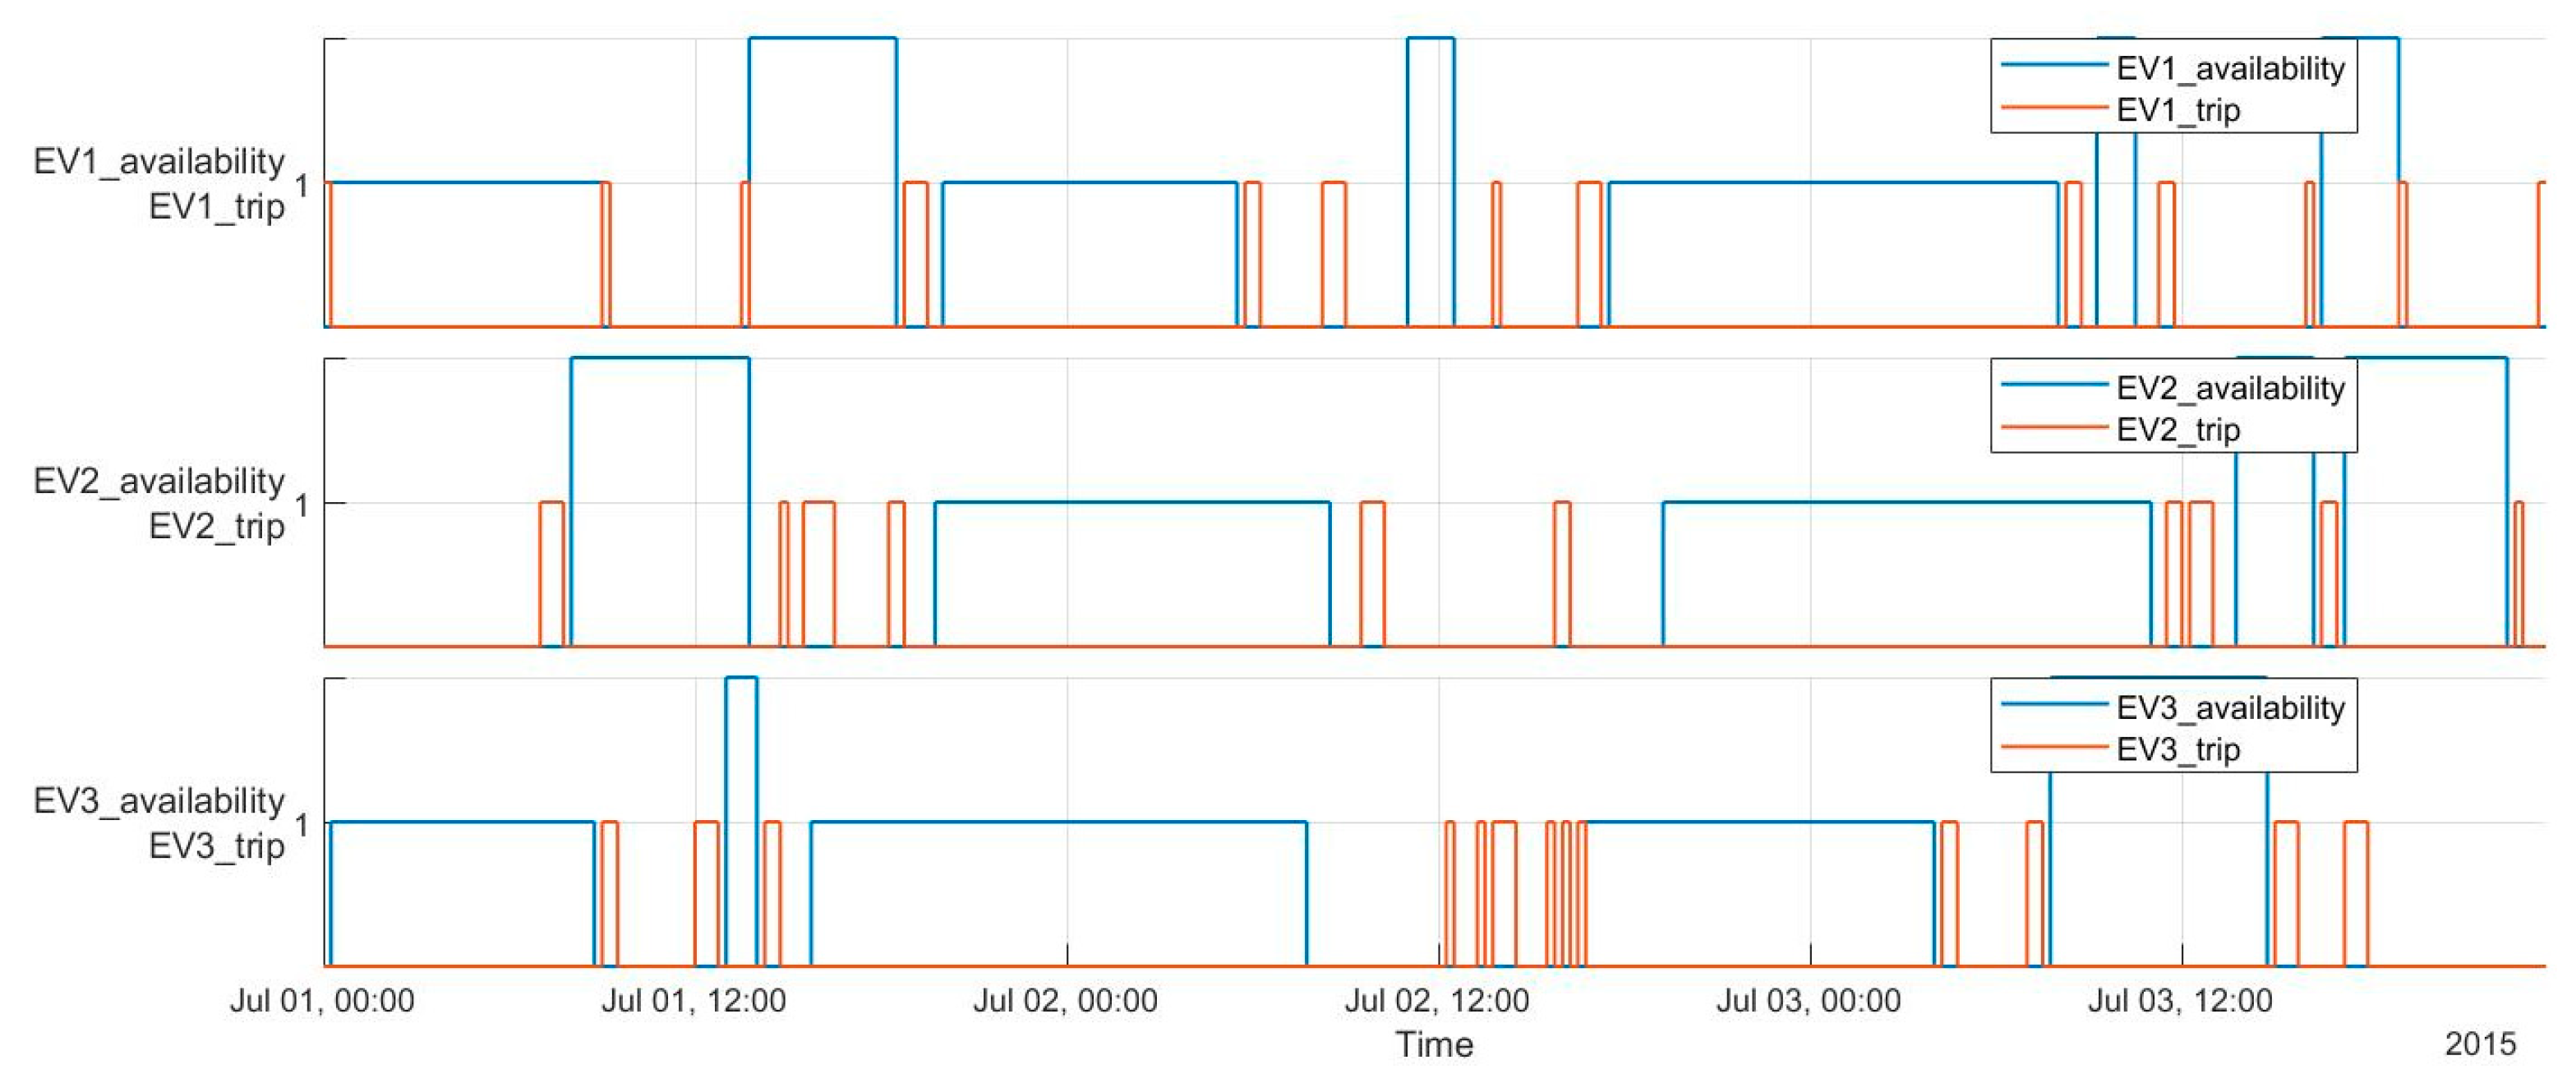
5.2. Modeling Electric Vehicles

The travel pattern and the EVs’ connectivity to the grid are modeled by using probability distributions. The Poisson distribution is a common method to model the daily number of trips [82]; hence, to model the travel events, as is shown in Figure 6a, a Poisson distribution with an average of 4 travels per day is used. Given the models developed and discussed by Donati et al. [82] and Brady and O’Mahony [83], each trip’s starting instant (departure time) is determined by following a Gaussian mixture distribution with multivariate Gaussian distribution components, having an average μ { 0.1 , 8 , 14 , 18 , 22 } representing hours during a day, a weight of ω = 2 , and a standard deviation σ { 0.05 , 0.8 , 0.6 , 0.8 , 0.05 } . Figure 6b demonstrates this distribution. Ultimately, the driven distances of each trip (km) follow a normal distribution with an average γ = 5   km and a standard deviation δ = 1 .
Finally, every vehicle’s availability (of being connected to the power grid) is determined as follows: if the EV is idle for at least 8 h (usually during the night), then it is considered that the car is connected to the grid via a type 1 connection (a bidirectional socket of 3.7 kW). If a vehicle is idle for less than 8 h and more than 1 h, then the connectivity of type 2 (a bidirectional socket of 7.4 kW) is considered during this time with a uniform probability of 0.5. Figure 7. demonstrates the available fleet (plugged-in vehicles) in percentage from an integrated perspective during three consecutive days.
As can be verified, fewer cars might be connected to the power grid (with a minimum of 35%) during the day when the probability of departures are higher, while during late nights, the total number of plugged-in vehicles reach a maximum rate of availability at 90% since they are mostly parked. Figure 8 illustrates the availability and traveling periods for three EVs separately.
It can be observed that most of the traveling would fall within the day, while for most of the nighttime, the EVs would be connected to the power grid through the type 1 loading station. It is worth mentioning that an EV would be connected to the charging station with an average of 66% of the total time.

6. Results

Three consecutive days (72 h) from the months of July, August, and December were selected to cover the seasonality variations associated with the RES’s availability and changes in the demand profile. Table 4 presents the obtained results from optimizing the proposed control model. The rows in yellow represent the existing power grid performance under only an increment penetration of RES (scenario zero). The other rows (in white and gray) represent the obtained results by optimizing the model for each presented scenario. To demonstrate the impacts of optimizing the integrated management of resources in each scenario, the ESS capacities and the number of EVs vary. In scenario one, the highest number of EVs without an ESS increment was considered, whereas the second scenario contains no EV contribution, and only an ESS increment was assumed.
As can be seen, the total demand for each period might differ mainly due to the number of introduced EVs and the amount of desalinated water for that scenario. The losses increase in those scenarios where ICAES are deployed, mainly because of the low efficiency associated with the round-trip charging/discharging of the ICAES. However, due to EVs’ batteries possessing better efficiency, the losses slightly decrease for scenarios 3, 4, and 5, when compared to the second scenario, as the number of EVs increases. During the 15th, 16th, and 17th of December, when there was an abundance of RES available and the demand was as low as half of the summertime, the presence of 2500 EVs could decrease the curtailments by 17% for the fifth scenario.
In the fifth scenario, the desalination unit would produce less potable water, assisting the system as a whole to be supplied by only the RES; whereas in the other scenarios, since the system could not achieve a 100% RES-based supply, the water supply system produces and stores higher amounts of potable water to reduce the curtailments. This can be proved by observing the amount of desalinated water and the curtailments for all scenarios for month December. The desalination in all scenarios operates at its maximum.
The obtained results revealed that the high penetration of EVs (the fifth scenario for each period) by optimizing the integrated management of resources could lower the curtailment events and reduce the dependence on fossil fuels to nearly zero. In addition, the Mix generation GWP100 index represents the environmental impacts associated with each system. As can be verified, it can be significantly reduced by decreasing the emitted energy by the TPP. Figure 9. presents the results obtained for two different scenarios in the month of July. Figure 9a represents the overall system performance for the island’s actual grid assets (Scenario 0) and Figure 9b shows the result of employing 2500 EVs plus increased ESSs (scenario 5).
As is illustrated in Figure 9b, the proposed optimized management of all resources let the TPP stay entirely off during the three days, and curtailments did not occur. RES could meet the total energy demand, whereas in Figure 9a, around 43% of the RES had to be rejected, and the TPP covered 30% of the island’s total demand. Figure 10 illustrates the results for scenario 5 in detail.
The V2G/G2V graph represents the accumulated power value (kW) associated with discharging and charging all the EVs from the aggregated point of view. As is shown, the EVs’ charging events took place mainly when the RESs availability (kW) exceeds the base-load of the island, while as the RESs availability drops, the EVs would participate in V2G to meet the demand. Figure 11 validates the average SoC of all the EVs. The dash lines illustrate the standard deviation of all the EVs’ SoC added to and subtracted from the average aggregated SoC. As is shown, the least SoC is about 30% and the maximum could reach 90% of the battery capacity.

7. Discussion

The absence of an interconnection cable makes the energy transition more challenging on the Porto Santo island. The small isolated power grid requires a system to operate efficiently during low and high seasons since it might be significantly affected by the seasonal tourists’ arrivals and the long-term variations in the RES availability. The validity of the proposed solution was examined by analyzing the system’s performances during two different periods of the year (July and December). The obtained results demonstrated that the proposed integrated management of resources could fulfill the idea of a 100% RES-based energy supply system for both the high and low demand seasons. However, a higher amount of RES’s power might be curtailed during the low season (winter) than in the high season (summer), mainly due to electricity demand profile changes.
It was shown that a large number of EVs, via the V2G concept, could assist the ESS in the island’s uptake of RES. As shown in Table 3, the EVs’ gradual increment could reduce the curtailment events up to 40% (for July and August), assisting the grid operator to meet the demand while reducing the dependence on fossil fuels. The grid-scale stacked charging events took place mainly during the day, and the stored energy was injected back to the power grid mainly at night when the RES production is insufficient to meet the demand. Nevertheless, the charging/discharging events for each EV might occur at different periods within 24 h, depending on the EV’s availability and the traveling demand.
One realizes that the proposed scenarios might be very costly since the EVs and the required infrastructure to enable the V2G technology are still very expensive. For this reason, in this work, only low-speed charging stations were assumed, which are cheaper in comparison to the fast-charging stations. As a distributed ESS, EVs’ batteries could enhance the operational flexibility within the distribution system while reducing the required capacity of centralized ESS [84]. Therefore, it would be possible to improve the power grid’s ability to facilitate a higher RES share through distributed generation (for instance: roof-top PV installations), reducing the required capacity of the expensive grid-scale ESS. Thus, an economic assessment might prove interesting to compare the long-term cost and benefits of deploying a large number of EVs (as a grid-scale ESS) with existing ESS technologies. Moreover, this work can be extended by considering the degradation rate associated with the battery’s charging/discharging process since the lifetime of the vehicle batteries might be affected by the V2G operation.

8. Conclusions

This work addressed the present energy system of the Porto Santo island and reviewed its ongoing energy transition program. Given the island’s geographical condition and energy needs, the integrated, optimized management of resources seems to be a promising strategy to further the island energy transition paradigm. The existing ROD plant and intensive transport electrification via load-shifting and enabling the V2G application could provide the required flexibility for moderating the foreseen fluctuations of both RES and the demand profiles. The need for 213,000 km of travel from 2500 EVs in three days (on average 85 km per vehicle) could be met by clean RES, while RES, in turn, could meet the total electricity demand of the island (i.e., base-load, water demand, transportation).
Although this work did not discuss the EV’s participation in the energy market, it demonstrated the benefits of a coordinated smart V2G/G2V concept from grid operators’ perspective. Optimizing the time and power (demand/supply) through a purposeful EVs charging/discharging procedure might be the most beneficial and efficient strategy to further the decarbonization paradigm on the island since transport electrification would contribute to reduced CO2 emissions, increased energy efficiency, better air quality and the integration of different energy sectors. Therefore, providing a sufficient number of bi-directional load stations, establishing communication between vehicles and system operators, and stimulating users to participate in DR programs are necessary to form a profitable V2G operation.
The holistic approach being explored by leading islands given in the literature magnifies the interaction of the numerous issues treated separately in large, interconnected grids. Their power grid is largely still vertically integrated without liberalized markets under the centralized decision-making structure covering the supply and demand in a holistic way [84,85]. Given the islands’ specificities, involving end-users in the energy supply and management regulated by a local authority might be advantageous. Furthermore, aggregating projects may ensure economies of scale, reduce costs, and benchmark energy costs. In addition, mechanisms aiming to facilitate the transport sector’s electrification on large scales could strongly contribute to greening Porto Santo’s energy system, implying that local authorities could shift some investment from the centralized storage to the dispersed storage (i.e., EV) while simultaneously incentivizing EV owners to participate in V2G strategies.

Author Contributions

Conceptualization, F.M.-D.; Data curation, R.T.; Formal analysis, R.T.; Investigation, R.T.; Methodology, R.T.; Software, R.T.; Supervision, Á.G. and F.M.-D.; Validation, Á.G.; Visualization, R.T.; Writing—original draft, R.T.; Writing—review & editing, Á.G. and F.M.-D. All authors have read and agreed to the published version of the manuscript.

Funding

This research was funded by the following institutions and projects: ARDITI—Agência Regional para o Desenvolvimento da Investigação, Tecnologia e Inovação under the scope of the Project M1420- 09-5369-FSE-000001—PhD Studentship; and the Portuguese Foundation for Science and Technology through Projeto Estratégico LA 9—UID/EEA/50009/2019; and the Project MITI Excell co-financed by Regional Development European Funds, for the Operational Programme ‘Madeira 14-20′—EIXO PRIORITÁRIO 1, of Região Autónoma da Madeira, with no. M1420-01-0145-FEDER-000002. The second author also was supported by the European Regional Development Fund in the framework of the COMPETE 2020 Programme through project UID/MULTI/00308/2020 and the FCT Portuguese Foundation for Science and Technology within project T4ENERTEC (POCI-01-0145-FEDER-029820).

Informed Consent Statement

Informed consent was obtained from all subjects involved in the study.

Data Availability Statement

Data was obtained from the local electricity company (Empresa de Electricidade da Madeira) and the local water supply company (Águas e Resíduos da Madeira, S.A.). Restrictions apply to the availability of data used in this work. The data could be available from corresponding author with only the permission of the aforementioned entities.

Conflicts of Interest

The authors declare no conflict of interest.

References

  1. IRENA. A Path to Prosperity: Renewable Energy for Islands. In Proceedings of the Third International Conference on Small Island Developing States (SIDS), Apia, Samoa, 1–4 September 2014; pp. 22–24. [Google Scholar]
  2. Kuang, Y.; Zhang, Y.; Zhou, B.; Li, C.; Cao, Y.; Li, L.; Zeng, L. A review of renewable energy utilization in islands. Renew. Sustain. Energy Rev. 2016, 59, 504–513. [Google Scholar] [CrossRef]
  3. Ioannidis, A.; Chalvatzis, K.J. Energy Supply Sustainability for Island Nations: A Study on 8 Global Islands. Energy Procedia 2017, 142, 3028–3034. [Google Scholar] [CrossRef]
  4. The Union of the Electricity Industry–EURELECTRIC. Towards the Energy Transition on Europe’s Islands; Eurelectric: Brussels, Belgium, 2017. [Google Scholar]
  5. Clean Energy for EU Islands Secretariat. EU Islands in the Energy Transition: A Catalogue of Good Practices; Clean Energy for EU Islands Secretariat: Brussels, Belgium, 2019. [Google Scholar]
  6. IRENA. Power System Flexibility for the Energy Transition. 2018. Available online: https://irena.org/-/media/Files/IRENA/Agency/Publication/2018/Nov/IRENA_Power_system_flexibility_1_2018.pdf (accessed on 5 March 2020).
  7. Islam, S.M. Increasing wind energy penetration level using pumped hydro storage in island micro-grid system. Int. J. Energy Environ. Eng. 2012, 3, 1–12. [Google Scholar] [CrossRef] [Green Version]
  8. Graciólica Lda. Graciólica Lda’s Microgrid Power Facility Providing 100% Renewable Energy to the Island of Graciosa. Available online: https://tractebel-engie.com/files/attachments/.1843/Press-Release-Graciosa-project.pdf (accessed on 23 May 2020).
  9. Eras-Almeida, A.A.; Egido-Aguilera, M.A. Hybrid renewable mini-grids on non-interconnected small islands: Review of case studies. Renew. Sustain. Energy Rev. 2019, 116, 109417. [Google Scholar] [CrossRef]
  10. TILOS Project—Eunice Energy Group. 2017. Available online: http://eunice-group.com/projects/tilos-project/ (accessed on 28 December 2020).
  11. Karthikeyan, V.; Rajasekar, S.; Das, V.; Pitchaivijaya, K.; Singh, A. Smart Energy Grid Design for Island Countries; Energy and Technology; Springer: Berlin/Heidelberg, Germany, 2017; pp. 125–157. [Google Scholar]
  12. SMILE H2020 SMart IsLands Energy system. 2020. Available online: Cutt.ly/2z0N8p5 (accessed on 16 March 2021).
  13. Colmenar-Santos, A.; Linares-Mena, A.R.; Borge-Diez, D.; Quinto-Alemany, C.D. Impact assessment of electric vehicles on islands grids: A case study for Tenerife (Spain). Energy 2017, 120, 385–396. [Google Scholar] [CrossRef]
  14. Gay, D.; Rogers, T.; Shirley, R. Small island developing states and their suitability for electric vehicles and vehicle-to-grid services. Util. Policy 2018, 55, 69–78. [Google Scholar] [CrossRef]
  15. Frydrychowicz-Jastrzębska, G. El Hierro Renewable Energy Hybrid System: A Tough Compromise. Energies 2018, 11, 2812. [Google Scholar] [CrossRef] [Green Version]
  16. Subiela, V.J.; de la Fuente, J.A.; Piernavieja, G.; Peñate, B. Canary Islands Institute of Technology (ITC) experiences in desalination with renewable energies (1996–2008). Desalin. Water Treat. 2009, 7, 220–235. [Google Scholar] [CrossRef]
  17. Mentis, D.; Karalis, G.; Zervos, A.; Howells, M.; Taliotis, C.; Bazilian, M.; Rogner, H. Desalination using renewable energy sources on the arid islands of South Aegean Sea. Energy 2016, 94, 262–272. [Google Scholar] [CrossRef]
  18. Gevorgian, V.; Corbus, D. Ramping Performance Analysis of the Kahuku Wind-Energy Battery Storage System; Management Report NREL/MP-5D00-59003 November 2013; National Renewable Energy Laboratory: Golden, CO, USA, 2003.
  19. Notton, G. Importance of islands in renewable energy production and storage: The situation of the French islands. Renew. Sustain. Energy Rev. 2015, 47, 260–269. [Google Scholar] [CrossRef]
  20. IRENA. Demand-Side Flexibility for Power Sector Transformation; International Renewable Energy Agency: Abu Dhabi, United Arab Emirates, 2019. [Google Scholar]
  21. Gelazanskas, L.; Gamage, K.A.A. Demand side management in smart grid: A review and proposals for future direction. Sustain. Cities Soc. 2014, 11, 22–30. [Google Scholar] [CrossRef]
  22. EMOBICITY. Financial Incentives for EVs Published in the Azores. Available online: https://www.interregeurope.eu/emobicity/news/news-article/8101/financial-incentives-for-evs-published-in-the-azores/ (accessed on 11 May 2021).
  23. Alam, M.J.E.; Muttaqi, K.M.; Sutanto, D. Effective Utilization of Available PEV Battery Capacity for Mitigation of Solar PV Impact and Grid Support with Integrated V2G Functionality. IEEE Trans. Smart Grid 2016, 7, 1562–1571. [Google Scholar] [CrossRef] [Green Version]
  24. Kumar, M.; Vyas, S.; Datta, A. A Review on Integration of Electric Vehicles into a Smart Power Grid and Vehicle-to-Grid Impacts. In Proceedings of the 8th International Conference on Power Systems (ICPS), Jaipur, India, 20–22 December 2019. [Google Scholar]
  25. Yu, R.; Zhong, W.; Xie, S.; Yuen, C.; Gjessing, S.; Zhang, Y. Balancing Power Demand Through EV Mobility in Vehicle-to-Grid Mobile Energy Networks. IEEE Trans. Ind. Inform. 2016, 12, 79–90. [Google Scholar] [CrossRef]
  26. Ding, Z.; Teng, F.; Sarikprueck, P.; Hu, Z. Technical Review on Advanced Approaches for Electric Vehicle Charging Demand Management. Part II: Applications in Transportation System Coordination and Infrastructure Planning. IEEE Trans. Ind. Appl. 2020, 56, 5695–5703. [Google Scholar] [CrossRef]
  27. Lopes, J.A.P.; Soares, F.J.; Almeida, P.M.R. Integration of electric vehicles in the electric power system. Proc. IEEE 2011, 99, 168–183. [Google Scholar] [CrossRef] [Green Version]
  28. Ding, Z.; Teng, F.; Sarikprueck, P.; Hu, Z. Technical Review on Advanced Approaches for Electric Vehicle Charging Demand Management. Part I: Applications in Electric Power Market and Renewable Energy Integration. IEEE Trans. Ind. Appl. 2020, 56, 5684–5694. [Google Scholar] [CrossRef]
  29. Mao, T.; Lau, W.H.; Shum, C.; Chung, H.S.H.; Tsang, K.F.; Tse, N.C.F. A Regulation Policy of EV Discharging Price for Demand Scheduling. IEEE Trans. Power Syst. 2018, 33, 1275–1288. [Google Scholar] [CrossRef]
  30. Al-Awami, A.T.; Sortomme, E. Coordinating vehicle-to-grid services with energy trading. IEEE Trans. Smart Grid 2012, 3, 453–462. [Google Scholar] [CrossRef]
  31. Shafie-khah, M.; Moghaddam, M.P.; Sheikh-El-Eslami, M.K.; Rahmani-Andebili, M. Modeling of interactions between market regulations and behavior of plug-in electric vehicle aggregators in a virtual power market environment. Energy 2012, 40, 139–150. [Google Scholar] [CrossRef]
  32. Andaloro, A.P.F.; Salomone, R.; Andaloro, L.; Briguglio, N.; Sparacia, S. Alternative energy scenarios for small islands: A case study from Salina Island (Aeolian Islands, Southern Italy). Renew. Energy 2012, 47, 135–146. [Google Scholar] [CrossRef]
  33. Dorotić, H.; Doračić, B.; Dobravec, V.; Pukšec, T.; Krajačić, G.; Duić, N. Integration of transport and energy sectors in island communities with 100% intermittent renewable energy sources. Renew. Sustain. Energy Rev. 2019, 99, 109–124. [Google Scholar] [CrossRef]
  34. Gils, H.C.; Simon, S. Carbon neutral archipelago—100% renewable energy supply for the Canary Islands. Appl. Energy 2017, 188, 342–355. [Google Scholar] [CrossRef] [Green Version]
  35. GIS Lounge 2020. Available online: https://www.gislounge.com/ (accessed on 6 May 2020).
  36. Blechinger, P.; Seguin, R.; Cader, C.; Bertheau, P.; Breyer, C. Assessment of the global potential for renewable energy storage systems on small islands. Energy Procedia 2014, 46, 294–300. [Google Scholar] [CrossRef] [Green Version]
  37. IRENA. Renewables and Electricity Storage: A Technology Roadmap for REmap 2030; International Renewable Energy Agency: Abu Dhabi, United Arab Emirates, 2015. [Google Scholar]
  38. Marín, C.; Zervos, A.; Alves, M. 100% RES-A Challenge for Island Sustainable Development; Instituto Superior Técnico: Lisbon, Portugal, 2005. [Google Scholar]
  39. Maldonado, E. Energy in the EU Outermost Regions (Renewable Energy, Energy Efficiency); Final Report; European Commission: Brussels, Belgium, 2017; pp. 1–21. [Google Scholar]
  40. EEM—Empresa de Electricidade da Madeira S.A. Annual Sustainability Report 2018; EEM: Funchal, Portugal, 2018; Available online: cutt.ly/GnRPSpD (accessed on 10 March 2019).
  41. Clean Energy for EU Islands Secretariat. Clean Energy Transition Agenda Aran Islands; Clean Energy for EU Islands Secretariat: Brussels, Belgium, 2019. [Google Scholar]
  42. Aran Islands Energy Co-op. Available online: http://www.aranislandsenergycoop.ie/ (accessed on 14 March 2021).
  43. Mathiesen, B.V.; Hansen, K.; Ridjan, I.; Lund, H.; Nielsen, S. Samsø Energy Vision 2030 Converting Samsø to 100% Renewable Energy; Aalborg University: Aalborg, Denmark, 2015. [Google Scholar]
  44. SMILE Smart Island Energy Systems. Deliverable D3.1 Specifications and Data Report for the Samsø Demonstrator 2017. Available online: http://www.h2020smile.eu/wp-content/uploads/2018/06/Deliverable-D3.1.pdf (accessed on 1 February 2021).
  45. González-Garrido, A.; Thingvad, A.; Gaztañaga, H.; Marinelli, M. Full-scale electric vehicles penetration in the Danish Island of Bornholm—Optimal scheduling and battery degradation under driving constraints. J. Energy Storage 2019, 23, 381–391. [Google Scholar] [CrossRef]
  46. Walker-Leigh, V. Small Islands Push for New Energy. 2012. Available online: https://ourworld.unu.edu/en/small-islands-push-for-new-energy (accessed on 15 January 2019).
  47. AREAM; DRCIE; EEM. Sustainable Energy Action Plan of Porto Santo Island under The Pact of Islands; AREAM: Funchal, Portugal, 2012; Available online: https://aream.pt/files/2016/05/ISEAP_Porto_Santo_EN.pdf (accessed on 10 March 2017).
  48. EEM—Empresa de Electricidade da Madeira S.A. Annual Report 2015; EEM: Funchal, Portugal, 2015; Available online: cutt.ly/GnRPSpD (accessed on 10 March 2017).
  49. De Melo, M.T.C.; Shandilya, R.N.; Silva, J.B.P.; Postma, D. Volcanic glass leaching and the groundwater geochemistry on the semi-arid Atlantic island of Porto Santo. Appl. Geochem. 2020, 114, 104470. [Google Scholar] [CrossRef]
  50. EEM—Empresa de Electricidade da Madeira S.A. Annual Report 2019; EEM: Funchal, Portugal, 2019; Available online: cutt.ly/GnRPSpD (accessed on 10 December 2020).
  51. EEM—Empresa de Electricidade da Madeira S.A. Annual Sustainability Report 2019; EEM: Funchal, Portugal, 2019; Available online: cutt.ly/GnRPSpD (accessed on 10 December 2020).
  52. Gouveia, A.; Sousa, M.J.; Rodrigues, G.; Martins, M. Madeira em Números 2018 (DREM); Direção Regional de Estatística da Madeira: Funchal, Portugal, 2019.
  53. Suberu, M.Y.; Mustafa, M.W.; Bashir, N. Energy storage systems for renewable energy power sector integration and mitigation of intermittency. Renew. Sustain. Energy Rev. 2014, 35, 499–514. [Google Scholar] [CrossRef]
  54. Akinyele, D.O.; Rayudu, R.K. Review of energy storage technologies for sustainable power networks. Sustain. Energy Technol. Assess. 2014, 8, 74–91. [Google Scholar] [CrossRef]
  55. Zakeri, B.; Syri, S. Electrical energy storage systems: A comparative life cycle cost analysis. Renew. Sustain. Energy Rev. 2015, 42, 569–596. [Google Scholar] [CrossRef]
  56. Bradbury, S.; Price, A. Storage Business Models in the UK Market; Pöyry Management Consulting (UK) Ltd.: Oxford, UK, 2014. [Google Scholar]
  57. Carnegie, R.; Gotham, D.; Nderitu, D.; Preckel, P.V. Utility Scale Energy Storage Systems: Benefits. Applications, and Technologies. 2013. Available online: https://www.purdue.edu/discoverypark/energy/assets/pdfs/SUFG/publications/SUFG%20Energy%20Storage%20Report.pdf (accessed on 12 January 2021).
  58. Thien, T.; Axelsen, H. Planning of Grid-Scale Battery Energy Storage Systems: Lessons Learned from a 5 MW Hybrid Battery Storage Project in Germany. 2015. Available online: https://core.ac.uk/download/pdf/36657235.pdf (accessed on 2 February 2021).
  59. Faunce, T.A.; Prest, J.; Su, D.; Hearne, S.J.; Iacopi, F. On-grid batteries for large-scale energy storage: Challenges and opportunities for policy and technology. MRS Energy Sustain. 2018, 5, 1–12. [Google Scholar] [CrossRef] [Green Version]
  60. Bollinger, B.; Staubly, R. Demonstrating a Modular, Market-Ready Energy Storage System That Uses Compressed Air as a Storage Medium. 2012. Available online: 24ut.ly/knYvQgv (accessed on 15 December 2020).
  61. Budt, M.; Wolf, D.; Span, R.; Yan, J. A review on compressed air energy storage: Basic principles, past milestones and recent developments. Appl. Energy 2016, 170, 250–268. [Google Scholar] [CrossRef]
  62. Tallini, A.; Vallati, A.; Cedola, L. Applications of micro-CAES systems: Energy and economic analysis. Energy Procedia 2015, 82, 797–804. [Google Scholar] [CrossRef] [Green Version]
  63. Salvini, C.; Mariotti, P.; Giovannelli, A. Compression and Air Storage Systems for Small Size CAES Plants: Design and Off-design Analysis. Energy Procedia 2017, 107, 369–376. [Google Scholar] [CrossRef]
  64. SedighNejad, H.; Iqbal, T.; Quaicoe, J. Compressed Air Energy Storage System Control and Performance Assessment Using Energy Harvested Index. Electronics 2014, 3, 1–21. [Google Scholar] [CrossRef]
  65. Minutillo, M.; Lavadera, A.L.; Jannelli, E. Assessment of design and operating parameters for a small compressed air energy storage system integrated with a stand-alone renewable power plant. J. Energy Storage 2015, 4, 135–144. [Google Scholar] [CrossRef]
  66. Bollinger, B. Demonstration of Isothermal Compressed Air Energy Storage to Support Renewable Energy Production; SustainX Inc.: Seabrook, NH, USA, 2015. [Google Scholar]
  67. Alami, A.H.; Aokal, K.; Abed, J.; Alhemyari, M. Low pressure, modular compressed air energy storage (CAES) system for wind energy storage applications. Renew. Energy 2017, 106, 201–211. [Google Scholar] [CrossRef]
  68. Xiang, J.I.A.; Ning, C.U.I. TICC-500 energy storage phase of modeling and thermal properties. Energy Storage Sci. Technol. 2017, 6, 135. [Google Scholar]
  69. Lund, H.; Salgi, G. The role of compressed air energy storage (CAES) in future sustainable energy systems. Energy Convers. Manag. 2009, 50, 1172–1179. [Google Scholar] [CrossRef]
  70. Venkataramani, G.; Parankusam, P.; Ramalingam, V.; Wang, J. A review on compressed air energy storage—A pathway for smart grid and polygeneration. Renew. Sustain. Energy Rev. 2016, 62, 895–907. [Google Scholar] [CrossRef]
  71. Pinto, F.S.; Marques, R.C. Desalination projects economic feasibility: A standardization of cost determinants. Renew. Sustain. Energy Rev. 2017, 78, 904–915. [Google Scholar] [CrossRef]
  72. Gude, V.G. Desalination and sustainability—An appraisal and current perspective. Water Res. 2016, 89, 87–106. [Google Scholar] [CrossRef] [PubMed]
  73. Shekarchi, N.; Shahnia, F. A comprehensive review of solar-driven desalination technologies for off-grid greenhouses. Int. J. Energy Res. 2019, 43, 1357–1386. [Google Scholar] [CrossRef]
  74. Kim, J.S.; Chen, J.; Garcia, H.E. Modeling, control, and dynamic performance analysis of a reverse osmosis desalination plant integrated within hybrid energy systems. Energy 2016, 112, 52–66. [Google Scholar] [CrossRef] [Green Version]
  75. Nadel, S. Electrification in the Transportation, Buildings, and Industrial Sectors: A Review of Opportunities, Barriers, and Policies. Curr. Sustain. Energy Rep. 2019, 6, 158–168. [Google Scholar] [CrossRef]
  76. Blonsky, M.; Nagarajan, A.; Ghosh, S.; McKenna, K.; Veda, S.; Kroposki, B. Potential Impacts of Transportation and Building Electrification on the Grid: A Review of Electrification Projections and Their Effects on Grid Infrastructure. Operation, and Planning. Curr. Sustain. Energy Rep. 2019, 6, 169–176. [Google Scholar] [CrossRef]
  77. Capuder, T.; Sprčić, D.M.; Zoričić, D.; Pandžić, H. Review of challenges and assessment of electric vehicles integration policy goals: Integrated risk analysis approach. Int. J. Electr. Power Energy Syst. 2020, 119, 105894. [Google Scholar] [CrossRef]
  78. Yilmaz, M.; Krein, P.T. Review of the impact of vehicle-to-grid technologies on distribution systems and utility interfaces. IEEE Trans. Power Electron. 2013, 28, 5673–5689. [Google Scholar] [CrossRef]
  79. Kester, J.; Noel, L.; de Rubens, G.Z.; Sovacool, B.K. Promoting Vehicle to Grid (V2G) in the Nordic region: Expert advice on policy mechanisms for accelerated diffusion. Energy Policy 2018, 116, 422–432. [Google Scholar] [CrossRef]
  80. Torabi, R.; Gomes, A.; Morgado-Dias, F. The Duck Curve Characteristic and Storage Requirements for Greening the Island of Porto Santo. In Proceedings of the 2018 Energy and Sustainability for Small Developing Economies (ES2DE), Funchal, Portugal, 9–12 July 2018; pp. 1–7. [Google Scholar]
  81. Mei, S.W.; Wang, J.; Tian, F.; Chen, L.; Xue, X.; Lu, Q.; Zhou, Y.; Zhou, X. Design and engineering implementation of non-supplementary fired compressed air energy storage system: TICC-500. Sci. China Technol. Sci. 2015, 58, 600–611. [Google Scholar] [CrossRef]
  82. Donati, A.; Dilara, P.; Thiel, C.; Spadaro, A.; Gkatzoflias, D.; Drossinos, Y. Individual Mobility: From Conventional to Electric Cars; Publications Office of the European Union: Luxembourg, 2015. [Google Scholar]
  83. Brady, J.; O’Mahony, M. Modelling charging profiles of electric vehicles based on real-world electric vehicle charging data. Sustain. Cities Soc. 2016, 26, 203–216. [Google Scholar] [CrossRef]
  84. Erdinc, O.; Tascikaraoglu, A.; Paterakis, N.G.; Dursun, I.; Sinim, M.C.; Catalao, J.P.S. Comprehensive Optimization Model for Sizing and Siting of DG Units, EV Charging Stations, and Energy Storage Systems. IEEE Trans. Smart Grid 2018, 9, 3871–3882. [Google Scholar] [CrossRef]
  85. Tsuchida, T.B. Renewables Integration on Islands. In Renewable Energy Integration: Practical Management of Variability, Uncertainty, and Flexibility in Power Grids, 2nd ed.; Academic Press: Cambridge, MA, USA, 2017; pp. 319–329. [Google Scholar]
Figure 1. Daily electricity and water demand profile for the year 2015. Presented data were gathered through communications with the local water company (Aguas e Residuos da Madeira, S. A.) and the local electricity company (Empresa de Elelectricidade da Madeira).
Energies 14 03439 g001
Figure 2. Energy supply and demand for 2015, adapted from the annual report published by the EEM [48]. (a) Electricity generation by share of each resource in percentage. (b) Consumption by activity.
Energies 14 03439 g002
Figure 3. Existing assets in the electricity, transportation, and water supply sectors on Porto Santo (2018). Data from EEM [50,51] and the island’s statistical report [52].
Energies 14 03439 g003
Figure 4. Accumulated daily Energy demand (2015) versus increased RES production (wind and solar) for the same year. Presented data were gathered through communications with the local electricity company (EEM).
Energies 14 03439 g004
Figure 5. RES availability and electricity, demand, and the net-demand of the island for two consecutive days. (a) presents the island’s current situation; (b) illustrates a high RES (solar and wind) penetration for the same period.
Energies 14 03439 g005
Figure 6. (a) Probability distribution for the number of journeys per day (λ = 4); (b) Probability of departure time during 24 h.
Energies 14 03439 g006
Figure 7. The EVs availability rate.
Energies 14 03439 g007
Figure 8. Availability of three selected EVs and their trip time separately. The shortest travel duration is 15 min. For the availability graphs (blue line), one stands for a connection of 3.7 kw, and 2 represents a connection of 7.4 kW.
Energies 14 03439 g008
Figure 9. Overall system performance for the 1st, 2nd, and 3rd of July. (a) represents the results for the actual condition of the grid assets. (b) represents a scenario with 2500 EVs, BESS, and ICAES.
Energies 14 03439 g009aEnergies 14 03439 g009b
Figure 10. The result of optimized, integrated management of resources during 36 h. The solid black line represents the aggregated V2G/G2V power in kW.
Energies 14 03439 g010
Figure 11. Average and the standard deviation of aggregated EVs’ SoC under coordinated charging/discharging management.
Energies 14 03439 g011
Table 1. Acronyms.
Table 1. Acronyms.
RESRenewable Energy Resources.
TPPThermal Power Plant.
EVElectric Vehicle.
V2GVehicle-to-Grid.
ESSEnergy Storage System.
BESSBattery based Energy Storage
RODReverse Osmosis Desalination Plant.
CAESCompressed Air Energy Storage System.
DSFDemand Side Flexibility.
DRDemand Response.
EEMEmpresa da Electricidade da Madeira, the local electricity company.
Table 2. Key characteristics of Porto Santo and other selected islands.
IslandCountrySize (km2)Population
(Inhabitants)
Tourism
(Visitors per Year)
Energy Transition StatusInstalled RES Capacity (MWp)Resources & TechnologiesInterconnectionTransport ElectrificationElectricity Price
(Euro/kWh)
Porto Santo [40] Portugal425500100,000Middle>3.10Oil, diesel, petrol, gas, solar, wind, BESS, APL *NoStarting0.25
Tilos
[10]
Greece6150013,000Advanced1.00Diesel, wind, solar, BESS, microgridYesN/A0.23
PantelleriaItaly84775956,000Starting~Diesel, sea waves, solar, windNoN/A0.27
AmelandNetherlands2683683550,000+Advanced>6.10Solar, solar-heating, fuel-cell, gas, H2, CHP, AEPT **, APLYes+Advanced0.20
Aran
[41,42]
Ireland461300400,000Middle<0.5Oil, gas, mini-solar, CHP, heat-pumps, considerable EVs, APL, AEC ***.YesAdvanced0.29
GighaThe UK1416010,000Advancedn/aOil, diesel, gas, wood, solar-heating, wind, AECYesStarting0.27
Samsø
[43]
Denmark1123724400,000+Advanced23Wind, biomass, solar heating, biogas fuel, EVs, AECYesAdvanced0.34
El Hierro
[15]
Spain26811,0008000Advanced11.5Diesel, Wind, reverse-hydroNoStarting0.25
* APL stands for Advanced Public Lightening, ** AEPT stands for Advanced Electric Public Transport, *** AEC stands for Active Energy Community.
Table 3. Existing and proposed energy system assets in Porto Santo.
ScenariosTPP
(MWp)
Wind
(MWp)
Annual Production (MWh)PV
(MWp)
Annual Production (MWh)BESS
(MW/MWh)
ICAES *
(MW/MWh)
ROD
(m3 Day−1)
Water Tank
(m3)
Number of EVs
Existing161.11.522.383.124/3015,700n/a20
Proposal41521.471722.688/65/1515,70015,0000–2500
* Isothermal Compressed Air Energy Storage.
Table 4. The obtained result for three days of optimized, integrated management of resources under high-RES penetration on the Porto Santo’s power grid.
Simulation PeriodScenariosNumber of EVsICAES
(MW/MWh)
Li-ion BESS (MW/MWh)Losses (MWh)Total Demand
(MWh)
EVs Demand
(MWh)
Distance Driven
(1000 × km)
ROD Consumption (MWh)Desalinated Water (1000 × m3)RES’s Share (%)Curtailed RES (%)TPP ‘s Share (%)Mix Generation GWP100 (ton CO2 eq)
1st,2nd,3rd July00̶4/32349̶̶882069%43%31%103
12500̶4/3442932213902183%19%18%59
205/158/629353̶̶782085%28%15%63
35005/158/626358642721989%22%11%52
415005/158/62337318128872096%8%4%37
525005/158/621401322136216100%0%0%29
5th,6th,7th August00̶4/32391̶̶742069%37%31%111
12500̶4/3347731214792285%27%15%53
205/158/628388̶̶711981%23%19%78
35005/158/627402644701889%19%11%72
415005/158/62443319.42129772098%6%2%42
525005/158/62146531.602146617100%0%0%38
14th,15th,16th
December
00̶4/31277̶̶792090%68%10%38
12500̶4/3133132.302158020100%63%0%15
205/158/610277̶̶782096%64%4%21
35005/158/662886.4042782098%61%2%18
415005/158/6430919.161277920100%57%0%15
525005/158/6233132.302187920100%51%0%15
Publisher’s Note: MDPI stays neutral with regard to jurisdictional claims in published maps and institutional affiliations.

