
Accessible Battery Model with Aging Dependency


Abstract
:1. Introduction
2. Materials and Methods
2.1. Classical Models of Rechargeable Cells
2.2. Aging Process
2.3. Modeling a Battery
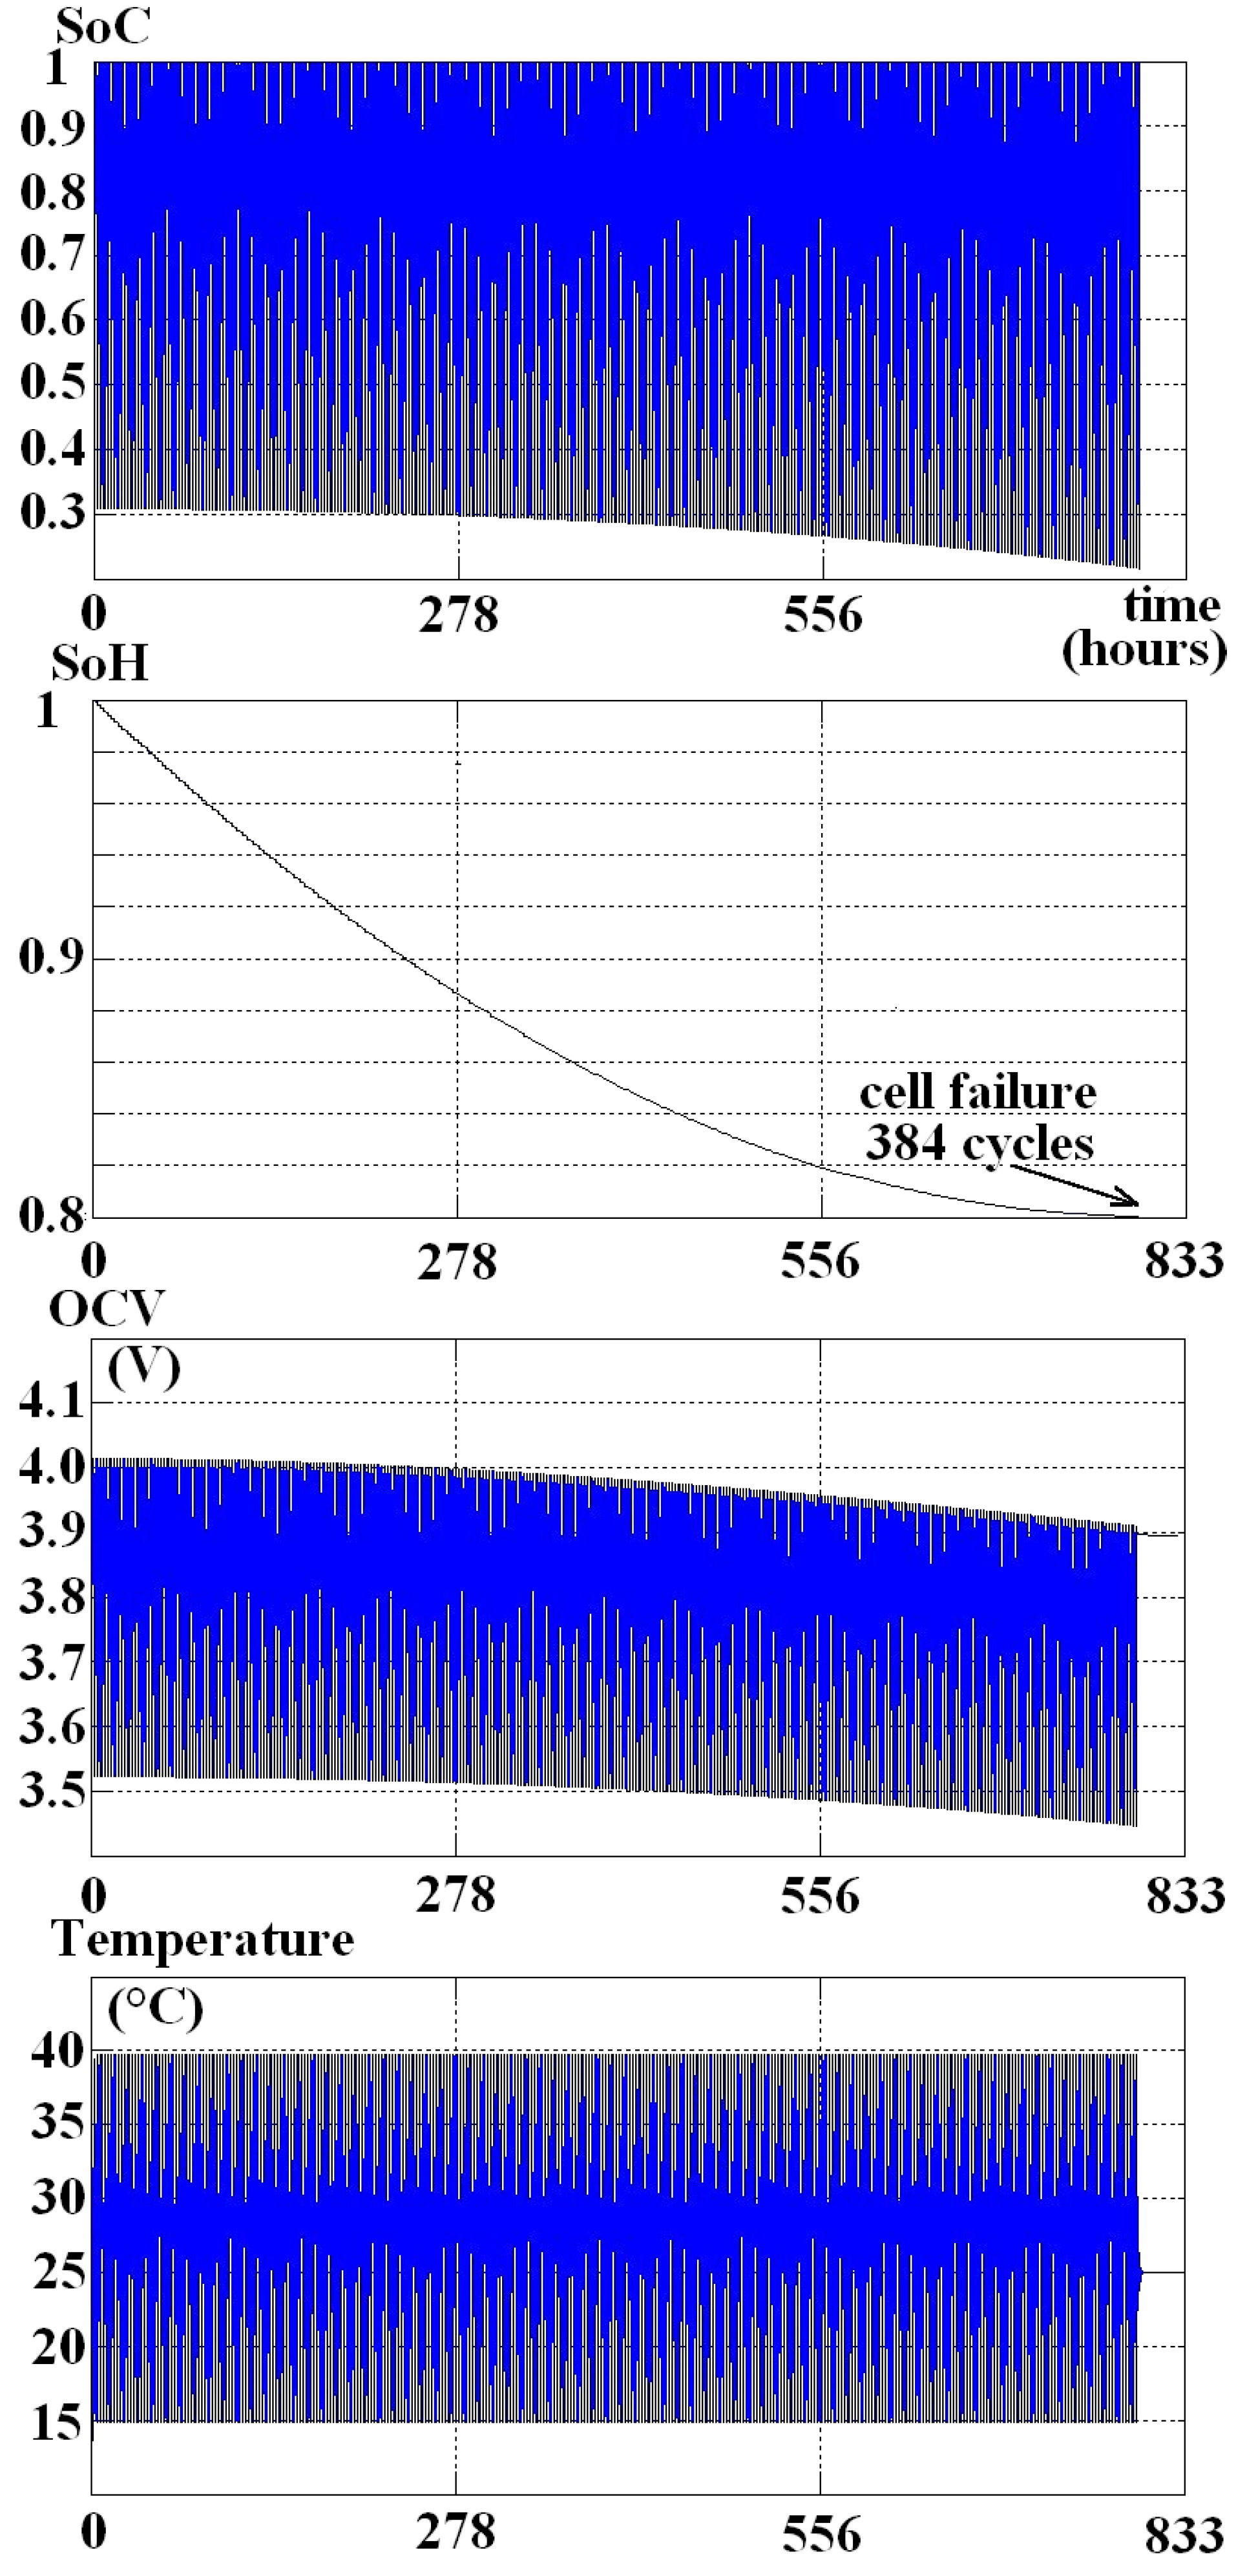
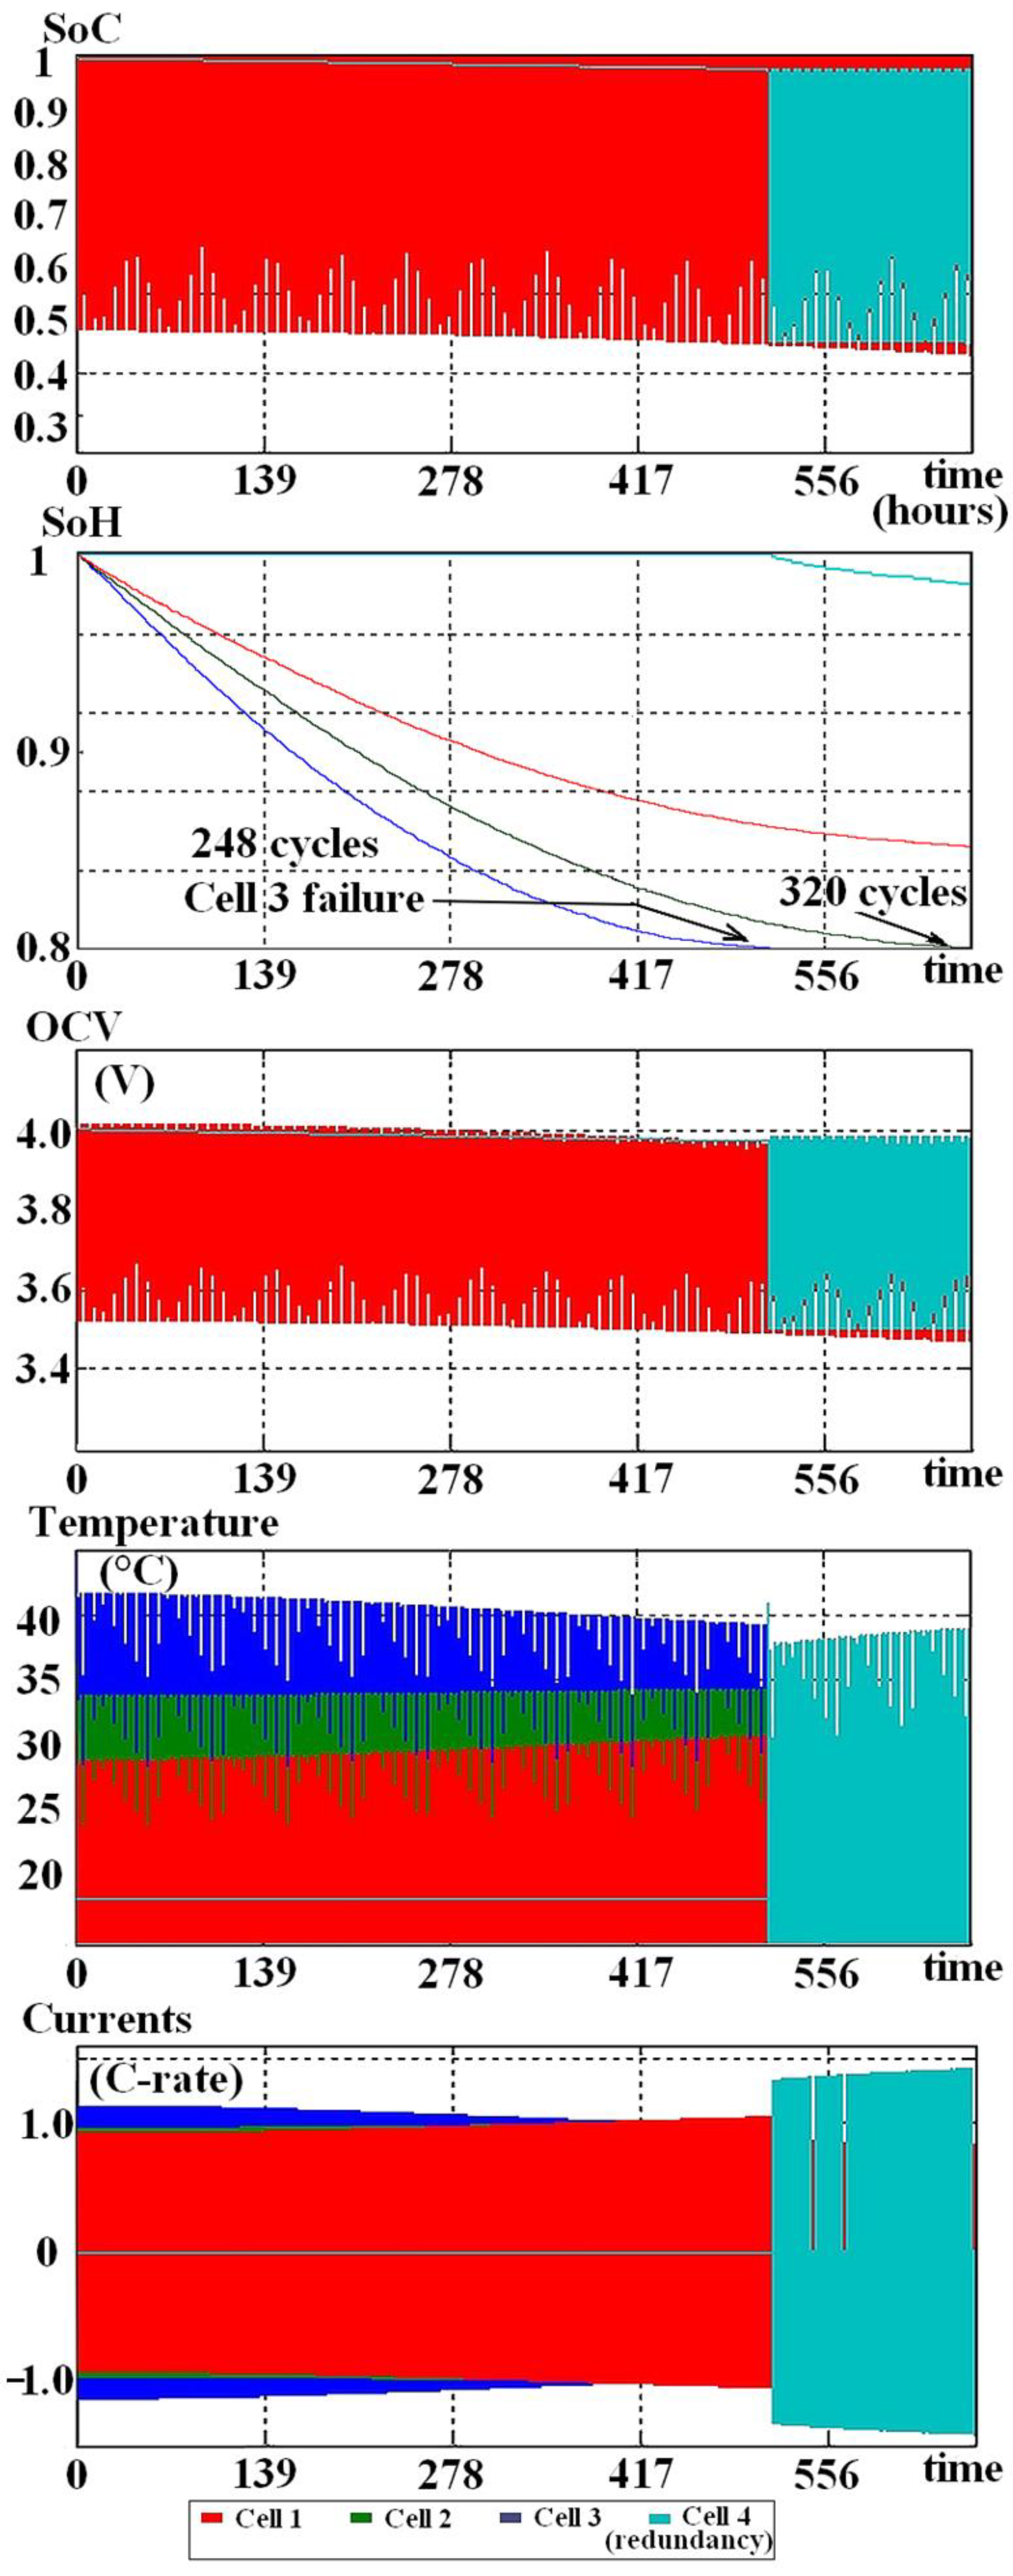
2.4. Simulation of the Aging
3. Results
4. Conclusions
Author Contributions
Funding
Acknowledgments
Conflicts of Interest
References
- Ye, Y.; Cheng, K.W.E. Modeling and Analysis of Series-Parallel Switched-Capacitor Voltage Equalizer for Battery/Supercapacitor Strings. IEEE J. Emerg. Sel. Top. Power Electron. 2015, 3, 977–983. [Google Scholar] [CrossRef]
- Bardanov, A.I.; Vasilkov, O.S.; Pudkova, T.V. Modeling the process of redistributing power consumption using energy storage system with various configurations to align the electrical loads schedule. J. Phys. Conf. Ser. 2021, 1753, 012013. [Google Scholar] [CrossRef]
- Pudkova, T.; Bardanov, A. Principles of electricity metering in networks with non-liner load. E3S Web Conf. 2019, 140, 07003. [Google Scholar] [CrossRef] [Green Version]
- Farhadi, M.; Mohammed, O. Energy Storage Technologies for High-Power Applications. IEEE Trans. Ind. Appl. 2016, 52, 1953–1961. [Google Scholar] [CrossRef]
- Tseng, K.H.; Shum, C.K.; Kim, J.-W.; Wang, X.; Zhu, K.; Cheng, X. Integrating Landsat Imageries and Digital Elevation Models to Infer Water Level Change in Hoover Dam. IEEE J. Sel. Top. Appl. Earth Obs. Remote Sens. 2016, 9, 1696–1709. [Google Scholar] [CrossRef]
- Pickard, W.F. Massive Electricity Storage for a Developed Economy of Ten Billion People. IEEE Access 2015, 3, 1392–1407. [Google Scholar] [CrossRef]
- Jia, Q.S.; Shen, J.X.; Xu, Z.B.; Guan, X.H. Simulation-Based Policy Improvement for Energy Management in Commercial Office Buildings. IEEE Trans. Smart Grid 2012, 3, 2211–2223. [Google Scholar] [CrossRef]
- Bazhin, V.Y.; Kuskov, V.B.; Kuskova, Y.V. Problems of using unclaimed coal and other carbon-containing materials as energy briquettes. Ugol 2019, 4, 50–54. [Google Scholar] [CrossRef]
- Bezyazychnyi, V.F.; Szcerek, M.; Pervov, M.L.; Timofeev, M.V.; Prokofiev, M.A. The Study of the Effect of Temperature on the Ability of Metals to Accumulate Energy during Their Plastic Deformation. J. Min. Inst. 2019, 235, 55–59. [Google Scholar] [CrossRef] [Green Version]
- Belskiy, A.A.; Dobush, V.S.; Haikal, S.F. Operation of a Single-phase Autonomous Inverter as a Part of a Low-power Wind Complex. J. Min. Inst. 2019, 239, 564–569. [Google Scholar] [CrossRef]
- Ci, S.; Lin, N.; Wu, D. Reconfigurable battery techniques and systems: A survey. IEEE Access 2016, 4, 1175–1189. [Google Scholar] [CrossRef]
- Maharjan, L.; Yamagishi, D.; Akagi, H. Active-Power Control of Individual Converter Cells for a Battery Energy Storage System Based on a Multilevel Cascade PWM Converter. IEEE Trans. Power Electron. 2012, 27, 1099–1107. [Google Scholar] [CrossRef]
- Chemali, E.; Preindl, M.; Malysz, P.; Emadi, A. Electrochemical and Electrostatic Energy Storage and Management Systems for Electric Drive Vehicles: State-of-the-Art Review and Future Trends. IEEE J. Emerg. Sel. Top. Power Electron. 2016, 4, 1117–1134. [Google Scholar] [CrossRef]
- Savard, C. Le Stockage de l’Énergie Électrique; du Mainate, L.E., Ed.; Universitaires Européennes: Paris, France, 2017. [Google Scholar]
- Redozubov, S.S.; Nenasheva, E.A.; Gaidamaka, I.M.; Zaitseva, N.V. Low-Temperature Ceramic Materials Based on Pyrochlore Compounds in the Bi2O3–ZnO–Nb2O5 System. Inorg. Mater. 2020, 56, 77–82. [Google Scholar] [CrossRef]
- Bazhin, V.Y.; Aleksandrova, T.A.; Kotova, E.L.; Suslov, A.P. A modern View of Anomalies in the Metal Groups of the Periodic System of D.I.Mendeleev. J. Min. Inst. 2019, 239, 520–527. [Google Scholar] [CrossRef]
- Hussain, I.; Hussain, T.; Lamiel, C.; Zhang, K. Turning indium oxide into high-performing electrode materials via cation substitution strategy: Preserving single crystalline cubic structure of 2D nanoflakes towards energy storage devices. J. Power Sources 2020, 480, 228873. [Google Scholar] [CrossRef]
- Jaguemont, J.; Dube, Y.; Bouton, L. Characterization and Modeling of a Hybrid-Electric-Vehicle Lithium-Ion Battery Pack at Low Temperatures. IEEE Trans. Veh. Technol. 2016, 65, 1–14. [Google Scholar] [CrossRef] [Green Version]
- How, D.N.T.; Hannan, M.A.; Hossain Lipu, M.S.; Ker, P.J. State of Charge Estimation for Lithium-Ion Batteries Using Model-Based and Data-Driven Methods: A Review. IEEE Access 2019, 7, 136116–136136. [Google Scholar] [CrossRef]
- Lavety, S.; Keshri, R.; Ghosh, S.; Chaudhari, M.A. Non-Linear Model and Parameter Extraction for Charge/discharge Behavior of Valve Regulated Lead-Acid Battery. IEEE Trans. Energy Convers. 2021. [Google Scholar] [CrossRef]
- Zhou, Z.; Cui, Y.; Kong, X.; Li, J.; Zheng, Y. A fast capacity estimation method based on open circuit voltage estimation for LiNixCoyMn1-x-y battery assessing in electric vehicles. J. Energy Storage 2020, 32, 101830. [Google Scholar] [CrossRef]
- Rassõlkin, A.; Sell, R.; Leier, M. Development case study of first Estonian Self-driving car ISEAUTO. Sci. J. Riga Tech. Univ.-Electr. Control. Commun. Eng. 2018, 14, 81–88. [Google Scholar] [CrossRef] [Green Version]
- Shklyarskiy, Y.E.; Lutonin, A.S.; Palyanicin, P.S. PMSM control system with open-end winding and floating bridge capacitor. IOP Conf. Ser. Mater. Sci. Eng. 2019, 643, 012084. [Google Scholar] [CrossRef]
- Zhukovskiy, Y.L.; Suslikov, P.K.; Russkih, N.I.; Korolev, N.A. The use of vehicle-to-grid technology for the integration of electric vehicles in the power system of the city. J. Phys. Conf. Ser. 2019, 1333, 062032. [Google Scholar] [CrossRef] [Green Version]
- Roscher, M.; Sauer, D.U. Dynamic electric behavior and open-circuit-voltage modeling of LiFePO4-based lithium ion secondary batteries. J. Power Sources 2011, 196, 331–336. [Google Scholar] [CrossRef]
- Petzl, M.; Danzer, M.A. Advancements in OCV Measurement and Analysis for Lithium-Ion Batteries. IEEE Trans. Energy Convers. 2013, 28, 675–681. [Google Scholar] [CrossRef]
- Pei, L.; Lu, R.; Zhu, C. Relaxation model of the open-circuit voltage for state-of-charge estimation in lithium-ion batteries. IET Electr. Syst. Transp. 2013, 3, 112–117. [Google Scholar] [CrossRef]
- Zhang, C.; Li, K.; Mcloone, S.; Yang, Z. Battery Modelling Methods for Electric Vehicles—A Review. In Proceedings of the IEEE European Control Conference (ECC), Strasbourg, France, 24–27 June 2014; pp. 2673–2678. [Google Scholar]
- Cacciato, M.; Nobile, G.; Scarcella, G.; Scelba, G. Real-Time Model-Based Estimation of SOC and SOH for Energy Storage Systems. IEEE Trans. Power Electron. 2017, 32, 794–803. [Google Scholar] [CrossRef]
- Liu, X.L.; Qin, S.X.; He, Y.; Zheng, X.X.; Cao, C.R. SOC estimation of the lithium-ion battery with the temperature-based Nernst model. In Proceedings of the IEEE 2016 IEEE 8th International Power Electronics and Motion Control Conference (IPEMC-ECCE Asia), Hefei, China, 22–26 May 2016; pp. 1419–1422. [Google Scholar]
- Seaman, A.; Dao, T.S.; McPhee, J. A survey of mathematics-based equivalent circuit and electro-chemical battery models for hybrid and electric vehicle simulation. J. Power Sources 2014, 256, 410–423. [Google Scholar] [CrossRef] [Green Version]
- Semenov, K.N.; Letenko, D.G.; Charykov, N.A.; Letenko, D.G.; Nikitin, V.A.; Keskinov, V.A.; Matuzenko, M.Y.; Kopyrin, A.A. Synthesis and identification of fullerenol prepared by the direct oxidation route. Russ. J. Appl. Chem. 2010, 83, 2076–2080. [Google Scholar] [CrossRef]
- Haifeng, D.; Xuezhe, W.; Zechang, S. A new SOH prediction concept for the power lithium-ion battery used on HEVs. In Proceedings of the IEEE 2009 IEEE Vehicle Power and Propulsion Conference, Dearborn, MI, USA, 7–9 September 2009; pp. 1649–1653. [Google Scholar]
- Lu, L.; Han, X.; Li, J.; Hua, J.; Ouyang, M. A review on the key issues for lithium-ion battery management in electric vehicles. J. Power Sources 2013, 226, 272–288. [Google Scholar] [CrossRef]
- Xiong, R.; He, H.; Guo, H.; Ding, Y. Modeling for Lithium-Ion Battery used in Electric Vehicles. Procedia Eng. 2011, 15, 2869–2874. [Google Scholar] [CrossRef] [Green Version]
- Paarmann, S.; Cloos, L.; Technau, J.; Wetzel, T. Measurement of the Temperature Influence on the Current Distribution in Lithium-Ion Batteries. Energy Technol. 2021, 2000862. [Google Scholar] [CrossRef]
- Li, Y.; Vilathgamuwa, M.; Choi, S.-S.; Farrell, T.W.; Tran, N.-T.; Teague, J. Development of a degradation-conscious physics-based lithium-ion battery model for use in power system planning studies. Appl. Energy 2019, 248, 512–525. [Google Scholar] [CrossRef]
- Unagar, A.; Tian, Y.; Chao, M.A.; Fink, O. Learning to Calibrate Battery Models in Real-Time with Deep Reinforcement Learning. Energies 2021, 14, 1361. [Google Scholar] [CrossRef]
- Cuadras, A.; Miró, P.; Ovejas, V.J.; Estrany, F. Entropy generation model to estimate battery ageing. J. Energy Storage 2020, 32, 101740. [Google Scholar] [CrossRef]
- Broussely, M.; Biensan, P.; Bonhomme, F.; Blanchard, P.; Herreyre, S.; Nechev, K.; Staniewicz, R.J. Main aging mechanisms in Li ion batteries. J. Power Sources 2005, 146, 90–96. [Google Scholar] [CrossRef]
- Bourlot, S.; Blanchard, P.; Robert, S. Investigation of aging mechanisms of high power Li-ion cells used for hybrid electric vehicles. J. Power Sources 2011, 196, 6841–6846. [Google Scholar] [CrossRef]
- Yazami, R.; Reynier, Y.F. Mechanism of self-discharge in graphite-Lithium anode. Electrochim. Acta 2002, 47, 1217–1223. [Google Scholar] [CrossRef]
- Dubarry, M.; Devie, A. Battery Cycling and Calendar Aging: Year One Testing Result; University of Central Florida. Electric Vehicle Transportation Center (EVTC): Cocoa, FL, USA, 2016. [Google Scholar]
- Bloom, I.; Cole, B.W.; Sohn, J.J.; Jones, S.A.; Polzin, E.G.; Battaglia, V.S.; Henriksen, G.L.; Motloch, C.; Richaardson, R.; Unkelhaeuser, Y.; et al. An Accelerated calendar and cycle life study of Li-ion cells. J. Power Sources 2001, 101, 238–247. [Google Scholar] [CrossRef]
- Ning, G.; Haran, B.; Popov, B.N. Capacity fade study of lithium-ion batteries at high discharge rates. J. Power Sources 2003, 117, 160–169. [Google Scholar] [CrossRef]
- Sauer, D.U.; Wenzl, H. Comparison of different approaches for lifetime prediction of electro-chemical systems—Using lead-acid batteries as example. J. Power Sources 2008, 176, 534–546. [Google Scholar] [CrossRef]
- Hausmann, A.; Depcik, C. Expanding the Peukert equation for battery capacity modeling through inclusion of a temperature dependency. J. Power Sources 2013, 235, 148–158. [Google Scholar] [CrossRef]
- Lievre, A.; Sari, A.; Venet, P.; Hijazi, A.; Ouattara-Brigaudet, M.; Pelissier, S. Practical Online Estimation of Lithium-Ion Battery Apparent Series Resistance for Mild Hybrid Vehicles. IEEE Trans. Veh. Technol. 2016, 65, 4505–4511. [Google Scholar] [CrossRef] [Green Version]
- Le, D.; Tang, X. Lithium-ion Battery State of Health Estimation Using Ah-V Characterization. In Proceedings of the Annual Conference of the Prognostics and Health Management Society, Montreal, QC, Canada, 25–29 September 2011; pp. 1–7. [Google Scholar]
- Lemlich, R. Subjective acceleration of time with aging. Percept. Mot. Ski. 1975, 41, 235–238. [Google Scholar] [CrossRef] [PubMed]
- Shili, S.; Hijazi, A.; Sari, A.; Lin-Shi, X.; Venet, P. Balancing circuit new control for supercapacitor storage system lifetime maximization. IEEE Trans. Power Electron. 2017, 32, 4939–4948. [Google Scholar] [CrossRef] [Green Version]
- Eddahech, A. Modélisation du vieillissement et détermination de l’état de santé de batteries lithium-ion pour application véhicule électrique et hybride. Doctoral Dissertation, Université Sciences et Technologies-Bordeaux I, Talence, France, 2013. (In French). [Google Scholar]
- Soussens, M.; Laulheret, R.; Cabardaye, A. Modeles de degradation des batteries d’accumulateurs. In Proceedings of the 19th Congres de Maitrise des Risque et Surete de fonctionnement, Dijon, France, 21–23 October 2014; CNES: Paris, France, 2014. (In French). [Google Scholar]
- Thele, M.; Bohlen, O.; Sauer, D.U.; Karden, E. Development of a voltage-behavior model for NiMH batteries using an impedance-based modeling concept. J. Power Sources 2008, 175, 635–643. [Google Scholar] [CrossRef]
- Gerschler, J.B.; Sauer, D.U. Investigation of Open-Circuit-Voltage Behaviour of Lithium-Ion Batteries with Various Cathode Materials under Special Consideration of Voltage Equalisation Phenomena. In Proceedings of the International Battery, Hybrid and Fuel Cell Electric Vehicle Symposium EVS24, Stavanger, Norway, 13–16 May 2009. [Google Scholar]
- Malik, R.; Abdellahi, A.; Ceder, G. A Critical Review of the Li Insertion Mechanisms in LiFePO4 Electrodes. J. Electrochem. Soc. 2013, 160, A3179–A3197. [Google Scholar] [CrossRef]
- Khan, S.; Shahzad, M.; Habib, U.; Gawlik, W.; Palensky, P. Stochastic battery model for aggregation of thermostatically controlled loads. In Proceedings of the 2016 IEEE International Conference on Industrial Technology (ICIT), Taipei, Taiwan, 14–17 March 2016; pp. 570–575. [Google Scholar]
- Damay, N.; Friedrich, G.; Forgez, C. Modélisation thermique en vue du dimensionnement d’un pack batterie, avec prise en compte du couplage électro-thermique pour la caractérisation des pertes éelectriques. In Proceedings of the Symposium de Genie Electrique, Grenoble, France, 7–9 June 2016. (In French). [Google Scholar]
- Abramovich, B.N.; Ustinov, D.A.; Abdallah, W.J. Development and design of a mobile power plant in the form of a standalone power supply. J. Phys. Conf. Ser. 2021, 1753, 012006. [Google Scholar] [CrossRef]
- Korolev, N.; Solovev, S. Monitoring the technical condition of autonomous electrical systems with electric drive. E3S Web Conf. 2019, 140, 04015. [Google Scholar] [CrossRef] [Green Version]


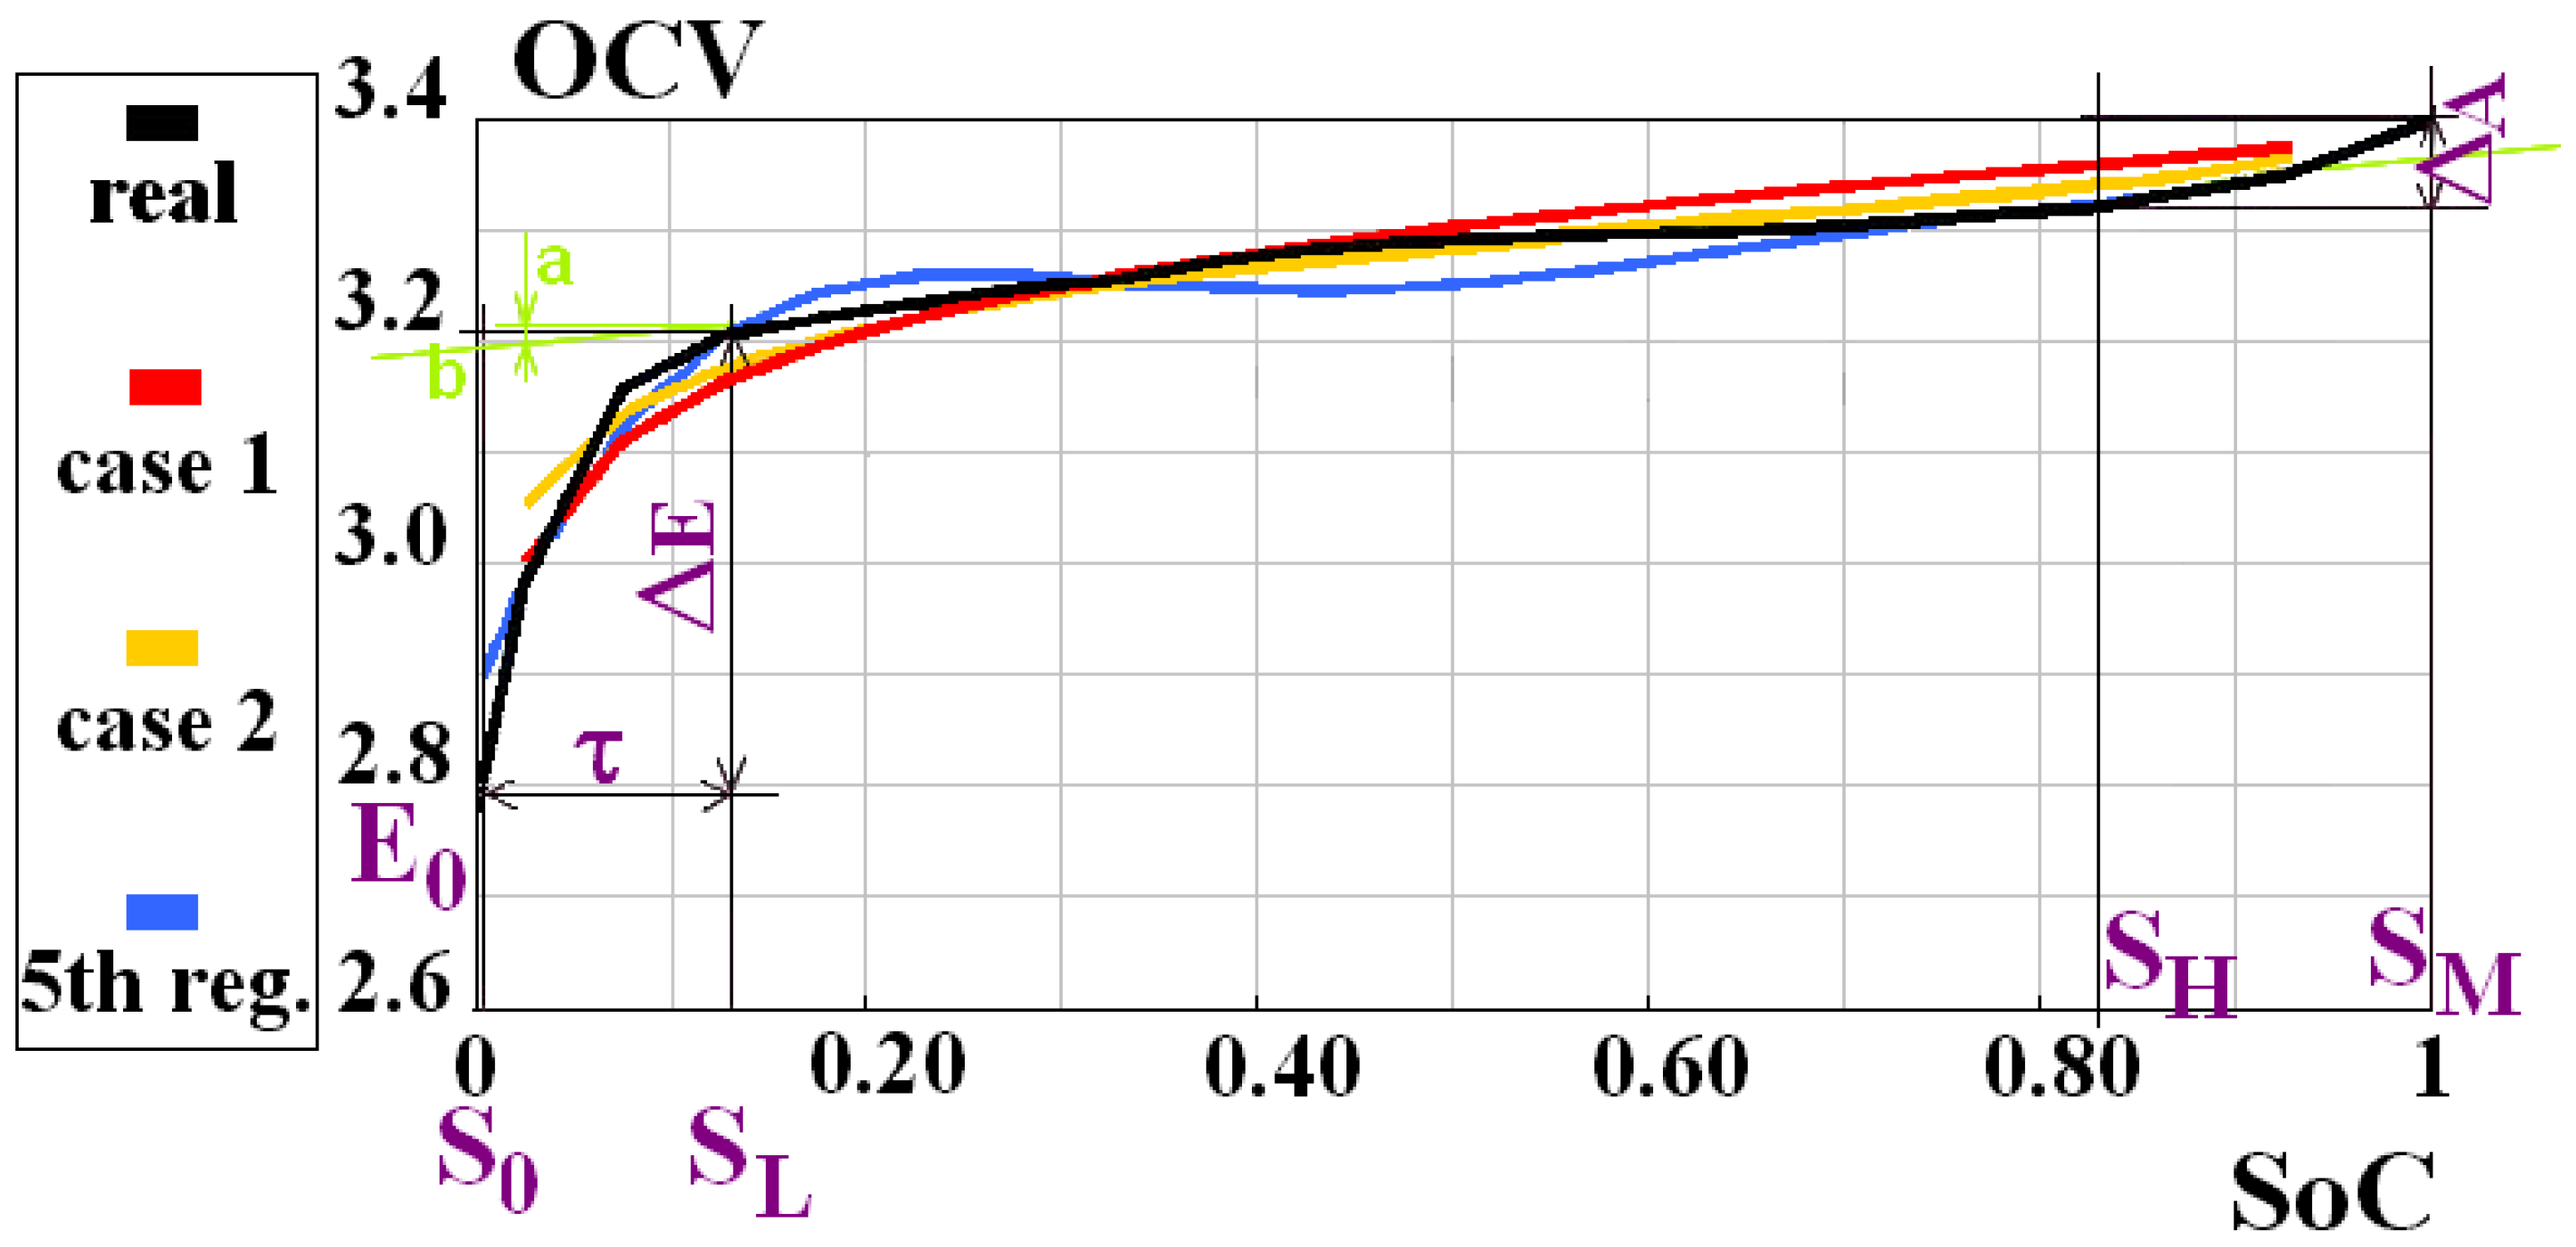
| K | K0 | K1 | K2 |
|---|---|---|---|
| Case 1 | 3.37 | 0.1 | −0.005 |
| Case 2 | 3.33 | 0.075 | −0.015 |
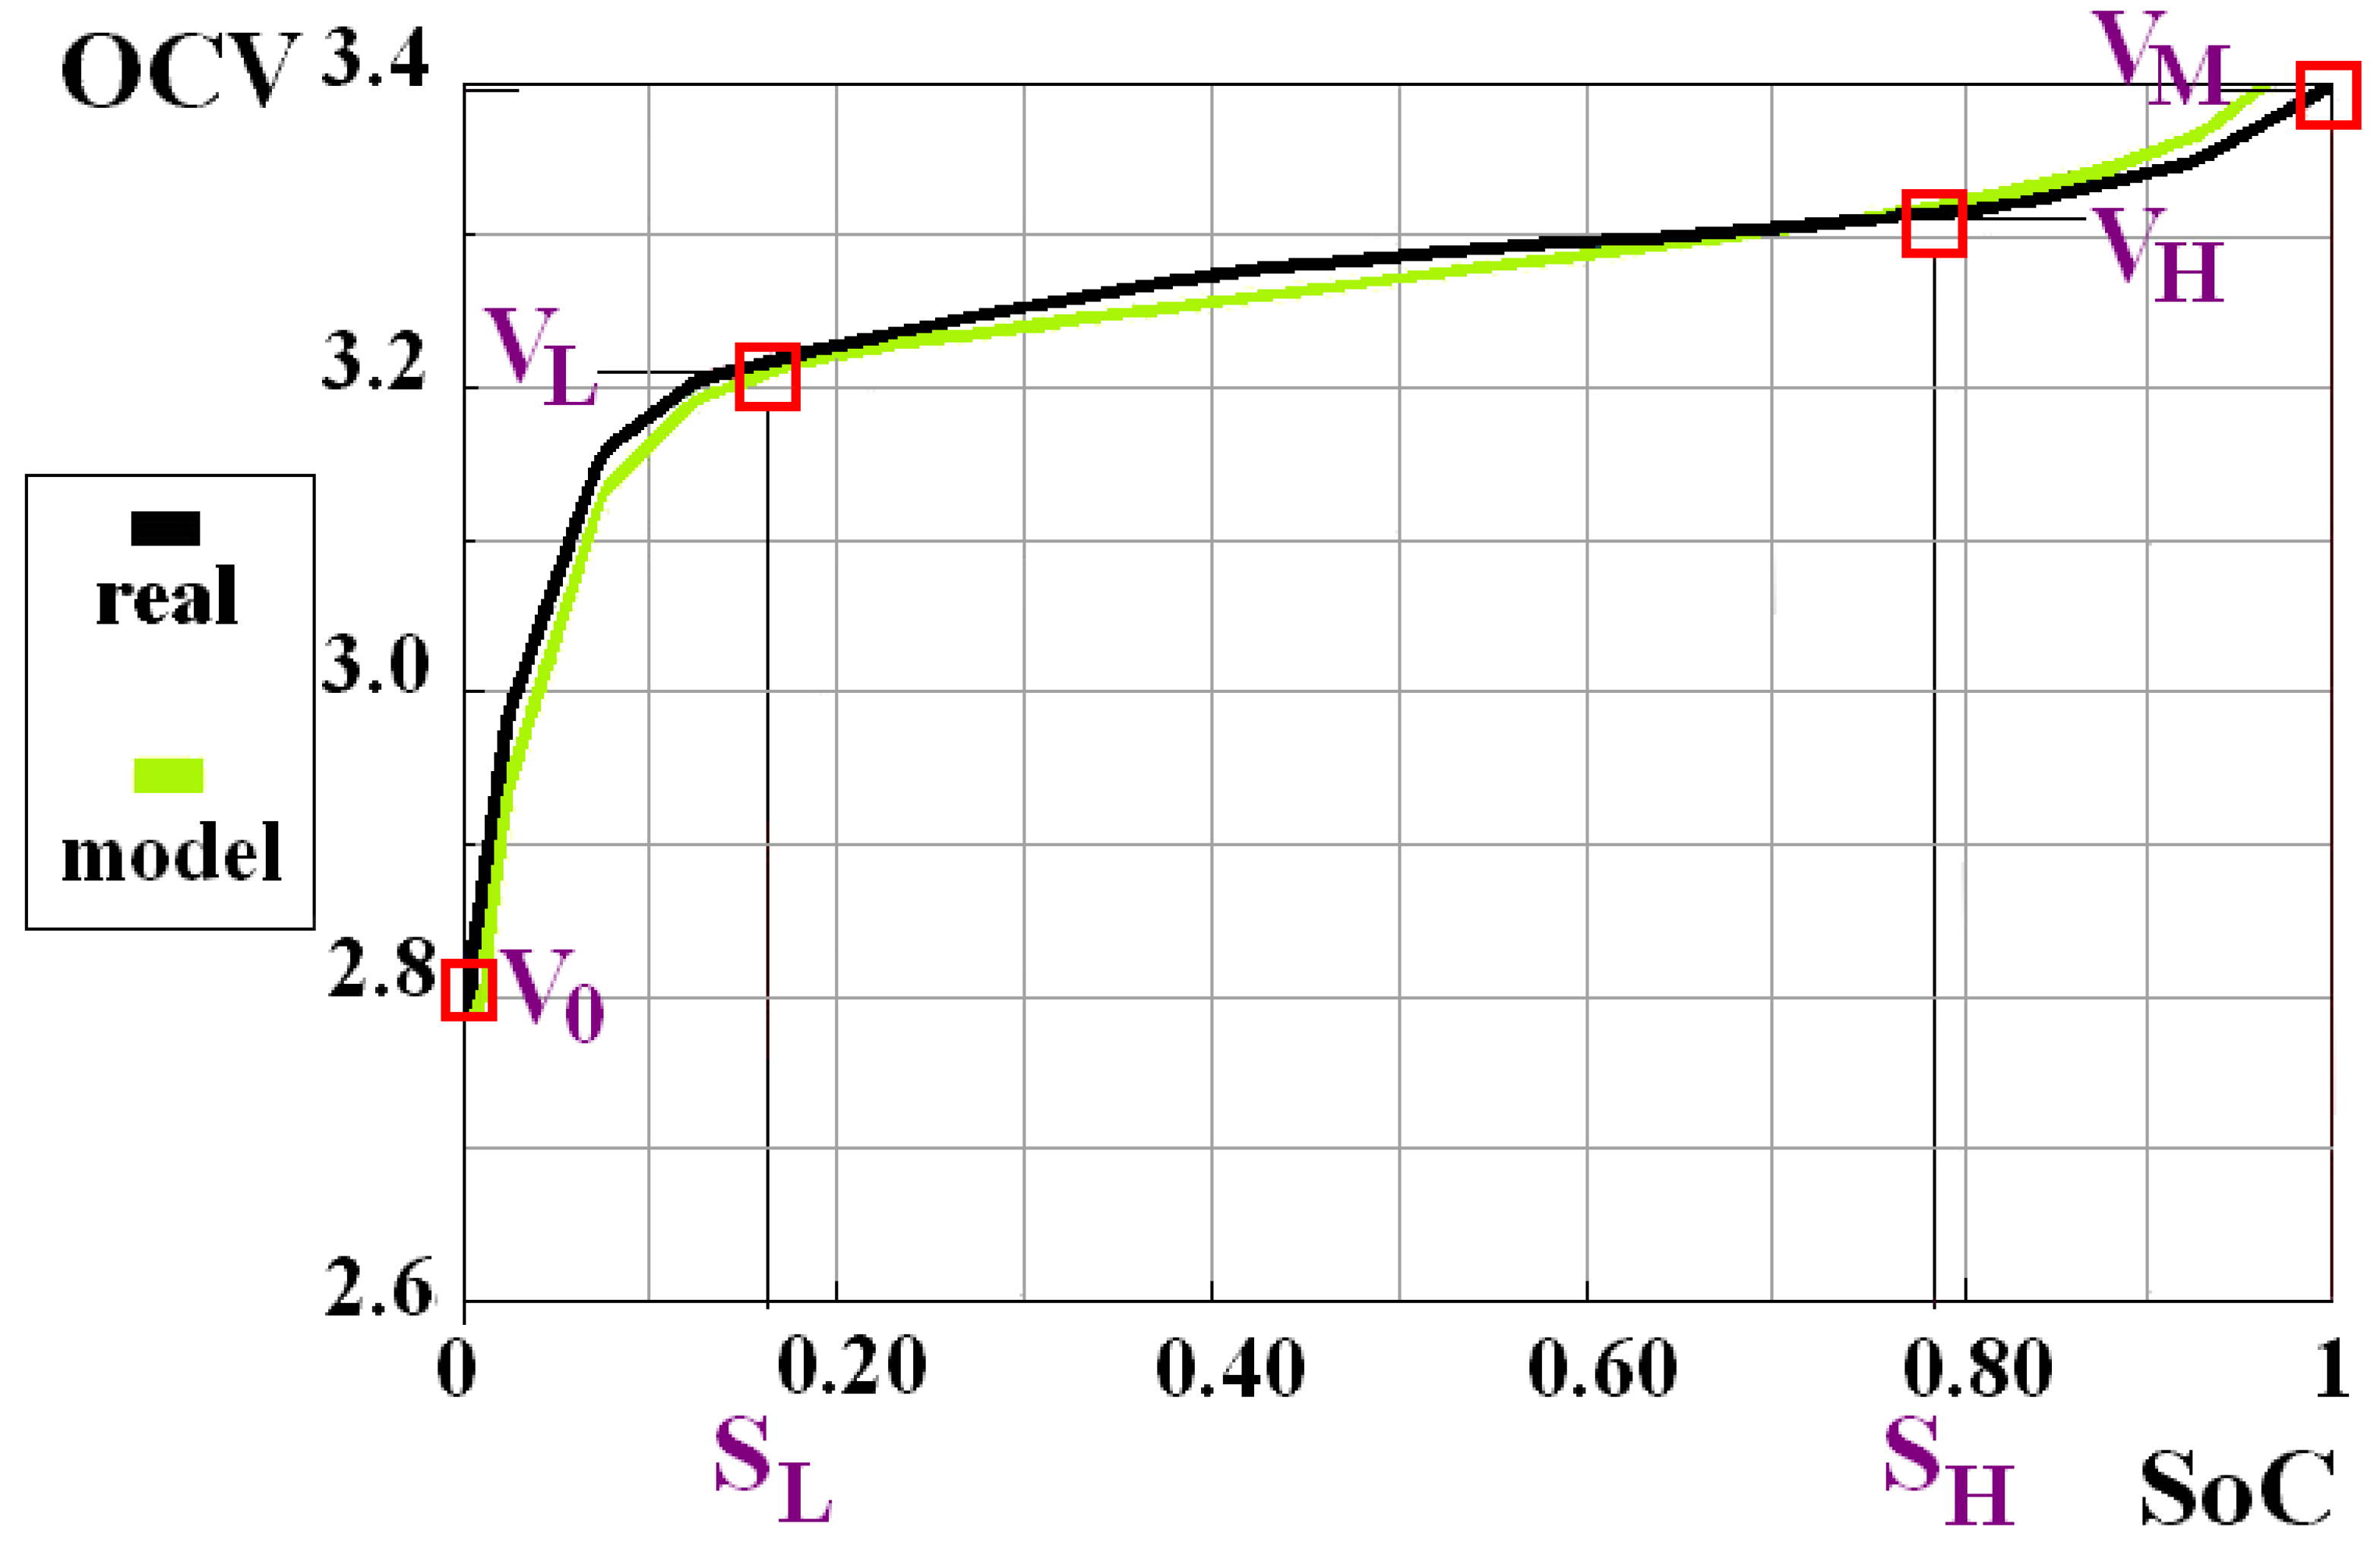
| Zones | Deep Discharge | Linear | Runaway | Forbidden |
|---|---|---|---|---|
| SoC (%) | 0 | SL | SH | 100 |
| OCV (V) | V0 | VL | VH | VM |
| Zones | Deep Discharge | Linear | Runaway | Forbidden |
|---|---|---|---|---|
| SoC (%) | 0 | 17.5 | 77.5 | 100 |
| OCV (V) | 2.600 | 3.222 | 3.315 | 3.400 |
| Technology | Lead-Acid | Nickel–Cadmium (NiCd) | Nickel Metal Hydride (NiMH) | Lithium-Ion | Lithium Iron Phosphate (LiFePO4) |
|---|---|---|---|---|---|
| Monthly self-discharge (720 h) | 5% | 10–20% | 15–25% | 1–2% | 1–3% |
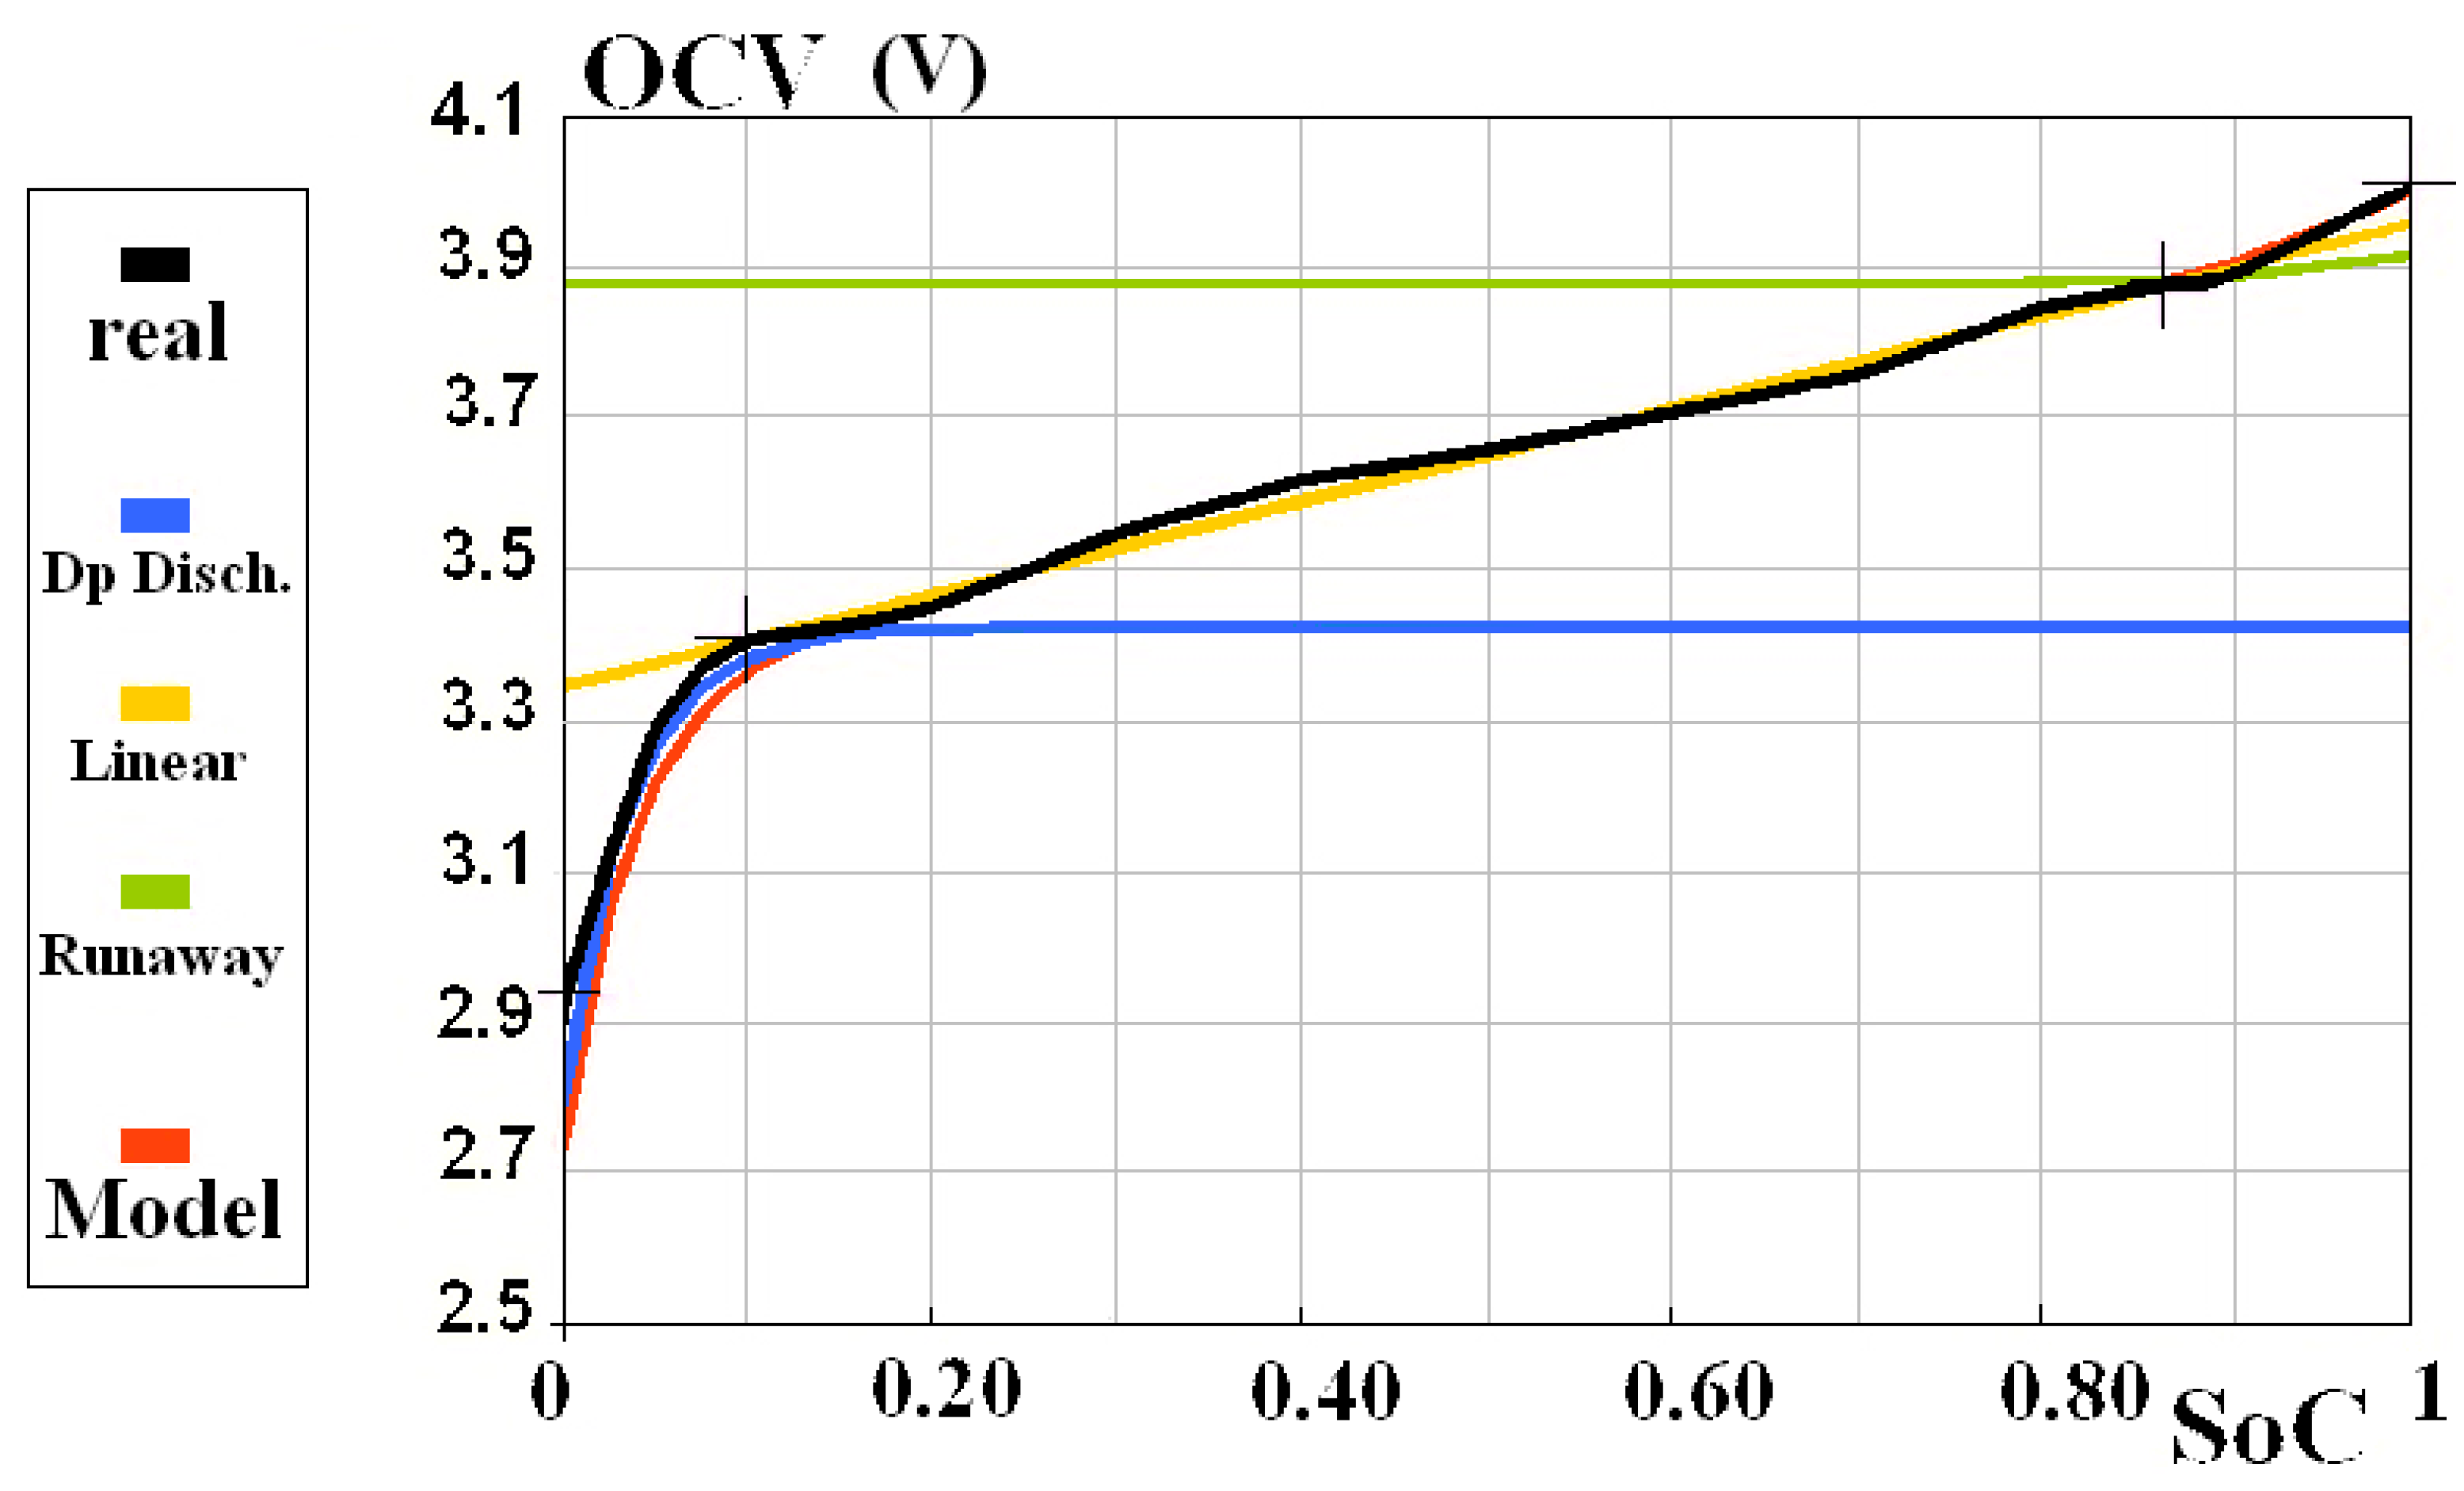
| Remarkable Points | Deep Discharge | Linear | Runaway | Forbidden |
|---|---|---|---|---|
| SoC (%) | 0 | 10 | 86.8 | 100 |
| OCV (V) | 2.925 | 3.407 | 3.880 | 4.010 |
Publisher’s Note: MDPI stays neutral with regard to jurisdictional claims in published maps and institutional affiliations. |
© 2021 by the authors. Licensee MDPI, Basel, Switzerland. This article is an open access article distributed under the terms and conditions of the Creative Commons Attribution (CC BY) license (https://creativecommons.org/licenses/by/4.0/).
Share and Cite
Savard, C.; Iakovleva, E.; Ivanchenko, D.; Rassõlkin, A. Accessible Battery Model with Aging Dependency. Energies 2021, 14, 3493. https://doi.org/10.3390/en14123493
Savard C, Iakovleva E, Ivanchenko D, Rassõlkin A. Accessible Battery Model with Aging Dependency. Energies. 2021; 14(12):3493. https://doi.org/10.3390/en14123493
Chicago/Turabian StyleSavard, Christophe, Emiliia Iakovleva, Daniil Ivanchenko, and Anton Rassõlkin. 2021. "Accessible Battery Model with Aging Dependency" Energies 14, no. 12: 3493. https://doi.org/10.3390/en14123493