Article

Availability and LCOE Analysis Considering Failure Rate and Downtime for Onshore Wind Turbines in Japan

Department of Civil Engineering, School of Engineering, The University of Tokyo, 7-3-1 Hongo, Bunkyo, Tokyo 113-8656, Japan
*
Author to whom correspondence should be addressed.
Energies 2021, 14(12), 3528; https://doi.org/10.3390/en14123528
Submission received: 9 May 2021 / Revised: 5 June 2021 / Accepted: 8 June 2021 / Published: 14 June 2021
(This article belongs to the Section A3: Wind, Wave and Tidal Energy)

Abstract

:
In this study, the availability and the levelized cost of energy (LCOE) are investigated considering failure rate and downtime for onshore wind turbines in Japan. The failure mode effect analysis is conducted using the wind turbine failure database collected by the New Energy and Industrial Technology Department Organization (NEDO). The normalized failure rate and downtime between Europe and Japan are comparable. The occurrence rate is similar between Europe and Japan, but the downtime in Japan is much longer than that of Europe. Three cost-reduction scenarios are then proposed to improve availability and to reduce LCOE using assumed failure rate and downtime in each mode based on the industry interview and best practices in Japan. The availability is improved from 87.4% for the baseline scenario to 92.7%, 95.5% and 96.4% for the three scenarios, and LCOE is also reduced from 13.7 Yen/kWh to 11.9, 11.0 and 10.7 Yen/kWh. Finally, the probability distributions of downtime and repair cost are obtained for each failure mode. It is found that the probability distributions of the failure modes with the shortest downtime show similar probability distributions regardless of the size of the assembly. The effects of downtime and repair-cost uncertainties on LCOE are also evaluated.

1. Introduction

In Japan, the installed capacity of onshore wind power generation was 4439 MW with 2554 turbines at the end of 2020 [1]. In 2016, the levelized cost of energy (LCOE) was reported as 13.9 Yen/kWh (around 10.7 Euro cent/kWh using an exchange rate of 130 Yen/Euro) and the availability as 87.4% by the committee of the Ministry of Energy and Trade Industry (METI) [2], while the cost of energy in Europe was around 4.1 Euro cent/kWh [3] and the availability was above 97% [4]. It is highly required to investigate the reason of long downtime and low availability in Japan.
The wind turbine failure database including failure rate and downtime is generally used to investigate the availability. In Japan, the New Energy and Industrial Technology Development Organization (NEDO) has collected the failure data since 2004 in order to get the overview of accident status all over Japan [5], which collects downtime and repair cost at the assembly level. However, the failure characteristics at assembly and failure mode levels have never been analyzed, and the reason for long downtime and low availability in Japan is not examined.
Pfaffel et al. [6] reviewed the 22 failure databases, and Dao et al. [7] examined the 18 failure databases in the world. WInD-Pool (Wind Energy Information Data Pool) [8] and System Performance, Availability and Reliability Trend Analysis (SPARTA) [9] are the most recent databases, but WMEP (Wissenschaftliches Mess-und Evaluierungsprogramm) [10] and Reliawind [11] have been most widely used for research due to their open accessibility, even though their wind turbines become outdated. Pfaffel et al. [6] mapped the existing reliability characteristics to a system structure according to the Reference Designation System for Power Plants (RDS-PP) [12] to compare these database characteristics at the assembly level. It was found that the normalized failure rate and downtime in each database showed significant differences. The reason for these differences needs to be investigated further.
These failure databases were mainly categorized into the failure at the assembly level, but the downtime and repair cost are affected by the failure mode. The Reliawind database gave the failure rate and downtime at the failure mode level. Shafiee and Dinmohammadi [13] and Ozturk et al. [14] conducted a failure mode effect analysis-based risk assessment for the wind turbine system and provided the importance of the maintenance plan for each failure mode. Carrol et al. [15] investigated an offshore wind turbine’s reliability. The failures were categorized into “No cost”, “Minor repair”, “Major repair” and “Major replacement”, which represent the failure effect on the cost. TNO also analyzed turbine reliability and defined Fault Type Class (FTC) as the group of failure modes having a similar downtime and repair cost [16].
The availability improvement scenarios have been assessed using failure databases. TNO [16] performed the case study to reduce offshore wind farm operation and maintenance (O&M) cost using their developed time-domain Monte Carlo simulation tool named as the ECN O&M Calculator. Maples et al. [17] also investigated the optimum O&M methods for an offshore wind farm in the United States using the ECN O&M Calculator. The availability improvement and LCOE reduction scenarios are highly required in the Japanese wind turbine industry.
The assessment of uncertainty in LCOE is also important. Dao et al. [7] investigated wind turbine reliability data and its impact on LCOE, which makes it possible to relate wind turbine failure rates and downtime with an operating expense (OPEX) and annual energy production. However, the uncertainty of downtime and repair cost and their effects on LCOE are not yet evaluated. Seyr and Muskulus [18] pointed out that the uncertainties of repair time affect the production loss using the stochastic model. Mortstock and Wilkinson [19] evaluated the 90% quantile of downtime for onshore wind farms. The uncertainty evaluation using the failure database in Japan is expected.
In summary, the failure characteristics at the assembly and failure mode levels have never been analyzed in Japan, and the reason for long downtime and low availability is not examined. The failure rate and downtime in the world are compared by Pfaffel et al. [6], but the reason for the difference is not clear. The availability improvement scenario is not yet discussed in Japan based on the reliability analysis. The uncertainty of downtime has never been analyzed using the actual database in Japan.
In this study, the failure rate and downtime in Japan are analyzed using the NEDO database at the assembly and failure mode levels. The difference between Japan and Europe is investigated, and the reason for its difference is clarified by analyzing old and new turbines in the NEDO database in Section 2. The cost-reduction scenarios are then investigated using analyzed failure rates and downtimes with the LCOE database and industry practices in Japan. The probability distributions of downtime and repair cost are examined based on the actual data. The uncertainty of downtime and repair cost are also evaluated from the NEDO database, and the effects of uncertainties on LCOE are analyzed in Section 3. The conclusions are summarized in Section 4.

2. Analysis of Failure Rate and Downtime for Onshore Wind Turbines in Japan and Europe

The failure databases in Japan and Europe are described in Section 2.1. These failure databases are investigated and compared at the assembly level in Section 2.2 and at the failure mode level in Section 2.3.

2.1. Failure Databases in Japan and Europe

New Energy and Industrial Technology Development Organization (NEDO) has collected the turbine failure data since 2004 with the aims of availability improvement and the reduction of turbine failures and accidents. Collection items are described in Table 1. The downtimes are written with 1 h resolution, and repair costs are collected by multiple choice questions from eight categories. The downtime represents the combined time of logistic, repair and weather downtime, and its breakdown is not available in the NEDO failure database. In this study, the data collected from 2014 to 2018 are analyzed because the collection time had changed from the middle of the fiscal year to the end of fiscal year since 2014, which affects the statistical characteristics. The commercial wind turbines are extracted, and the demonstration projects are excluded. The accidents with downtime of more than one year are excluded as an extraordinary exception. After the data cleansing, the number of failure data becomes 1663.
The assembly is collected by the multiple-choice questions from 21 categories (blade, hub, grid connection equipment, main shaft/main bearing, gearbox, brake, electrical system, control system, yaw, pitch, hydraulic, foundation, general, no failure assembly, unknown). “General”, “No failure assembly”, “Unknown” failures are excluded from the analysis to make the discussion clear. The assembly category follows RDS-PP (Reference Designation System for Power Plants) as shown in reference [12]. The control system and electrical system are combined as the electrical system. Pitch and aerodynamic brake are combined as pitch system. Flange, wind anemometer, mechanical brake and others are categorized into “others”. In the 1663 failure data, the failures with multiple failure assemblies are 148 data points. The multiple failures are divided into each failure with a weighted of average value of failure with sole assembly. A supplement of less than three days is followed by Okumoto et al. [20]. The absolute value of the failure rate is multiplied by 3.07 to match up to the availability of 87.4% [2] since the short downtime records in SCADA are not included in the NEDO failure database.
For failure databases in Europe, WMEP (Wissenschaftliches Mess-und Evaluierungsprogramm) [10] and Reliawind [11] are used in this study since these databases are public as mentioned in Section 1. The WMEP database contains failure data for up to 1500 turbines over a 15-year period throughout Germany. The Reliawind database contains failure data for 350 turbines, which is smaller than WMEP, but it consists of more modern larger onshore turbines. In this study, the normalized failure rate and downtime of WMEP and Reliawind are extracted from the references [10,11]. The characteristics in each database of Japan and Europe are described in Table 2. The data collection periods are 2014–2018, 2008–2011 and 1999–2006 in NEDO, Reliawind and WMEP, respectively. The years of operation for the collected turbines in NEDO and WMEP were less than 20 and 17 years, respectively, while Reliawind collected the new turbines operating 2–4 years since they were built. Rotational speeds were fixed or variable in NEDO and WMEP, while they were only variable in Reliawind. Controls were stall- or pitch-regulated in NEDO and WMEP, but they were only pitch-regulated in Reliawind. Drivetrains were geared or direct in NEDO and WMEP, while they were only geared in Reliawind. Reliawind and WMEP collected the failure data basically from SCADA with the supplement of automated fault-log, O&M reports and a questionnaire, but NEDO collected only a questionnaire, which makes it impossible to compare the absolute value of the failure rate between NEDO and the other two databases of Reliawind and WMEP.
For failure mode data in Europe, reference [17] is used, which shows the failure rate and downtime for each fault type class based on the Reliawind database. In reference [17], RDS-PP was used for the assembly categorization for the comparison. Table 3 shows the conversion of taxonomy used for data collection from Reliawind and NEDO database to RDS-PP.
In this study, failure rate and downtime are analyzed based on the NEDO failure database in Japan and are used to investigate the characteristics by comparing with European databases.
The failure rate and downtime per assembly are analyzed using the NEDO failure database and are compared with those in the WMEP and Reliawind databases in Section 2.2. The differences among WMEP, Reliawind and NEDO cannot be investigated since each failure datum in the WMEP and Reliawind databases is not available; therefore, the characteristics of failure rate, downtime with operation year, control system and drivetrain existence are investigated using the NEDO failure database.
The failure rate and downtime per failure mode in Japan are analyzed based on the failure mode effect analysis (FMEA) using the NEDO failure database in Section 2.3. FTC is used to categorize the modes because this definition was practical to investigate the failure characteristics with a minimum number of categories compared to discussing a number of failure modes. The characteristics of the normalized failure rate and downtime per failure mode are investigated and compared with those in the WMEP and Reliawind databases.

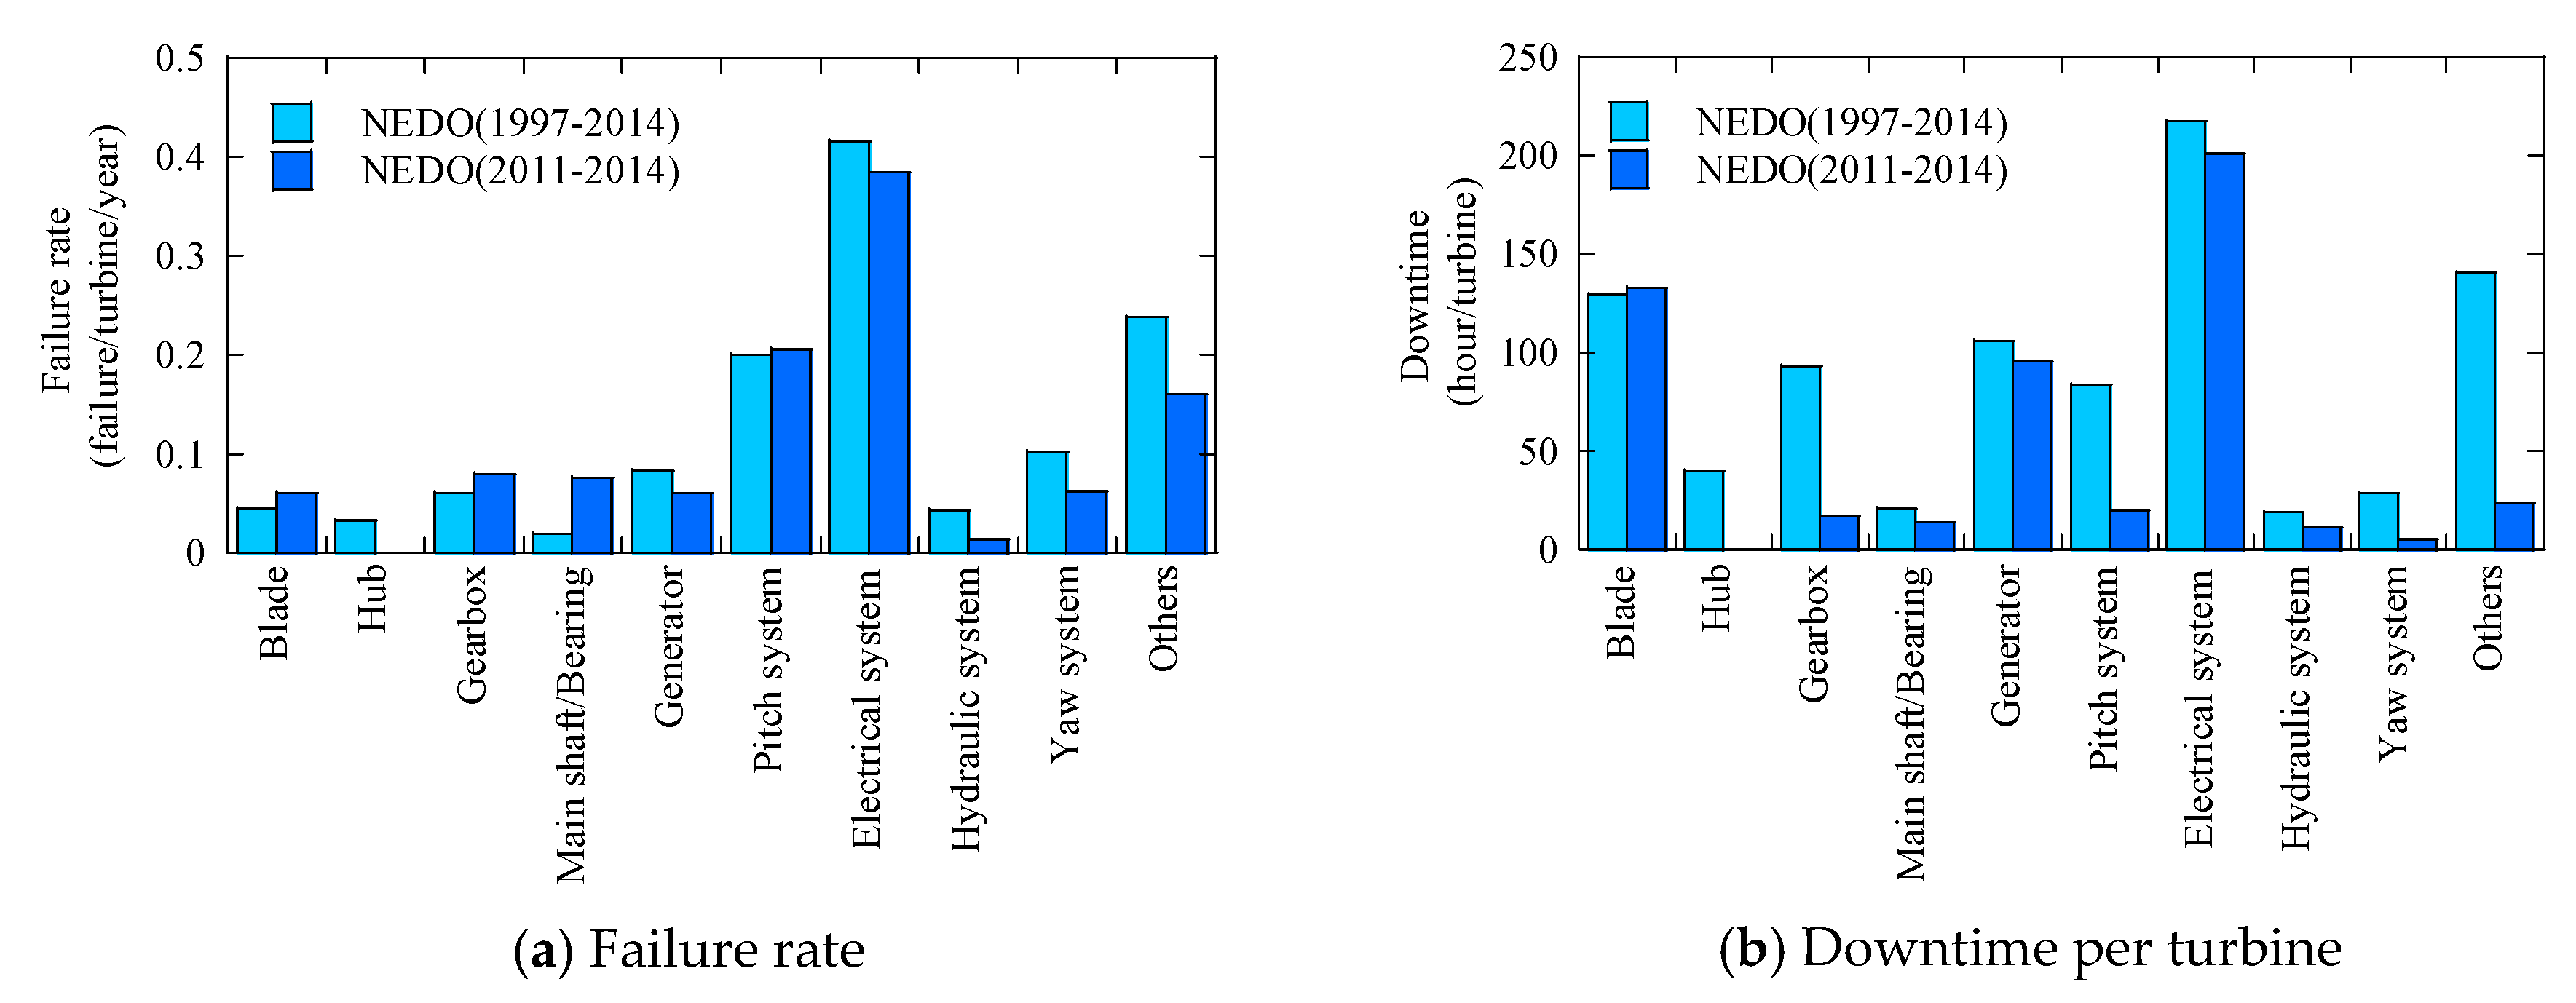
2.2. Analysis of Failure Rate and Downtime at Assembly Level

Failure rate and downtime in Japan are analyzed at the assembly level using the NEDO database. The failure rate for each assembly i is calculated using the NEDO database with Equation (1) according to reference [7].
λ i = p = 1 p n i , p p = 1 p N p ( T p / 8760 )
where n i , p is the number of failures of assembly i in period p ; N p is the number of wind turbines considered in period p and T p is the time duration of period p in hour.
The NEDO, Reliawind and WMEP databases are compared to identify the failure data characteristics in Japan. Normalized failure rate and downtime in the NEDO, Reliawind and WMEP databases are compared at the assembly level. Figure 1 shows a comparison of normalized failure rates and downtime between Europe and Japan. The failure rates of NEDO, WMEP and Reliawind are almost the same, but the downtime of the gearbox and hub in NEDO and WMEP are longer than those in Reliawind.
Figure 2 displays a comparison of absolute failure rates and downtime between the 1997–2014 and 2011–2014 NEDO databases to investigate the reason for differences in NEDO and Reliawind databases. There is only a slight difference in failure rate, but there is a significant difference in downtime, especially in the gearbox, hub, yaw system, pitch system and others. It implies that the years of operation may affect the downtime due to a lack of spare parts for the old wind turbines. The comparison between stalled- and pitch-regulated wind turbines and that between Geared and Gearless drivetrain in the NEDO database are also performed, but the difference cannot be observed in downtime.

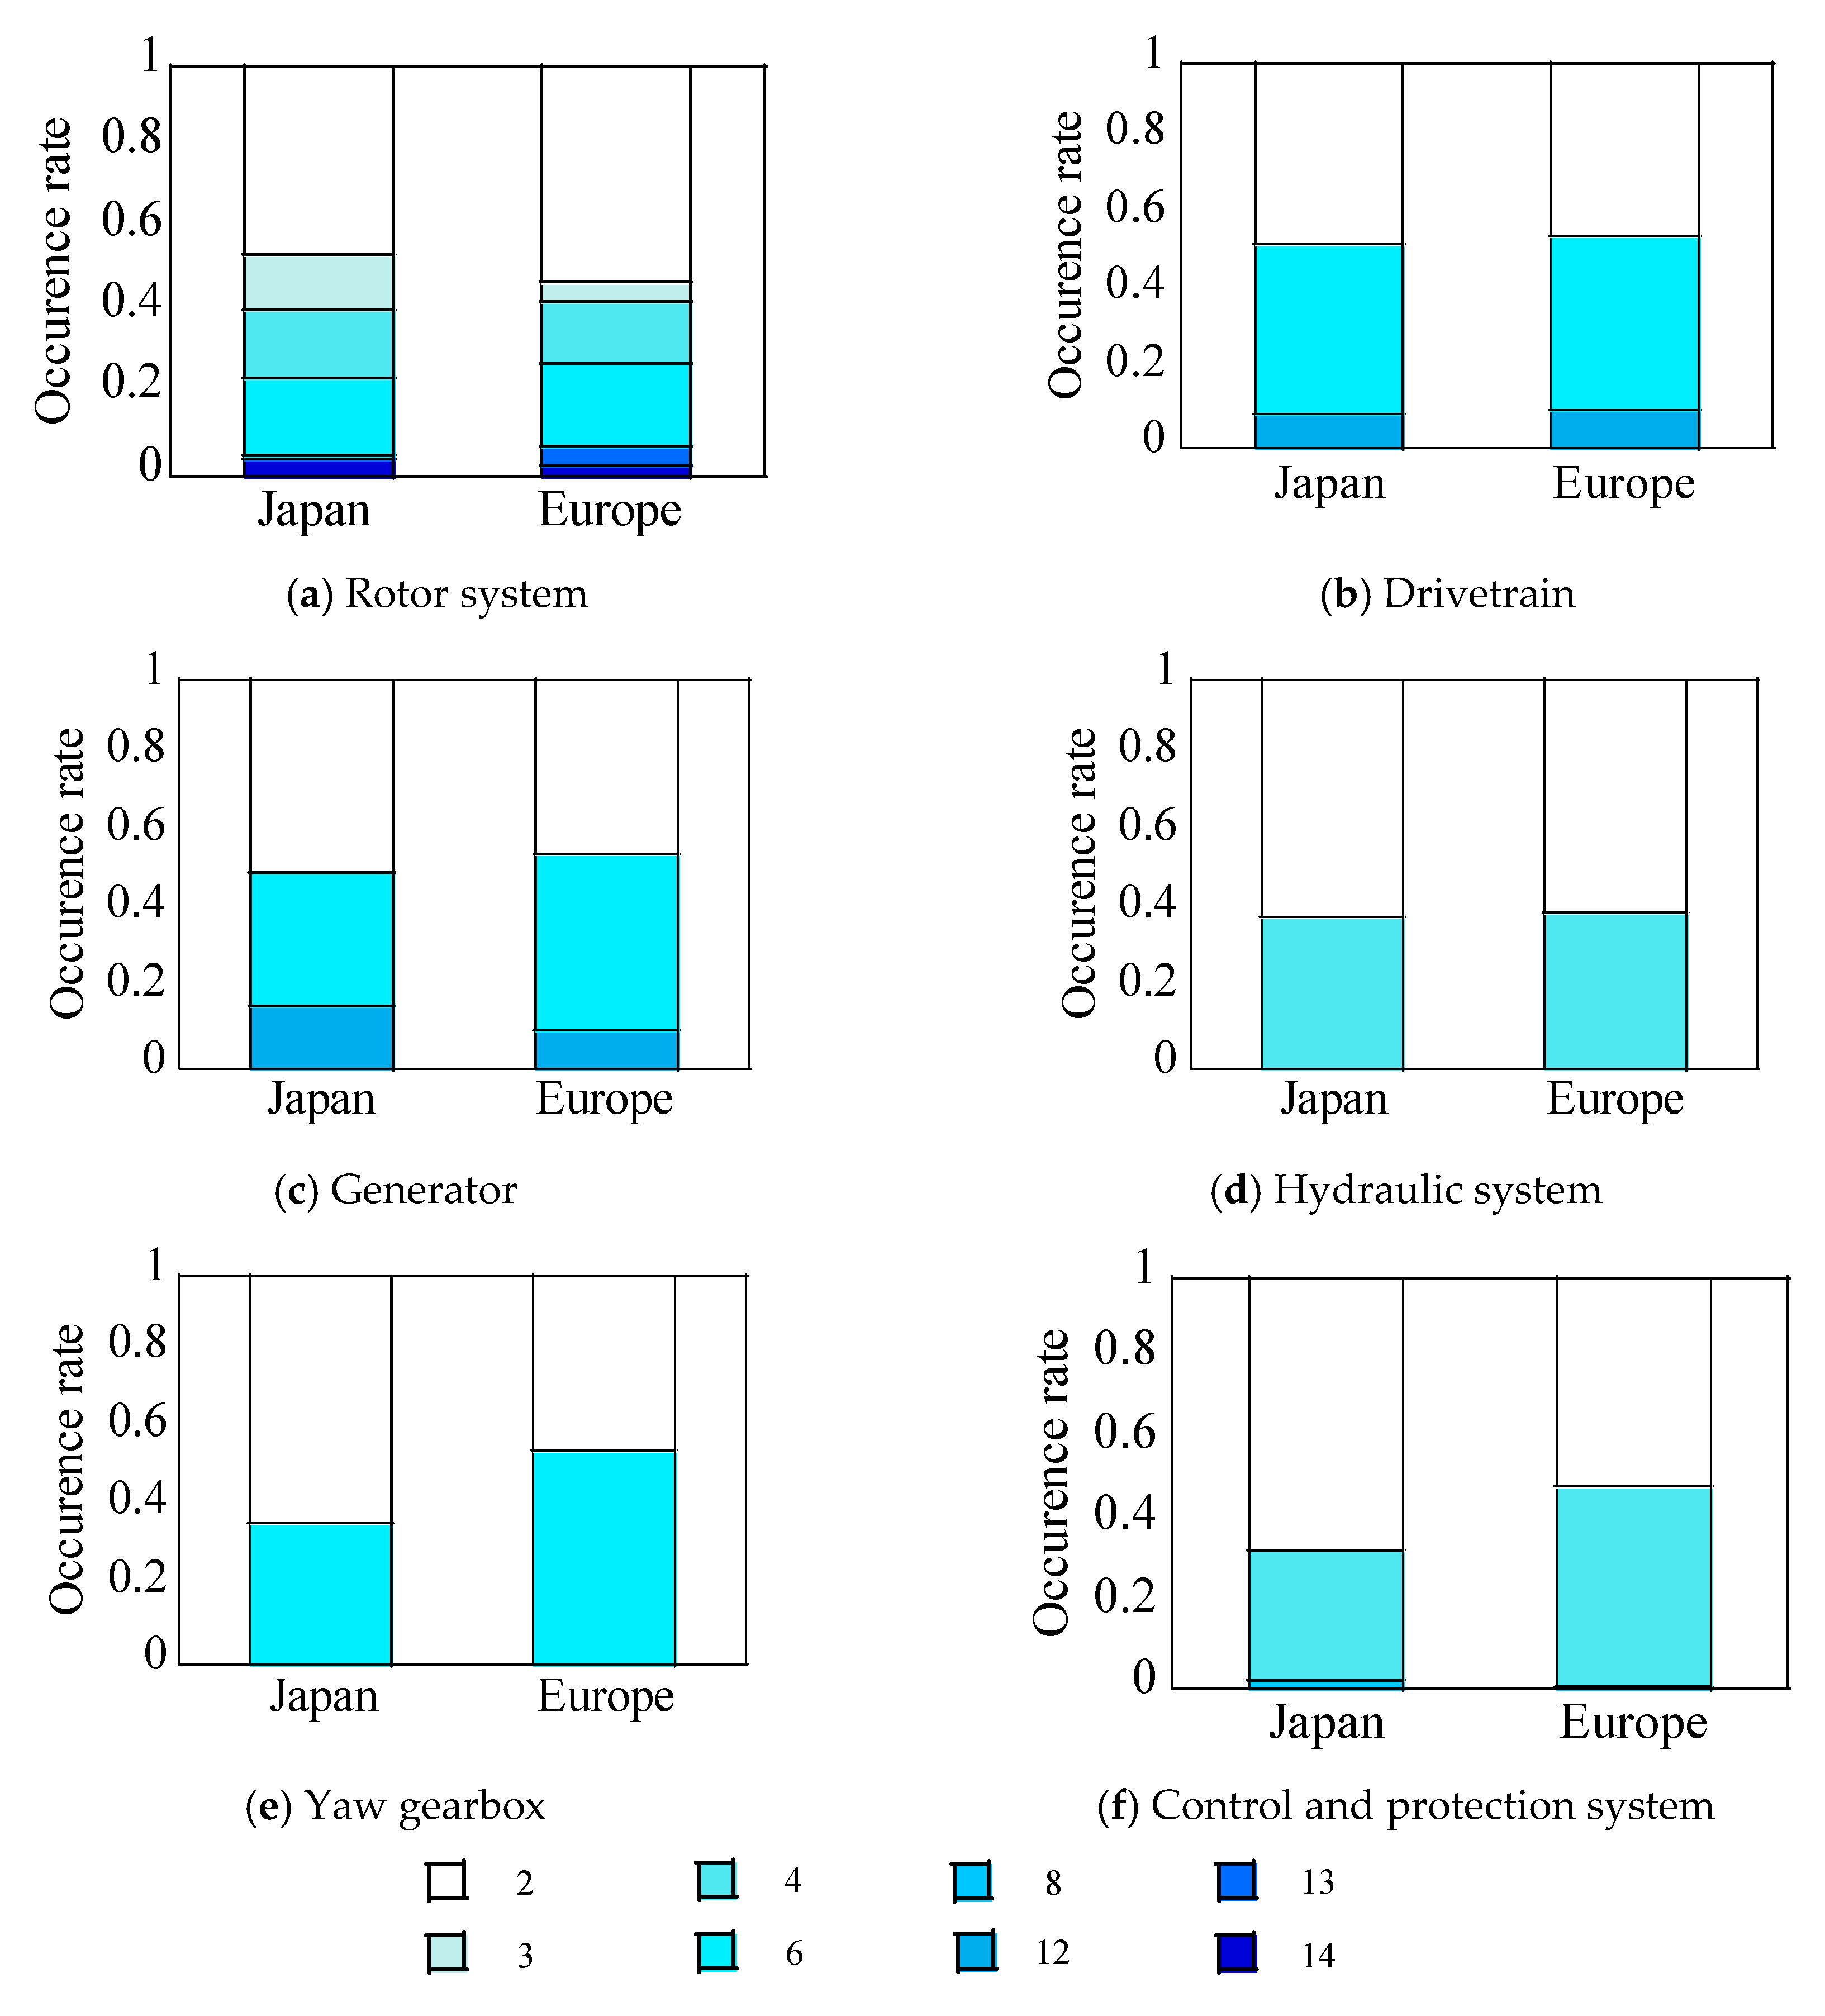
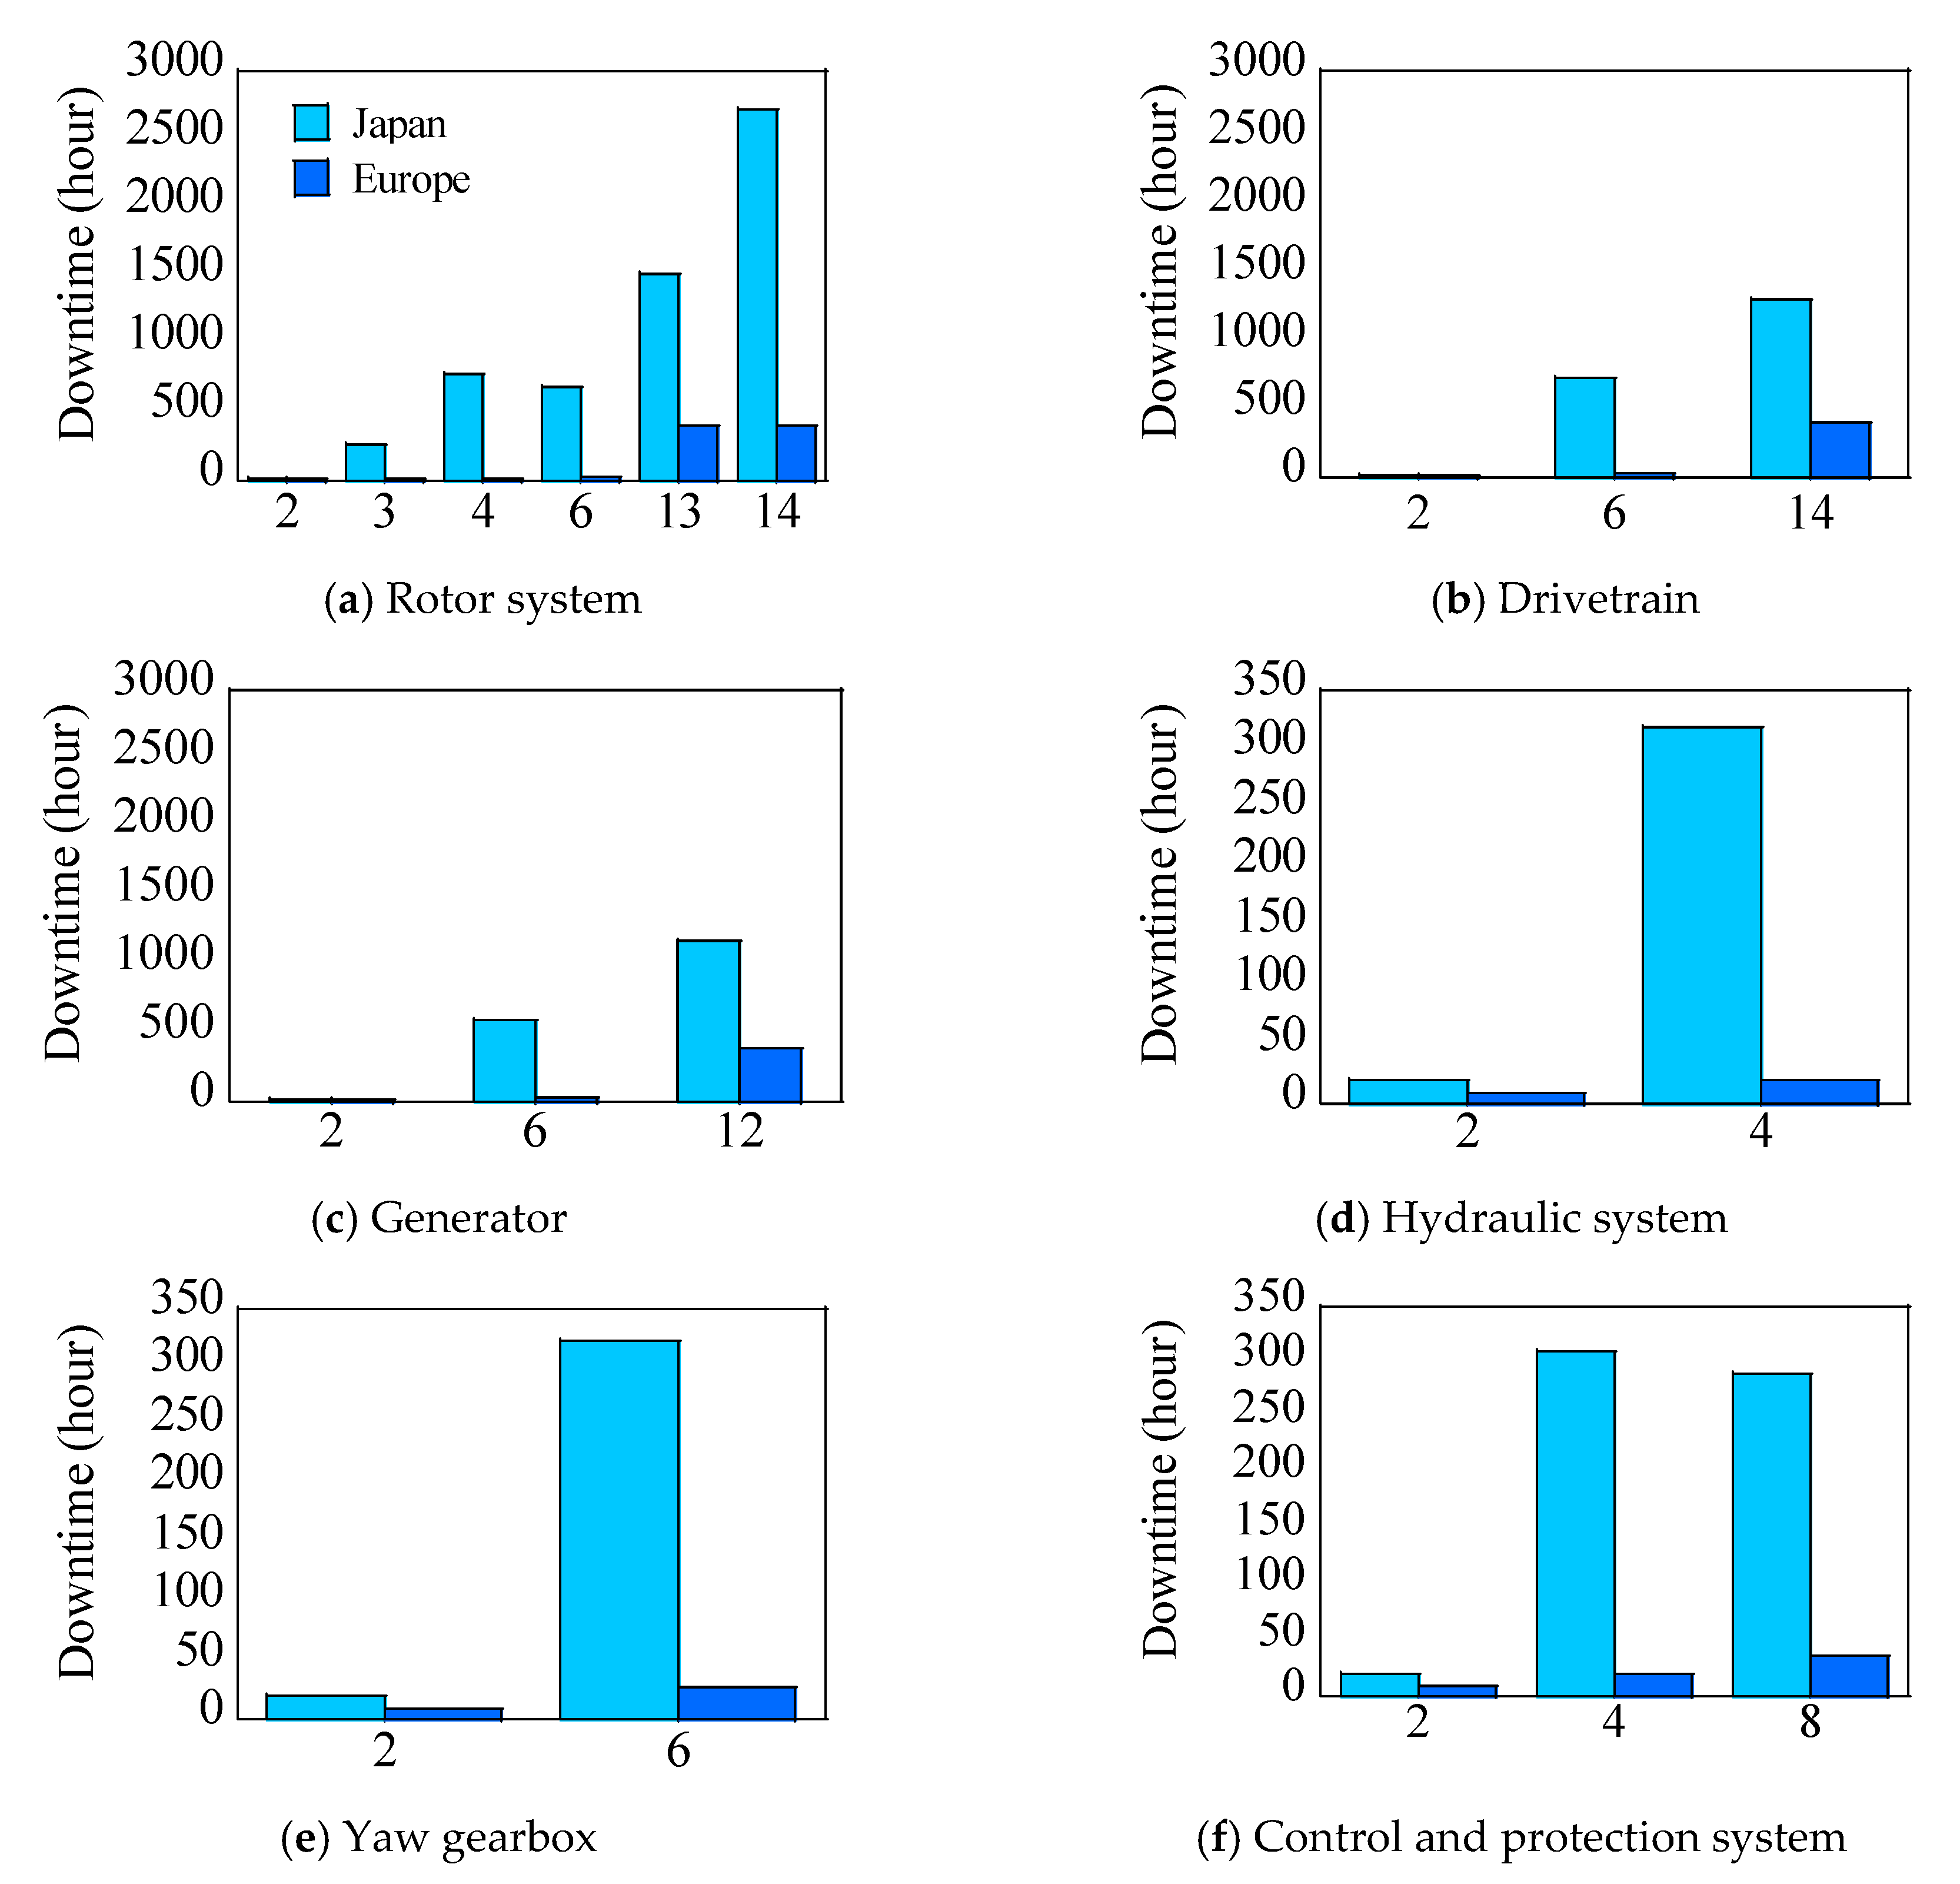
2.3. Analysis of Failure Rate and Downtime at Failure Mode Level

The failure mode effect analysis for the failure data in Japan is conducted based on the description of the root cause and countermeasure of each failure. Twenty-seven failure modes are identified as listed in Table 4. The average downtime (DT) and repair cost (RC) of each failure mode are calculated. The corresponding FTC as shown by Maples et al. [17] is identified based on the failure mode description as listed in Table 4.
Figure 3 shows the comparison of FTC occurrence rates between NEDO and Reliawind. It is found that the percentage of each mode is quite similar between these two databases. Figure 4 illustrates the comparison of downtime between NEDO and Reliawind databases. It is obvious that the downtime in the NEDO database is three times longer than that in the Reliawind database. It is clarified again that longer downtime and lower availability do not come from a higher failure rate, but from a quite longer downtime. The reason for longer downtime is investigated through industry interviews and literature reviews described in Section 3.1.

3. Availability Improvement and LCOE Reduction

The LCOE and industry practices of onshore wind turbines in Japan are described in Section 3.1. The scenarios for availability improvement and LCOE reduction are investigated in Section 3.2 based on the industry interviews and practices in Japan. The effect of uncertainty of downtime and repair cost on LCOE is discussed in Section 3.3.

3.1. LCOE and Industry Practices of Onshore Wind Turbines in Japan

In Japan, the Ministry of Economy, Trade and Industry (METI) collects the cost data of renewable energy sources from electric utilities under the Feed-in Tariff (FiT) system according to the “Act on Purchase of Renewable Energy Sourced Electricity by Electric Utilities” since 1 July 2012 [21]. The act also applied to wind farms that were installed before the act came into effect. The cost data over the country are collected by METI based on this act with very high accuracy. METI publishes the annual report by analyzing the collected cost data as the base data for the tariff price evaluation [22]. The plot data of CAPEX and OPEX are shown in the figures, and the mean and medium values of the CAPEX, OPEX and capacity factor are described in these reports.
In order to reduce the cost and prepare the transition from the FiT to FiP system since 2021, a “wind power competitiveness strengthening committee” was held in 2018, and the cost data were investigated [2]. The committee analyzed cost data collected by the METI described above. Specifically, 13.9 Yen/kWh was evaluated as LCOE for onshore wind power at that time, and the cost target by 2030 was set as 8 to 9 Yen/kWh, the same as the world average value at that time.
In this study, an industry interview was conducted on 7 August 2015 and was reported by Kikuchi et al. [23]. The technical experts in the major wind power companies and the third maintenance companies joined in this interview. The question was: what is the reason for the longer downtime in Japan. It was found that logistics time was long due to a lack of spare parts. The shipment time was longer because about 70% of the turbines installed in Japan were oversea products, and the main components, such as the blade, were also manufactured overseas, even in domestic wind turbine manufacturers [24]. As a result, the downtime in Japan was much longer than that in Europe due to longer logistic downtimes. The downtime took more than three months if they do not have spare parts even though they are small assemblies such as the yaw controller and hydraulic. However, the downtime reduced to less than three days if they have spare parts. Another interview with two major operators was performed to investigate the downtime composition in detail. Major wind power companies have a capability to prepare spares; however, small-sized enterprises including city municipalities do not. It was also pointed out from this industry interview that the supply chain was immature, and the third parties for O&M were very few in Japan. The troubleshooting also took a lot of time.
The industry practice on onshore wind power was also reviewed, and the maintenance strategy to reduce the downtime in Eurus Energy, a major wind power company in Japan, was considered. It was found that a 25-day downtime was reduced to 10 days by conducting the condition-based monitoring as reported by Takagi [25]. When the major parts of wind turbines are replaced using the crane in the farm land, the permission must be received for the agricultural land conversion according to the Agricultural Land Act in Japan, which usually takes more than one month. This permission procedure can be completed before the failure becomes severe using the condition-monitoring system.
The annual reports named as “current status and challenges of wind power in Hokkaido” published by the Department of Hokkaido Industrial Safety and Inspection of Ministry of Economy, Trade and Industry [26] are used in this study. The collection rate is almost 100% from wind farms in Hokkaido. The averages of the operating time, scheduled downtime and downtime in the Hokkaido region based on SCADA data are shown in this report. The industry interviews by questionnaires about the reason for the higher downtime were also conducted for these annual reports. These reports show that the repair time is longer due to immaturity of the maintenance sector. The third parties for O&M in Japan are very few. The troubleshooting takes time due to a lack of experience. The contract also affects this long downtime. It is necessary to call engineers from oversea manufacturers when a failure occurs since small-sized enterprises and city municipalities do not have availability guarantees.
Availability improvement and LCOE reduction scenarios are conducted based on the data collected above and the NEDO failure database analyzed in Section 2. The baseline case is set based on the data as shown at the wind power competitiveness strengthening committee. The availability improvement scenario is then proposed based on the industry practice in Japan collected from industry interviews and reviews. The strategies, such as spare-parts preparation, condition-based monitoring and industry maturities are used to determine the three reduction scenarios. The cost-reduction potential is calculated using the NEDO failure database. An average annual wind speed is used in this study according to the wind resource map in NEDO [27]. The capacity factor increases only by reducing downtime.

3.2. Scenarios for Availability Improvement and LCOE Reduction

The availability and LCOE in Japan are analyzed using the failure rates and downtime as shown in Section 2.3. Every failure is assumed to be independent. Weather downtime is disregarded since its effect is negligible for onshore wind farms. The downtime is possible to calculate as
D = j = 1 N λ j × D j
where λ j and D j are the failure rate and downtime of each FTC j .
The baseline case and three scenarios shown in Table 5 are assumed to improve availability, to reduce LCOE in Japan and to achieve the world average values. Figure 5 shows the downtime of each FTC for the baseline case and three scenarios. Downtimes described in Table 4 are divided into logistic time and repair time based on the interview with two major operators.
The baseline case is set as the same as the current situation. The downtime for each FTC as shown in Section 2.3 is used. Downtime is divided into logistic time (including transportation time) and repair time based on the industry interview.
As mentioned in Section 2.3, the downtime of small subassemblies was reduced from more than three or four months to less than three days by preparing the spare parts in the country. Scenario 1 is set as that the downtime of minor FTC, reduced to 72 h based on the industry practice.
As mentioned in Section 3.1, the condition-monitoring system reduced the downtime from 25 days to 10 days. In addition to reducing the downtime of minor FTC as shown in Scenario 1, Scenario 2 is set such that the downtime of major FTC reduces to 10 days based on the industry practice in Japan.
The repair time in Japan is longer than that in Europe as shown in Section 2.3. It is because the industry maturity is not enough. In addition to reducing the downtime of FTC as mentioned in Scenario 2, an experience curve is adopted in Scenario 3 to reduce the maintenance cost with a learning rate of 18.6% [28] since the learning curve of repair downtime is not available in Japan. The contributions from the maturities of supply chain and the third parties for O&M are taken into account.
Table 6 summarizes the predicted availability, which is 92.7% for Scenario 1, 95.5% for Scenario 2 and 96.4% for Scenario 3.
LCOE is also investigated for each scenario. The levelized cost of energy is generally evaluated as
L C O E = C A P E X × F C R + O P E X A E P
where CAPEX is the capital expenditure; FCR is the fixed charge rate; OPEX is the operating expense and AEP is the annual energy production. OPEX is evaluated using Equation (4) with the sum of the repair cost C r e p a i r , the labor cost C l a b o r and the other cost in repair C o t h e r including land fee and insurance cost. AEP is evaluated as the product of power curve P ( f ) , wind speed frequency distribution f ( U ) and availability as shown in Equation (5). The total downtime can be divided into the downtime T d o w n t i m e and the scheduled downtime T s c h e d u l e d due to the scheduled maintenance as shown in Equation (6).
O P E X = C r e p a i r + C l a b o r + C o t h e r
A E P = P ( U ) × f ( U ) × A v a i l a b i l i t y
A v a i l a b i l i t y = 8760 ( T d o w n t i m e + T s c h e d u l e d ) 8760
Table 7 summarizes the average value used in this study for LCOE calculation. The average of CAPEX is evaluated as 282,000 Yen/kW from reference [2] reported by the Japanese government. The average of repair cost is evaluated as 2300 Yen/kWh from the NEDO database. The labor cost and the other cost in repair are also identified from Reference [2]. The scheduled downtime is determined based on reference [26], which is collected by the Department of Hokkaido Industrial Safety and Inspection. The fixed charge rate is identified as 6.12% from levelized cost of energy, capital expenditure, operating expense, annual energy production and 20-year lifetime to match the LCOE of 13.9 Yen/kWh as reported in reference [2]. The input values for each scenario are given in Table 7. In addition to three scenarios, the target for 2030 is set, where CAPEX is reduced by the learning rate of 18.6% as proposed by Wiser et al. [21].
Table 8 and Figure 6 show the predicted LCOE for each scenario. The downtime T d o w n t i m e is obtained from Section 2 as described in Table 6. In OPEX, the labor cost C l a b o r assumes to be proportional to the repair downtime, C r e p a i r and C o t h e r are fixed values. LCOE in Figure 6 is divided into three parts: Production loss, OPEX and CAPEX. The cost reduction in Scenario 1 is 1.9 Yen/kWh, and those in Scenario 2 and 3 are 0.9 Yen/kWh and 0.3 Yen/kWh, respectively. It means that the total reduction of 3.1 Yen/kWh is possible by optimization of O&M strategy optimization. In addition, CAPEX reduction is also required to achieve the national target for LCOE in 2030.

3.3. Effect of Uncertainty on Levelized Cost of Energy

The effect of uncertainty on CAPEX, downtime and repair cost are considered in this study.
The uncertainty of CAPEX is estimated based on reference [22] reported by the government. Figure 7 shows the probability density distribution of CAPEX. The parameters are identified by moment method. RMSE of beta, log-normalized and Weibull distributions are 1.01 × 10⁻², 1.07 × 10⁻² and 0.96 × 10⁻², respectively. The least error distribution of the Weibull distribution is used as shown in Figure 7. The average value is 282,000 Yen/kW, and CoV is 0.27.
The cumulative distribution of downtime and repair cost for each FTC is analyzed. The beta function is used for the fitting as shown in Equations (7)–(9).
f ( x | a , b ) = 1 B ( a , b ) x a 1 ( 1 x ) b 1 I [ 0 , 1 ] ( x )
a = ( m 3 + m 2 m v ) / v
b = ( 1 m 1 )
where m is the average value, and v is the standard deviation of data.
The cumulative distributions of downtime for rotor assembly and control assembly are shown in Figure 8, and those of repair cost are shown in Figure 9. The cumulative probability functions of the failure modes with the short downtime show the similar probability distributions regardless of the size of assembly, while those with the long downtime depend on the size of assembly as shown in Figure 8.
Figure 10 shows the cumulative distributions of downtime for the rotor and control assemblies used in Scenario 1. The downtime of FTC 2, 3, 4 as shown in Table 4 are reduced to 72 h, compared to the baseline case.
Figure 11 illustrates the cumulative distribution of downtime for rotor assemblies used in Scenario 2. The downtime of FTC 6 and 14 are reduced to 10 days, compared to Scenario 1.
The cumulative distributions of repair cost are not changed from the baseline case as shown in Figure 9.
Figure 12 displays the predicted probability density distribution for each scenario, and the predicted median value of P50, the 90th percentile of P90 and those ratios of P90/P50 are summarized in Table 9. This indicates that the uncertainty of LCOE in Scenario 1 reduces from the baseline case, but the uncertainties of LCOE in the three scenarios are similar. It suggests that a reduction in the downtime of small failure modes results in a significant reduction in uncertainty. Reducing the uncertainty is an important aspect to consider OPEX cost reduction, which connects to the reduction in insurance cost included in C o t h e r as shown in Equation (4).

4. Conclusions

In this study, a failure mode effect analysis is conducted based on the failure rate and downtime database for onshore wind turbines in Japan. The availability and levelized cost of energy are analyzed using the failure rate and downtime database. The following conclusions are obtained.
  • The normalized failure rate and downtime are comparable between Japan and Europe for each fault type class at the assembly and failure mode levels. The occurrence rate is similar between Japan and Europe, but the downtime in Japan is much longer than that in Europe. It is clarified that the difference in downtime in each database comes from the operating years of turbines by analyzing old and new turbines in the NEDO database.
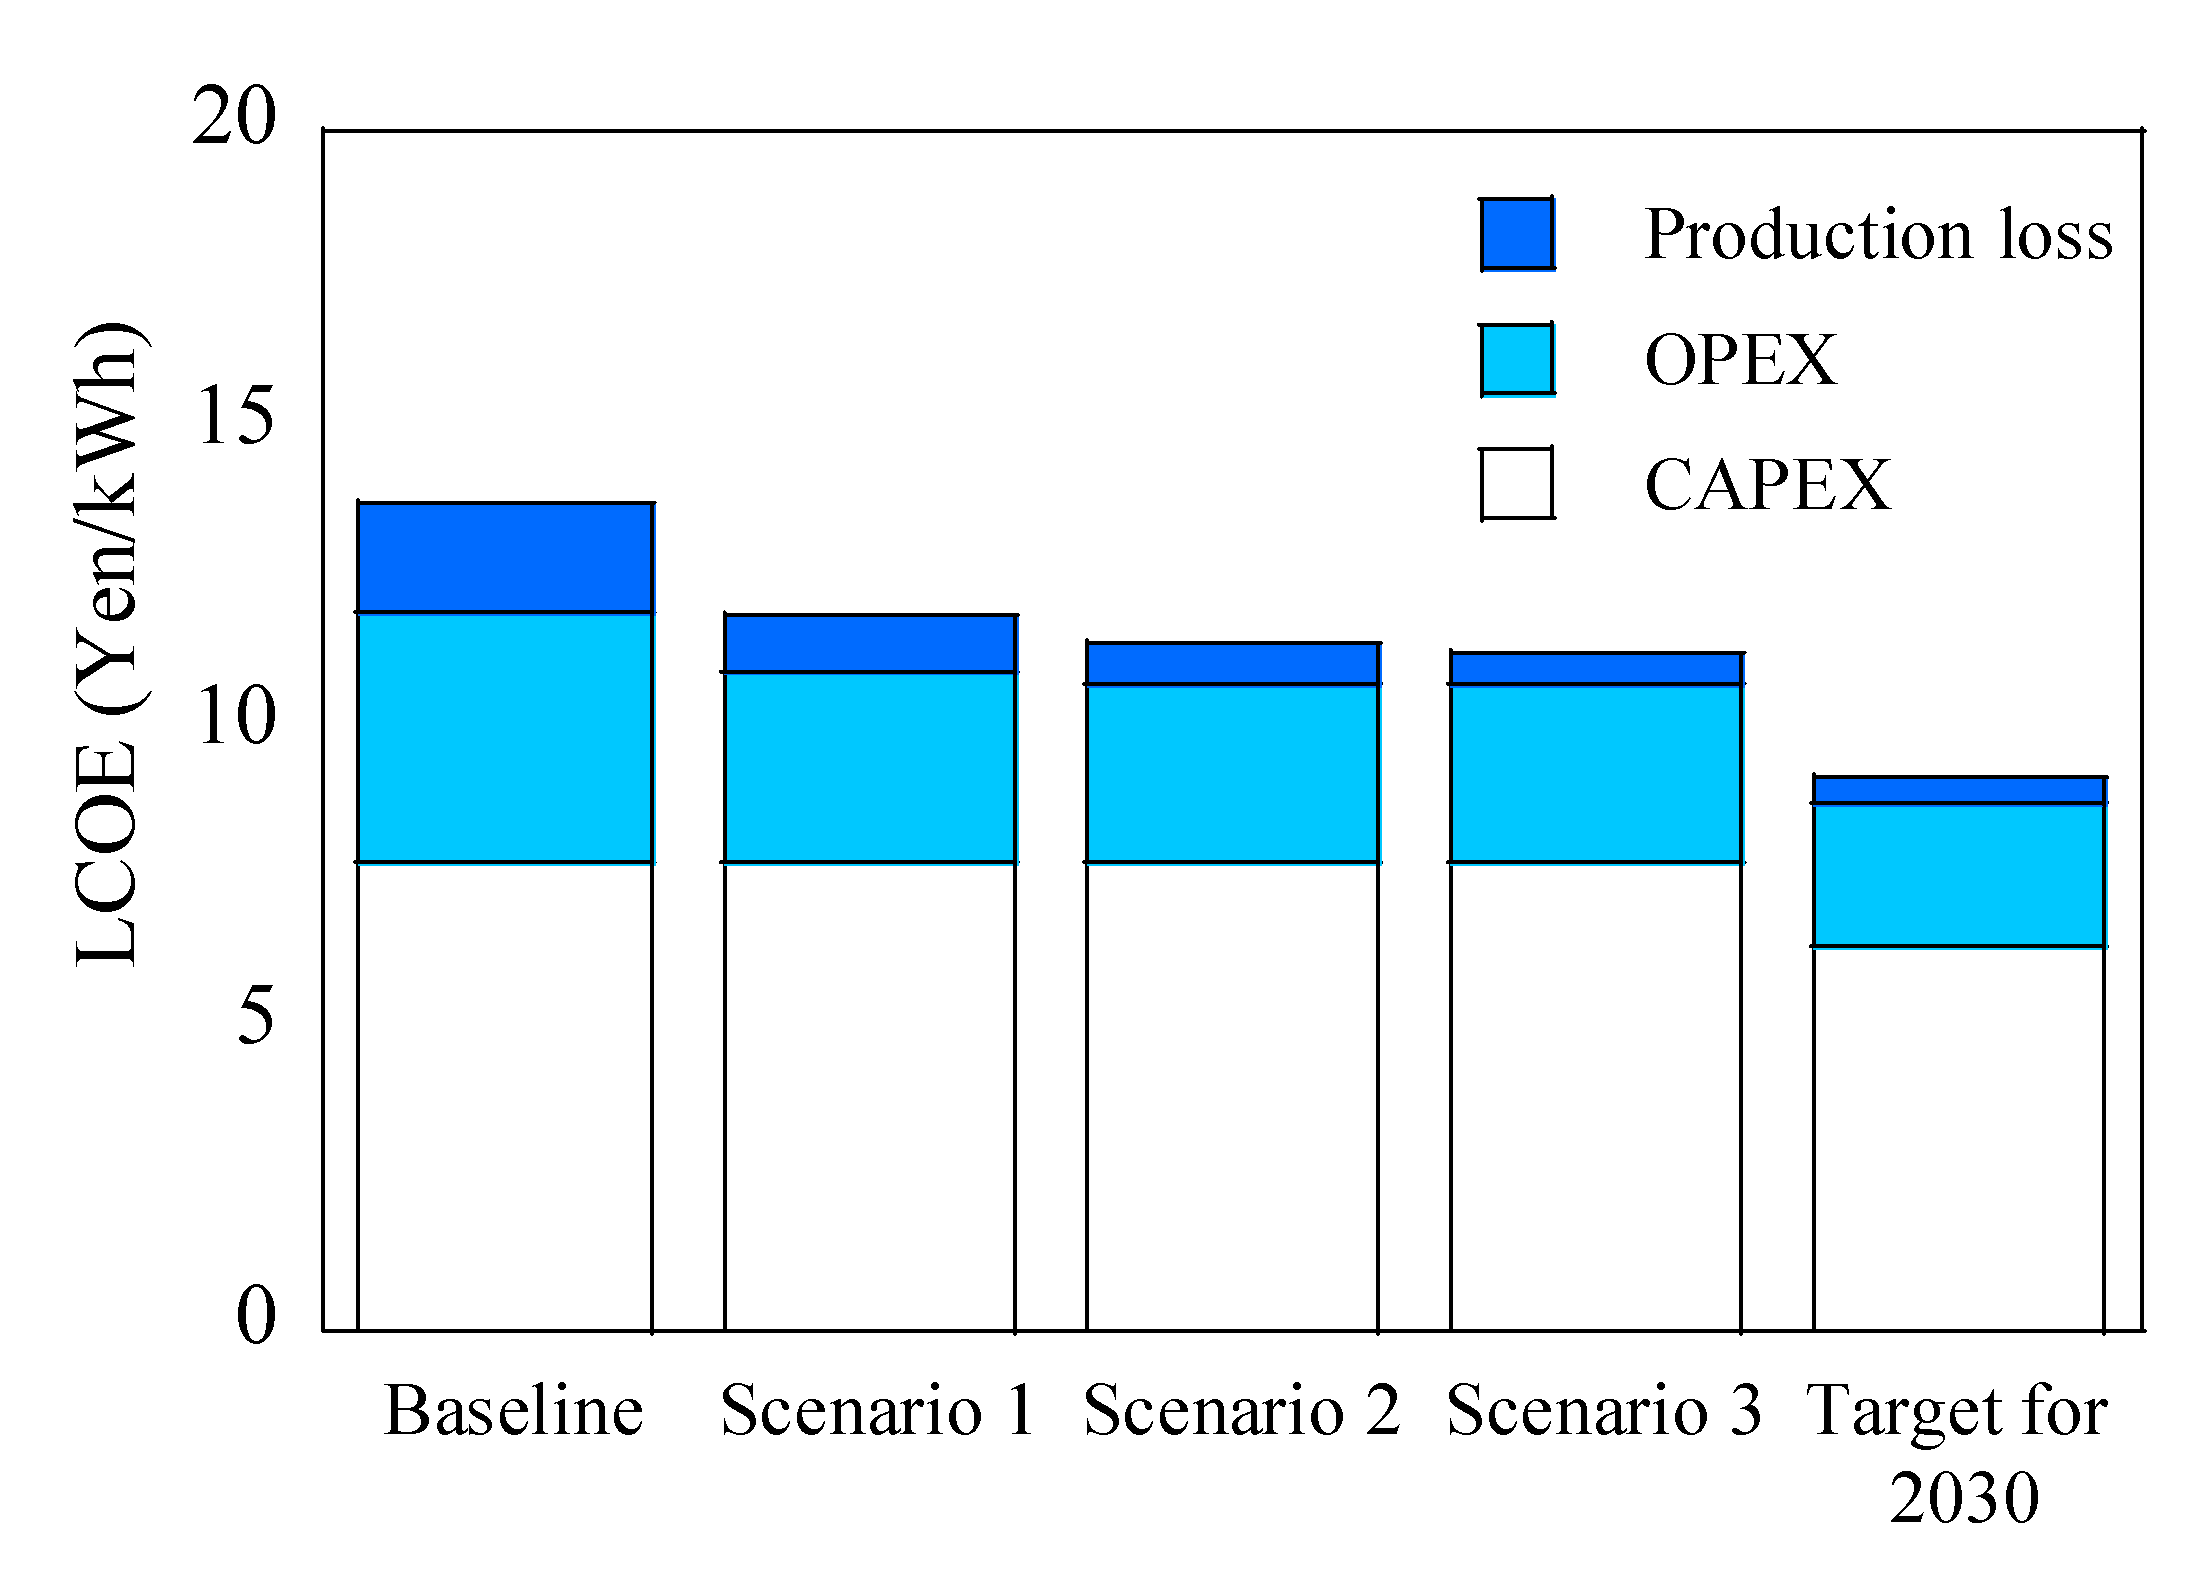
  • Availability improvement and cost reduction scenarios are investigated using the failure rate and downtime for each fault type class based on the industry interview and best practices in Japan. The availability can be improved from 87.4% to 92.7, 95.5 and 96.4%, and the levelized cost of energy reduces from 13.7 Yen/kWh to 11.9, 11.0, 10.7 Yen/kWh considering spare parts, condition monitoring and industry maturity.
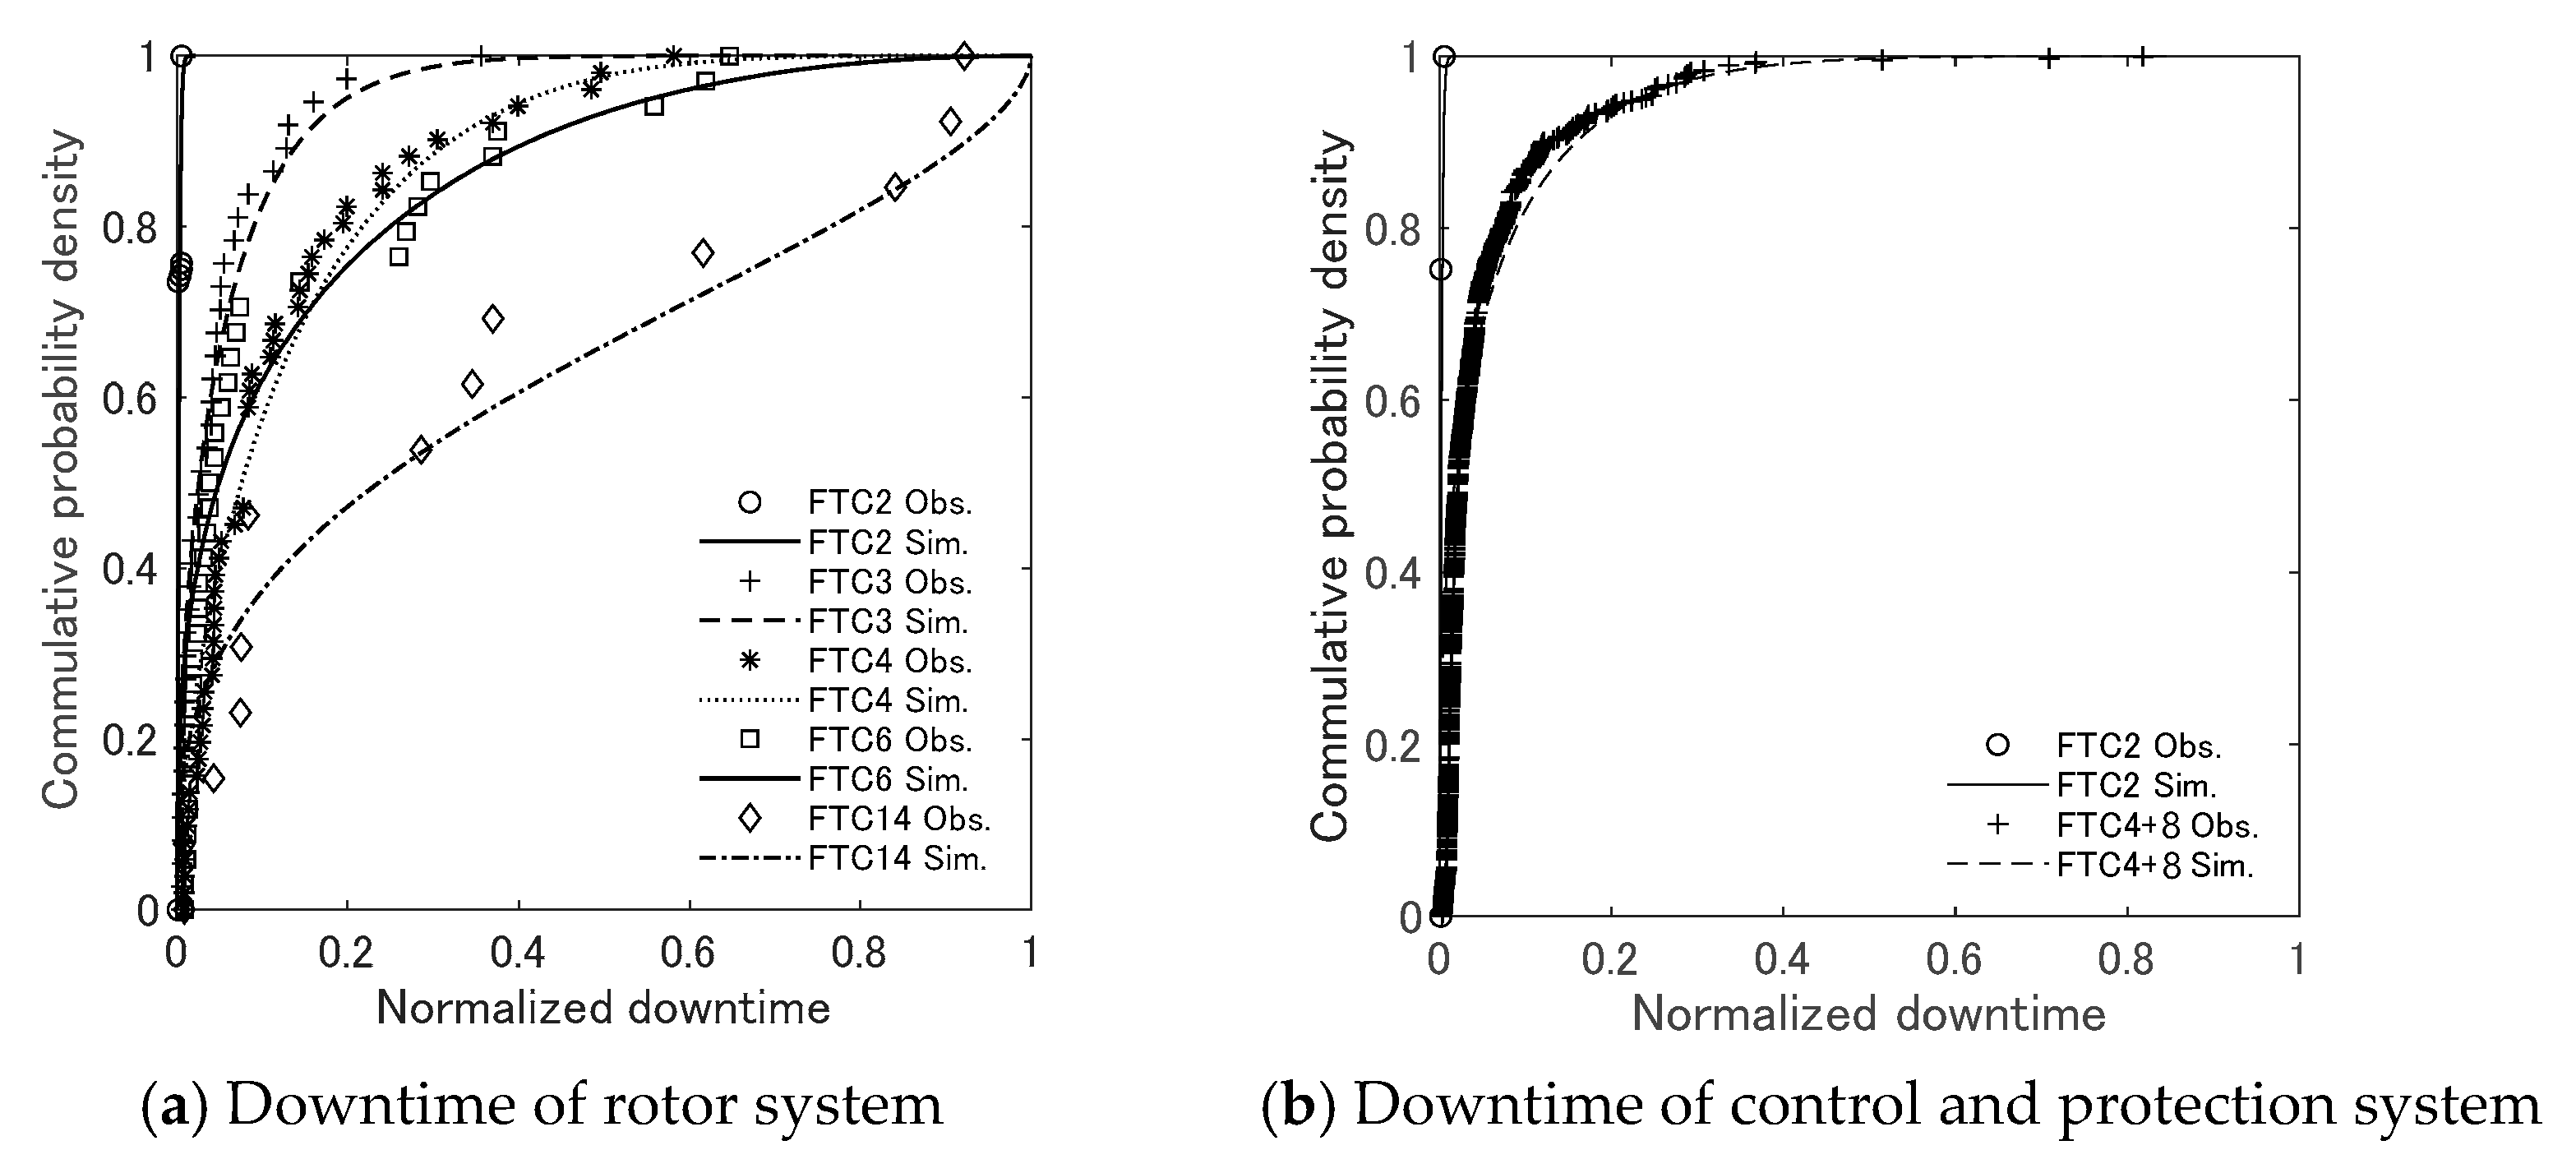
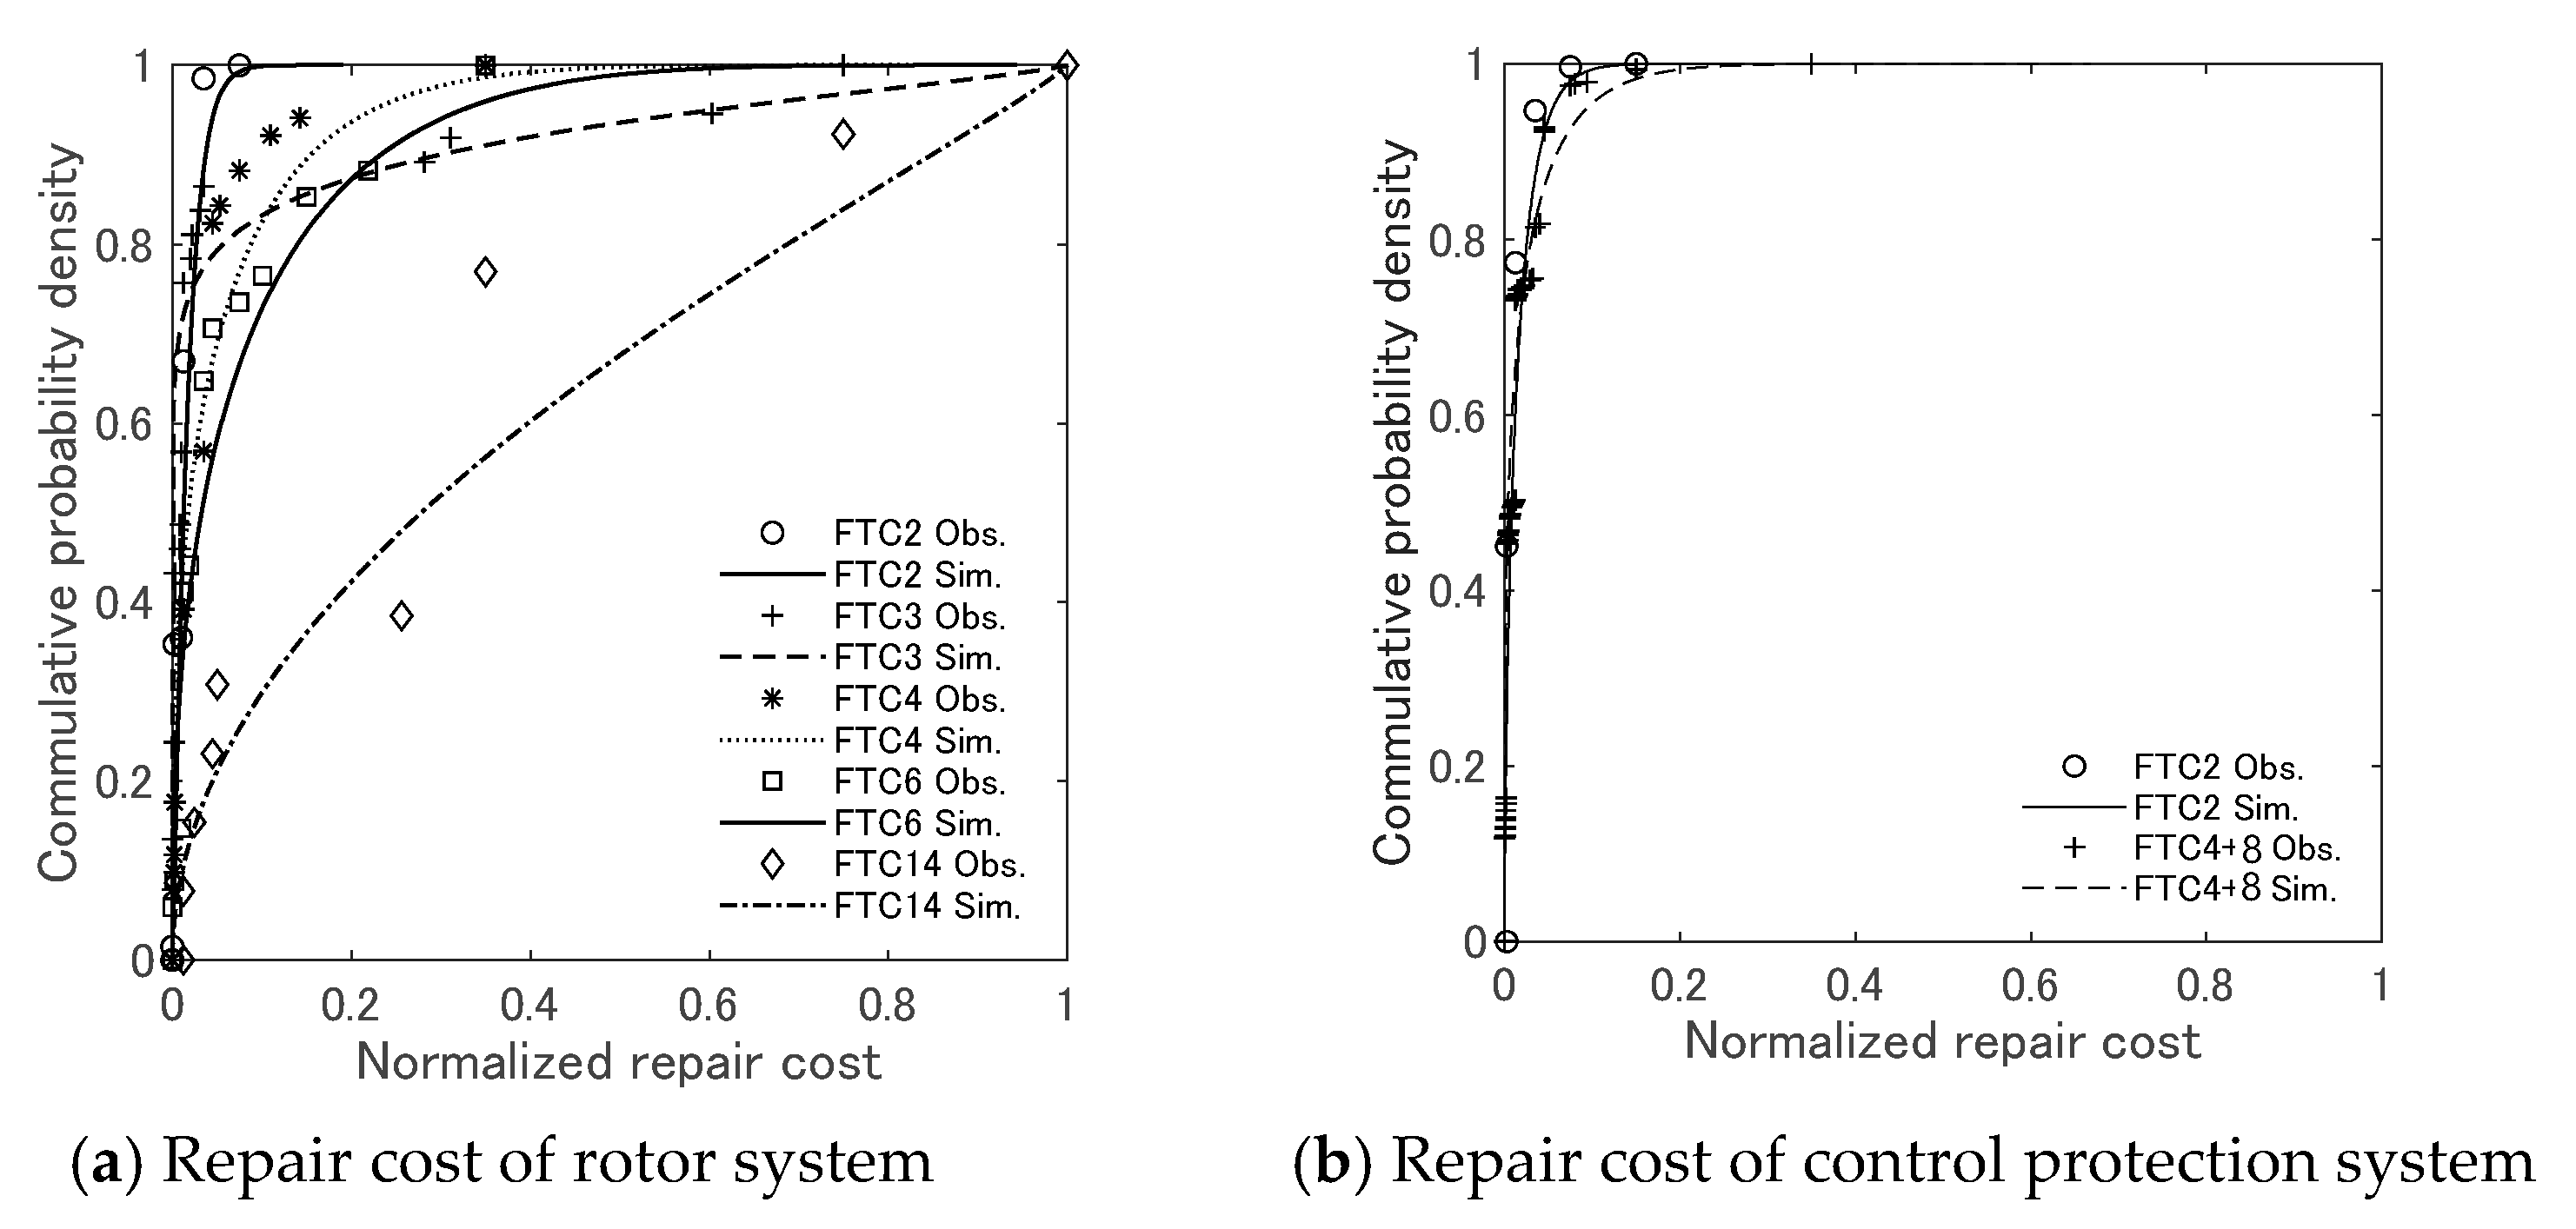
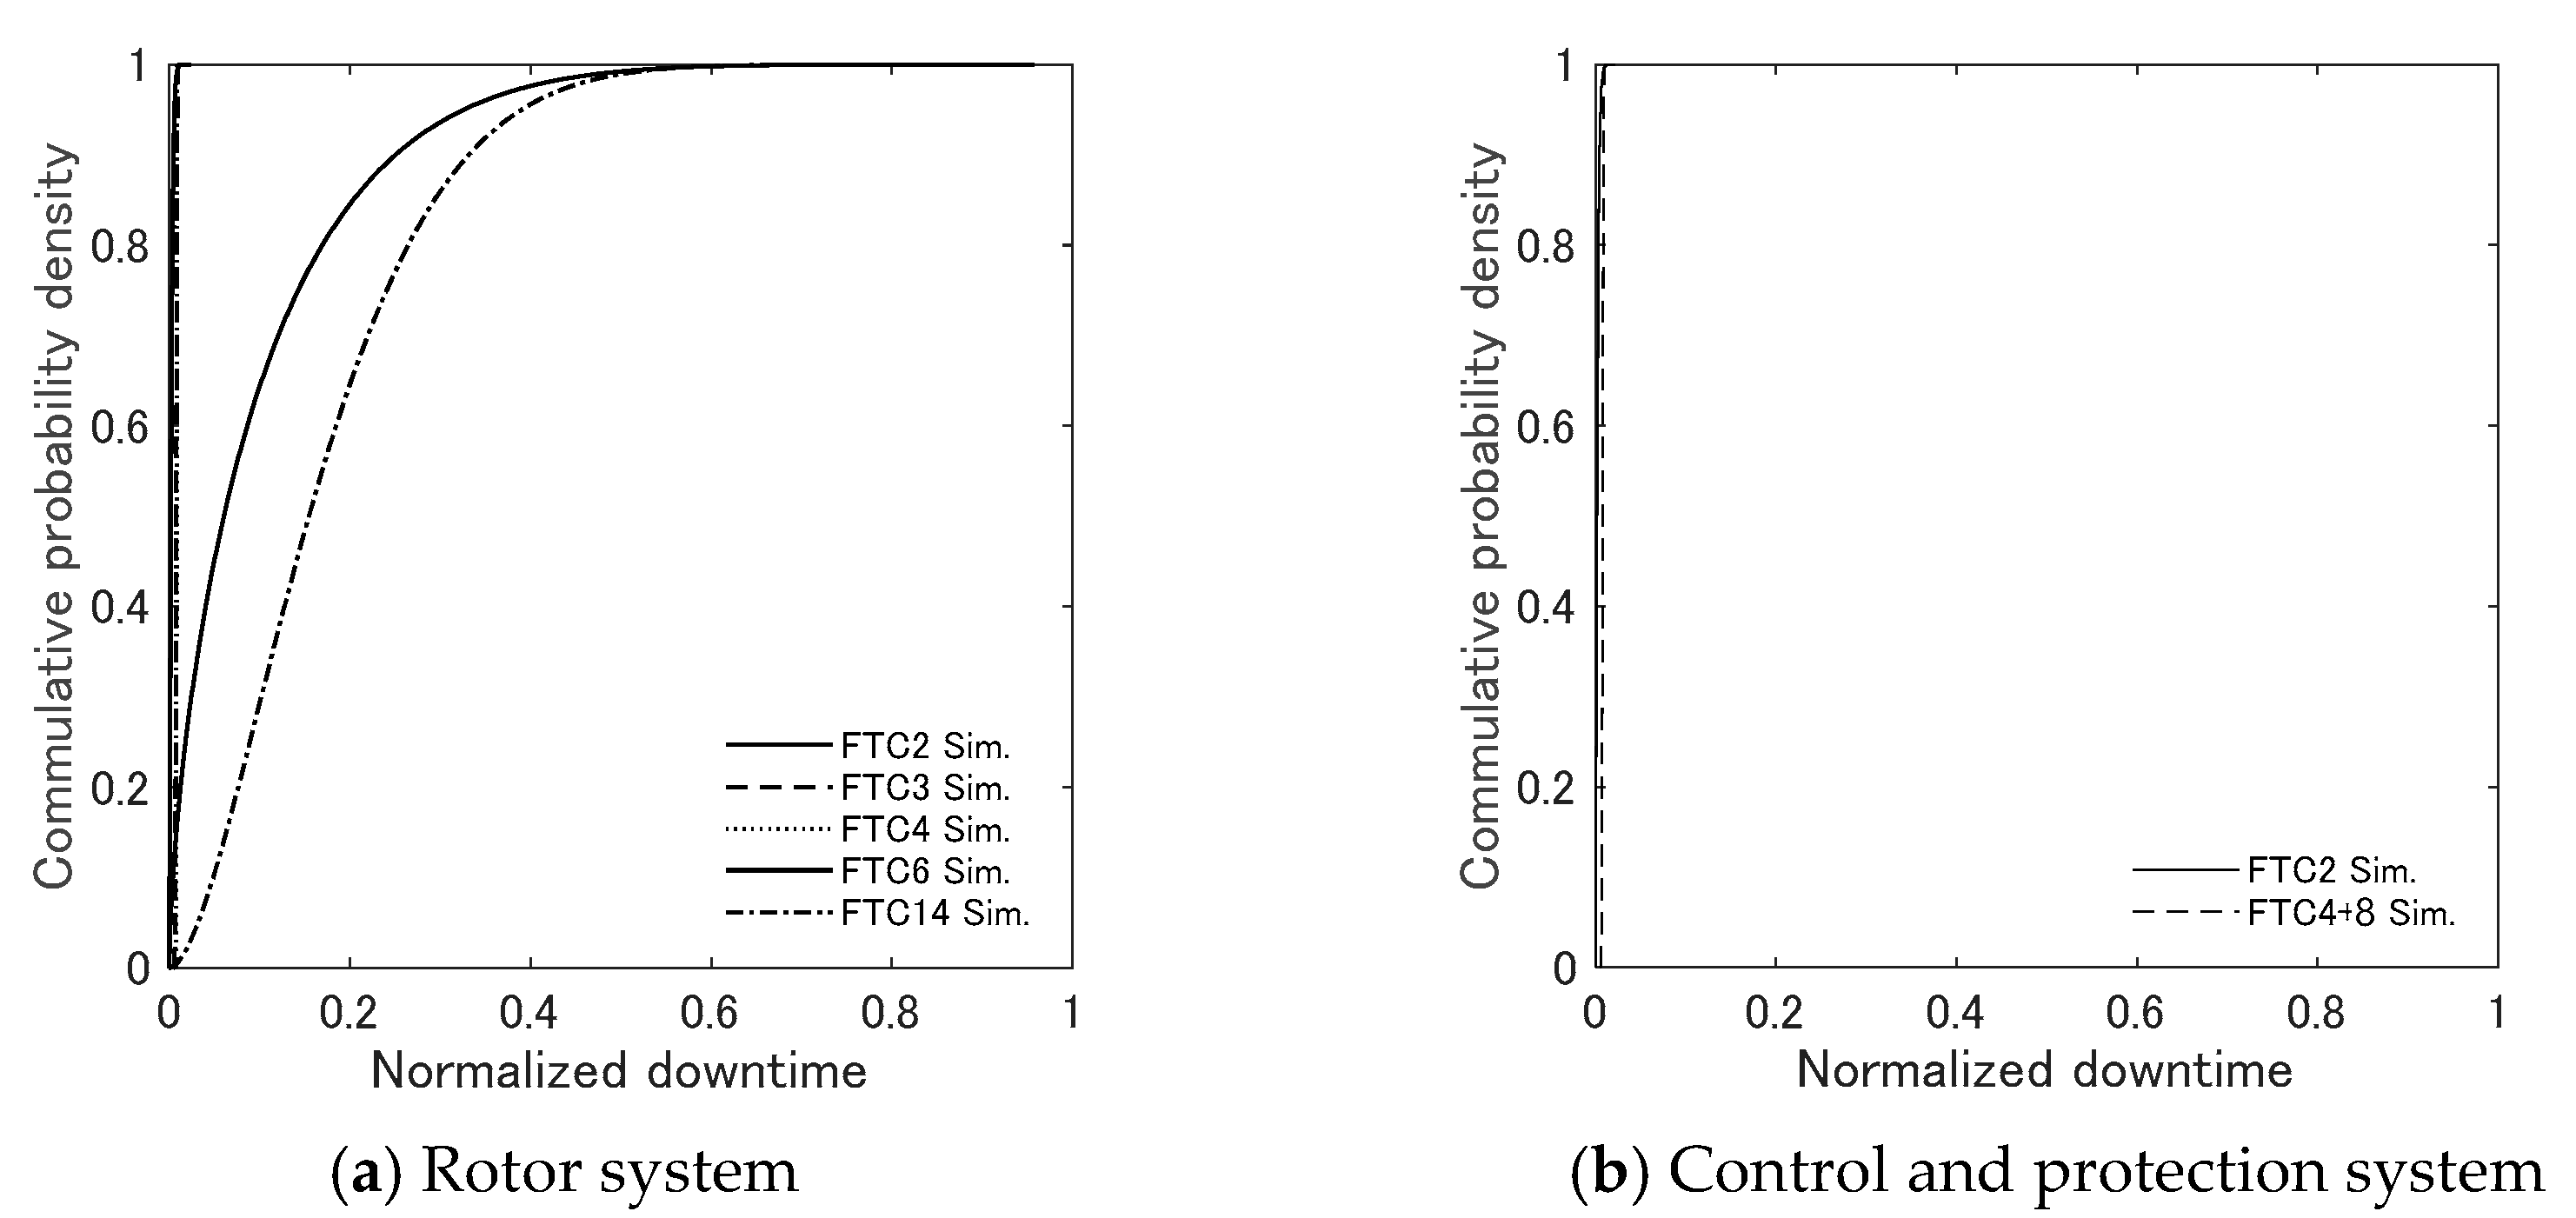
  • The cumulative probability function of downtime and repair cost for each mode is analyzed. It is found that the cumulative probability functions of the failure modes with the shortest downtime show similar probability distributions regardless of the size of assembly. The uncertainty of LCOE in the three scenarios significantly reduces from the baseline case by about 30% due to a reduction in the downtime of small failure modes, which is an important aspect to consider OPEX cost reduction.

Author Contributions

Conceptualization, Y.K. and T.I.; methodology, Y.K. and T.I.; data curation, Y.K.; investigation, Y.K. and T.I.; formal analysis, Y.K.; visualization, Y.K.; writing—original draft, Y.K.; writing—review and editing, T.I.; supervision, T.I.; project administration, T.I.; funding acquisition, T.I. All authors have read and agreed to the published version of the manuscript.

Funding

This research received no external funding.

Institutional Review Board Statement

Not applicable.

Informed Consent Statement

Not applicable.

Data Availability Statement

Data sharing not applicable.

Acknowledgments

This research is carried out as a part of a joint program for the next generation of energy infrastructure with MHI Vestas Offshore Wind Japan, J-POWER, Shimizu Corporation, Toshiba Energy Systems & Solutions Corporation and ClassNK. The failure database in Japan was provided through the smart maintenance project funded by NEDO. The authors are grateful to Novita Saraswati at TNO for her deep knowledge about O&M analysis. The authors express their deepest gratitude to the concerned parties for their assistance during this study.

Conflicts of Interest

The authors declare no conflict of interest.

References

  1. Japan Wind Power Association, JWPA Report Detail 2021/02/12. Available online: http://jwpa.jp/page_304_englishsite/jwpa/detail_e.html (accessed on 28 May 2021).
  2. Wind Power Competitiveness Strengthening Committee, Final Report. 2016. Available online: https://www.meti.go.jp/committee/kenkyukai/energy_environment/furyoku/pdf/report_01_01.pdf (accessed on 28 May 2021). (In Japanese).
  3. Hand, M.M. IEA Wind TCP Task 26‒Wind Technology, Cost, and Performance Trends in Denmark, Germany, Ireland, Norway, Sweden, the European Union, and the United States: 2008‒2016. NREL/TP-6A20-71844. National Renewable Energy Laboratory, Golden, CO (US). 2018. Available online: https://www.nrel.gov/docs/fy19osti/71844.pdf (accessed on 28 May 2021).
  4. Herman, K.; Walker, R.; Wilkinson, M. Availability trends observed at operational wind farms. In Proceedings of the Science & Research Abstract for EWEA 2008 Annual Event, European Wind Energy Conference 2008, Brussels, Belgium, 31 March–3 April 2008. [Google Scholar]
  5. New Energy and Industrial Technology Development Organization. The Report of Wind Turbine Failure and Accident 2013–2017; New Energy and Industrial Technology Development Organization: Kawasaki, Japan, 2013–2017. (In Japanese) [Google Scholar]
  6. Pfaffel, S.; Faulstich, S.; Rohrig, K. Performance and reliability of wind turbines: A review. Energies 2017, 10, 1904. [Google Scholar] [CrossRef] [Green Version]
  7. Dao, C.; Kazemtabrizi, B.; Crabtree, C. Wind turbine reliability data review and impacts on levelised cost of energy. Wind Energy 2019, 22, 1848–1871. [Google Scholar] [CrossRef] [Green Version]
  8. Faulstich, S.; Pfaffel, S.; Hahn, B. Performance and reliability benchmarking using the cross-company initiative WInD-Pool. In Proceedings of the RAVE Offshore Wind R&D Conference, Bremerhaven, Germany, 14 October 2015. [Google Scholar]
  9. Portfolio Review 2016; System Performance, Availability and Reliability Trend Analysis (SPARTA): Northumberland, UK, 2016.
  10. Faulstich, S.; Hahn, B.; Tavner, P.J. Wind turbine downtime and its importance for offshore deployment. Wind Energy 2011, 14, 327–337. [Google Scholar] [CrossRef]
  11. Wilkinson, M. Measuring wind turbine reliability—Results of the reliawind project. In Proceedings of the Science & Research Abstract for EWEA 2011 Annual Event, European Wind Energy Conference 2011, Brussels, Belgium, 14–17 March 2011. [Google Scholar]
  12. VGB Standards, RDS-PP—Application Guideline; Part 32: Wind Power Plants. 2014. Available online: https://www.vgb.org/shop/technicalrules/vgb-standards/s-823-0.html?___store=en&___from_store=default (accessed on 28 May 2021).
  13. Shafiee, M.; Dinmohammadi, F. An FMEA-based risk assessment approach for wind turbine systems: A comparative study of onshore and offshore. Energies 2014, 7, 619–642. [Google Scholar] [CrossRef] [Green Version]
  14. Ozturk, S.; Fthenakis, V.; Faulstich, S. Failure modes, effects and criticality analysis for wind turbines considering climatic regions and comparing geared and direct drive wind turbines. Energies 2018, 11, 2317. [Google Scholar] [CrossRef]
  15. Carroll, J.; McDonald, A.; McMillan, D. Failure rate, repair time and unscheduled O&M cost analysis of offshore wind turbines. Wind Energy 2016, 19, 1107–1119. [Google Scholar] [CrossRef] [Green Version]
  16. Asgarpour, M.; van de Pieterman, R.; Netherlands, E.R.C. O&M Cost Reduction of Offshore Wind Farms—A Novel Case Study; ECN, 2014; Available online: https://publicaties.ecn.nl/PdfFetch.aspx?nr=ECN-E--14-028 (accessed on 28 May 2021).
  17. Maples, B.; Saur, G.; Hand, M.; van de Pietermen, R.; Obdam, T. Installation, Operation, and Maintenance Strategies to Reduce the Cost of Offshore Wind Energy; National Renewable Energy Lab. (NREL): Golden, CO, USA, 2013. [Google Scholar]
  18. Seyr, H.; Muskulus, M. Value of information of repair times for offshore wind farm maintenance planning. J. Phys. Conf. Ser. 2016, 754, 92009. [Google Scholar] [CrossRef]
  19. Mortstock, K.; Wilkinson, M. Data mining to reduce risk and better predict P90 performance. In Proceedings of the Wind Europe 2017, Wind Europe Conference 2017, Amsterdam, The Netherlands, 28–30 November 2017. [Google Scholar]
  20. Okumoto, H.; Kato, H.; Niijima, K. Failure rate and downtime analysis for wind turbine by using failure and accident survey. In Proceedings of the 15th World Wind Energy Conference and Exhibition, Tokyo, Japan, 31 October–1 November 2016; pp. 1–4. [Google Scholar]
  21. Ministry of Economy, Trade and Industry. Feed-In Tariff Scheme in Japan. 2010. Available online: https://www.meti.go.jp/english/policy/energy_environment/renewable/pdf/summary201207.pdf (accessed on 28 May 2021). (In Japanese).
  22. Committee for Procurement Price. Annual Report from Calculation Committee for Procurement Price. 2012–2021. Available online: https://www.meti.go.jp/shingikai/santeii/ (accessed on 28 May 2021). (In Japanese).
  23. Kikuchi, Y.; Saito, R.; Ishihara, T. Assessment of levelized cost of energy for wind energy based on reliability analysis. J. Wind Energy 2019, 43, 1–12. (In Japanese) [Google Scholar] [CrossRef]
  24. Wind Power Equipment and Installation Results in Japan, NEDO. Available online: https://www.nedo.go.jp/library/fuuryoku/pdf/05_kaigai_kokusan_dounyuu_suii.pdf (accessed on 28 May 2021). (In Japanese).
  25. Takagi, K. Towards the availability improvement of wind farm. In Proceedings of the 38th Wind Energy Symposium 2018, Tokyo, Japan, 30 November–1 December 2018. (In Japanese). [Google Scholar]
  26. Department of Hokkaido Industrial Safety and Inspection of Ministry of Economy, Trade and Industry. Current Status and Challenges of Wind Power in Hokkaido 2013–2015; Available online: https://www.safety-hokkaido.meti.go.jp/denki_hoan/h30fy_wp_enq/index.htm (accessed on 28 May 2021). (In Japanese)
  27. New Energy and Industrial Technology Development Organization, NeoWins. Available online: https://appwdc1.infoc.nedo.go.jp/Nedo_Webgis/top.html (accessed on 28 May 2021).
  28. Wiser, R.; Jenni, K.; Seel, J.; Baker, E.; Hand, M.; Lantz, E.; Smith, A. Forecasting Wind Energy Costs & Cost Drivers. IEA Wind 2016, LBNL-1005717. Available online: https://eta-publications.lbl.gov/sites/default/files/lbnl-1005717.pdf (accessed on 28 May 2021).
Figure 1. Comparison of (a) normalized failure rate and (b) normalized downtime between NEDO, Reliawind and WMEP databases.
Energies 14 03528 g001
Figure 2. Comparison of (a) failure rate and (b) downtime between 1997–2014 and 2011–2014 NEDO databases.
Energies 14 03528 g002
Figure 3. Comparison of FTC occurrence rate between NEDO and Reliawind databases.
Energies 14 03528 g003
Figure 4. Comparison of downtime between NEDO and Reliawind databases.
Energies 14 03528 g004
Figure 5. Downtime of each FTC for the baseline case and three scenarios.
Energies 14 03528 g005
Figure 6. Predicted LCOE for baseline case, three scenarios and the target for 2030.
Energies 14 03528 g006
Figure 7. Probability density distribution of CAPEX.
Energies 14 03528 g007
Figure 8. Cumulative distribution of downtime for rotor and control systems.
Energies 14 03528 g008
Figure 9. Cumulative distribution of repair cost for rotor and control systems.
Energies 14 03528 g009
Figure 10. Cumulative distribution of downtime for Scenario 1.
Energies 14 03528 g010
Figure 11. Cumulative distribution of downtime for Scenario 2.
Energies 14 03528 g011
Figure 12. Comparison of predicted probability density distribution for each scenario.
Energies 14 03528 g012
Table 1. Description of NEDO failure database.
ItemSub-Item
Wind farmLocation, Turbine type, Operating start day
Failure dataAssembly, Event, Occurrence data, Root cause, Countermeasure
DowntimeWritten question (1 h resolution)
Repair costMultiple choice questions in 8 Categories
1: 0~500,000 Yen (0–3846 Euro)
2: 500,000–2,000,000 Yen (3846–15,385 Euro)
3: 2,000,000–5,000,000 Yen (15,385–38,462 Euro)
4: 5,000,000–10,000,000 Yen (38,462–76,923 Euro)
5: 10,000,000–20,000,000 Yen (76,932–153,846 Euro)
6: 20,000,000–50,000,000 Yen (153,846–384,615 Euro)
7: 50,000,000–100,000,000 Yen (384,615–769,231 Euro)
8: 100,000,000 Yen–(769,231 Euro–)
Table 2. Description of characteristics in each database.
NEDOReliawindWMEP
Collection period2014–20182008–20111999–2006
Years of operation<20 years2–4 years<17 years
Number of turbines7803501593
Rotational speedFixed/VariableVariableFixed/Variable
ControlStall/PitchPitchStall/Pitch
DrivetrainGeared/DirectGearedGeared/Direct
Collection methodQuestionnaireSCADA, O&M reports
Automated fault-log
SCADA,
Questionnaire
Table 3. Conversion of taxonomy used for data collection from Reliawind and NEDO database to RDS-PP.
RDS-PP TaxonomyReliawind AssemblyNEDO Assembly
Rotor systemBlade, Hub, Hub coverBlade, Hub
DrivetrainDrivetrain moduleGearbox, Main shaft/main bearing
GeneratorGenerator assemblyGenerator
Hydraulic systemHydraulic systemHydraulic system, Pitch system
Yaw gearboxYaw systemYaw system
Control and protection systemControl & communication system, Nacelle sensors, CMS, Auxiliary, Wind farmElectrical system
Table 4. Description of each FTC for NEDO failure database.
No.AssemblyDescription of FailureDTRCFTC [17]
1BladeMinor repair211402
2Surface repair7803404
3Failure in blade bearing6824646
4Failure in blade2724303214
5HubMinor repair21422
6Misalignment of generator iron core266763
7Major failure inside of hub1517593813
8GearboxMinor repair211452
9Failure in oil pump motor267726
10Failure in medium speed shaft gear9434196
11Major failure in medium speed shaft1299138814
12Main shaft/main bearingMinor repair21952
13Failure in pump motor263156
14Misalignment of main shaft/Failure in clutch disk181018136
15Failure in main bearing1410491714
16GeneratorMinor repair212572
17Minor failure in generator5952346
18Major failure in generator1179198212
19Pitch systemMinor repair21942
20Malfunction of pitch cylinder292914
21Electrical systemMinor repair211552
22Defective converter panel controller3101194
23Failure in IGBT2896098
24Hydraulic systemMinor repair211342
25Hydraulic cylinder319834
26Yaw systemMinor repair212852
27Break in bolt on yaw gear3231466
Table 5. Description of cost reduction scenarios in Japan.
Scenario NumberScenario DescriptionEvidence
BaselineCurrent failure rates and downtimeBased on NEDO database in Section 2.1
Scenario 1Prepare spare parts in the country
Reduce the logistic downtime to 72 h for minor failure modes (FTC 2,3,4).
Based on the industry practice [23], which states that logistic downtimes of yaw control and hydraulic were 143 days and 130 days without spares, but 3 days and 1 day with spares.
Scenario 2Install a condition monitoring system
Reduce the downtime to 10 days for major failure mode
Based on the industry report [25], which states that downtime of large assebly was reduced from 25 days to 10 days using condition monitoring system.
Scenario 3Reduce the repair time due to industry maturityUse a learning rate of 18.6% [28]
Table 6. Predicted availability for each scenario in Japan.
BaselineScenario 1Scenario 2Scenario 3
Downtime(hours)970501261181
Scheduled downtime(hours)135135135135
Total downtime(hours)1,105636396316
Availability(%)87.492.795.596.4
Table 7. LCOE parameters in Japan.
AverageReference
CAPEX282,000 Yen/kW[2]
FCR6.12%Identified
OPEX9300 Yen/kW[2]
C r e p a i r 2300 Yen/kWIdentified
C l a b o r 4500 Yen/kW[2]
C o t h e r 2500 Yen/kW[2]
Capacity Factor22%[2]
T d o w n t i m e 970 h/turbineIdentified
T s c h e d u l e d 135 h/turbine[26]
Availability87%[2]
Levelized Cost of Energy13.9 Yen/kWh[2]
Table 8. Predicted LCOE for each scenario in Japan.
BaselineScenario 1Scenario 2Scenario 3Target for 2030
CAPEX(Yen/kW)282,000230,180
FCR(%)6.126.12
OPEX(Yen/kW)93007124601156404603
T d o w n t i m e (Hour)970501261181181
T s c h e d u l e d (Hour)135135135135135
Availability(%)87.492.795.596.496.4
Capacity factor(%)22.123.524.224.424.4
Average of LCOE(Yen/kWh)13.711.911.010.78.7
Reduction(Yen/kWh)−1.9−0.9−0.3−2.0
Table 9. Predicted P50 and P90 for each scenario.
P50
Yen/kWh
P90
Yen/kWh
P90/P50
Baseline12.5223.861.91
Scenario 111.1415.291.37
Scenario 210.5314.101.34
Scenario 310.3613.911.34
Publisher’s Note: MDPI stays neutral with regard to jurisdictional claims in published maps and institutional affiliations.

